Back to Journals » Journal of Hepatocellular Carcinoma » Volume 13
Angiogenic Prognostic Signature for Stratification in Hepatocellular Carcinoma
Authors Zhu Z, Guo C, Shen H ![]() , Zeng S, Li N
, Zeng S, Li N
Received 12 February 2026
Accepted for publication 11 June 2026
Published 20 June 2026 Volume 2026:13 600117
DOI https://doi.org/10.2147/JHC.S600117
Checked for plagiarism Yes
Review by Single anonymous peer review
Peer reviewer comments 2
Editor who approved publication: Professor Toshihiro Tanaka
Zhanwei Zhu,1,2 Cao Guo,2 Hong Shen,2 Shan Zeng,3 Namei Li1,4
1Department of Pathology, The Second Xiangya Hospital, Central South University, Changsha, Hunan, People’s Republic of China; 2National Clinical Research Center for Geriatric Disorders, Xiangya Hospital, Central South University, Changsha, Hunan, People’s Republic of China; 3Department of Oncology, Xiangya Hospital, Central South University, Changsha, Hunan, People’s Republic of China; 4Hunan Clinical Medical Research Center for Cancer Pathogenic Genes Testing and Diagnosis, Changsha, Human, 410011, People’s Republic of China
Correspondence: Namei Li, Department of Pathology, The Second Xiangya Hospital, Central South University, Changsha, Hunan, 410011, People’s Republic of China, Email [email protected]
Background: Hepatocellular carcinoma (HCC) is a leading cause of cancer-related mortality. Angiogenesis drives HCC progression, but reliable biomarkers remain limited.
Methods: We analyzed angiogenesis‑related genes (ARGs) using TCGA data, constructed a prognostic signature via LASSO‑Cox regression, and validated it in ICGC and real‑world HCC cohorts. Functional experiments (in vitro and in vivo) were performed for Secretory phosphoprotein 1 (SPP1). Single‑cell RNA‑seq data mapped cellular sources of signature genes. Drug sensitivity (GDSC2) and sorafenib‑treated GEO data assessed therapy response.
Results: A four-gene ARG signature (APOH, SLCO2A1, SPP1, VTN) stratified HCC patients into high- and low-risk groups with distinct survival, validated in external cohorts. The high‑risk group showed enriched immune checkpoint expression and stromal activity. Single‑cell analysis revealed SPP1 mainly from macrophages and hepatocytes; VTN, APOH, and SLCO2A1 from monocyte/macrophage subsets. SPP1 knockdown suppressed endothelial angiogenesis in vitro and in vivo. High‑risk patients exhibited reduced sorafenib sensitivity (higher IC50), and sorafenib treatment downregulated APOH, SPP1, and VTN but not SLCO2A1.
Conclusion: We established a robust ARG‑based prognostic signature for HCC that improves risk stratification and highlights links between angiogenesis, immune microenvironment, and drug response.
Keywords: hepatocellular carcinoma, angiogenesis, angiogenesis-related genes, prognostic signature, tumor microenvironment, SPP1
Introduction
Hepatocellular carcinoma (HCC) is the sixth most common malignancy and the third leading cause of cancer-related deaths worldwide.1 Basic research in HCC has gained critical importance, given limited therapeutic advances and persistently poor patient prognosis over the past decade.2 Angiogenesis represents a fundamental requirement for tumor progression.3 During early tumorigenesis, HCC exists as avascular tumor cell clusters in a histologically “dormant” state, relying primarily on passive diffusion for oxygen, nutrient, and growth factor acquisition.4–6 Subsequent tumor progression is strictly dependent on angiogenic capacity. Folkman posits that the transition to aggressive tumor growth requires initiation of sustained neovascularization, evidenced by robust angiogenic activity in rapidly proliferating tumors versus its absence in dormant lesions.7 Subsequently, accelerated development of anti-angiogenic agents and therapeutic strategies has revolutionized clinical paradigms, providing critical mechanistic insights for tumor interception and treatment.8,9
HCC, a hypervascular solid tumor, exhibits pronounced dependence on angiogenesis for progression. Notably, angiogenesis-targeting agents constitute the cornerstone of current first- and second-line therapies for advanced HCC, such as tyrosine kinase inhibitors including sorafenib, Lenvatinib and Regorafenib.10 However, therapies developed against currently identified angiogenic targets also suffer from the disadvantage of drug resistance.11 The development of new and effective molecular targets provides additional options for early diagnosis and therapy approaches, as well as additional clinical benefits for HCC patients.
In this study, we identified angiogenic molecules from multiple clinical databases that have an important impact on HCC patients through a variety of biological methods and established prognostic models to fully explore their roles in the prognosis of HCC and provide new ideas for the diagnosis and treatment of HCC.
Materials and Methods
Data Source
The prognostic model for HCC angiogenesis‑related genes (ARGs) was trained using transcriptomic data from The Cancer Genome Atlas (TCGA-LIHC cohort; n=347 HCC patients). External validation employed an independent cohort from the International Cancer Genome Consortium (ICGC-LIRI-JP; n=203 HCC patients). Both datasets encompassed comprehensively annotated transcriptomic profiles and clinicopathological parameters. The 36 Hallmark ARGs were acquired from the Molecular Signatures Database (MSigDB) via the Gene Set Enrichment Analysis (GSEA) portal.
Analysis of the relationship between drug sensitivity and four ARGs utilized chip data derived from HCC samples accessible via the GEO database (GSE109211, n=140, https://www.ncbi.nlm.nih.gov/geo/). The data were normalized using the function normalizeBetweenArrays from the limma package, and then the data is transformed by taking log2 to get the full expression matrix.
A cohort of 120 HCC specimens was procured from residual tumor tissues of patients treated at Xiangya Hospital, Central South University. All samples underwent independent histopathological validation.
Data Process
Normalization of Raw Data
Raw TCGA transcriptome data for HCC were normalized using the DESeq2 R package. ICGC patient transcriptome and clinicopathological data were processed using Perl and R. Box plots of ARG expression were generated using the ggpubr package. Heatmaps were plotted using the heatmap package. Protein–protein interaction (PPI) networks and Pearson correlation plots of the ARGs were constructed with the reshape2 and corrplot packages.
GO and KEGG Analyses
Gene Ontology (GO) and Kyoto Encyclopedia of Genes and Genomes (KEGG) functional enrichment analyses of angiogenesis-related genes were performed with the ClusterProfiler R package.
Cluster Analysis
Patients with HCC in TCGA were clustered based on 26 ARGs using the ConsensusClusterPlus R package. The optimal number of clusters was determined by the cumulative distribution function (CDF) index.
Gene Set Variation Analysis
Gene set variation analysis (GSVA), an unsupervised non-parametric method, was used to systematically investigate pathway enrichment of differentially expressed genes (DEGs) across distinct molecular clusters.
ESTIMATE Analysis of the Immune Microenvironment Among Different Clusters
Stromal, immune, and tumor purity scores were compared between Cluster 1 and Cluster 2 using the ESTIMATE R package. Concurrently, inhibitory and activating immune regulators were systematically profiled to delineate immunomodulatory divergence between the two clusters.
Single-Sample Gene Set Enrichment Analysis (ssGSEA)
Differences in immune cell infiltration between the two clusters were assessed using ssGSEA.
Construction of the ARG-Based Prognostic Risk Model
The intersection of the 36 Hallmark ARGs with DEGs from TCGA-HCC yielded 26 significantly dysregulated ARGs. Univariate Cox regression identified nine prognosis-associated ARGs among TCGA liver cancer patients. LASSO regression further selected four ARGs for model construction. Patients were stratified into high- and low-risk groups based on LASSO-derived risk scores, and corresponding survival curves were generated. This prognostic signature was externally validated in the ICGC dataset. Finally, univariate and multivariate Cox proportional hazards analyses confirmed the independent prognostic value of the risk model.
Single-Cell RNA-Seq Analysis
Single-cell RNA sequencing data from five HCC patients at Xiangya Hospital, Central South University were processed and analyzed using the Seurat package (version 5.3.0) in R. Quality control filtering was first performed to exclude cells expressing fewer than 200 or more than 10,000 genes, or those with mitochondrial gene content exceeding 10% (with 5–10% being the typical viable threshold). The FindVariableFeatures function was applied to identify the top 2000 highly variable genes for downstream analysis. Principal component analysis (PCA) was then conducted using the RunPCA function. Batch effects across samples were corrected using the Harmony algorithm.
Using the first 20 principal components, cell clustering was performed with the FindNeighbors and FindClusters functions at a resolution of 0.3. UMAP was employed for dimensionality reduction and visualization of cell clusters. Cell types were manually annotated using the CellMarker 2.0 database (http://117.50.127.228/CellMarker/)12,13 and relevant literature, and the expression distribution of SPP1, SLCO2A1, VTN, and APOH across the identified cell types was determined.
Pharmacosensitivity Profiling
Pharmacosensitivity profiling was conducted utilizing the Genomics of Drug Sensitivity in Cancer 2 (GDSC2) database (https://www.cancerrxgene.org/). The risk signature derived from four LASSO-identified genes (SPP1, SLCO2A1, VTN, and APOH) were subjected to computational pharmacology interrogation via the oncoPredict R package. This analysis delineated the therapeutic vulnerability landscape associated with the prognostic gene signature across 198 FDA-approved compounds.
Protein Analysis of Drug Targets and Molecular Docking
The 3D structure of sorafenib (PubChem CID: 216239) was downloaded from the PubChem Compound database (https://pubchem.ncbi.nlm.nih.gov/). Canonical protein structures for four target proteins - APOH (IDENTIFIER:1C1Z), SPP1 (IDENTIFIER: 3CXD), VTN (IDENTIFIER: 1OC0), and SLCO2A1 (IDENTIFIER: 3MMR) - were acquired from UniProt (https://www.uniprot.org/). Molecular docking analyses were performed using CB-Dock2 (https://cadd.labshare.cn/cb-dock2/) to investigate sorafenib-target binding modes and determine optimal protein binding sites.
Analysis of the Relationship Between Sorafenib Sensitivity and the Four-ARG
Transcriptomic profiles from 214 HCC specimens were retrieved from the GEO database (GSE109211). Expression data for sorafenib responders and non-responders were extracted, and the expression levels of APOH, VTN, SLCO2A1, and SPP1 were compared between the two groups.
Cell Culture
Human umbilical vein endothelial cells (HUVECs) were maintained in endothelial cell growth medium (Procell, Cat. no. CM-H082). Hepatocellular carcinoma (HCC) cell lines-Huh1, HepG2, Hep3B, LM3, and Huh7-were cultured in high-glucose Dulbecco’s Modified Eagle Medium (DMEM) or Minimum Essential Medium (MEM) as appropriate. The immortalized normal hepatocyte line THLE-2 was cultured in a specialized medium (Procell, Cat. no. CL-0833). All cell lines were acquired from Procell Life Science & Technology Co., Ltd. (Wuhan, China) and incubated in a humidified incubator at 37°C with 5% CO2.
Immunohistochemistry (IHC)
HCC tissue microarrays were sliced in 4 μm serial sections, then dewaxed and rehydrated in a gradient in ethanol. The IHC steps followed standard protocols, and the kit used was the Mouse/Rabbit Enhanced Polymer Assay Detection System (Cat. no.PV-9000, ZSGB-BIO). Antibodies used were as follows: VTN (Cat. no. 66398-1-Ig, Proteintech; 1: 300); SLCO2A1 (Cat no. 14327-1-AP, Proteintech, China; 1: 200); APOH (Cat. no. 66074-1-Ig, Proteintech, China; 1: 100); SPP1 (Cat no. AF0227, Affinity, China; 1: 100); CD31 (Cat. no. 347526, ZENBIO, China; 1: 200); Ki-67 (Cat. no. AF0198, Affinity, China; 1: 200). PBS instead of primary antibody treatment was selected as a negative control for each indicator. Each staining factor was evaluated according to defined criteria.
RNAi (RNA Interference)
The canonical coding sequence of SPP1 (RefSeq accession: NM_000582.3) and SLCO2A1 (NM_005630.3) was acquired from GenBank in FASTA format. Computational siRNA design was subsequently executed via siDirect 2.0 (https://sidirect2.rnai.jp/) under stringent parameters. Candidate sequences underwent rigorous BLASTn analysis. Three siRNA constructs demonstrating maximal target specificity were synthesized by Sangon Biotech (Shanghai). A scrambled non-targeting siRNA (si-NC) served as the negative control. The sequences of SPP1 and SLCO2A1 siRNA are listed in Table 1.
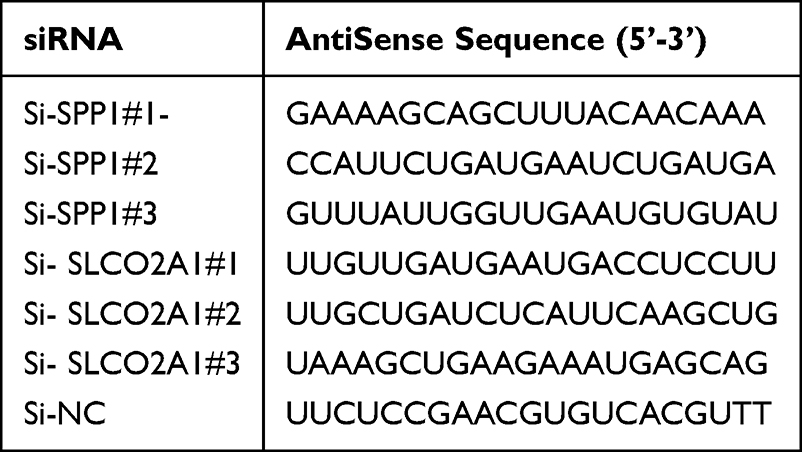 |
Table 1 Optimized siRNA Constructs Targeting Human SPP1 (NM_000582.3) and Human SLCO2A1 (NM_005630.3) |
HCC cell lines (HepG2 and Huh7) were seeded at a density of 1×10⁵ cells/well in 6-well plates. Transfection was initiated at 70% confluency using Lipofectamine™ 3000 (Invitrogen, USA; Cat. no. L3000015) in strict accordance with manufacturer’s specifications. Preliminary functional screening identified the si-SPP1#1 and si-SLCO2A1#2 constructs as exhibiting superior knockdown efficiency (>85% transcript reduction), warranting their selection for subsequent mechanistic investigations.
We used a lentiviral system for stable SPP1 knockdown. Briefly, shRNAs against SPP1 or a non-targeting control were synthesized and inserted into the pHBLV-U6-MCS-PGK-PURO vector (Hanbio Biotechnology, Shanghai, China). HCC cells were infected with the resulting lentiviruses. After selection with 1 μg/mL puromycin, resistant cells were pooled. Knockdown efficiency was verified by Western blot analysis.
Western Blot Analysis
HepG2 and Huh7 cells were lysed in RIPA buffer containing protease inhibitors, briefly sonicated, and centrifuged at 10,000 × g for 10 min at 4°C. Protein concentrations were determined by BCA assay. Equal amounts of protein (40 μg) were denatured, separated by 10% SDS-PAGE, and transferred to PVDF membranes. Membranes were blocked with 5% non-fat dry milk in TBST for 1 h at room temperature, then incubated overnight at 4°C with primary antibodies. After washing, membranes were incubated with HRP-conjugated secondary antibodies (1:2000) for 1 h. Protein bands were visualized using ECL and imaged on a ChemiDoc MP system. Band intensities were quantified with ImageLab 6.1 and normalized to GAPDH (The raw Western blot images are shown in Supplementary Figure S1).
Angiogenesis Assay
Conditioned medium (CM) was prepared by culturing cells at 60% confluency in serum-free DMEM for 24 h. The supernatant was harvested as CM. Matrix collagen solution (Cat. no. 082706, ABWBio) was thawed on ice, added to 48-well plates (150 μL/well), and allowed to polymerize at 37°C for 30 min. HUVECs were serum-starved for 8 h, washed with PBS, trypsinized, and resuspended in CM at 2 × 10⁶ cells/mL. Cell suspension (200 μL) was seeded into each well, with duplicate wells per condition. Tube formation was imaged at 4, 6, 8, and 12 h using an inverted microscope. Capillary length was quantified with the Angiogenesis Analyzer plugin in ImageJ (version 1.8.0.345).
HUVEC Cell Transwell
The upper surface of Transwell inserts was coated with diluted Matrigel and incubated at 37°C to allow gelation. CM containing FBS (600 μL) was added to the lower chamber. HUVECs were serum-starved for 12 h, trypsinized, and resuspended in serum-free medium. A total of 1 × 10⁴ cells were seeded into the upper chamber. After 24 h, non-invading cells on the upper membrane surface were gently removed with a cotton swab. Invaded cells were fixed in 4% paraformaldehyde for 15 min, stained with crystal violet for 10 min, and counted in three random fields under an inverted microscope.
Xenograft Tumors
Subcutaneous xenograft tumors were established in nude mice by inoculating HepG2 cells with stable SPP1 knockdown. Tumor volumes were monitored, and the expression of SPP1, CD31, and Ki-67 was assessed by IHC.
Statistical Analysis
Graphical presentation was performed using GraphPad Prism software (Version 9.5.1).
Statistical significance was determined using the following tests: Student’s t-test (two-tailed) for comparisons between two groups; Chi-square test to assess the relationship between SPP1 expression and clinicopathological characteristics; Log rank test to compare differences in survival curves generated by the Kaplan–Meier method. In all analyses, a P value < 0.05 was considered statistically significant.
Results
Identification and Biological Function Analysis of Differentially Expressed ARGs
Given the critical role of angiogenesis in HCC, we extracted 36 ARGs from the MSigDB Hallmark Angiogenesis gene set. Differential expression analysis using RNA‑seq data from the TCGA HCC cohort (374 tumor vs 50 normal liver tissues) identified 26 significantly dysregulated ARGs (P < 0.05; Figure 1A and B). GO enrichment analysis revealed that these ARGs were associated with cellular components such as the vessel lumen and collagen‑containing extracellular matrix; molecular functions including heparin binding, sulfur compound binding, signaling receptor activator activity, and growth factor binding; and biological processes such as blood coagulation, extracellular matrix organization, and regulation of wound healing (Figure 1C). KEGG pathway analysis further showed significant enrichment in focal adhesion, the PI3K‑Akt signaling pathway, proteoglycans in cancer, and regulation of actin cytoskeleton (Figure 1C). A protein–protein interaction network was constructed and visualized in Cytoscape, demonstrating extensive interactions among most of these genes (Figure 1D and E).
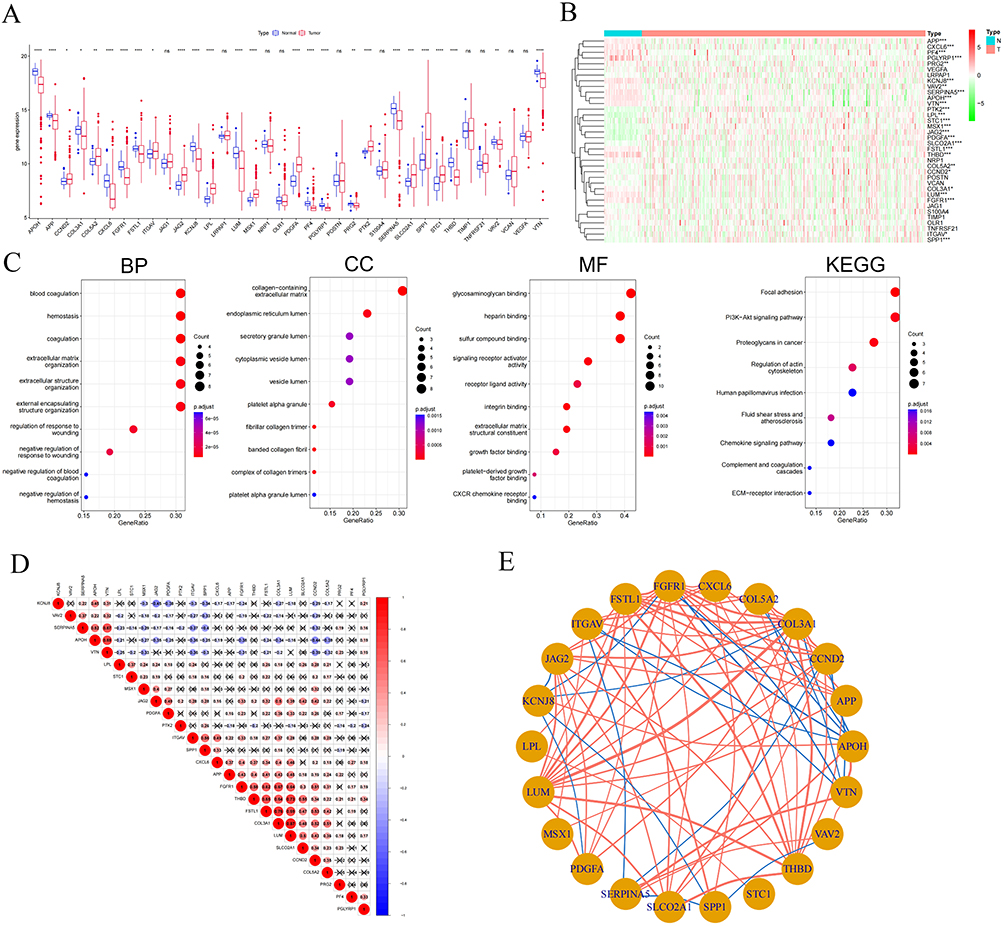 |
Figure 1 Identification and biological function analysis of differentially angiogenesis-related genes (ARGs). (A and B) Expression profiles of the 36 ARGs in the TCGA-HCC dataset, depicted via a bar plot and a heatmap showing hierarchical clustering; (C) GO enrichment analysis characterized the DEGs across molecular functions (MF), biological processes (BP), and cellular components (CC), while KEGG pathway analysis delineated significantly enriched signaling pathways. (D) Pairwise correlations among the 26 ARGs were quantified using Pearson correlation analysis. P < 0.001 indicates significant correlation. Red: positive; Blue: negative. P > 0.001: not significant (cross symbols). (E) A protein-protein interaction (PPI) network was constructed for these 26 ARGs and topologically visualized using Cytoscape. Statistical significance denoted as: ns, not significant P > 0.05; *: P < 0.05; **: P < 0.01; ***: P < 0.001; ****: P <0.0001. |
Identification of 26 ARGs Between Clusters and the Tumor Immune Microenvironment
To validate the clinical prognostic utility of the 26 ARGs, we employed the ConsensusClusterPlus R package to stratify TCGA-HCC patients. The Cumulative Distribution Function (CDF) and consensus matrices demonstrated optimal clustering stability at k = 2 (Figures 2A–C). Kaplan-Meier analysis revealed significantly prolonged survival in Cluster 1 versus Cluster 2 (log-rank P = 0.01; Figure 2D). Consistently, heatmap and Sankey diagram analyses indicated that Cluster 2 correlated with adverse clinicopathological features, including advanced tumor stage and grade (Figure 2E and F). KEGG enrichment analysis showed that Cluster1 was enriched in immune/inflammatory pathways, and Cluster2 in cancer, cardiomyopathy, infection, and metabolic pathways (Figure 2G).
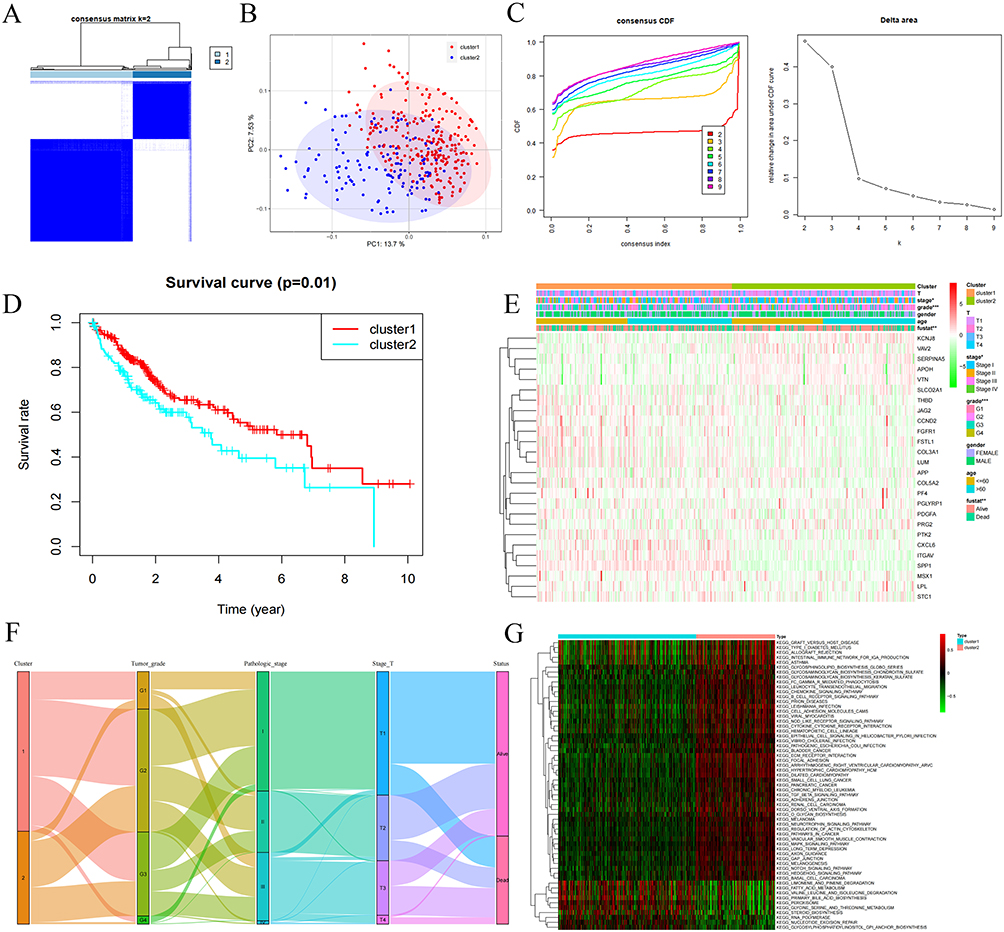 |
Figure 2 Identification of Angiogenic Subtypes in HCC. (A) Consensus Clustering Analysis of HCC Patients Based on 26 Angiogenesis-Related Genes when k=2. (B) Relative alterations in the area under CDF curve when k=2-9. (C) Principal Component Analysis Revealed Two Distinct Clusters in Hepatocellular Carcinoma Patients (D) Kaplan–Meier curve for overall survival of different clusters (Log rank test). (E) Association Analysis Between Angiogenesis Subtypes and Clinical Characteristics in a HCC Cohort (Age, Gender, Stage, Grade, Survival Status) (F) The Sankey diagram showing the relationships between C1 and C2 clusters, including stage Tumor grade, Pathologic stage, Stage T and live status. (G) The heatmap visualizes enrichment levels of gene variant sets across two distinct Cluster. *: P < 0.05; **: P < 0.01; ***: P < 0.001 for Cluster 1 vs Cluster 2. |
Given the critical role of tumor-infiltrating immune cells in HCC pathogenesis, we next evaluated inter-cluster differences in immune infiltration, immune checkpoint molecule expression, and the tumor microenvironment. Cluster 2 exhibited significantly greater immune cell infiltration-including macrophages, MHC class I-expressing cells, and regulatory T cells (Tregs)-compared to Cluster 1 (Figure 3B and C). However, Cluster 2 demonstrated elevated expression of inhibitory immune checkpoint molecules, including BTLA, CTLA4, PD-L1 (CD274), CD96, CSF1R, HAVCR2, IL-10, LGALS9, and TGFB (Figure 3A). This enhanced immunosuppressive signature likely contributes to the poorer prognosis observed in patients within Cluster 2. ESTIMATE analysis further revealed that Cluster 2 possessed higher immune and stromal scores, alongside reduced tumor purity (Figure 3D). Collectively, these findings indicate that the molecular classification based on these 26 ARGs is significantly associated with the immune microenvironment landscape in HCC.
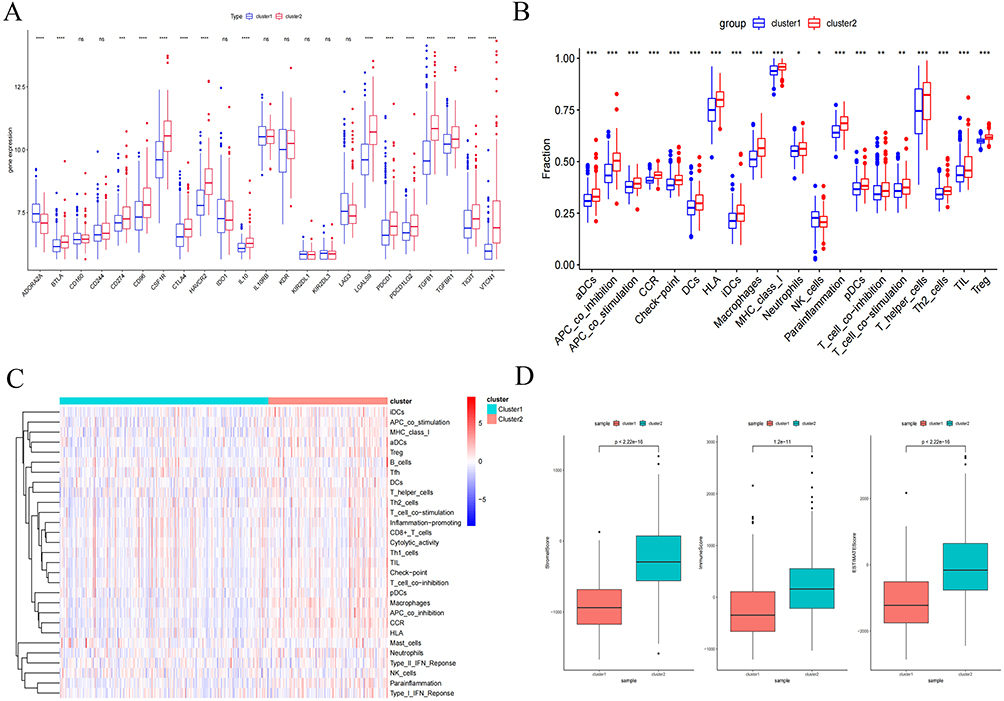 |
Figure 3 Identification of 26 ARGs Between Clusters and the Tumor Immune Microenvironment. (A) Box plots depicting mRNA expression levels of immune checkpoints in Cluster 1 versus Cluster 2. (B and C) Composite figure presenting ssGSEA-derived immune landscape profiles across clusters, integrating box plots and hierarchical clustering heatmap. (D) Comparative analysis of tumor microenvironment scores (Stromal, Immune, and ESTIMATE) between Cluster 1 and Cluster 2. Statistical significance denoted as: ns, not significant P > 0.05; *: P < 0.05; **: P < 0.01; ***: P < 0.001; ****: P <0.0001. |
Construction of Angiogenesis -Related Signature
Univariate Cox regression analysis of the 26 ARGs identified nine prognostic ARGs. Subsequent LASSO regression refined this signature to four core genes: APOH, SLCO2A1, SPP1, and VTN (Figure 4A and B). To validate their role in HCC, TCGA-HCC patients were stratified into high- and low-risk groups based on LASSO-derived risk scores. The clinical Sankey diagram showed that most patients in Cluster1 were at low risk and ultimately survived, whereas most patients in Cluster2 were at high risk and had an outcome of death (Figure 4C). Univariate and multivariate Cox analyses confirmed the risk score as an independent prognostic factor for HCC (Figure 4D and E).
Figure 4 Construction of Angiogenesis -Related Signature. (A) Univariate Cox regression identifies ARG prognostic for overall survival. (B) LASSO regression with minimum lambda penalty selects four ARG. (C) Sankey diagram depicting interrelationships among molecular clusters (Cluster 1/2), LASSO-derived risk stratification, and survival status. (D and E) Univariate and multivariate analyses confirm the risk score as an independent prognostic factor in HCC. (F) Kaplan-Meier curves compare overall survival (OS) between high- and low-risk groups in TCGA (training cohort) and ICGC (validation cohort). (G) Time-dependent ROC curves for 1-, 2-, and 3-year OS predictions in TCGA and ICGC cohorts. (H) Distributions of survival status versus expression of four ARGs across cohorts. (I) Risk score distributions stratified by four ARGs expression patterns. (J) Differential expression of APOH, SLCO2A1, SPP1, and VTN between risk groups in TCGA cohort. (K) Validation of four ARGs gene expression disparities in ICGC cohort (box plots). Figure 4 continued.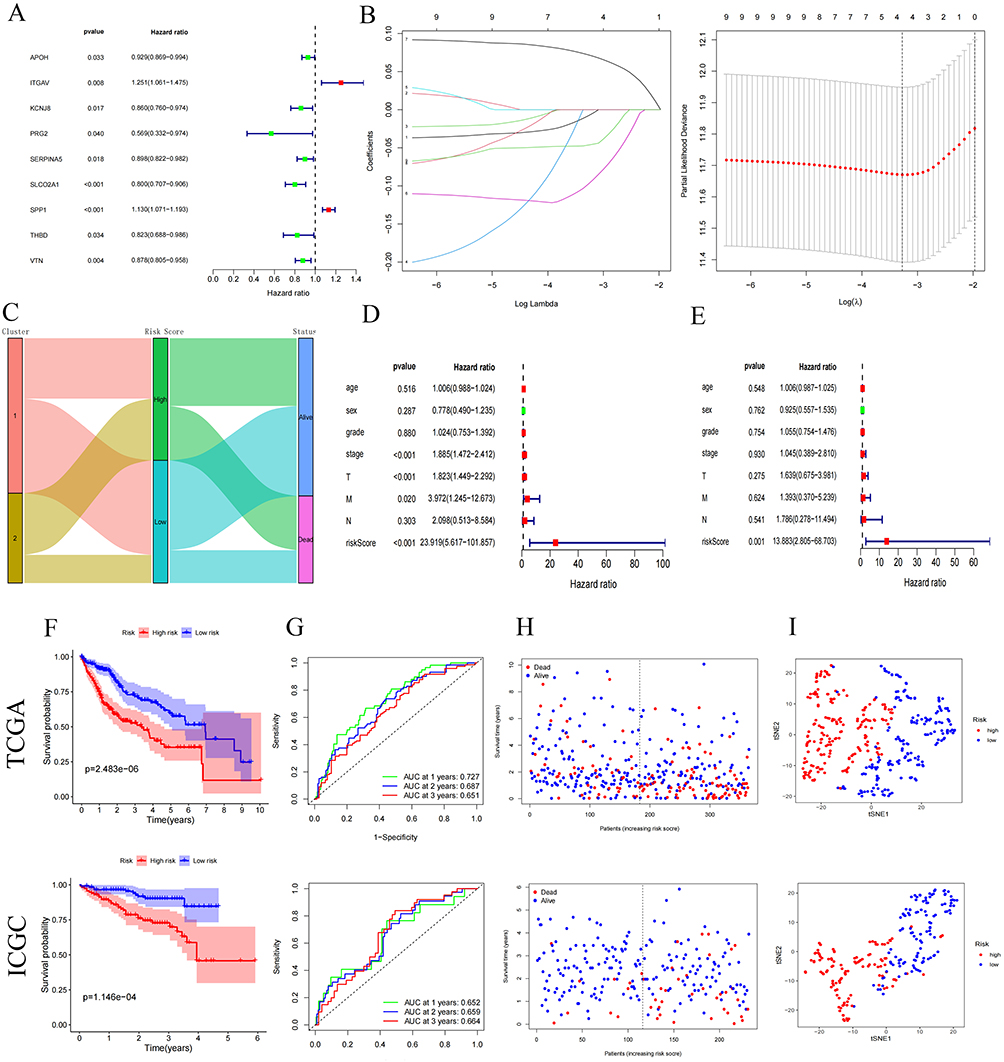
This four-ARG model was further validated in an independent ICGC cohort. High-risk patients exhibited markedly reduced survival (log-rank P < 0.05; Figure 4F). Time-dependent ROC analysis revealed AUC values of 0.727 (1-year), 0.687 (2-year), and 0.651 (3-year) in TCGA, and 0.652 (1-year), 0.659 (2-year), and 0.664 (3-year) in ICGC (Figures 4G–I). Consistent expression patterns were observed across both cohorts: SPP1 was upregulated in high-risk patients, while APOH, SLCO2A1, and VTN were downregulated (P < 0.05; Figure 4J and K). Collectively, the four-ARG prognostic model demonstrated robust predictive accuracy in both TCGA and independent ICGC validation cohorts.
Association of the Four ARGs with Immune Features and Prognosis in HCC Patients
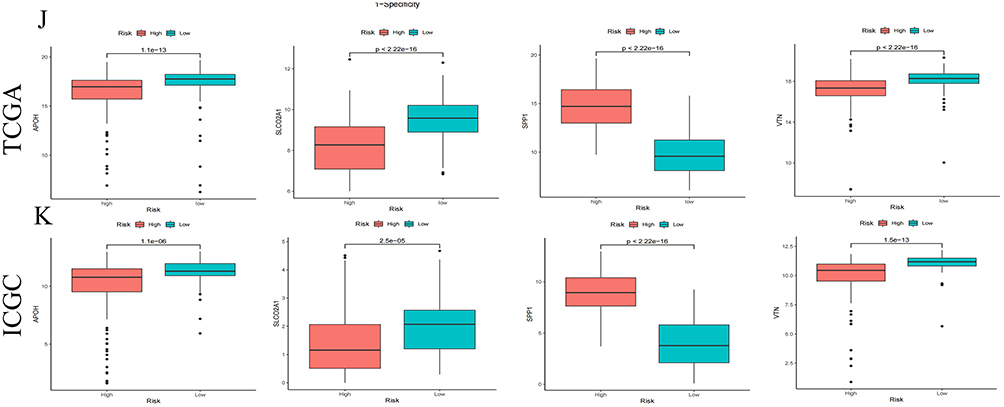
Given the robust predictive performance of APOH, SLCO2A1, SPP1, and VTN in HCC prognosis, we examined their associations with patient survival in the TCGA cohort. Elevated SPP1 expression correlated with significantly poorer survival, whereas high expression of APOH, SLCO2A1, and VTN was associated with improved outcomes (Figure 5A; all P < 0.05).
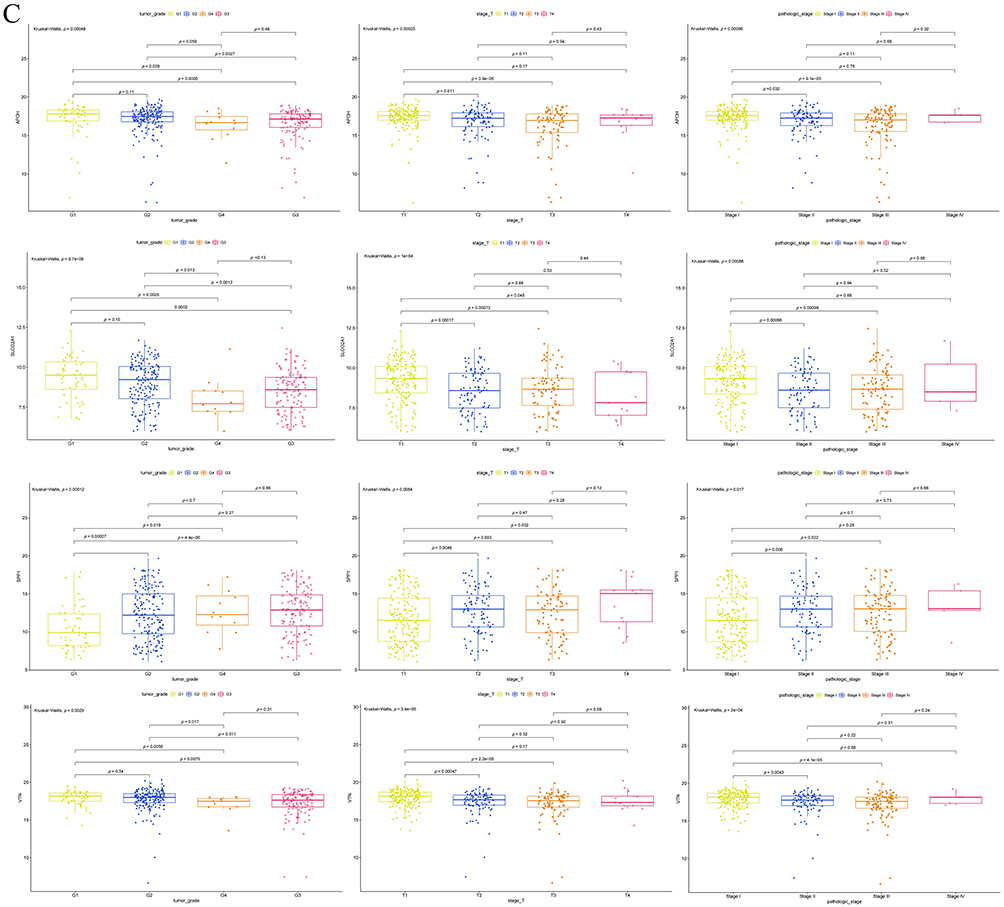
Figure 5 Validation of the biological roles of the ARGs. (A) Differential overall survival analysis with Kaplan-Meier curve visualization in TCGA cohort, stratified by high versus low expression groups of four ARG genes. (B) Correlational analysis between four angiogenesis-related genes (ARGs) and key immune checkpoint molecules. (C) Association of APOH, SLCO2A1, SPP1, and VTN expression levels with clinical characteristics: tumor grade, T stage, and pathological stage. Figure 5 continued.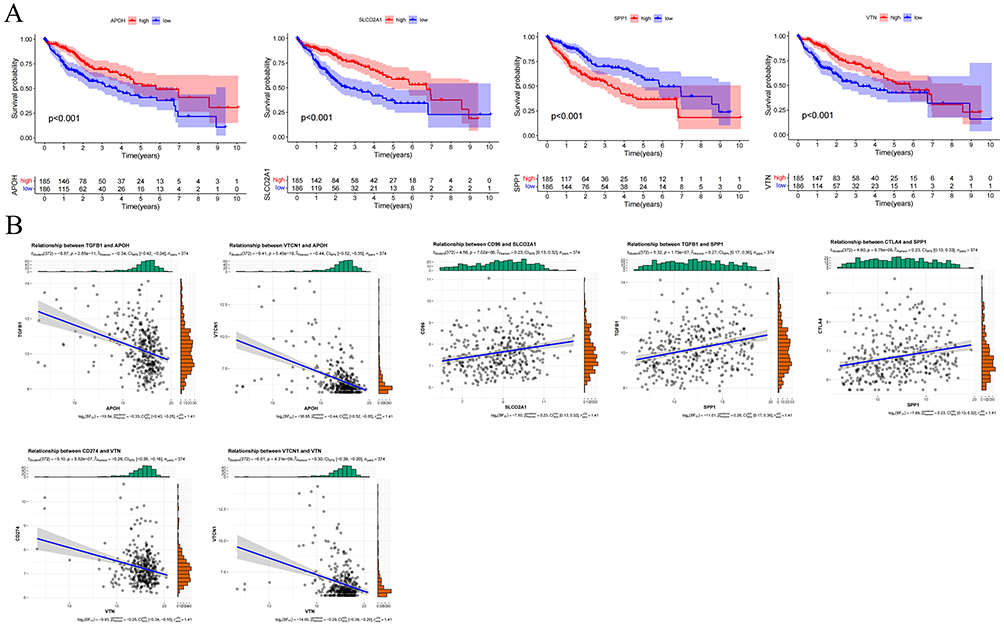
We further investigated relationships between these four ARGs and immune checkpoint molecules. As shown in Figure 5B, APOH exhibited negative correlations with TGFB1 (r = −0.34, P < 0.05) and VTCN1 (r = −0.44, P < 0.05). SLCO2A1 showed a positive correlation with CD96 (r = 0.23, P < 0.05). SPP1 demonstrated positive correlations with TGFB1 (r = 0.27, P < 0.05) and CTLA4 (r = 0.23, P < 0.05).
VTN displayed negative correlations with CD274 (r = −0.26, P < 0.05) and VTCN1 (r = −0.30, P < 0.05). Notably, expression of APOH, SLCO2A1, and VTN progressively decreased with advancing tumor grade, T stage, and pathological stage (P < 0.05, Figure 5C). Conversely, SPP1 expression significantly increased across these clinicopathological progression parameters (P < 0.05).
Single - Cell RNA Sequencing Reveals Specific Enrichment of SPP1, APOH, SLCO2A1, and VTN in HCC Cells
To characterize the expression profiles of SPP1, APOH, SLCO2A1, and VTN in HCC, we obtained and analyzed single-cell RNA sequencing data from five HCC patients at Xiangya Hospital, Central South University, yielding a total of 37,279 cells. Following principal component analysis and UMAP-based clustering, the cells were categorized into 20 distinct clusters (Figure 6A). Cell type annotation identified six major lineages: T cells, endothelial cells, hepatocytes, fibroblasts, myeloid cells, and B cells (Figure 6B). Comparative analysis revealed high abundance of T cells in three patients, elevated endothelial cell proportions in two patients, and relatively consistent myeloid cell fractions across all five patients (Figure 6C). UMAP visualization of gene expression demonstrated that SPP1 was predominantly expressed in myeloid cells and hepatocytes, while VTN and APOH were mainly localized to hepatocytes, and SLCO2A1 was primarily detected in endothelial cells (Figure 6D).
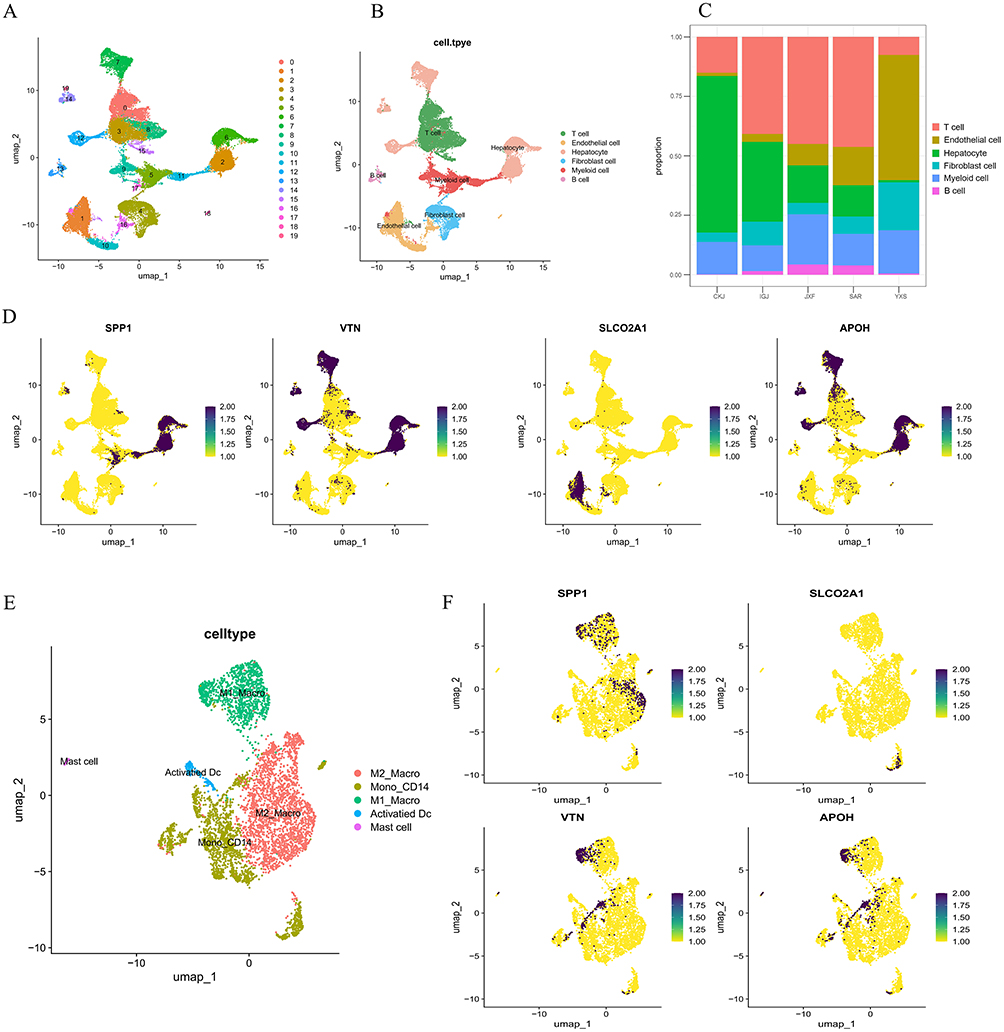 |
Figure 6 Single-cell RNA-seq Analysis. (A) PCA and UMAP clustering were used to classify cells into 20 distinct clusters. (B) The 20 clusters were annotated and categorized into six major cell groups. (C) Stacked bar plot showing the proportional distribution of T cells, endothelial cells, hepatocytes, myeloid cells, B cells, and fibroblasts across different HCC samples. (D) UMAP visualization illustrating the expression patterns of SPP1, APOH, and SLCO2A1 across various cell types. (E) Myeloid cells were extracted and re-embedded using UMAP, revealing five distinct myeloid subpopulations. (F) UMAP plots displaying the expression of target genes SPP1, APOH, SLCO2A1, and VTN within myeloid cell subpopulations. |
Myeloid cells were then subclustered for further analysis, resulting in their classification into M1 macrophages, CD14+ monocytes, M2 macrophages, activated dendritic cells, and mast cells (Figure 6E). Further investigation revealed that SPP1 was largely expressed in both M1 and M2 macrophages; VTN and APOH were detected in M1 macrophages and CD14+ monocytes; and SLCO2A1 was also present in CD14+ monocytes (Figure 6F).
Validation of the Biological Roles of the ARGs
We retrospectively collected 120 HCC and paired adjacent non-tumor tissues and constructed tissue microarrays (TMA) to examine the protein expression levels of APOH, SLCO2A1, SPP1, and VTN. As shown in Figure 7A, the expression levels of SPP1 and SLCO2A1 were significantly higher in HCC cancer tissues than in adjacent ones (P < 0.05, Figure 7A), and the expression of APOH and VTN was significantly lower in HCC cancer tissues than in adjacent ones (P < 0.05). Based on the protein expression levels and searching the literature, we finally identified SPP1 as the target for subsequent in vitro functional studies. An initial examination of the relationship between SPP1 expression and clinical characteristics in HCC patients showed that SPP1 levels were significantly associated with tumor differentiation, T stage, M stage, and pathologic stage (P < 0.05, Table 2). Consistent with this, Kaplan-Meier analysis demonstrated that HCC patients with high SPP1 expression had significantly adverse overall survival compared to those with low expression (Median OS: 39 vs. 47 months; log-rank P = 0.023; Figure 7B).
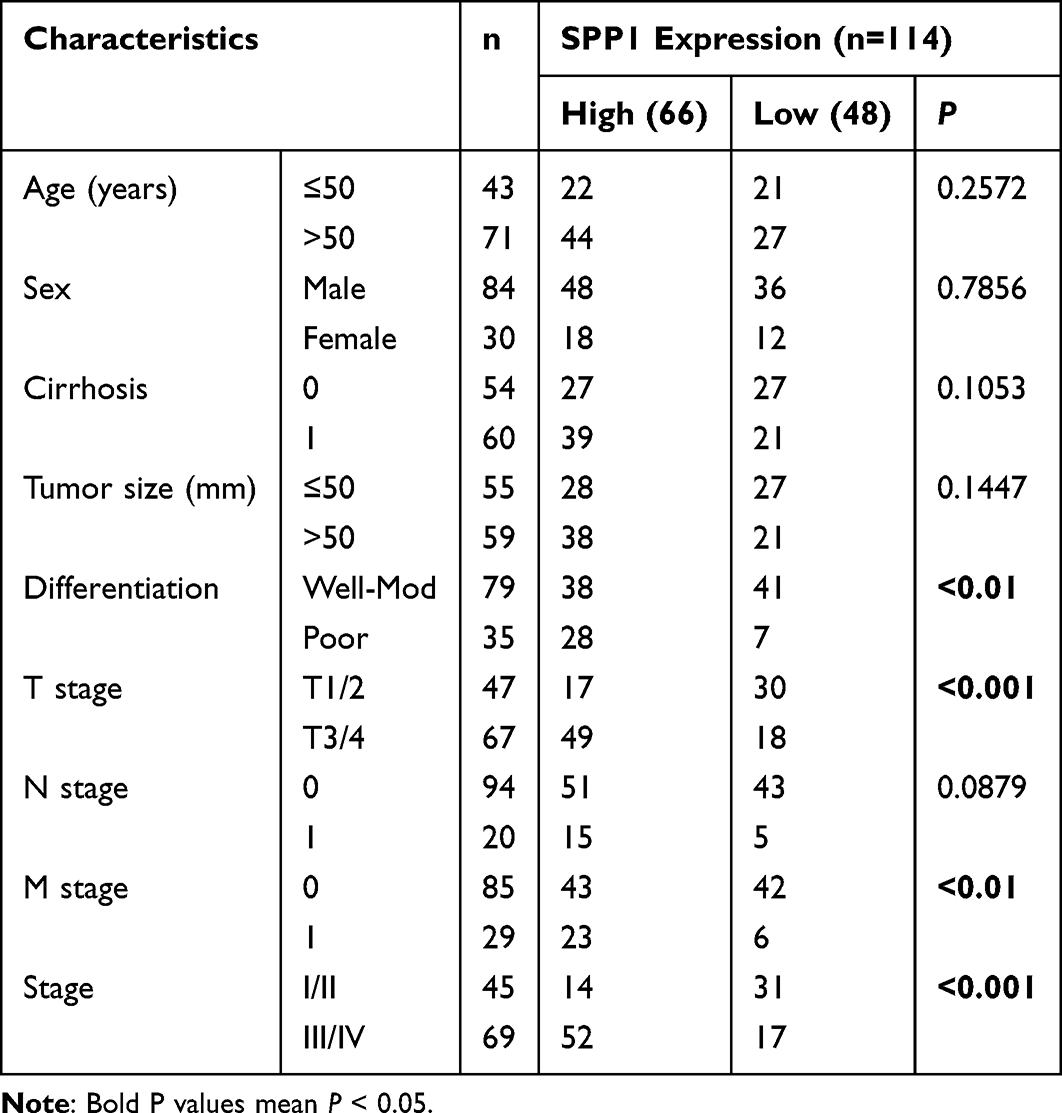 |
Table 2 The Relationship Between the SPP1 Protein Expression and Clinicopathological Features in HCC |
 |
Figure 7 Validation of the biological roles of the ARGs. (A) IHC quantification of APOH, SLCO2A1, SPP1, and VTN protein expression in paired tumor and adjacent tissues from HCC patients. (B). Kaplan-Meier estimates of overall survival according to SPP1 protein expression levels in a real-world HCC cohort. (C) Comparative analysis of SPP1 expression across normal hepatocyte (THLE-2) and HCC cell lines (Huh1, HepG2, Hep3B, LM3, Huh7) via immunoblotting. (D) Western blot validation of SPP1/SLCO2A1 protein knockdown efficiency following siRNA transfection in HepG2 and Huh7 cells. (E) Endothelial tube formation assays evaluating angiogenic capacity of HUVECs treated with conditioned media from distinct experimental groups. (F) Transwell migration assays quantifying HUVEC motility alterations under differential microenvironmental conditions. *: P < 0.05; **: P < 0.01; ****: P <0.0001. |
We further examined SPP1 protein expression in a panel of HCC cell lines (Huh1, HepG2, Hep3B, LM3, Huh7) and the immortalized normal hepatocyte line THLE‑2. HepG2 and Huh7 cells, which displayed the highest SPP1 expression, were selected for siRNA‑mediated knockdown (Figure 7C and D). Angiogenesis assay revealed that the angiogenic capacity of HUVECs in the SPP1 knockdown group was significantly lower than that of the control group (Figure 7E, P < 0.05). Transwell assay further showed that SPP1 knockdown markedly inhibited the migration capacity of HUVECs (Figure 7F, P < 0.05). In contrast, silencing SLCO2A1 significantly enhanced both the angiogenic capacity and migration of HUVECs (Figure 7E and F, P < 0.05).
To further investigate the role of SPP1 in HCC angiogenesis, we generated a stable SPP1-knockdown HepG2 cell line and established a subcutaneous xenograft model in mice. Tumors derived from the sh-SPP1 group exhibited significantly smaller volumes than those from the control group (P < 0.05, Figure 8A and B). Furthermore, IHC analysis showed marked reductions in the levels of the angiogenesis marker CD31 and the proliferation marker Ki-67 in the SPP1-knockdown tumors (P < 0.05, Figure 8C and D).
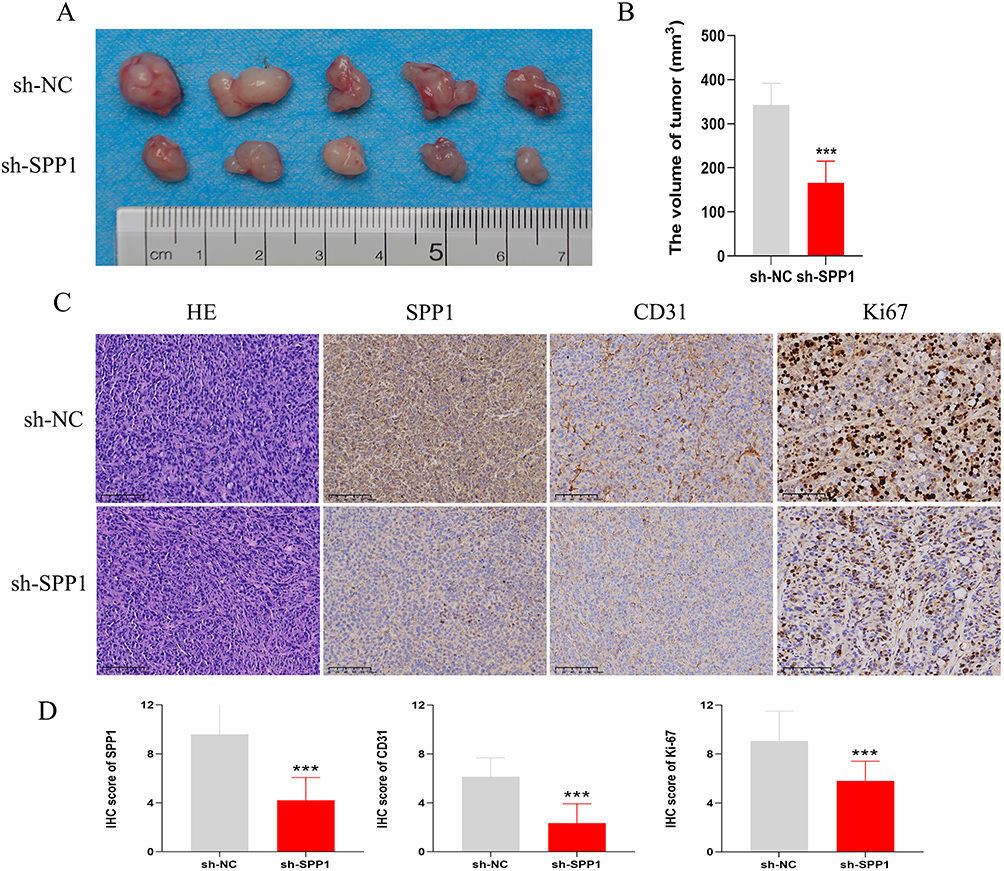 |
Figure 8 SPP1 knockdown impairs HCC tumorigenesis and angiogenesis in vivo. (A) Representative images and quantitative data of subcutaneous tumors from mice injected with HepG2 cells stably expressing either a non-targeting control (sh-NC) or an SPP1-targeting shRNA (sh-SPP1). (B) Statistical Chart of Tumor Volume for Two Groups. (C) IHC staining of the corresponding tumor tissues for CD31 (angiogenesis) and Ki67 (proliferation) demonstrates a concomitant reduction in both markers upon SPP1 depletion. (D) Comparison of IHC scores for SPP1, CD31, and Ki-67 between the sh-NC and sh-SPP1 groups. ***: P < 0.001. |
Pharmacosensitivity Profiling and Molecular Docking
To elucidate the regulatory roles of APOH, SLCO2A1, SPP1, and VTN in HCC angiogenesis, we stratified patients into high- and low-risk groups based on LASSO-derived risk scores. Using the GDSC2 database and OncoPredict R package, we subsequently analyzed differential therapeutic sensitivity to anti-angiogenic agents between risk groups stratified by these four ARGs. We noted that high-risk patients exhibited significantly higher IC50 values for sorafenib (PubChem CID: 216239) compared with low-risk patients, indicating reduced drug sensitivity. (P < 0.05; Figure 9A). Figure 9B displays sorafenib’s molecular structure.
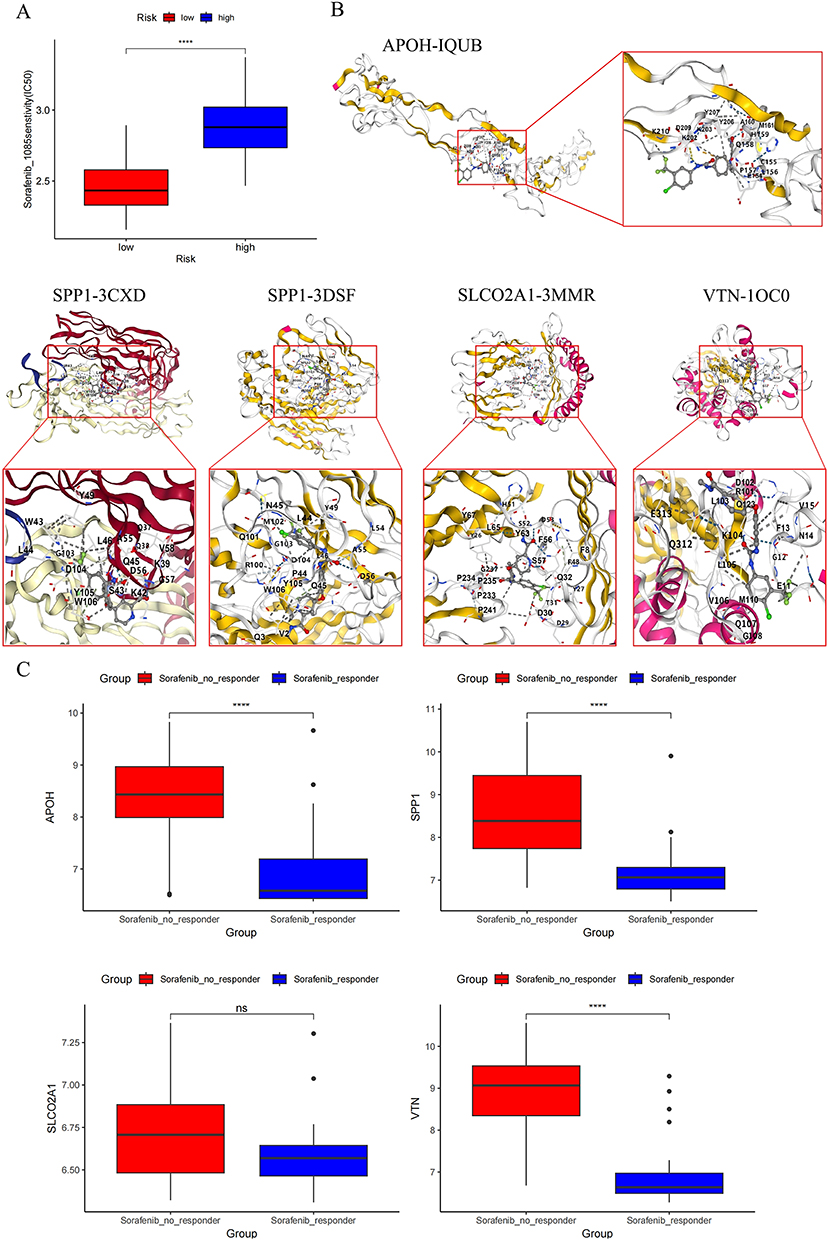 |
Figure 9 Pharmacosensitivity profiling and molecular docking. (A) Utilizing the GDSC2 database and OncoPredict R package, we assessed therapeutic sensitivity to sorafenib agents between risk-stratified cohorts defined by four-ARG (APOH, SLCO2A1, SPP1, VTN). (B) Schematic representation of molecular docking between sorafenib and protein targets encoded by 4 ARGs. (C) Comparative analysis of target gene expression profiles in sorafenib-responsive versus non-responsive patient cohorts. Statistical significance denoted as: ns, not significant P > 0.05; ****: P < 0.0001. |
Molecular docking via CB-Dock was employed to characterize binding interactions between sorafenib and the four target proteins, identifying optimal binding poses (Table 3 and Figure 9C). Finally, we assessed sorafenib treatment effects on target gene expression. Responders to sorafenib therapy showed significant downregulation of APOH, SPP1, and VTN (all P < 0.05), while SLCO2A1 expression remained unchanged (P > 0.05).
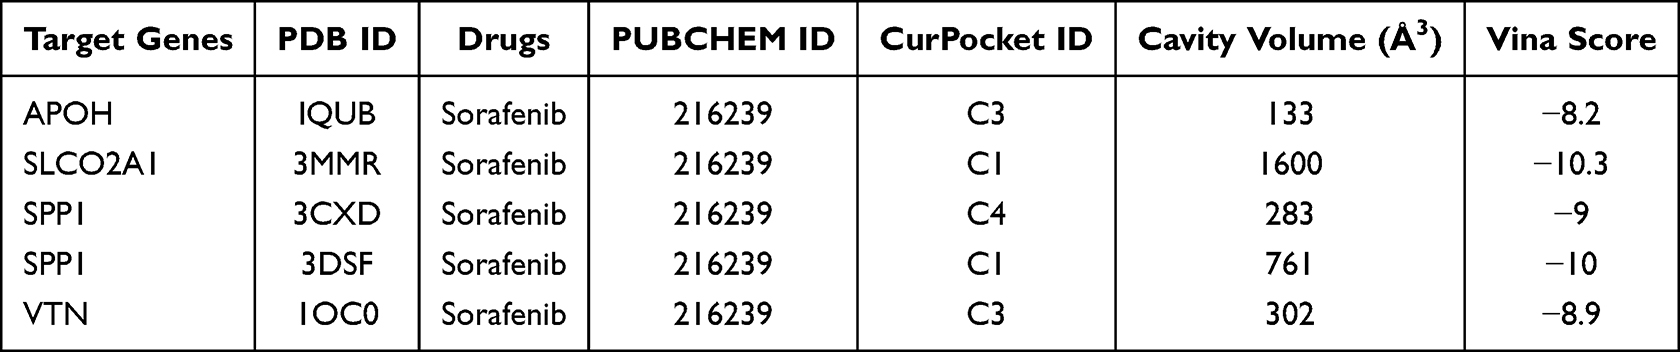 |
Table 3 Drug and Molecular Docking Targets |
Discussion
Angiogenesis is not only essential for sustained tumor growth but also a key driver of HCC invasion, metastasis, and treatment resistance.14 It is regulated by a network of pro-angiogenic factors (eg, VEGF family, FGF, PDGF) and inhibitors (eg, angiostatin, endostatin, thrombospondin-1), along with ECM components.15,16 Recent studies show that multiple immune cells—particularly tumor-associated macrophages (TAMs), neutrophils, mast cells, and certain T cell subsets—are critical sources of pro-angiogenic factors,17 while aberrant tumor vasculature further hinders immune infiltration and impairs antitumor effects, ultimately forming an immunosuppressive tumor microenvironment (TME).18 Elucidating this reciprocal crosstalk between angiogenesis and immunity therefore offers promising therapeutic opportunities to enhance cancer treatment.
Given the unclear prognostic significance and complex regulation of angiogenesis-related genes (ARGs) in HCC, we integrated transcriptomic data from TCGA, and ICGC and identified four conserved prognostic ARGs: APOH, SLCO2A1, SPP1, and VTN. The risk model constructed based on these four genes can stably stratify the prognosis of HCC patients and has been effectively validated in an external independent cohort. These findings suggest that these ARGs not only participate in tumor angiogenesis but may also jointly mediate tumor metabolic imbalance, inflammatory activation, and immune microenvironment remodeling.
Among them, APOH is primarily synthesized by hepatocytes and is involved in lipoprotein metabolism and the maintenance of hepatic lipid homeostasis.19 It is essential for hepatic lipid metabolic homeostasis, and high expression reflects normal liver function.20,21 During hepatocarcinogenesis, tumor cells undergo metabolic reprogramming, including rearrangement of lipid metabolism pathways.22,23 Accordingly, APOH is consistently downregulated in HCC tissues and serum,24,25 which aligns with our observation that low APOH expression correlates with poor overall survival. Notably, single‑cell sequencing by Zhao et al revealed that APOH‑positive HUVECs in the tumor microenvironment significantly suppress HCC cell proliferation.24 Here, we further identified APOH as a key angiogenesis-associated signature molecule in HCC.
SLCO2A1 encodes the prostaglandin transporter OATP2A1 (PGT), which mediates the uptake of extracellular prostaglandin E2 (PGE2) for intracellular degradation, thereby terminating PGE2 signaling. PGE2 is a potent pro-inflammatory and pro-angiogenic molecule that promotes cancer progression.26 In gastric adenocarcinoma, reduced SLCO2A1 leads to PGE2 accumulation and drives tumor angiogenesis via VEGF upregulation.27 In hypopharyngeal squamous cell carcinoma (HSCC), spatial transcriptomics suggests that SLCO2A1 may act as a tumor suppressor associated with immune infiltration.28 In our study, both transcriptomic (TCGA-HCC) and tissue microarray (TMA) protein analyses showed significantly higher SLCO2A1 expression in tumors than in adjacent tissues. Elevated SLCO2A1 correlated with prolonged overall survival in HCC patients, yet its levels progressively declined with advanced T-stage, overall disease stage, and histological grade. Knockdown of SLCO2A1 in HCC cells significantly enhanced the angiogenic and migratory capacities of HUVECs. Given the dynamic complexity of gene function in the TME, we hypothesize that during HCC progression, SLCO2A1 undergoes a transition from early adaptive protection to late-stage functional failure, marked by impaired anti‑angiogenic regulation and corresponding expression changes. This hypothesis warrants further experimental validation.
VTN is a multifunctional glycoprotein present in blood and the extracellular matrix. It promotes cervical cancer cell migration and invasion via epithelial-mesenchymal transition (EMT).29 In triple-negative breast cancer, VTN acts as a “don’t eat me” signal ligand by binding complement C1q-binding protein (C1qbp) on macrophages, thereby inhibiting phagocytosis and promoting M2-like polarization; consistently, VTN knockdown enhances macrophage phagocytosis and infiltration to exert anti-tumor effects.30 However, VTN expression in HCC has not been well characterized. Here we found VTN was positively expressed in both HCC tumor and adjacent tissues, with higher levels in the adjacent tissues.
SPP1 is a secreted chemokine-like phosphoprotein produced by various cell types. Recent studies identify it as a major mediator of tumor-related inflammation, upregulated in multiple tumor tissues and plasma and associated with poor prognosis.31,32 In HCC, cancer-associated fibroblast-derived SPP1 contributes to multidrug resistance,33 and hypoxic tumor cells secrete SPP1 to facilitate immune evasion.34 Macrophage-derived SPP1 promotes HCC stemness via the VTN/CCL15 axis.35 However, its role in HCC angiogenesis has remains largely unexplored.
In the current study, patients in the high-risk group defined by the HCC ARG model exhibited increased infiltration of dendritic cells (DCs), macrophages, and regulatory T cells (Tregs), along with higher immune/stromal scores and elevated immune checkpoint molecule expression. Integrating single-cell sequencing with published data, we dissected the cellular origins of the four ARGs: SPP1 is mainly secreted by TAMs and hepatocytes; VTN and APOH are expressed in M1 macrophages and monocytes; SLCO2A1 is also detected in monocytes. These origins suggest their collective contribution to an inflammatory, immunosuppressive, and pro-angiogenic tumor microenvironment. Hypoxic regions recruit TAMs, which disrupt endothelial junctions and increase vascular permeability via adrenomedullin36 and promote Treg recruitment through paracrine TGF‑β1, fostering a VEGF-rich milieu.37,38 As a key mediator, SPP1 activates PI3K/Akt and MAPK pathways via integrin/CD44 binding to drive VEGF expression,39,40 and promotes monocyte/macrophage chemotaxis,41 thereby fueling a vicious “inflammation-angiogenesis-immunosuppression” cycle. Within this cycle, VTN modulates macrophage polarization, SLCO2A1 maintains hepatocyte homeostasis through prostaglandin transport (its loss exacerbates inflammatory injury), and APOH reflects hepatocyte functional status. Notably, sorafenib treatment significantly downregulated APOH, SPP1, and VTN, whereas SLCO2A1 expression remained unchanged. This is consistent with the fact that the former three are tightly coupled to the kinase (VEGFR and PDGFR)-driven angiogenic and inflammatory signaling pathways targeted by sorafenib,42 while SLCO2A1 expression is primarily governed by homeostatic cues.43 Furthermore, high-risk patients exhibited higher sorafenib IC50 values, indicating lower drug sensitivity.
Collectively, these ARGs link tumor-associated inflammation to immunosuppression, generating a tumor-permissive niche. The prognostic model based on these genes showed robust predictive performance in both training and external validation cohorts, thus potentially improving survival prediction for HCC patients.
Data Sharing Statement
Data used in this study were obtained from the following public repositories:
1. TCGA-LIHC Data: RNA sequencing data and clinical annotations for hepatocellular carcinoma were downloaded from the Genomic Data Commons (GDC) data portal (https://portal.gdc.cancer.gov/projects/TCGA-LIHC).
2. GEO Dataset: The microarray dataset GSE109211 was accessed from the Gene Expression Omnibus (GEO) repository (https://www.ncbi.nlm.nih.gov/geo/).
3. Gene Set: The hallmark gene set “HALLMARK_ANGIOGENESIS” (containing 36 genes) was acquired from the MSigDB) (http://www.gseamsigdb.org/gsea/msigdb/human/geneset/HALLMARK_ANGIOGENESIS.html).
All original data supporting the findings of this study are available from the corresponding author upon reasonable request.
Ethics Approval and Consent to Participate
The utilization of these biomaterials and associated clinical data was approved under institutional ethical oversight (Ethics Review Committee of Xiangya Hospital, No. 2023110254), with written informed consent obtained in accordance with the Declaration of Helsinki. The study protocol involving animals was reviewed and approved (No. 2023110254) by the Institutional Animal Care and Use Committee of Xiangya Hospital, Central South University. All procedures were performed in strict accordance with the American Veterinary Medical Association (AVMA) Guidelines for the Euthanasia of Animals (2020 edition). At the end of the experiment, mice were euthanized by intraperitoneal injection of an overdose of Avertin (tribromoethanol, 250 mg/kg). Cessation of respiration and heartbeat was confirmed, followed by cervical dislocation as a secondary physical method to ensure death, after which tissue collection was conducted.
Consent for Publication
Written informed consent was obtained from the patients for publication of this article and any accompanying images.
Acknowledgments
This study was supported by the grants from National Natural Science Foundation of China (No. 82173342 & No. 82373275), and Natural Science Foundation of Hunan Province (No. 2024JJ9229).
Disclosure
The authors declare no competing financial interests or personal relationships that could influence the work reported herein.
References
1. Ladd AD, Duarte S, Sahin I, Zarrinpar A. Mechanisms of drug resistance in HCC. Hepatology. 2024;79(4):926–20. doi:10.1097/HEP.0000000000000237
2. Yang C, Zhang H, Zhang L, et al. Evolving therapeutic landscape of advanced hepatocellular carcinoma. Nat Rev Gastroenterol Hepatol. 2023;20(4):203–222. doi:10.1038/s41575-022-00704-9
3. Jordan AM, Drake RJG, Hodivala-Dilke KM. Angiocrine and pericrine signaling: how endothelial cells and pericytes drive cancer progression and therapy resistance. Physiol Rev. 2025;106(1):87–119. doi:10.1152/physrev.00046.2024
4. Shaw P, Dwivedi SKD, Bhattacharya R, Mukherjee P, Rao G. VEGF signaling: role in angiogenesis and beyond. Biochim Biophys Acta Rev Cancer. 2024;1879(2):189079. doi:10.1016/j.bbcan.2024.189079
5. Liu ZL, Chen HH, Zheng LL, Sun LP, Shi L. Angiogenic signaling pathways and anti-angiogenic therapy for cancer. Signal Transduct Target Ther. 2023;8(1):198. doi:10.1038/s41392-023-01460-1
6. Albini A, Noonan DM, Corradino P, Magnoni F, Corso G. The past and future of angiogenesis as a target for cancer therapy and prevention. Cancer Prev Res. 2024;17(7):289–303. doi:10.1158/1940-6207.CAPR-24-0085
7. Folkman J, Parris EE, Folkman J. Tumor angiogenesis: therapeutic implications. N Engl J Med. 1971;285(21):1182–1186. doi:10.1056/NEJM197111182852108
8. Yang Z, Zhang X, Bai X, Xi X, Liu W, Zhong W. Anti-angiogenesis in colorectal cancer therapy. Cancer Sci. 2024;115(3):734–751. doi:10.1111/cas.16063
9. Yao C, Wu S, Kong J, et al. Angiogenesis in hepatocellular carcinoma: mechanisms and anti-angiogenic therapies. Cancer Biol Med. 2023;20(1):25–43. doi:10.20892/j.issn.2095-3941.2022.0449
10. Wang Y, Deng B. Hepatocellular carcinoma: molecular mechanism, targeted therapy, and biomarkers. Cancer Metastasis Rev. 2023;42(3):629–652. doi:10.1007/s10555-023-10084-4
11. Mou J, Li C, Zheng Q, Meng X, Tang H. Research progress in tumor angiogenesis and drug resistance in breast cancer. Cancer Biol Med. 2024;21(7):571–585. doi:10.20892/j.issn.2095-3941.2023.0515
12. Hu C, Li T, Xu Y, et al. CellMarker 2.0: an updated database of manually curated cell markers in human/mouse and web tools based on scRNA-seq data. Nucleic Acids Res. 2023;51(D1):D870–d876. doi:10.1093/nar/gkac947
13. Liu H, Li X, Zhang C, et al. GJB2 promotes HCC progression by activating glycolysis through cytoplasmic translocation and generating a suppressive tumor microenvironment based on single cell RNA sequencing. Adv Sci. 2024;11(39):e2402115. doi:10.1002/advs.202402115
14. Lugano R, Ramachandran M, Dimberg A. Tumor angiogenesis: causes, consequences, challenges and opportunities. Cell Mol Life Sci. 2020;77(9):1745–1770. doi:10.1007/s00018-019-03351-7
15. Jiang X, Wang J, Deng X, et al. The role of microenvironment in tumor angiogenesis. J Exp Clin Cancer Res. 2020;39(1):204. doi:10.1186/s13046-020-01709-5
16. Lv S, Liu Y, Xie C, Xue C, Du S, Yao J. Emerging role of interactions between tumor angiogenesis and cancer stem cells. J Control Release. 2023;360:468–481. doi:10.1016/j.jconrel.2023.06.036
17. Wang W, Li T, Cheng Y, et al. Identification of hypoxic macrophages in glioblastoma with therapeutic potential for vasculature normalization. Cancer Cell. 2024;42(5):815–832.e812. doi:10.1016/j.ccell.2024.03.013
18. Lv H, Zong Q, Chen C, et al. TET2-mediated tumor cGAS triggers endothelial STING activation to regulate vasculature remodeling and anti-tumor immunity in liver cancer. Nat Commun. 2024;15(1):6. doi:10.1038/s41467-023-43743-9
19. Leduc MS, Shimmin LC, Klos KL, Hanis C, Boerwinkle E, Hixson JE. Comprehensive evaluation of apolipoprotein H gene (APOH) variation identifies novel associations with measures of lipid metabolism in GENOA. J Lipid Res. 2008;49(12):2648–2656. doi:10.1194/jlr.M800155-JLR200
20. Liu Y, Zhao Y, Liu Q, et al. Effects of apolipoprotein H downregulation on lipid metabolism, fatty liver disease, and gut microbiota dysbiosis. J Lipid Res. 2024;65(1):100483. doi:10.1016/j.jlr.2023.100483
21. Liu Y, Wu Z, Zhao Y, Zhen M, Wang Y, Liu Q. Apolipoprotein H-based prognostic risk correlates with liver lipid metabolism disorder in patients with HBV-related hepatocellular carcinoma. Heliyon. 2024;10(10):e31412. doi:10.1016/j.heliyon.2024.e31412
22. Yang F, Hilakivi-Clarke L, Shaha A, et al. Metabolic reprogramming and its clinical implication for liver cancer. Hepatology. 2023;78(5):1602–1624. doi:10.1097/HEP.0000000000000005
23. He X, Zhang J, Huang M, et al. Serum apolipoprotein H determines ferroptosis resistance by modulating cellular lipid composition. Cell Death Dis. 2024;15(10):718. doi:10.1038/s41419-024-07099-2
24. Cheng Z, Yang X, Ren Y, et al. Investigating the molecular mechanisms and clinical potential of APO+ endothelial cells associated with PANoptosis in the tumor microenvironment of hepatocellular carcinoma using single-cell sequencing data. Transl Oncol. 2025;57:102402. doi:10.1016/j.tranon.2025.102402
25. Cao WQ, Jiang BY, Huang JM, et al. Straightforward and highly efficient strategy for hepatocellular carcinoma glycoprotein biomarker discovery using a nonglycopeptide-based mass spectrometry pipeline. Anal Chem. 2019;91(19):12435–12443. doi:10.1021/acs.analchem.9b03074
26. Fumet JD, Latour C, Nuttin L, et al. Tumor-associated macrophages produce PGE2 to promote CD8+ T-cell exhaustion and drive resistance to PD-L1 blockade in microsatellite-stable colorectal cancer. Cancer Res. 2026;86(3):785–801. doi:10.1158/0008-5472.CAN-25-0079
27. Takeda S, Tanigawa T, Watanabe T, et al. Reduction of prostaglandin transporter predicts poor prognosis associated with angiogenesis in gastric adenocarcinoma. J Gastroenterol Hepatol. 2016;31(2):376–383. doi:10.1111/jgh.13079
28. Li C, Xu C, Guan R, et al. Spatial transcriptomics reveal tumor microenvironment and SLCO2A1 correlated with tumor suppression in hypopharyngeal squamous cell carcinoma. Int Immunopharmacol. 2024;142:113243. doi:10.1016/j.intimp.2024.113243
29. Lin Y, Bian L, Zhu G, Zhang B. Vitronectin promotes proliferation and metastasis of cervical cancer cells via the epithelial-mesenchymal transition. Front Oncol. 2024;14:1466264. doi:10.3389/fonc.2024.1466264
30. Zhang C, Liu Y, Jiang J, et al. Targeting tumor cell-to-macrophage communication by blocking Vtn-C1qbp interaction inhibits tumor progression via enhancing macrophage phagocytosis. Theranostics. 2024;14(7):2757–2776. doi:10.7150/thno.94537
31. Qi J, Sun H, Zhang Y, et al. Single-cell and spatial analysis reveal interaction of FAP(+) fibroblasts and SPP1(+) macrophages in colorectal cancer. Nat Commun. 2022;13(1):1742. doi:10.1038/s41467-022-29366-6
32. Liu Y, Zhang Q, Xing B, et al. Immune phenotypic linkage between colorectal cancer and liver metastasis. Cancer Cell. 2022;40(4):424–437.e425. doi:10.1016/j.ccell.2022.02.013
33. Eun JW, Yoon JH, Ahn HR, et al. Cancer-associated fibroblast-derived secreted phosphoprotein 1 contributes to resistance of hepatocellular carcinoma to sorafenib and lenvatinib. Cancer Commun. 2023;43(4):455–479. doi:10.1002/cac2.12414
34. Zhang G, Xiao Y, Zhang X, et al. Dissecting a hypoxia-related angiogenic gene signature for predicting prognosis and immune status in hepatocellular carcinoma. Front Oncol. 2022;12:978050. doi:10.3389/fonc.2022.978050
35. Wang Y, Wang Q, Tao S, et al. Identification of SPP1(+) macrophages in promoting cancer stemness via vitronectin and CCL15 signals crosstalk in liver cancer. Cancer Lett. 2024;604:217199. doi:10.1016/j.canlet.2024.217199
36. DeNardo DG, Ruffell B. Macrophages as regulators of tumour immunity and immunotherapy. Nat Rev Immunol. 2019;19(6):369–382. doi:10.1038/s41577-019-0127-6
37. Patel A, Sant S. Hypoxic tumor microenvironment: opportunities to develop targeted therapies. Biotechnol Adv. 2016;34(5):803–812. doi:10.1016/j.biotechadv.2016.04.005
38. Xu Y, Li L, Yang W, et al. TRAF2 promotes M2-polarized tumor-associated macrophage infiltration, angiogenesis and cancer progression by inhibiting autophagy in clear cell renal cell carcinoma. J Exp Clin Cancer Res. 2023;42(1):159. doi:10.1186/s13046-023-02742-w
39. Dai J, Peng L, Fan K, et al. Osteopontin induces angiogenesis through activation of PI3K/AKT and ERK1/2 in endothelial cells. Oncogene. 2009;28(38):3412–3422. doi:10.1038/onc.2009.189
40. Hao C, Lane J, Jiang WG. Osteopontin and cancer: insights into its role in drug resistance. Biomedicines. 2023;11(1):197. doi:10.3390/biomedicines11010197
41. Liu C, Wu K, Li C, et al. SPP1+ macrophages promote head and neck squamous cell carcinoma progression by secreting TNF-α and IL-1β. J Exp Clin Cancer Res. 2024;43(1):332. doi:10.1186/s13046-024-03255-w
42. Zhang W, Hong X, Xiao Y, Wang H, Zeng X. Sorafenib resistance and therapeutic strategies in hepatocellular carcinoma. Biochim Biophys Acta Rev Cancer. 2025;1880(3):189310. doi:10.1016/j.bbcan.2025.189310
43. Nakanishi T, Nakamura Y, Umeno J. Recent advances in studies of SLCO2A1 as a key regulator of the delivery of prostaglandins to their sites of action. Pharmacol Ther. 2021;223:107803. doi:10.1016/j.pharmthera.2021.107803
 © 2026 The Author(s). This work is published and licensed by Dove Medical Press Limited. The
full terms of this license are available at https://www.dovepress.com/terms
and incorporate the Creative Commons Attribution
- Non Commercial (unported, 4.0) License.
By accessing the work you hereby accept the Terms. Non-commercial uses of the work are permitted
without any further permission from Dove Medical Press Limited, provided the work is properly
attributed. For permission for commercial use of this work, please see paragraphs 4.2 and 5 of our Terms.
© 2026 The Author(s). This work is published and licensed by Dove Medical Press Limited. The
full terms of this license are available at https://www.dovepress.com/terms
and incorporate the Creative Commons Attribution
- Non Commercial (unported, 4.0) License.
By accessing the work you hereby accept the Terms. Non-commercial uses of the work are permitted
without any further permission from Dove Medical Press Limited, provided the work is properly
attributed. For permission for commercial use of this work, please see paragraphs 4.2 and 5 of our Terms.
Recommended articles
Decaprenyl Diphosphate Synthase Subunit 1 (PDSS1): A Potential Prognostic Biomarker and Immunotherapy-Target for Hepatocellular Carcinoma
Yang Y, Li J, Tang M, Nie B, Huang W
Cancer Management and Research 2022, 14:1627-1639
Published Date: 3 May 2022
Synergistic Effect of Lenvatinib and Chemotherapy in Hepatocellular Carcinoma Using Preclinical Models
Wang M, Yao X, Bo Z, Zheng J, Yu H, Xie X, Lin Z, Wang Y, Chen G, Wu L
Journal of Hepatocellular Carcinoma 2023, 10:483-495
Published Date: 27 March 2023
Infiltration of a Unique CD8+CD274+ Cell Subgroup in Hepatocellular Carcinoma is Associated with Poor Clinical Outcomes
Zhang Y, Cui K, Yang Y, Liu B, Zhu M, Chen H, Zhao C, Zhou Y, Nie Y
Journal of Hepatocellular Carcinoma 2023, 10:1051-1067
Published Date: 8 July 2023
Development and Validation of a Propionate Metabolism-Related Gene Signature for Prognostic Prediction of Hepatocellular Carcinoma
Xiao J, Wang J, Zhou C, Luo J
Journal of Hepatocellular Carcinoma 2023, 10:1673-1687
Published Date: 2 October 2023
Chronic Inflammatory and Immune Microenvironment Promote Hepatocellular Carcinoma Evolution
Chen S, Zhang L, Chen Y, Zhang X, Ma Y
Journal of Inflammation Research 2023, 16:5287-5298
Published Date: 15 November 2023