Back to Journals » Infection and Drug Resistance » Volume 19
A QuantiFERON®-TB Gold Plus-Based Model for Predicting Latent Tuberculosis Infection in Patients with Diabetes
Authors Zhou J, Lin X, Yu Y, Zhang Y, Qiu L, Lin Z, Jiang X, Shi J
Received 28 November 2025
Accepted for publication 7 April 2026
Published 29 May 2026 Volume 2026:19 581374
DOI https://doi.org/10.2147/IDR.S581374
Checked for plagiarism Yes
Review by Single anonymous peer review
Peer reviewer comments 3
Editor who approved publication: Dr Hazrat Bilal
Jiajun Zhou,1 Xiaoqing Lin,1 Yuhui Yu,2 Yiyang Zhang,3 Liufeng Qiu,3 Zhiruo Lin,3 Xiangao Jiang,1 Jichan Shi1
1Department of Infectious Disease, The Wenzhou Central Affiliated Hospital of Wenzhou Medical University, Wenzhou, Zhejiang, People’s Republic of China; 2Department of Endocrinology, The Wenzhou Central Affiliated Hospital of Wenzhou Medical University, Wenzhou, Zhejiang, People’s Republic of China; 3The Wenzhou Central Affiliated Hospital of Wenzhou Medical University, Wenzhou, Zhejiang, People’s Republic of China
Correspondence: Xiangao Jiang, Department of Infectious Disease, The Wenzhou Central Affiliated Hospital of Wenzhou Medical University, No. 252 Baili East Road, Lucheng District, Wenzhou, Zhejiang, 325000, People’s Republic of China, Tel +860577-88882121, Email [email protected] Jichan Shi, Department of Infectious Disease, The Wenzhou Central Affiliated Hospital of Wenzhou Medical University, No. 252 Baili East Road, Lucheng District, Wenzhou, Zhejiang, 325000, People’s Republic of China, Tel +860577-88882121, Email [email protected]
Background: Diabetes mellitus (DM) is a well-established independent risk factor for tuberculosis (TB), and the prevalence of latent tuberculosis infection (LTBI) among patients with DM remains a critical public health concern. This study aims to investigate the prevalence and predictive factors of LTBI in patients with DM using the QuantiFERON®-TB Gold Plus (QFT-PLUS) test and to develop a clinically applicable predictive model.
Methods: A cross-sectional study was conducted involving 195 participants (96 with DM and 99 healthy controls) at Wenzhou Central Hospital between June and December 2023. LTBI was diagnosed using the QFT-PLUS test, and data on patient characteristics, laboratory findings and computed tomography scans were gathered. A predictive model was constructed through univariate and multivariate logistic regression analyses.
Results: Among individuals with DM, 28 (29.2%) were identified as having LTBI compared with 16.2% in healthy controls. The final predictive model included age (> 60 vs ≤ 60 years, odds ratio [OR]: 4.994, 95% CI: 1.583– 17.610), gender (male vs female, OR: 26.886, 95% CI: 5.224– 231.700), duration of diabetes (> 10 vs ≤ 10 years, OR: 3.450, 95% CI: 1.000– 13.240) and presence of hyperlipidaemia (yes vs no, OR: 10.637, 95% CI: 2.299– 82.340) as significant factors, yielding an area under the curve of 0.847 (95% CI: 0.765– 0.928).
Conclusion: This QFT-PLUS-based predictive model, incorporating readily available clinical parameters, demonstrates potential clinical utility for LTBI risk stratification and targeted TB screening in patients with DM. Future multicentre external validation studies with larger sample sizes are warranted before clinical implementation.
Keywords: diabetes, latent tuberculosis infection, QFT-PLUS, risk factor, predictive model
Introduction
Globally, tuberculosis (TB) affects 10.6 million individuals annually, with approximately 1.3 million succumbing to the disease, ranking it as the second most common cause of infectious disease mortality after COVID-19.1 A quarter of the world’s population has latent tuberculosis infection (LTBI), and 5%–10% of these people develop active tuberculosis (ATB) within 5 years, mainly occurring in the first 2 years after exposure.2 Presently, no gold standard exists for diagnosing LTBI, with the World Health Organisation (WHO) proposing both the tuberculin skin test (TST) and the interferon-gamma release assay (IGRA) as diagnostic tools.3 While economical, the TST may lead to false positives due to cross-reactivity from prior Bacillus Calmette–Guérin (BCG) vaccinations.4 On the other hand, the IGRA test, which targets ESAT-6 and CFP-10 antigens not present in BCG or most non-TB mycobacteria, offers improved specificity.5 The QuantiFERON®-TB Gold Plus (QFT-PLUS) test, a new version of the IGRA assay, stimulates and identifies CD4+ and CD8+ T-cell immune responses simultaneously, providing a more comprehensive understanding of the immune response and enhancing the accuracy of LTBI detection.6
Diabetes mellitus (DM) is a chronic metabolic disease characterised by hyperglycaemia. According to the most recent International Diabetes Federation Diabetes Atlas (11th edition) (2025), 589 million adults (20–79 years) are currently living with diabetes globally, representing 11.1% or 1 in 9 adults. This number is projected to rise dramatically to 853 million by 2050, representing a 46% increase.7 The global health burden is substantial, with diabetes causing 3.4 million deaths in 2024 and accounting for at least USD 1 trillion in health expenditure. In China, the burden is particularly significant, with approximately 140 million adults living with diabetes, representing the world’s largest diabetic population and accounting for one-quarter of the global diabetes burden. The prevalence of diabetes in China has increased dramatically from less than 1% in 1980 to 12.4% in 2018. Moreover, TB–DM comorbidity poses a significant public health challenge, particularly in high TB burden countries such as China, which ranks second globally for TB incidence, with an estimated 780,000 new cases annually.
Diabetes affects the immune system and increases the risk of developing TB, mainly related to immune dysfunction associated with hyperglycaemia and insulin resistance.8 Patients with diabetes are significantly more susceptible to developing ATB, with incidence rates four–eight times higher than in the general population.9,10 Several international studies have investigated LTBI prevalence in diabetic populations using various diagnostic approaches.11 Zhou et al12 performed a meta-analysis including 22 observational studies with 68,256 participants, confirming a positive association between DM and LTBI with a pooled adjusted odds ratio of 1.21 (95% CI: 1.14–1.29) for cross-sectional studies. Antonio-Arques et al13 conducted a retrospective matched cohort study enrolling 16,008 participants, showing that DM patients had a higher active TB incidence with an unadjusted hazard ratio of 1.90 (95% CI: 1.18–3.07). Regional studies have reported LTBI positivity rates of 21.5% in Taiwan,14 21% in South India,15 and 45.4% in Brazil.16
While the relationship between DM and LTBI has been established, existing predictive tools for LTBI risk stratification in diabetic populations—such as logistic regression-based predictive indices and gut microbiome-based models—remain limited in availability and have not been specifically developed using the newer QFT-PLUS assay.17,18 Furthermore, most prior studies have relied on TST or older-generation IGRA tests, which may have lower sensitivity in BCG-vaccinated populations. We hypothesised that readily available clinical parameters combined with QFT-PLUS results could be used to construct a practical predictive model for identifying LTBI risk in patients with DM. This study aims to fill this gap by developing and internally validating such a model tailored to this high-risk population in a high TB burden setting.
We chose QFT-PLUS as our diagnostic tool due to its superior specificity compared with traditional TSTs, especially in BCG-vaccinated populations such as China.19 Moreover, QFT-PLUS’s ability to stimulate both CD4+ and CD8+ T-cell responses potentially offers improved sensitivity in detecting recent TB exposure, which is particularly relevant in a high TB burden country. The development of a prediction model based on QFT-PLUS results and easily obtainable clinical parameters addresses several practical problems: it could help stratify patients with DM according to their LTBI risk, allowing for more targeted screening and preventive measures; in resource-limited settings, it could guide the efficient use of QFT-PLUS testing by identifying those at highest risk; and it provides a tool for clinicians to educate patients with DM about their individual LTBI risk, potentially improving adherence to preventive strategies.20
Materials and Methods
Study Design and Participants
A cross-sectional study was conducted at Wenzhou Central Hospital between June and December 2023. Patients with diabetes were diagnosed based on the criteria set by the American Diabetes Association (ADA). All patients underwent inpatient treatment at the department of endocrinology. Healthy volunteers who were undergoing health check-ups at Wenzhou Central Hospital were included in the study as controls. These participants were systematically screened to confirm their healthy status through comprehensive medical history, physical examination and laboratory tests, including complete blood count, liver and kidney function tests and chest imaging. Individuals with any known chronic diseases, immunocompromising conditions or abnormal screening results were excluded to ensure the validity of the control group.
Sample size was determined based on the rule of thumb for logistic regression, which suggests a minimum of 10 events per predictor variable. With an estimated LTBI prevalence of 25% in patients with DM and seven potential predictors, we aimed for a minimum of 280 participants. Our final sample of 195 participants (96 with DM, 99 controls) was limited by resource constraints and the study’s timeframe. Participants were recruited consecutively from the hospital’s endocrinology department and health check-up centre.
Data Collection
Clinical data were collected through a combination of electronic medical record review and standardised patient interviews conducted by trained research staff during hospitalisation. For each participant, medical records were reviewed to extract laboratory results (HbA1c, fasting and postprandial blood glucose, serum albumin, C-reactive protein), imaging reports (chest computed tomography [CT] scans), and documented comorbidities (chronic kidney disease, chronic liver disease, retinopathy). Smoking and drinking history were ascertained through direct patient interviews using a standardised questionnaire; smoking history was defined as any current or former tobacco use, and drinking history was defined as any current or former regular alcohol consumption. Hyperlipidaemia was confirmed through both medical record documentation and laboratory measurement of serum lipid profiles during hospitalisation. Duration of diabetes was self-reported by patients and cross-referenced with available medical records.
Blood samples were collected from all participants to measure glycated haemoglobin (HbA1c) and detect LTBI using the QFT-PLUS tool. Exclusions were made for individuals with HbA1c levels between 5.7% and 6.5% or indeterminate QFT-PLUS results. Additionally, individuals with confirmed or previous ATB, infection with HIV, neoplasms, autoimmune diseases, haematologic disorders, psychiatric history, pregnancy or breastfeeding were excluded from the study. The study received approval from the Ethics Committee of Wenzhou Central Hospital, and all participants provided informed consent. Data on LTBI potential predictor variables, collected through a review of the scientific literature, included gender, age, body mass index, history of smoking (yes/no), history of drinking (yes/no), chronic kidney disease (yes/no), chronic liver disease (yes/no), hyperlipidaemia (yes/no), retinopathy (yes/no), glucocorticoids treatment (yes/no), results of chest CT scan (normal/abnormal), fasting blood glucose, postprandial blood glucose, glycated haemoglobin, serum albumin and C-reactive protein.
Measures and Definitions
According to the ADA guidelines, the diagnosis of diabetes is based on HbA1c levels. The study population was divided into two groups: the healthy control (HC) group (HbA1c<5.7%) and the DM group (HbA1c≥6.5%). The QFT-PLUS tool was utilised to determine the LTBI status of the patients. Blood samples were collected from the participants’ veins and then assessed for the quantity of interferon-gamma (IFN-γ) released from whole blood cells that had been stimulated by specific antigens of Mycobacterium tuberculosis via enzyme-linked immunosorbent assay. In the QFT-PLUS assay, the TB1 tube contains peptides that primarily stimulate CD4+ T-cell responses, the TB2 tube contains additional peptides designed to elicit both CD4+ and CD8+ T-cell responses, and the TB2–TB1 value represents the difference in IFN-γ response between these two tubes, reflecting the relative contribution of CD8+ T cells.
Confounding Control and Variable Selection
Beyond demographic and clinical variables, we considered lifestyle and exposure-related covariates as potential confounders of the diabetes–LTBI association. Smoking status (yes/no) was included a priori given prior evidence and our univariate signal (p=0.066). We did not systematically capture household/occupational exposure to active TB or socioeconomic indicators (eg., education, income), which we acknowledge as unmeasured confounders. To partly assess robustness, we fitted sensitivity models additionally adjusting for smoking and conducted E-value calculations to quantify the minimum strength of unmeasured confounding needed to explain away the main associations.
Glycaemic Control and Diabetes-Related Factors
We modelled HbA1c as a continuous covariate with restricted cubic splines (knots at 7.0%, 8.5%, and 10.0%) to account for non-linearity. In secondary analyses, we categorised HbA1c as <7.0%, 7.0–8.9%, and ≥9.0% to reflect clinical control strata. As a proxy for chronic metabolic injury, we included diabetic retinopathy (yes/no). Data on antidiabetic treatment types (insulin vs. oral agents vs. combination) and other micro/macrovascular complications were not systematically captured and are acknowledged as limitations.
Statistical Extensions
We re-fitted multivariable logistic regressions under four prespecified specifications: Model A (original core: age, sex, diabetes duration, hyperlipidaemia), Model B (Model A + smoking), Model C (Model A + smoking + HbA1c as continuous variable), and Model D (Model A + smoking + HbA1c + retinopathy). Internal validation was performed using bootstrap resampling with 500 iterations. We report optimism-corrected discrimination, calibration intercept/slope, Brier score, and calibration-in-the-large.
Data Analysis
Continuous normally distributed data were expressed as mean ± standard deviation, non-normally distributed data were expressed as median (interquartile range) and categorical data were expressed as numbers (proportions). Internal validation was performed using bootstrap resampling with 500 iterations to correct for optimism bias and provide more generalisable performance estimates. Comparisons between groups were performed using appropriate statistical tests: the chi-square test or Fisher’s exact test for categorical variables and the Mann–Whitney U-test for continuous variables with non-normal distribution. Statistical significance was defined as p<0.05. Univariate analysis results were utilised as predictor variables for multivariate logistic regression. We used a significance level of p<0.1 to avoid missing potentially important prognostic factors.21 Backward elimination and Akaike information criterion (AIC) minimisation principles were applied in the variable selection process. Discriminatory power of the model was evaluated using receiver operating characteristic curve analysis. Calibration and decision curve analysis curves were also generated to assess model accuracy and clinical utility. Statistical analyses were performed using SPSS 26.0 (IBM, Armonk, NY, USA) and R 3.6.3 software (R Core Team, Vienna, Austria).
Results
Analysis of QFT-PLUS Results Across the Two Groups
Participants with confirmed or previous ATB, newly diagnosed TB (n=2), uncertain QFT-PLUS results (n=1) and HbA1c levels of 5.7–6.5% (n=2) were not included in the analysis. A total of 195 participants were ultimately analysed, with 96 in the DM group and 99 in the HC group (Figure 1). The demographic and clinical characteristics of the participants are summarised in Table 1. Patients with DM had a higher average age (60.125±12.445 years) compared with those in the control group. The overall prevalence of LTBI in the study population was 22.6% (n=44) based on QFT-PLUS results, with 29.2% (n=28) in the DM group and 16.2% (n=16) in the HC group. A statistically significant distinction in QFT-PLUS results between the two groups was observed (p=0.039) using the chi-square test, as shown in Figure 2. Analysis of antigen-specific IFN-γ production revealed higher TB antigenic responses in the DM group compared with the HC group for TB1 and TB2 tubes (Mann–Whitney U-test), with no statistical difference between the groups in TB2–TB1 values (Table 1).
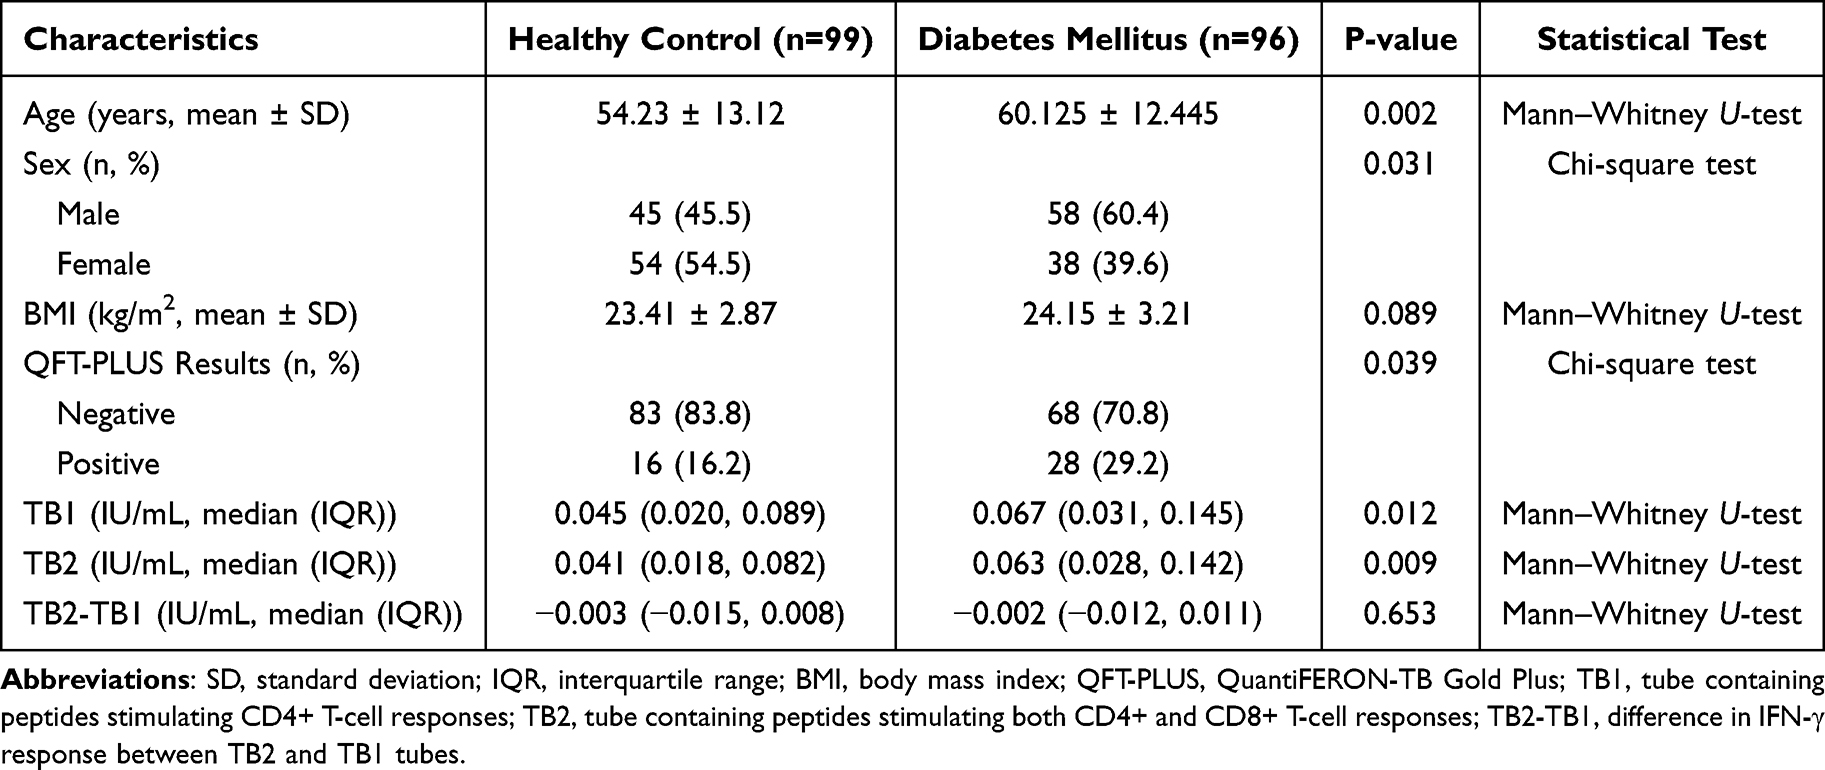 |
Table 1 Demographic and Clinical Characteristics of Participants |
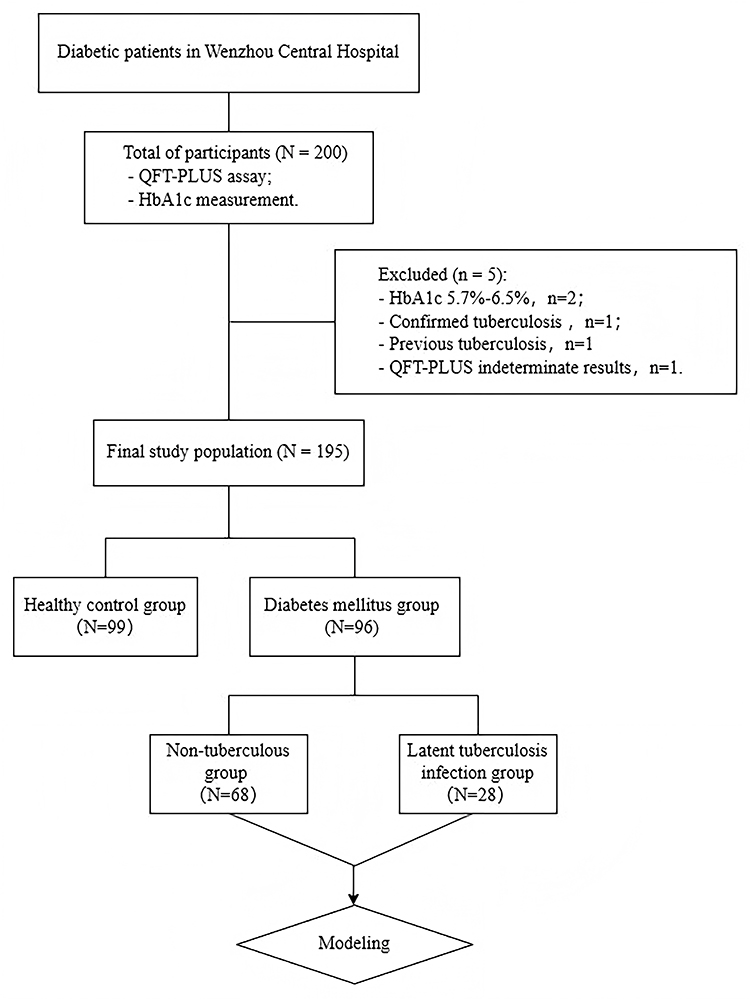 |
Figure 1 Study participant flow chart and group allocation. A total of 200 participants were initially enrolled, with 195 meeting the inclusion criteria. Participants were divided into the diabetes mellitus group (N=96) and the healthy control group (N=99). Based on QFT-PLUS results, the DM group was further subdivided into the non-tuberculosis group (N=68) and the LTBI group (N=28). Abbreviations: HbA1c, Glycated Haemoglobin A1c; QFT-PLUS, QuantiFERON-TB Gold Plus. |
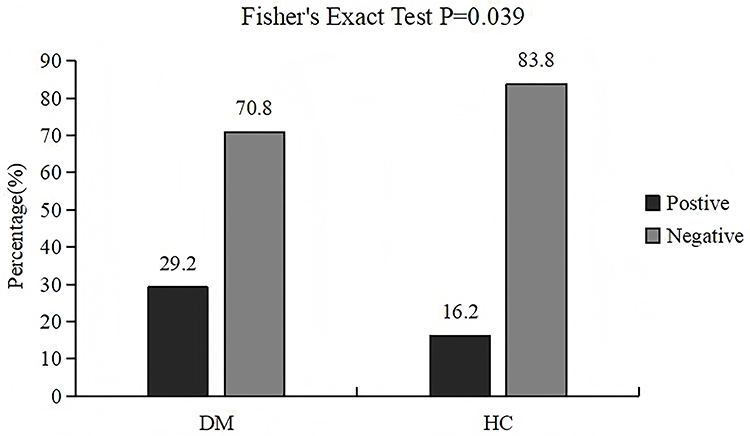 |
Figure 2 Comparison of QFT-PLUS test positivity rates between the diabetes mellitus and healthy control groups. The DM group showed a significantly higher LTBI prevalence (29.2%) compared with the HC group (16.2%) (Fisher’s Exact Test, P=0.039, N=195). |
Analysis of Related Factors of Latent Tuberculosis Infection in Patients with Diabetes Mellitus
Table 2 shows all the variables collected in the DM group and the proportions of their distribution. Based on the QFT-PLUS findings, the cohort of patients with DM was divided into the non-TB group and the LTBI group. Univariate analysis revealed that age, gender, duration of diabetes, smoking, hyperlipidaemia, glucocorticoid treatment and chest CT scan abnormalities met the threshold of p<0.1 and were considered as input variables for multiple logistic regression (Table 3). Abnormal chest CT findings included structural abnormalities such as nodules, fibrotic changes, calcifications or infiltrates suggestive of previous or current pulmonary pathology.
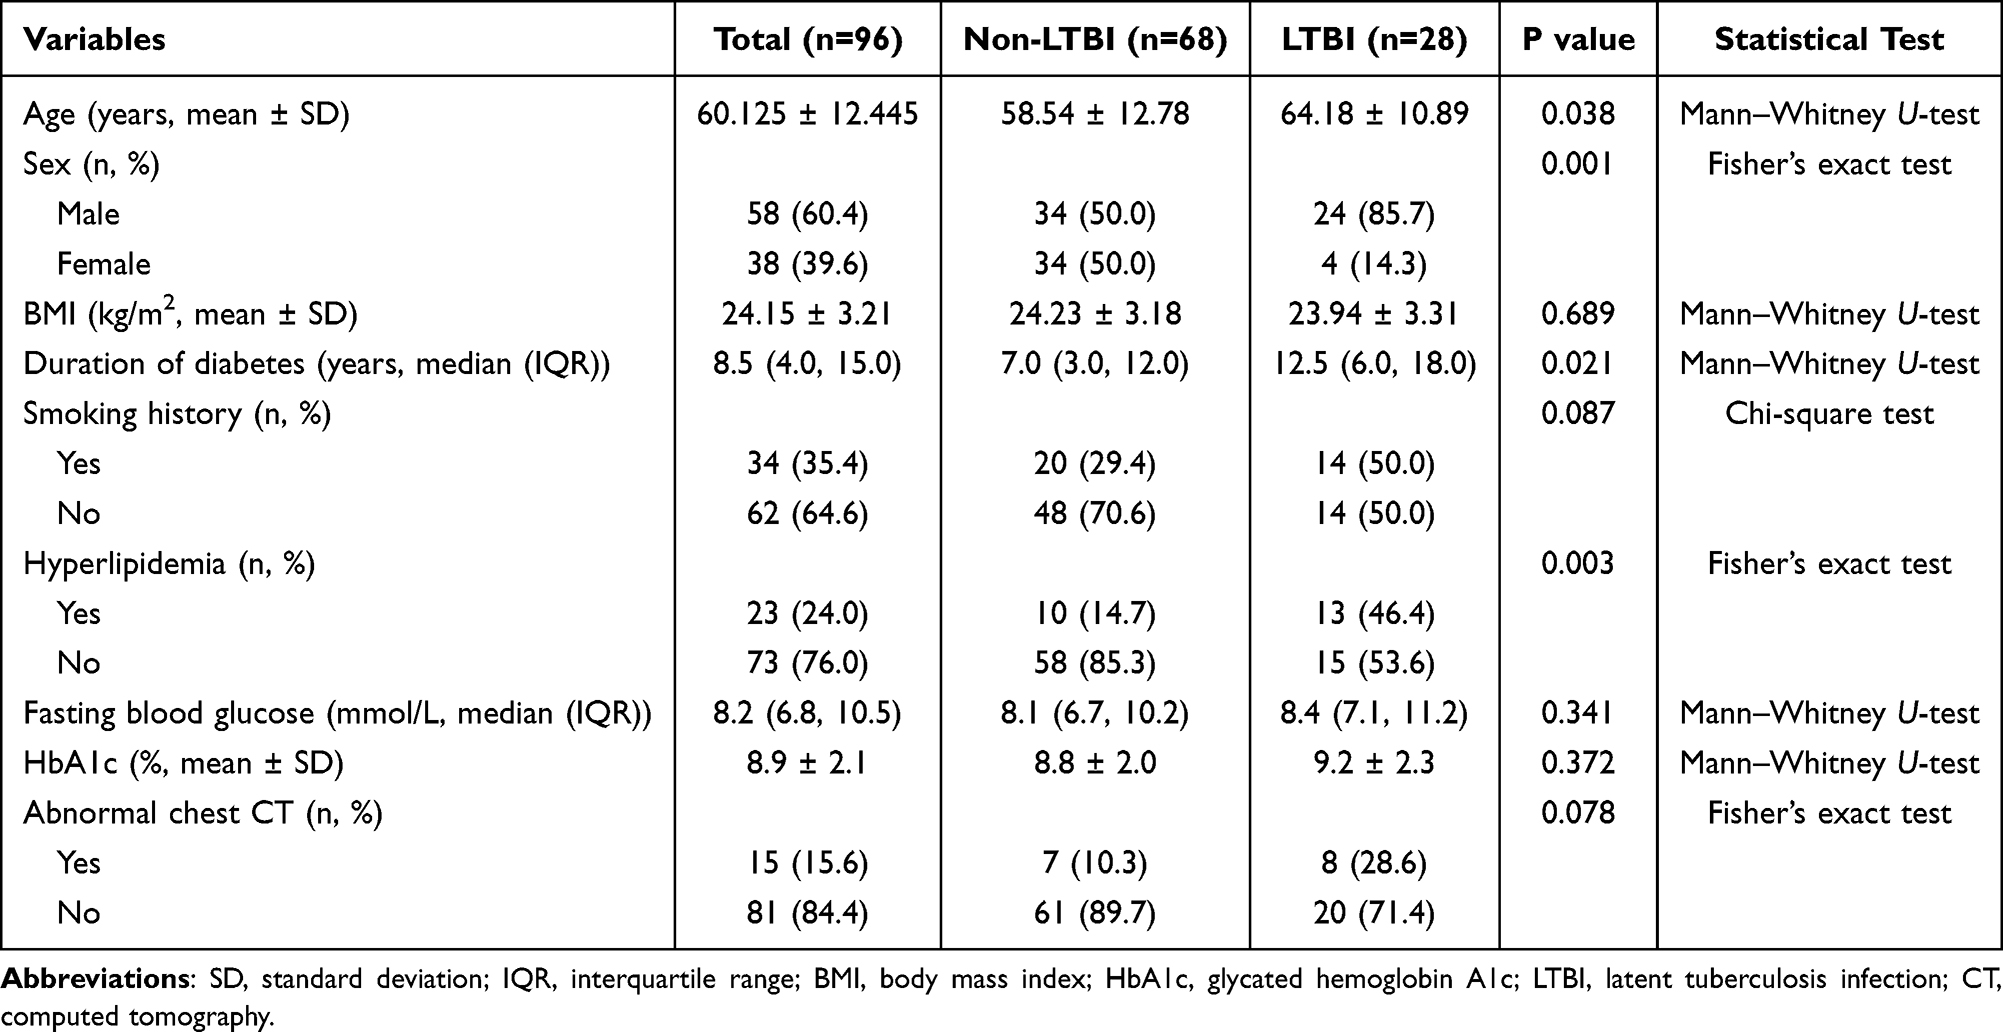 |
Table 2 Characteristics of Diabetes Mellitus Patients (N=96) |
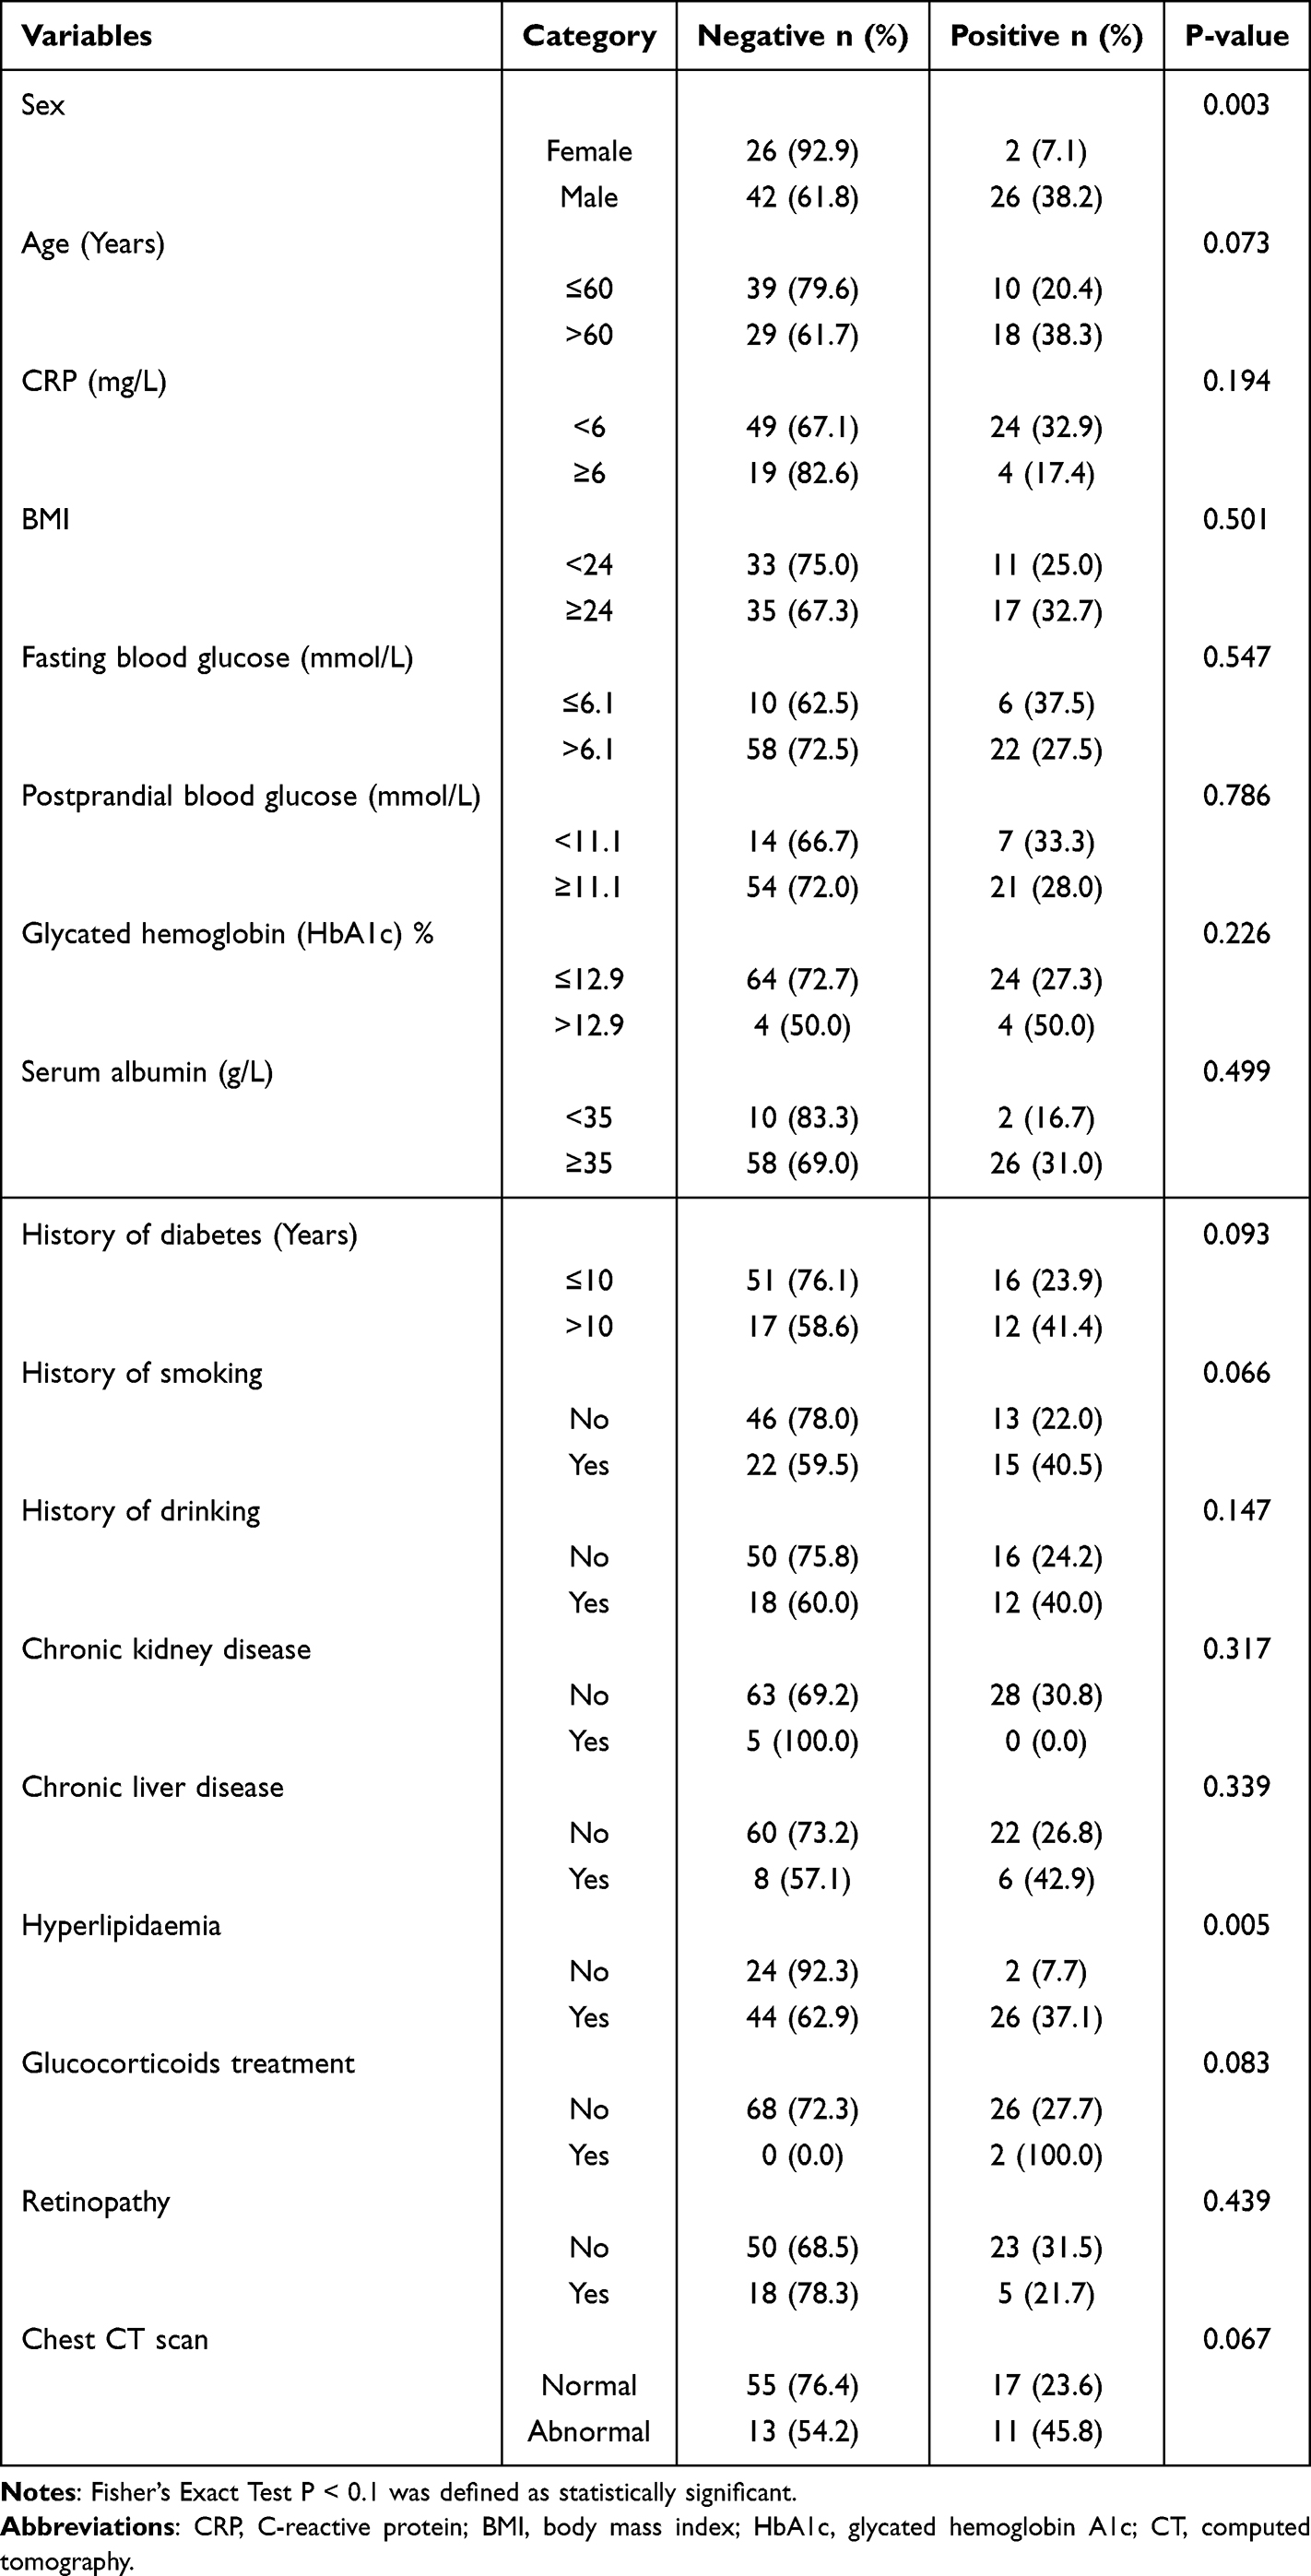 |
Table 3 Univariate Difference Analysis of Potential Influencing Factors of QFT-PLUS Test Results in Diabetic Patients (N=96) |
By using the backward elimination method and following the AIC minimum guideline, the multivariate logistic regression model identified significant associations between gender (male vs female, OR: 26.886, 95% CI: 5.224–231.700, p<0.001), age (>60 years vs ≤60 years, OR: 4.994, 95% CI: 1.583–17.610, p=0.008) and hyperlipidaemia (yes vs no, OR: 10.637, 95% CI: 2.299–82.340, p=0.007) with LTBI. Furthermore, duration of diabetes showed a borderline association (>10 vs ≤10 years, OR: 3.450, 95% CI: 1.000–13.240, p=0.056) (Table 4). It should be noted that the wide confidence intervals observed for gender and hyperlipidaemia reflect the limited statistical power inherent in our modest sample size (28 LTBI cases in the DM group), and these estimates should be interpreted as indicating the direction and potential magnitude of association rather than precise effect sizes. In particular, the notably high OR for hyperlipidaemia may partly reflect its role as a surrogate marker for overall metabolic dysregulation and disease severity rather than solely an independent causal factor.
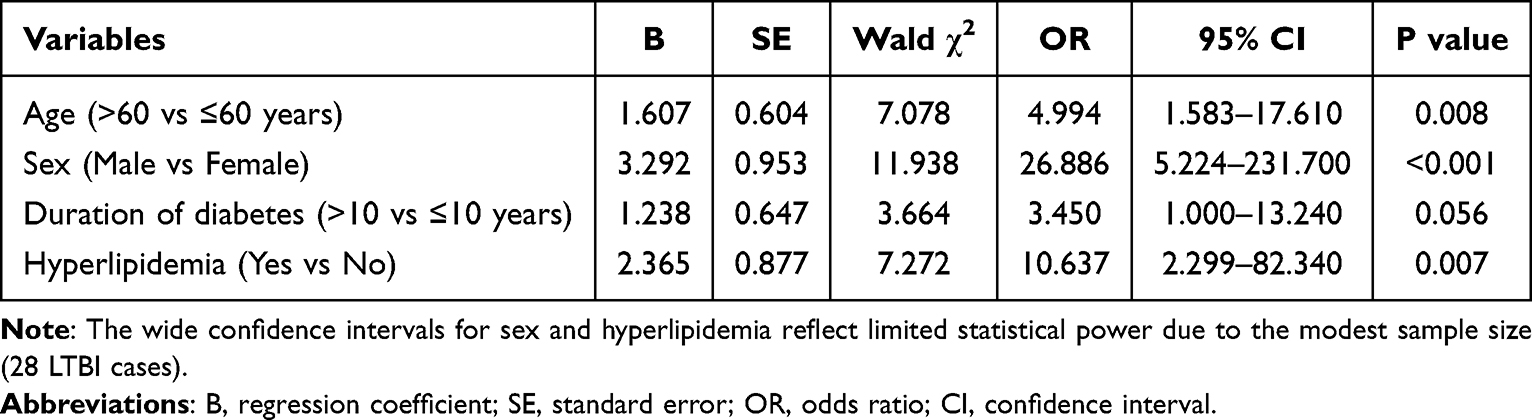 |
Table 4 Multivariate Logistic Regression Analysis for LTBI in Diabetes Mellitus Patients |
Construction and Validation of Predictive Models
A comprehensive model was created using four independent predictor variables: age, gender, diabetes duration and hyperlipidaemia. The probability of patients with DM developing LTBI was predicted using a nomogram (Figure 3). The predictive model displayed an AUC of 0.847 (95% CI: 0.765–0.928), and internal validation using bootstrap resampling (n=500) resulted in a similar AUC of 0.791 (95% CI: 0.682–0.901). The model had a mean absolute error of 0.043, indicating strong agreement (Figure 4). The goodness-of-fit of the model was confirmed using the Hosmer–Lemeshow test (Figure 5). Decision curve analysis showed threshold probabilities of net benefit between 3% and 88%, and the model has good clinical applicability (Figure 6).
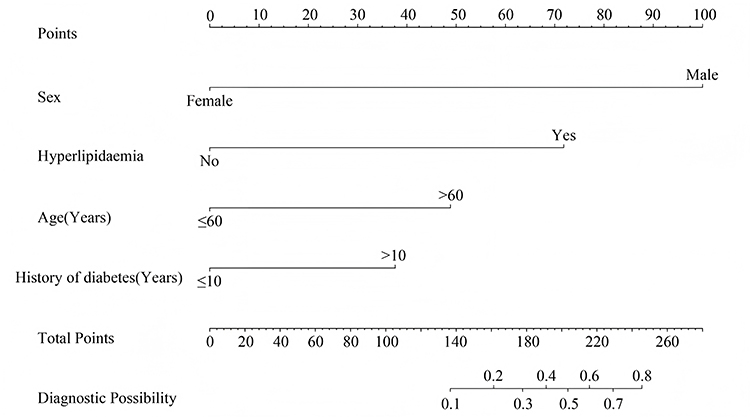 |
Figure 3 Nomogram for predicting LTBI probability in patients with diabetes mellitus. Each predictor variable is assigned a point score on the top scale, and the sum of all points corresponds to the predicted probability of LTBI on the bottom scale. Higher cumulative scores indicate a greater probability of LTBI. |
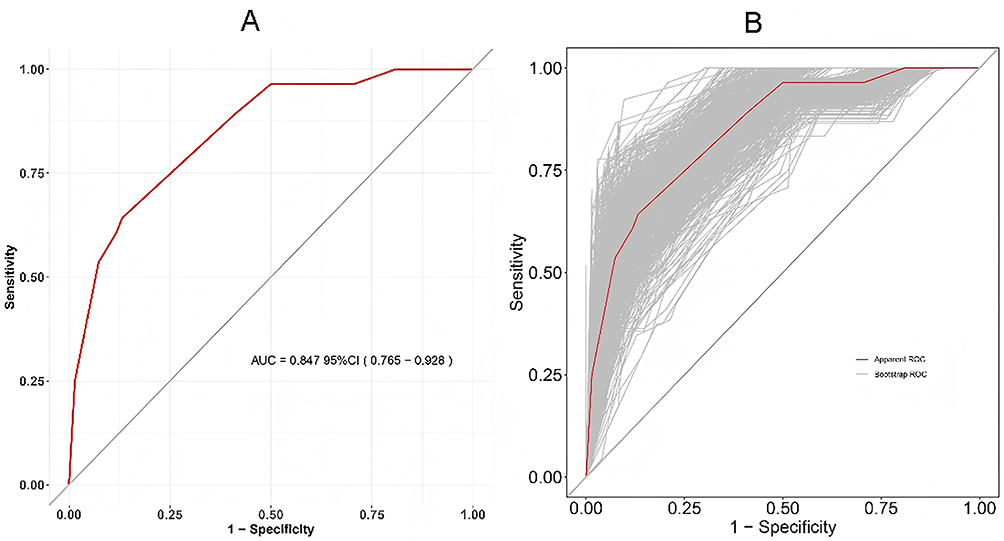 |
Figure 4 Receiver operating characteristic curves demonstrating model discrimination. (A) AUC of the predictive model (AUC=0.847, 95% CI: 0.765–0.928). (B) Internal validation through bootstrap resampling (n=500) showing the apparent ROC curve (red) and bootstrap ROC curves (grey). Abbreviations: AUC, area under the curve; CI, confidence interval. |
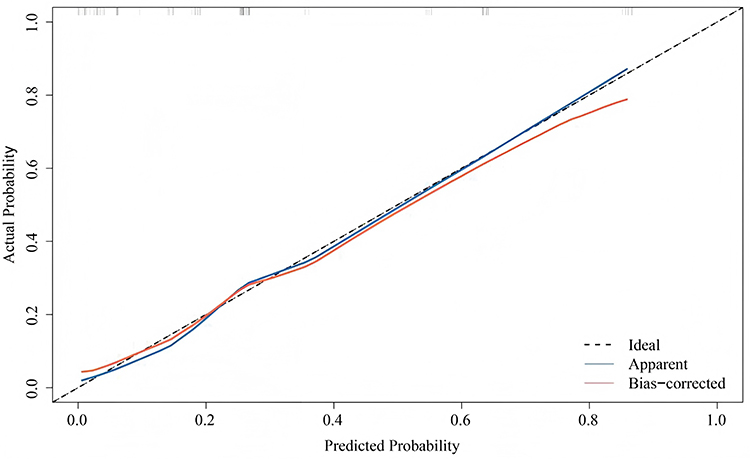 |
Figure 5 Calibration plot assessing agreement between predicted and observed LTBI probabilities. The X-axis represents the model’s predicted probability and the Y-axis represents the actual probability of LTBI occurrence. The ideal prediction is depicted by the black 45° dashed line. The apparent calibration (blue line) and bias-corrected calibration after bootstrapping (red line) demonstrate good prediction accuracy (mean absolute error=0.043). |
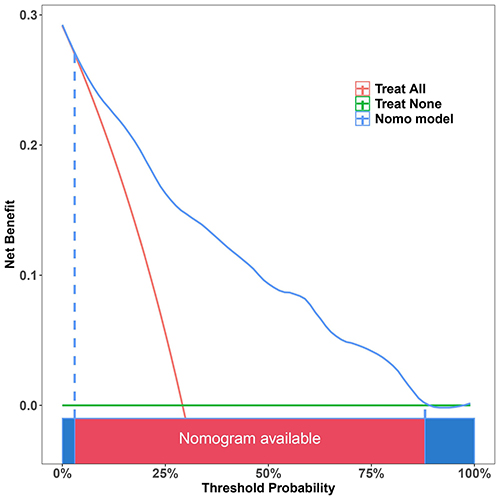 |
Figure 6 Decision curve analysis evaluating the clinical utility of the predictive model. The nomogram (blue line) demonstrates net benefit across threshold probabilities of 3%–88%, compared with the strategies of treating all patients (red line) and treating none (green line), indicating broad clinical applicability. |
Sensitivity Analyses
When adding smoking to the multivariable model (Model B), the direction and magnitude of core predictors remained materially unchanged: gender (OR: 24.332, 95% CI: 4.812–208.451), age >60 (OR: 4.687, 95% CI: 1.421–16.234), hyperlipidaemia (OR: 9.854, 95% CI: 2.087–76.432), while smoking showed borderline association (OR: 2.156, 95% CI: 0.987–5.234, p=0.054). Further adjustment for HbA1c and retinopathy (Models C–D) yielded consistent estimates across specifications, suggesting limited residual confounding from measured lifestyle/metabolic factors. Across all four model specifications, the AUC values were: Model A, 0.847; Model B, 0.856; Model C, 0.861; and Model D, 0.864, indicating that the additional variables provided only marginal improvements in discrimination (Supplementary Table S1).
HbA1c and Metabolic Complications
Higher HbA1c levels were associated with increased odds of LTBI up to approximately 9.0% with plateau thereafter (spline-based analysis). In categorical analyses, compared with HbA1c <7.0%, the adjusted ORs were 1.43 (95% CI: 0.76–2.89) for 7.0–8.9% and 2.21 (95% CI: 1.12–4.87) for ≥9.0%. Retinopathy showed modest association with LTBI after multivariable adjustment (OR: 1.87, 95% CI: 0.91–3.76).
Model Performance Metrics
Internal validation yielded an optimism-corrected AUC of 0.791 (95% CI: 0.682–0.901), calibration slope 0.856, intercept −0.124, and Brier score 0.164, indicating reasonable discrimination with mild overfitting that was corrected through bootstrap adjustment.
Discussion
This study evaluated the contribution of QFT-PLUS in detecting LTBI among patients with DM and developed a predictive model based on its findings. Our key findings are as follows: (1) the prevalence of LTBI was significantly higher in patients with DM (29.2%) compared with healthy controls (16.2%, p=0.039); (2) multivariate logistic regression identified age >60 years, male gender, diabetes duration >10 years, and hyperlipidaemia as significant independent predictors of LTBI; and (3) the resulting nomogram demonstrated good discriminative capacity (AUC=0.847) and clinical utility across a broad range of threshold probabilities. Importantly, the control group was included to contextualise LTBI prevalence in diabetic versus non-diabetic individuals, while the predictive model was developed exclusively within the DM cohort for risk stratification purposes.
The significant global burden of TB persists, with China ranking third globally for new TB cases. The heightened risk of LTBI among patients with DM residing in TB endemic regions is widely acknowledged. Patients with DM with weakened immune systems are more prone to latent or ATB reactivation.22 Research in Taiwan found a 21.5% LTBI positivity rate in patients with DM,14 and a study in South India reported a 21% LTBI prevalence in such individuals.15 These results align with our own investigation. Additionally, a study in Rio de Janeiro, Brazil, demonstrated an even higher LTBI detection rate of 45.4% among patients with type 2 diabetes.16 A meta-analysis of 22 scientific studies confirmed a strong connection between DM and LTBI.12 In relation to LTBI, the majority of prior research has utilised the TST and QuantiFERON-TB Gold In-Tube test for LTBI status evaluation, with a focus on high-risk populations such as healthcare workers, close contacts and students. Limited research has been conducted regarding diabetes specifically. The QFT-PLUS test demonstrates diagnostic accuracy comparable to both T-SPOT and the traditional TST for ATB detection in adults, and the updated TB2 tube can activate the antigenic response of CD8+ T cells, assisting in the detection of recent TB exposure.13
A nomogram was developed to predict the probability of LTBI in patients with DM, comprising four factors: age, gender, length of diabetes duration and hyperlipidaemia. It should be emphasised that this model is intended as a risk prioritisation tool to guide targeted QFT-PLUS screening rather than a diagnostic replacement for the QFT-PLUS test itself. Clinicians may use this tool to identify patients with DM who are at highest risk and should be prioritised for formal LTBI testing, thereby improving screening efficiency and resource allocation in settings where universal testing is impractical.
Diabetes mellitus is a persistent metabolic condition characterised by elevated blood glucose levels, where an extended duration of the illness serves as a crucial indicator of complications and mortality associated with diabetes.23 The present research found an association between the duration of DM and LTBI, in line with Yoo et al’s research, which showed a greater prevalence of TB in patients with DM for ≥5 years.24 Nonetheless, this differs from research conducted in Taiwan, which did not identify a relationship between the duration of diabetes and the risk of LTBI.25 One potential reason for this inconsistency may be the impact of interventions for controlling blood sugar levels implemented following the diagnosis of diabetes, which could potentially affect the response to QFT testing.26
In the present study, hyperlipidaemia refers to elevated triglycerides, which have been noted in previous studies to increase the risk of TB in patients with type 2 diabetes and even cause poor treatment outcomes in TB.27 Notably, the high OR observed for hyperlipidaemia (10.637) with its wide confidence interval (2.299–82.340) suggests that this predictor may be unstable due to the small number of LTBI cases. Hyperlipidaemia may function as a surrogate marker for overall metabolic dysregulation and disease severity rather than serving as an independent causal factor. The link between dyslipidaemia and LTBI risk may involve altered lipid metabolism affecting macrophage function and Mycobacterium tuberculosis survival within host cells.
Previous studies have identified smoking, older age and male gender as risk factors for LTBI.10 A study conducted on adults in rural areas further supported this by showing that men had a higher risk for LTBI (OR: 1.32, 95% CI: 1.01–1.72).28 The increased risk in men has been attributed to their increased participation in social activities and greater exposure to risk factors such as smoking and excessive alcohol consumption, which can heighten their susceptibility to M. tuberculosis infection.29 Both active smoking and exposure to second-hand smoke have been significantly linked to LTBI.30–32 One potential reason for this association is that smoking can compromise innate barrier protection, thereby weakening the function of key immune cells.33 In this study, smoking was found to be associated with LTBI only in the univariate analysis (Table 3), highlighting the need for further research to establish the relationship between LTBI and smoking.
Age also plays a crucial role in influencing the risk of TB in patients with diabetes. A previous cross-sectional study indicated a higher prevalence of ATB among patients with diabetes aged 45–64 years, suggesting a potential correlation with also harbouring LTBI.10 Another study from Taiwan demonstrated a higher prevalence of LTBI in patients with DM over 50 years old compared with younger age groups.14 In line with these findings, the present study determined that the mean age of individuals testing positive in the QFT-PLUS test was 61.5 years. Recent data suggest a strong association between patients with DM aged ≥40 years and LTBI.34 Advanced age may increase LTBI risk due to cumulative exposure time and age-related immunosenescence, while the higher risk in men could be attributed to both behavioural factors and biological differences in immune responses.
The decision curve analysis demonstrated that the nomogram provides a net benefit across threshold probabilities of 3%–88%, indicating good clinical utility. From a practical standpoint, this model offers advantages over alternative screening strategies: compared with a “treat all” approach (universal QFT-PLUS testing for all patients with DM), the model-based strategy reduces unnecessary testing by identifying low-risk individuals who may not require immediate screening; compared with a “treat none” approach (no screening), it ensures that high-risk individuals are identified and offered testing. In resource-limited settings where universal QFT-PLUS testing is not feasible, this model could serve as a first-step triage tool, directing limited QFT-PLUS testing resources toward patients most likely to benefit.
The prevalence of LTBI in individuals with DM is notable in nations with a large number of TB cases, emphasising the necessity of prompt detection and intervention for this vulnerable group. While the WHO currently does not recommend routine TB screening for individuals with diabetes in resource-limited settings, exceptions include co-infection with HIV, close contacts with patients with TB and compromised immune systems. Employing predictive modelling and pertinent risk factors to evaluate TB vulnerability in patients with DM could improve the effectiveness and accuracy of TB screening. Our findings have several implications for clinical practice: male patients with DM over 60 years old with a long disease duration and hyperlipidaemia could be prioritised for LTBI screening and considered for preventive therapy even in the absence of known TB exposure.
Poor glycaemic control and chronic diabetic complications plausibly impair host immunity (eg., neutrophil function, T-cell responses), increasing susceptibility to M. tuberculosis infection. Our spline and categorical analyses support a graded relationship between HbA1c and LTBI risk, with a threshold effect around 9.0%. Additionally, the association between diabetes duration and LTBI likely reflects the progressive immune dysfunction associated with chronic hyperglycaemia.
Our study did not systematically collect household/occupational TB exposure and socioeconomic indicators, which are plausible confounders because they co-vary with both diabetes and LTBI risk. The consistency of estimates after adjustment for smoking—a correlated behaviour—provides partial reassurance. E-value calculation indicated that an unmeasured confounder associated with both exposure and outcome by a risk ratio of at least 3.2 could explain away the observed association for hyperlipidaemia, and 2.8 for age. These thresholds appear larger than typical associations reported for single socioeconomic indicators, yet we acknowledge potential residual confounding and call for future datasets with granular exposure histories.
Future research should prioritise several key areas. First, longitudinal studies examining the transition from LTBI to ATB in patients with DM could provide insights into the interplay between risk factors and disease progression. Second, investigating the impact of improved glycaemic control and lipid management on LTBI risk could inform integrated care strategies. Third, the development of more comprehensive predictive models should incorporate socioeconomic determinants of health, detailed lifestyle assessments and broader comorbidity profiles. Fourth, multicentre validation studies with larger sample sizes are needed to confirm our findings and improve the precision of risk estimates before clinical implementation. Finally, prospective studies with longer follow-up periods would provide valuable insights into the dynamics of LTBI development and progression in patients with DM over time.
Limitations
Several limitations of this study should be acknowledged. First, the utilisation of self-reported data for variables such as smoking, alcohol consumption and diabetes duration could potentially result in reporting biases. Second, this study was conducted at a single centre with a limited sample size (n=195, with only 28 LTBI cases in the DM group), which falls short of the recommended minimum of 10 events per predictor variable for logistic regression model development. This modest sample size is reflected in the wide confidence intervals observed for some predictors, particularly gender (OR: 26.886, 95% CI: 5.224–231.700) and hyperlipidaemia (OR: 10.637, 95% CI: 2.299–82.340), indicating considerable uncertainty in our estimates. While our findings suggest strong associations, these results should be interpreted with caution, and larger studies are needed to provide more precise estimates. Third, we did not systematically collect data on antidiabetic treatment types (insulin vs. oral hypoglycaemic agents vs. combination therapy). Insulin use in particular often serves as a proxy for disease severity and could confound the observed associations; patients requiring insulin may have more advanced disease, greater immune dysfunction, and consequently higher LTBI susceptibility independent of the metabolic factors we measured. Future studies should incorporate treatment regimens and complication burden to disentangle glycaemic control from therapeutic selection effects. Fourth, unmeasured variables such as dietary habits, living environment, household TB exposure and socioeconomic status could influence LTBI risk. Fifth, the cross-sectional nature of this study precludes causal inferences and longitudinal observations of LTBI development. Sixth, only internal validation using bootstrap resampling was performed; external validation in independent cohorts from diverse populations, healthcare settings and geographic regions with varying TB epidemiology is essential before clinical implementation. Without external validation, we cannot confidently recommend clinical deployment of this model.
Conclusion
This study developed and internally validated a QFT-PLUS-based predictive model for identifying LTBI risk in patients with diabetes. Among patients with DM, 29.2% had LTBI compared with 16.2% of healthy controls, confirming the elevated risk in this vulnerable population. The final predictive model, incorporating four readily available clinical parameters—age >60 years, male gender, diabetes duration >10 years and presence of hyperlipidaemia—achieved good discriminative performance (AUC: 0.847, 95% CI: 0.765–0.928) with satisfactory calibration and clinical utility across a wide range of threshold probabilities. This model provides a practical risk prioritisation tool for healthcare providers to identify high-risk patients with DM who should be prioritised for formal LTBI testing, enabling more targeted and cost-effective screening strategies in resource-limited high TB burden settings. However, this model requires external validation in diverse populations before clinical implementation, and future multicentre studies with larger sample sizes are strongly recommended.
Data Sharing Statement
The data that support the findings of this study are available from the corresponding author upon reasonable request.(Further enquiries can be directed to the corresponding author “Jichan Shi”).
Ethics Approval and Consent to Participate
This study was conducted in accordance with the Declaration of Helsinki and approved by the ethics committee of Wenzhou Central Hospital (L2024-05-017), and written informed consent was obtained from all participants.
Funding
There are no funding sources in relation to this paper.
Disclosure
The authors declare no competing interests.
References
1. Tesema E, Biru M, Leta T, et al. Drug-resistant tuberculosis care and treatment outcomes over the last 15 years in Ethiopia: results from a mixed-method review of trends. PLoS One. 2024;19(8):e0306076. doi:10.1371/journal.pone.0306076
2. Mudzengi DL, Chomutare H, Nagudi J, et al. Using mHealth technologies for case finding in tuberculosis and other infectious diseases in Africa: systematic review. JMIR mHealth uHealth. 2024;12:e53211. doi:10.2196/53211
3. Li Z, Hu Y, Wang W, et al. Integrating pathogen- and host-derived blood biomarkers for enhanced tuberculosis diagnosis: a comprehensive review. Front Immunol. 2024;15:1438989. doi:10.3389/fimmu.2024.1438989
4. Venkatappa TK, Punnoose R, Katz DJ, et al. Comparing QuantiFERON-TB gold plus with other tests to diagnose mycobacterium tuberculosis infection. J Clin Microbiol. 2019;57(11):e00985–15. doi:10.1128/JCM.00985-19
5. Zhang L, Yang Z, Bao X, et al. Comparison of diagnostic accuracy of QuantiFERON-TB gold plus and T-SPOT.TB in the diagnosis of active tuberculosis in febrile patients. J Evid Based Med. 2022;15(2):97–105. doi:10.1111/jebm.12477
6. Sotgiu G, Saderi L, Petruccioli E, et al. QuantiFERON TB gold plus for the diagnosis of tuberculosis: a systematic review and meta-analysis. J Infect. 2019;79(5):444–453. doi:10.1016/j.jinf.2019.08.018
7. Rafi MA, Semanta S, Shahriar T, et al. An approach to integrated management of diabetes in tuberculosis patients: availability and readiness of the health facilities of Bangladesh. PLoS One. 2024;19(8):e0309372. doi:10.1371/journal.pone.0309372
8. Irace C, Carallo C, Scavelli F, et al. Blood viscosity in subjects with normoglycemia and prediabetes. Diabetes Care. 2014;37(2):488–492. doi:10.2337/dc13-1374
9. Yan Z. Discussion on pulmonary tuberculosis complicated with diabetes. Chinese Community Doctors. 2015;(25):10.
10. Ponce-De-Leon A, Garcia-Garcia MDL, Garcia-Sancho MC, et al. Tuberculosis and diabetes in southern Mexico. Diabetes Care. 2004;27(7):1584–1590. doi:10.2337/diacare.27.7.1584
11. Li C, Hong X, Liu Q, et al. Blood glucose control and risk of tuberculosis: a population-based cohort study. Chin J Dis Control. 2022;26(11):1241–1247.
12. Zhou G, Guo X, Cai S, et al. Diabetes mellitus and latent tuberculosis infection: an updated meta-analysis and systematic review. BMC Infect Dis. 2023;23(1):770. doi:10.1186/s12879-023-08775-y
13. Antonio-Arques V, Franch-Nadal J, Moreno-Martinez A, et al. Subjects with diabetes mellitus are at increased risk for developing tuberculosis: a cohort study in an inner-city district of Barcelona (Spain). Front Public Health. 2022;10:789952. doi:10.3389/fpubh.2022.789952
14. Chang A, Wu C-Z, Lin J-D, et al. Prevalence and risk factors for latent tuberculosis among diabetes patients in Taiwan: a cross-sectional study. J Infect Dev Ctries. 2022;16(04):644–649. doi:10.3855/jidc.15839
15. Munisankar S, Rajamanickam A, Balasubramanian S, et al. Prevalence of proximate risk factors of active tuberculosis in latent tuberculosis infection: a cross-sectional study from South India. Front Public Health. 2022;10:1011388. doi:10.3389/fpubh.2022.1011388
16. Torres AV, Corrêa RDS, Bevilacqua MDF, et al. Screening of latent tuberculosis infection among patients with diabetes mellitus from a high-burden area in Brazil. Front Clin Diabetes Healthcare. 2022;3:914574. doi:10.3389/fcdhc.2022.914574
17. Huang C-Y, Zuo M-T, Qi X-J, et al. Hypoxia tolerance determine differential gelsenicine-induced neurotoxicity between pig and mouse. BMC Pulm Med. 2025;23(1):156. doi:10.1186/s12916-025-03984-5
18. Tong H, Zhang F, Sun J, et al. Meta-organism gene expression reveals that the impact of nitrate enrichment on coral larvae is mediated by their associated Symbiodiniaceae and prokaryotic assemblages. Microbiome. 2023;11(1):89. doi:10.1186/s40168-023-01495-0
19. Petruccioli E, Chiacchio T, Pepponi I, et al. First characterization of the CD4 and CD8 T-cell responses to QuantiFERON-TB Plus. J Infect. 2016;73(6):588–597. doi:10.1016/j.jinf.2016.09.008
20. World Health Organization. Latent Tuberculosis Infection: Updated and Consolidated Guidelines for Programmatic Management. Geneva: WHO; 2018.
21. Royston P, Moons KG, Altman DG, Vergouwe Y. Prognosis and prognostic research: developing a prognostic model. BMJ. 2009;338(mar31 1):b604. doi:10.1136/bmj.b604
22. Kumar NP, Sridhar R, Banurekha VV, et al. Type 2 diabetes mellitus coincident with pulmonary tuberculosis is associated with heightened systemic type 1, type 17, and other proinflammatory cytokines. Ann Am Thorac Soc. 2013;10(5):441–449. doi:10.1513/AnnalsATS.201305-112OC
23. Herrington WG, Alegre-Díaz J, Wade R, et al. Effect of diabetes duration and glycaemic control on 14-year cause-specific mortality in Mexican adults: a blood-based prospective cohort study. Lancet Diabetes Endocrinol. 2018;6(6):455–463. doi:10.1016/S2213-8587(18)30050-0
24. Yoo JE, Kim D, Han K, et al. Diabetes status and association with risk of tuberculosis among Korean adults. JAMA Netw Open. 2021;4(9):e2126099. doi:10.1001/jamanetworkopen.2021.26099
25. Lin C-H, Kuo S-C, Hsieh M-C, et al. Effect of diabetes mellitus on risk of latent TB infection in a high TB incidence area: a community-based study in Taiwan. BMJ Open. 2019;9(10):e029948. doi:10.1136/bmjopen-2019-029948
26. Chen ZF, Liu Q, Song RR, et al. The association of glycemic level and prevalence of tuberculosis: a meta-analysis. BMC Endocr Disord. 2021;21(1):123. doi:10.1186/s12902-021-00779-6
27. Ngo MD, Bartlett S, Ronacher K. Diabetes-associated susceptibility to tuberculosis: contribution of hyperglycemia vs. dyslipidemia. Microorganisms. 2021;9(11):2282. doi:10.3390/microorganisms9112282
28. Wang W, Chen X, Chen S, et al. The burden and predictors of latent tuberculosis infection among elder adults in high epidemic rural area of tuberculosis in Zhejiang, China. Front Cell Infect Microbiol. 2022;12:990197. doi:10.3389/fcimb.2022.990197
29. He ZQ, Hu GF, Zi QL, et al. Discussion on the related factors affecting the incidence of male pulmonary tuberculosis. J Pract Med. 2012;28(23):3905–3907.
30. Hu X, Liu J, Shao Y, et al. Smoking exposure and the risk of latent tuberculosis infection: results from NHANES 2011–2012. Toxics. 2024;12(1):94. doi:10.3390/toxics12010094
31. Chen C, Hu X, Shao Y, et al. The association between diabetes status and latent-TB IGRA levels from a cross-sectional study in eastern China. Front Cell Infect Microbiol. 2023;12:1057298. doi:10.3389/fcimb.2022.1057298
32. Altet N, Latorre I, Jimenez-Fuentes MÁ, et al. Tobacco smoking and second-hand smoke exposure impact on tuberculosis in children. J Clin Med. 2022;11(7):2000. doi:10.3390/jcm11072000
33. Quan DH, Kwong AJ, Hansbro PM, et al. No smoke without fire: the impact of cigarette smoking on the immune control of tuberculosis. Eur Respir Rev. 2022;31(164):210252. doi:10.1183/16000617.0252-2021
34. Smith AGC, Kempker RR, Wassie L, et al. The impact of diabetes and prediabetes on prevalence of mycobacterium tuberculosis infection among household contacts of active tuberculosis cases in Ethiopia. Open Forum Infect Dis. 2022;9(7):ofac323. doi:10.1093/ofid/ofac323
 © 2026 The Author(s). This work is published and licensed by Dove Medical Press Limited. The
full terms of this license are available at https://www.dovepress.com/terms
and incorporate the Creative Commons Attribution
- Non Commercial (unported, 4.0) License.
By accessing the work you hereby accept the Terms. Non-commercial uses of the work are permitted
without any further permission from Dove Medical Press Limited, provided the work is properly
attributed. For permission for commercial use of this work, please see paragraphs 4.2 and 5 of our Terms.
© 2026 The Author(s). This work is published and licensed by Dove Medical Press Limited. The
full terms of this license are available at https://www.dovepress.com/terms
and incorporate the Creative Commons Attribution
- Non Commercial (unported, 4.0) License.
By accessing the work you hereby accept the Terms. Non-commercial uses of the work are permitted
without any further permission from Dove Medical Press Limited, provided the work is properly
attributed. For permission for commercial use of this work, please see paragraphs 4.2 and 5 of our Terms.
Recommended articles
Risk Factors and Predictive Model for Dermatomyositis Associated with Rapidly Progressive Interstitial Lung Disease
Wang K, Tian Y, Liu S, Zhang Z, Shen L, Meng D, Li J
Pharmacogenomics and Personalized Medicine 2022, 15:775-783
Published Date: 1 September 2022
Development and Validation of Machine Learning Models for Prediction of Fracture Risk in Patients with Elderly-Onset Rheumatoid Arthritis
Chen R, Huang Q, Chen L
International Journal of General Medicine 2022, 15:7817-7829
Published Date: 14 October 2022
The Incidence, Risk Factors, and Predictive Model of Obstructive Disease in Post-Tuberculosis Patients
Chang W, Li Z, Liang Q, Zhao W, Li F
International Journal of Chronic Obstructive Pulmonary Disease 2024, 19:2457-2466
Published Date: 19 November 2024
A Nomogram Predictive Model for Drug-Resistant Tuberculosis Detection by GeneXpert MTB/RIF Assay in Paediatric Patients
Wang L, Ma W, Wei N, Guo W, Zhao D, Zhou N, Guo X, Han M, Zhang F, Guo C, Li S
Infection and Drug Resistance 2026, 19:542863
Published Date: 13 February 2026