Back to Journals » International Journal of General Medicine » Volume 15
Development and Validation of Machine Learning Models for Prediction of Fracture Risk in Patients with Elderly-Onset Rheumatoid Arthritis
Authors Chen R, Huang Q, Chen L
Received 29 June 2022
Accepted for publication 30 September 2022
Published 14 October 2022 Volume 2022:15 Pages 7817—7829
DOI https://doi.org/10.2147/IJGM.S380197
Checked for plagiarism Yes
Review by Single anonymous peer review
Peer reviewer comments 3
Editor who approved publication: Dr Scott Fraser
Renming Chen, Qin Huang, Lihua Chen
Department of Nephropathy and Rheumatology,The Central Hospital of Enshi Tujia and Miao Autonomous Prefecture, Enshi, 445000, People’s Republic of China
Correspondence: Lihua Chen, Department of Nephropathy and Rheumatology,The Central Hospital of Enshi Tujia and Miao Autonomous Prefecture, 158 Wuyang County Street, Enshi, Hubei, People’s Republic of China, Tel +86 0718-8263471, Email [email protected]
Objective: Fracture is a critical unfavorable prognostic factor in patients with rheumatoid arthritis(RA) and osteoporosis. At present, models involving clinical indices that accurately predict fracture are still uncommon. We addressed this gap by developing machine learning (ML)-based predictive models to individualize the risk of fracture in elderly patients with RA and osteoporosis and to identify a high-risk group for fracture.
Methods: 487 patients diagnosed with RA and osteoporosis at the Central Hospital of Enshi Tujia and Miao Autonomous Prefecture were randomly divided into a training cohort (used for building the model) and a validation cohort (used for validating the model). Five ML-assisted models were developed from candidate clinical features using two-step estimation methods. The receiver operating characteristic curve (ROC), decision curve analysis (DCA), and clinical impact curve (CIC) were performed to evaluate the robustness and clinical practicability of each model.
Results: A total of twenty-two candidate variables were included, and the prediction model was established by an ML-based algorithm. The areas under the ROC curve (AUCs) of the random forest classifier (RFC) model, artificial neural network (ANN), support vector machine (SVM), eXtreme gradient boosting (XGBoost), decision tree (DT), probability of major osteoporotic fractures (PMOF), and probability of hip fracture (PHF) ranged from 0.695 to 0.878. Among them, RFC obtained the optimal prediction efficiency via adding serum selenium and clinical indices, that is, glucocorticoid, and erythrocyte sedimentation rate (ESR).
Conclusion: Based on the classic clinical parameters, the fracture risk of RA patients with osteoporosis can be accurately predicted. In particular, RFC prediction model shows good discrimination ability in identifying high-risk patients with fracture.
Keywords: rheumatoid arthritis, osteoporosis, fracture, machine learning algorithm, risk factor, predictive model
Introduction
Rheumatoid arthritis (RA) is a chronic inflammatory joint disease, which can lead to cartilage and bone damage and disability.1,2 In addition, local and systemic bone loss is one of the major extraarticular complications of RA and leads to an increased risk of brittle fracture, which further impairs functional ability, quality of life, and life expectancy.3,4 Alarmingly, the incidence rate of osteoporosis in elderly-onset rheumatoid arthritis (EORA) patients has an upward trend in clinical practice.5,6 The secondary fracture and osteoporosis-related pain in RA patients with osteoporosis can directly lead to the reduction of the quality of life of patients. Therefore, timely fracture risk management is urgently needed for RA patients with osteoporosis.
In the elderly, the presence of complications and the increase of drug-related adverse reactions pose specific treatment challenges.6 Although glucocorticoids can reduce clinical activity in the short term and may also reduce structural damage in the medium term, these benefits are offset by many adverse reactions (such as osteoporosis, fracture, etc.).7 Therefore, it is of positive significance for clinical treatment to clarify the fracture risk and related influencing factors of RA patients with osteoporosis. At least, to support the balance between over treatment and under treatment, it is necessary to study and propose many strategies to select patients who may omit fracture.
Currently, most risk stratification systems and prediction models are based on classical clinical parameters. For example, a genome-wide polygenic risk score (PRS) was more strongly associated with the risk of fracture, which could define patients with high-risk fracture.8 Susan et al established FRAX(®) calculations to predict the risk of fracture in patients with RA.9 Samaneh et al developed the trabecular bone score (TBS) that predicts fracture risk better than bone mineral density (BMD). However, these risk stratification systems and prediction models do not seem to be suitable for accurately predicting fractures, especially in elderly RA patients with osteoporosis. It is worth mentioning that the factors related to bone health play an important role in preventing osteoporosis and its adverse consequences. For instance, a meta-analysis study shows that selenium(Se) deficiency may be one of the risk factors for osteoporosis.10 Given this situation, adding predictive indexes based on existing models to increase prediction performance and discrimination is crucial.
Machine learning (ML) is increasingly recognized as a useful tool in healthcare applications.11 Nowadays, ML is widely used in the medical field, especially in cancer research, which shows great potential in all aspects, including the benchmark of cancer related issues, such as classification and prediction of cancer types, drug response and treatment strategies.12,13 In addition, the use of ML can also help improve the reliability, performance and accuracy of specific disease diagnosis systems.14,15 Compared with the traditional statistical model, ML-based integrated analysis is famous for ensuring the robustness of the model and improving the prediction accuracy through repeated iteration algorithms. In this study, we tried to apply ML-assisted decision-support models, using classical clinical parameters, to calculate the probability of fracture. This work may help to optimize the precise treatment and further improve the clinical efficacy of elderly RA patients with osteoporosis.
Materials and Methods
Study Population
We retrospectively analyzed the clinical records of 487 elderly patients with RA and osteoporosis who received blood biochemical measurements at the Central Hospital of Enshi Tujia and Miao Autonomous Prefecture of China from January 2015 to December 2021. The inclusion criteria were as follows: (i) RA diagnosis was clinically diagnosed by a committee-certified rheumatologist; (ii) Patient age ≥ 60 years old; (iii) Patient was accompanied with typical RA symptoms such as joint swelling, pain, deformity, and limited function. To minimize the confounding effects of circulating biomarkers, the exclusion criteria were as follows: (i)Patients with other autoimmune diseases (such as systemic lupus erythematosus, scleroderma, mixed connective tissue disease, etc.); (ii)Patients who continued to take drugs such as bisphosphate and estrogen within half a year; (iii) Patients with severe organic diseases (such as heart, liver, kidney, cerebrovascular diseases, etc.); (iv) The peripheral blood picture of the patient decreased significantly, such as the white blood cell count ≤ 3.0 × 10⁹/L, platelet count ≤ 8.0 × 10⁹/L, etc; (v) Patient was diagnosed with a malignant tumor. This study complies with the provisions of the Helsinki Declaration (revised in 2013) and was approved by the Institutional Review Committee of The Central Hospital of Enshi Tujia and Miao Autonomous Prefecture. The workflow for RA patient selection and model construction was summarized in Figure 1.
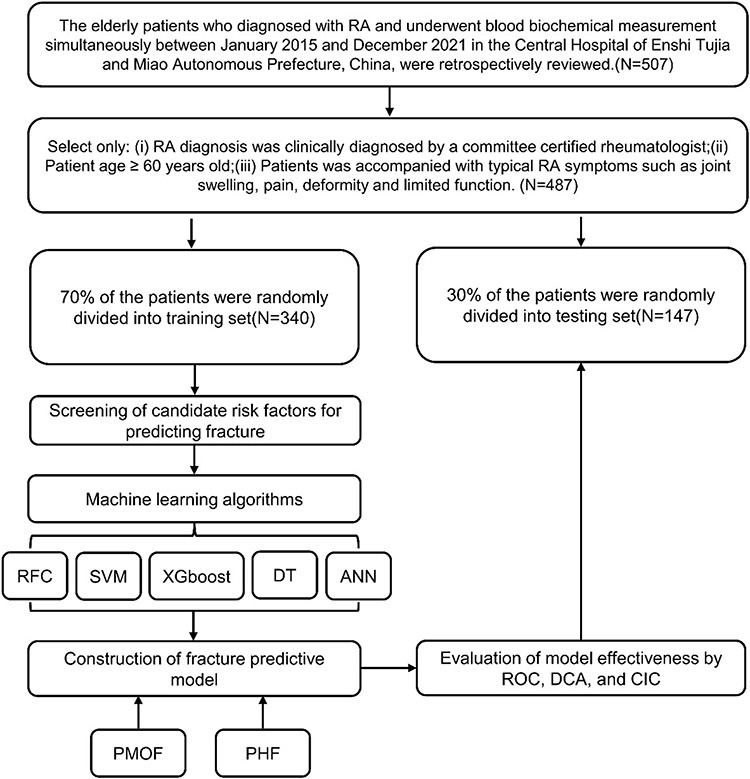 |
Figure 1 The flow chart of patient selection and data process. Abbreviations: RFC, random forest classifier; SVM, support vector machine; DT, decision tree; ANN, artificial neural network; XGboost, eXtreme gradient boosting; PMOF, probability of major osteoporotic fractures; PHF, probability of hip fracture. |
Data Collection and Quality Assessment
We extracted eighteen features including epidemiological, demographic, clinical, laboratory, radiological, and outcome data from an electronic case recording system, including gender composition, age, body mass index (BMI), waist circumference, RA course, fracture history, hip fracture of parents, smoking, long-term glucocorticoid treatment history (previous oral glucocorticoids for more than 3 months), daily alcohol intake ≥ 3 units, calcium intake and 28 joint disease activity (DAS28), calcium intake was judged according to the patient’s diet (for example, the daily intake of elemental calcium for adults is 800mg). For variables with missing values, the median was typically used. If ≥10% of values were missing for a given variable, it was excluded from variable screening for the final model. In addition, all data entries were entered and proofread by trained professionals. To reduce the risk of bias in the included data, all serological indicators were subject to the data collected for the first time after admission. In addition, the definition of RA disease activity: DAS28 score ≤ 2.6 is remission, 2.6–3.2 is low activity, 3.2–5.1 is moderate activity, and >5.1 is high activity.
Measurement of Bone Mineral Density(BMD)
A dual-energy X-ray bone densitometer (purchased from GE company of the United States, model: lu43616cn) was used for anteroposterior photography to measure the BMD of the patient’s lumbar spine, hip, and femoral neck. The T value was calculated according to the BMD reference value of healthy adults of the same sex and nationality.16 T value ≥ −1.0 indicates normal bone mass; −2.5<t value <-1.0 indicates bone loss; T value ≤ −2.5 indicates osteoporosis.
Fracture Risk Assessment
We input relevant risk indicators and BMD values from the FraX interface to calculate the 10-year probability of major osteoporotic fractures (PMOF) and hip fractures (PHF).17 Fracture risk: PMOF>20% indicates high risk, 10%~20% indicates medium risk, and <10% indicates low risk; PHF ≥ 3% indicates medium and high risk, and <3% indicates low risk.
Development and Validation of ML-Based Models
The data were randomly divided into a training set (70%) and a verification set (30%) to verify the prediction model. We trained the model with random variables and the results of 70% of patients. During model training, we installed ten-fold cross-validation to fine-tune model parameters without including baseline ML-based predictive models into the training set queue, that is, random forest classifier (RFC) model, artificial neural network (ANN), support vector machine(SVM), eXtreme gradient boosting (XGBoost), decision tree (DT).18 The increased weight of minority categories in the model can increase the identification of classification errors during training and improve the ability of the model to identify minority categories. The model variables (ie characteristic variables) were screened according to the principle of “OOB error”,19 as follows:
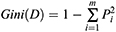
If the Gini index is smaller, the probability that the selected samples in the set will be mixed will be small, that is, the higher the purity of the set is, on the contrary, the more impure the set is. However, if all the samples in the set are of the same class, the Gini index approaches zero.20
Prediction Efficiency Evaluation of ML-Based Models
The optimal subset variables of the modeling were obtained based on the intersection of variable sets. The predictive performance of the model was evaluated by the receiver operating characteristic (ROC) curve, and evaluation indexes including area under the ROC curve (AUC), accuracy, sensitivity, specificity, positive predictive value (PPV), and negative predictive value (NPV). The discrimination ability of each model was quantified by the decision curve analysis (DCA) and clinical impact curve (CIC).21,22 That is, we call the ggDCA program, analyze all the included variables, and obtain the curve of the best prediction model through gradual screening. The farther away from the “threshold curve”, the best performance of the model will be considered.
Statistical Analysis
For descriptive analysis, median (IQR) and frequencies (%) were assessed for continuous and categorical variables, respectively. Bonferroni corrected probability values are used to compare the qualitative data.23 Wilcoxon rank-sum test or chi-square test was used to compare the differences between different groups. For parameters whose variables do not conform to normal distribution, Mann Whitney U-test was used for comparison between groups. All analysis was performed using the R Project for Statistical Computing (version 4.0.4, http://www.r-project.org/). All P values were two-tailed, and P <0.05 was considered statistically significant.
Results
Baseline Characteristics of the Study Population
The baseline characteristics of 487 hospitalized RA patients with osteoporosis were summarized in Table 1. For internal validation, patients were randomly divided into a training set (N=340, 70%) and a validation set (N=147, 30%) using the caretpackage. There were significant differences in age, BMI, RA course, long-term glucocorticoid treatment history, DAS28 score, ESR, RF, 25 hydroxyvitamin D3, PMOF, and PHF between the osteoporosis group and non-osteoporosis group (P<0.05). However, there were no significant differences in gender, calcium intake, waist circumference, fracture history, CRP, and anti-CCP antibody (P>0.05).
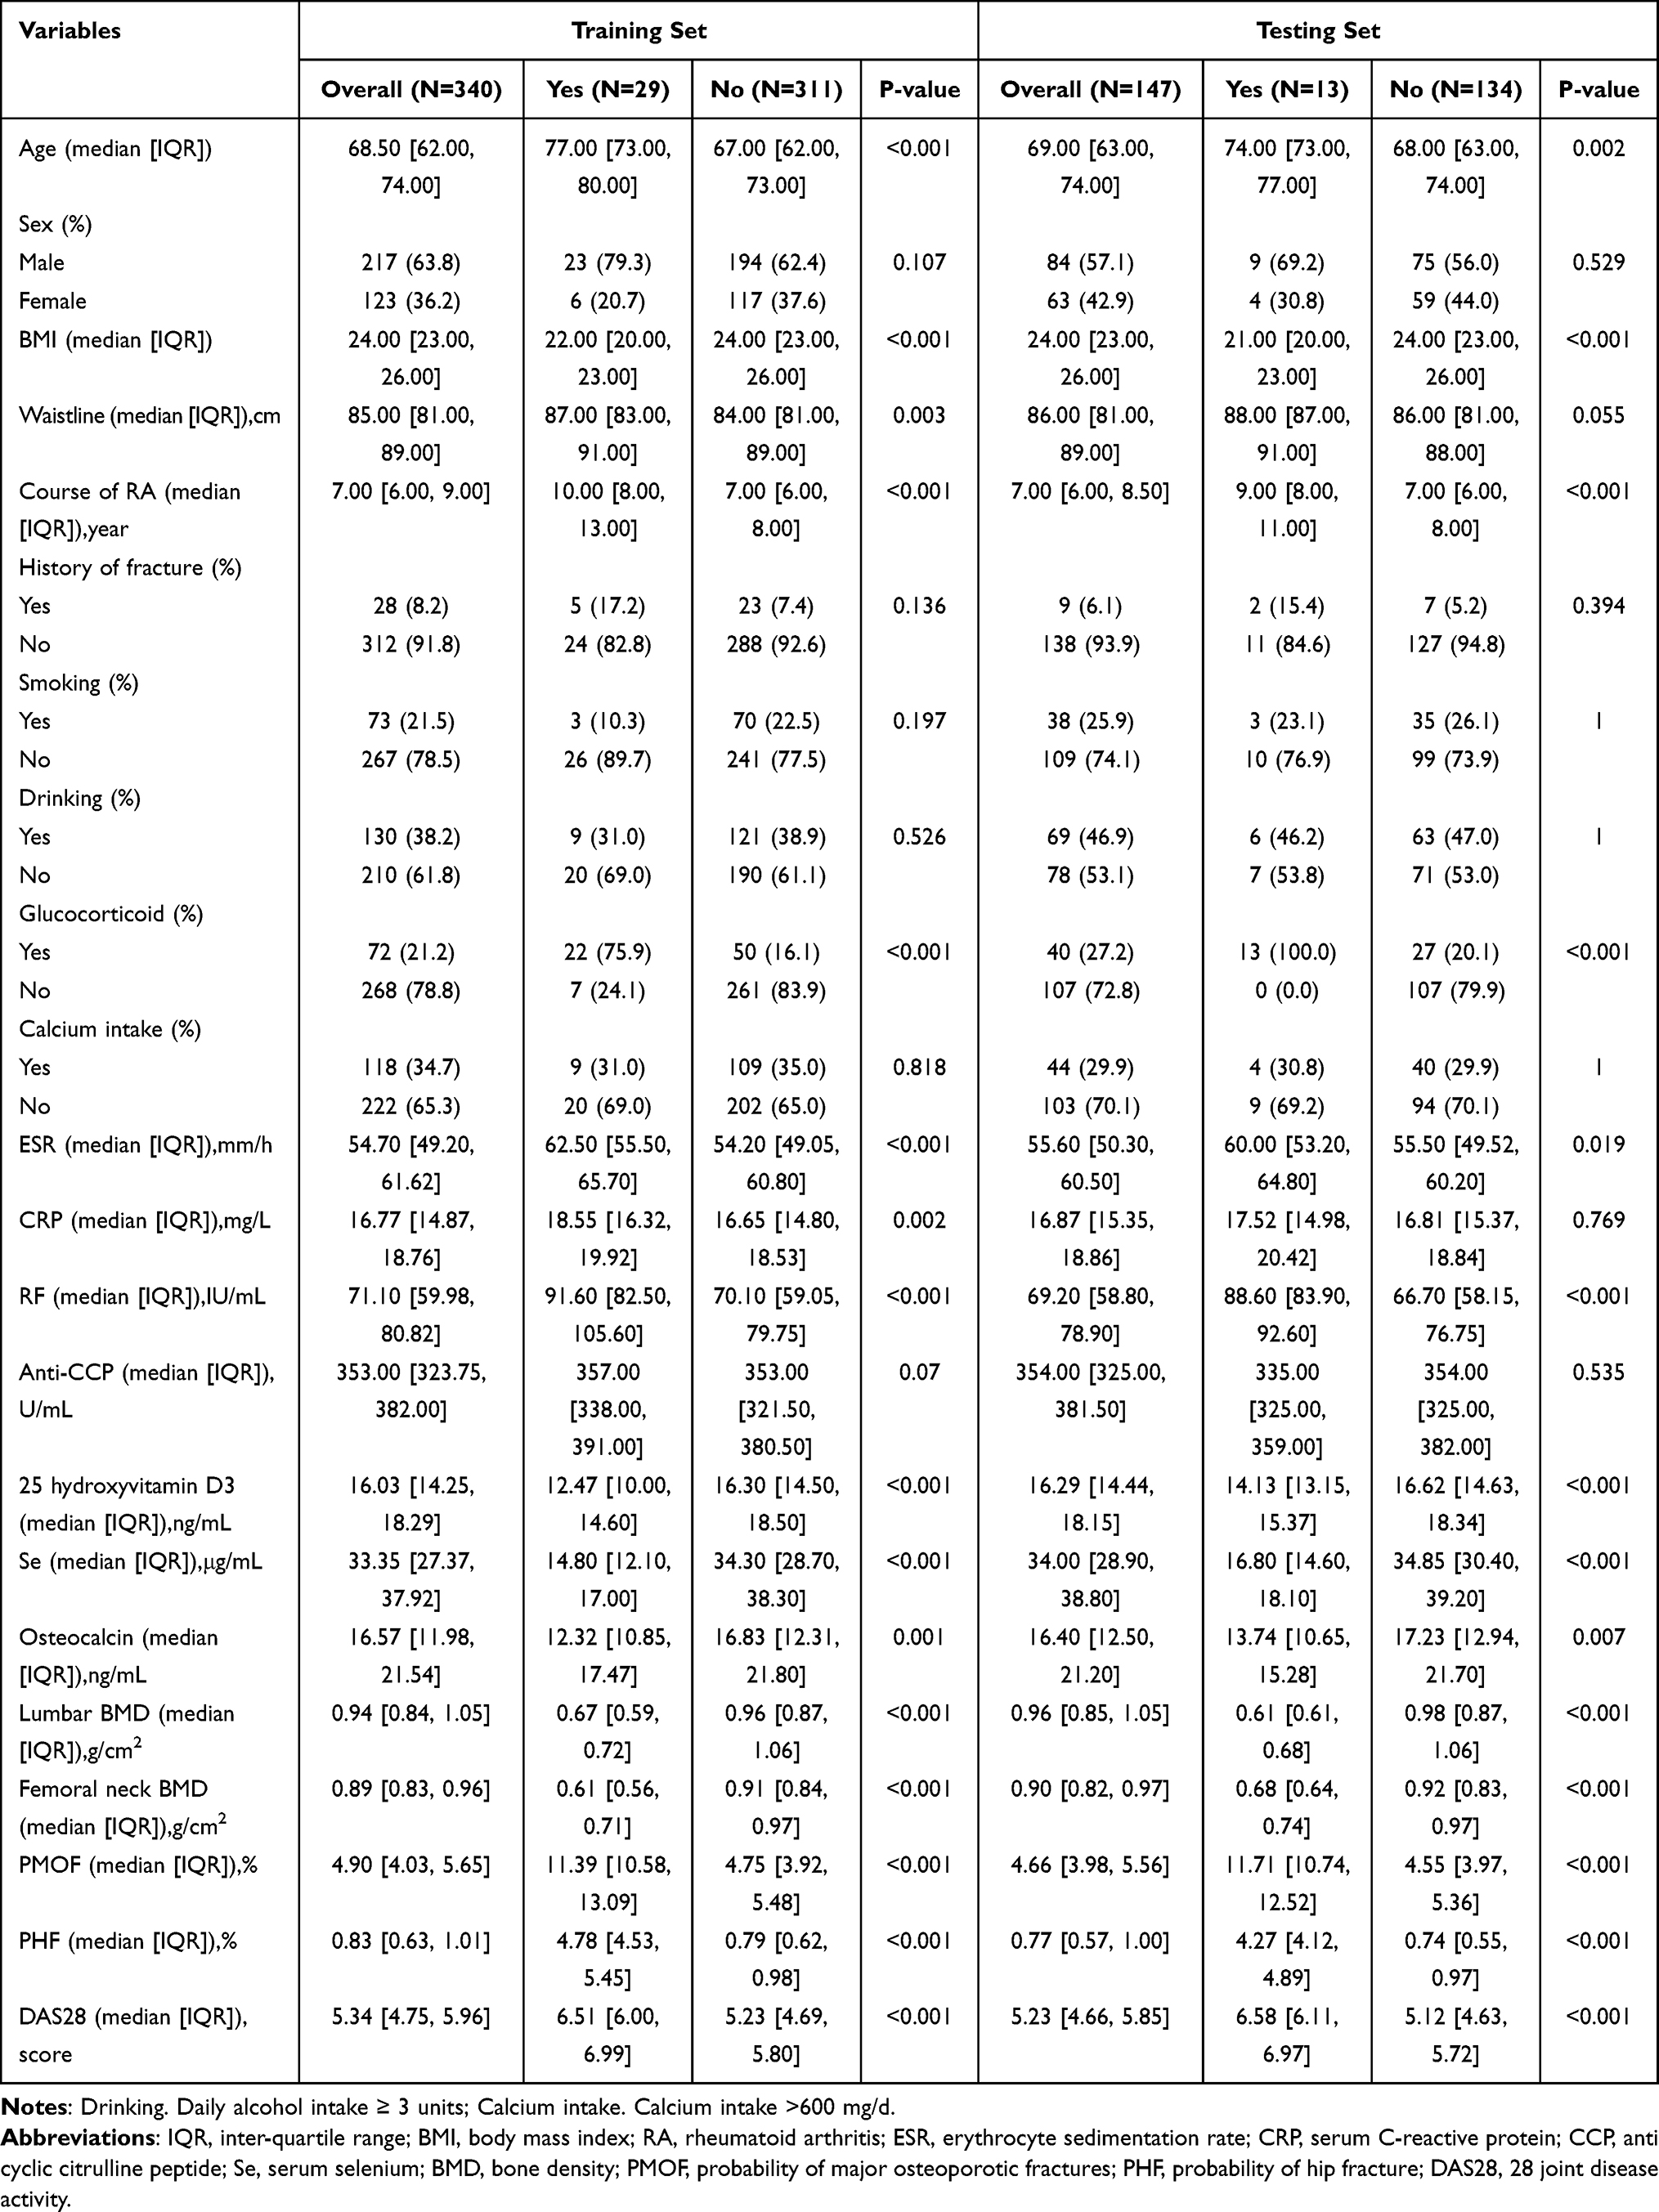 |
Table 1 Characteristics of Baseline Demographic and Clinical Test Indicators of Patients |
Comparison of Fracture Risk Stratification Between Two Groups
According to PMOF combined with PHF, 487 elderly RA patients with osteoporosis were classified as medium and high risk; Among 116 non-osteoporosis patients, 38(32.8%) had normal bone mass without fracture risk, and 68 had decreased bone mass, including 53(45.7%) low-risk patients and 25(21.6%) medium and high-risk patients. As shown in Supplementary Table 1, there was a significant difference in fracture risk between the osteoporosis group and the non-osteoporosis group (P<0.05). To further evaluate the fracture prediction efficiency of PMOF and PHF, the area under the ROC curve(AUC) showed that the fracture prediction efficiency of PMOF and PHF in the training set was 0.725(95% CI: 0.674–0.776) and 0.695(95% CI: 0.644–0.746), respectively (Table 2).
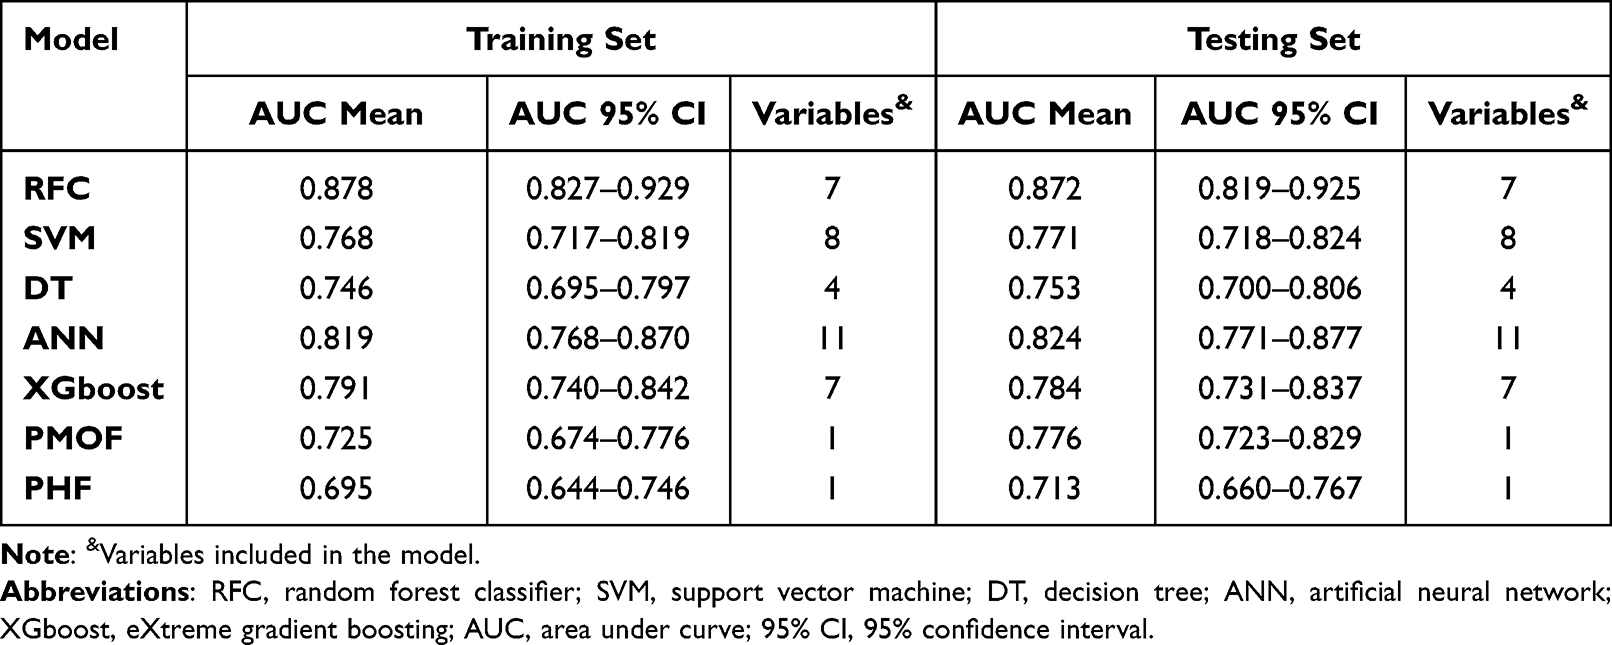 |
Table 2 The ROC Curve Analyses for Predicting Fracture Risk in Each ML-Based Model |
Selection of Candidate Variables
Candidate covariates of each algorithm were filtered and twenty-two were included in the correlation analysis between outcome and independent variables. The correlation matrix revealed that fracture significantly correlated with image factors and some clinical variables (Figure 2A). Additionally, each meaningful candidate variable, including PMOF, PHF, serum selenium, and clinical indices, that is, glucocorticoid, and erythrocyte sedimentation rate(ESR) were important factors in the ML-based model (Figure 2B).
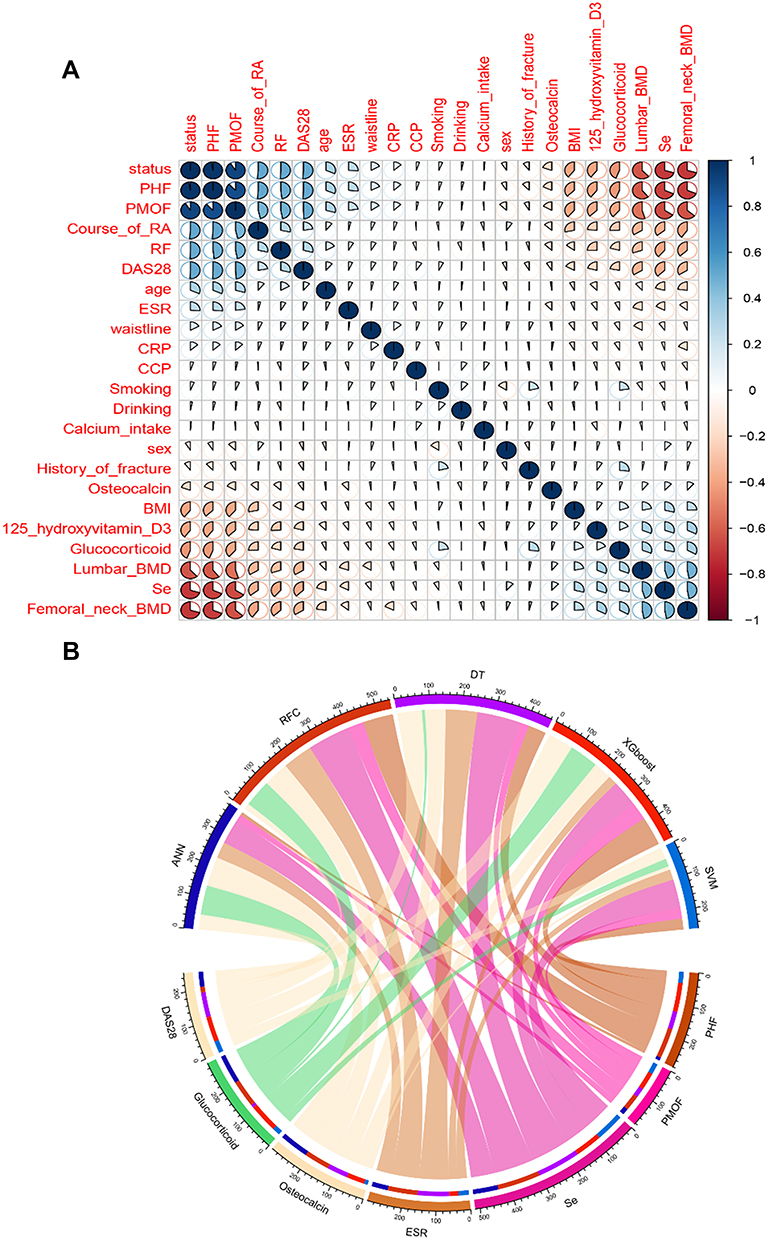 |
Figure 2 Variable screening and weight allocation. (A) Correlation matrix analysis of candidate features. (B) The weight distribution of the candidate variables of each ML-based model. Abbreviations: RFC, random forest classifier; SVM, support vector machine; DT, decision tree; ANN, artificial neural network; XGboost, eXtreme gradient boosting. |
Construction of ML-Based Fracture Predictive Model
Random forest classifier (RFC) and decision tree (DT) are commonly used ML-based algorithms in supervised learning. In this study, The RFC model was constructed using the formula I(X=xi)=−log2P(xi), where I(X) is the information for candidate variables and P(xi) is the probability of xi (Figure 3A). Twenty-two variables were ordered according to the mean decrease in the Gini index (Supplementary Table 2); the top seven ranked variables were used to construct the optimal RFC prediction model, which included PMOF, PHF, BMD, RF, and Se. Similarly, the Se also served as irreplaceable weight at DT branches (Figure 3B). Using the iterative algorithm of supervised learning, both RFC and DT models were used for fracture prediction. Meanwhile, the ANN model showed more robust prediction efficiency than other models but was inferior to the RFC (Figure 4).
 |
Figure 3 Predictive model visualization based on ML-based algorithm. (A) RFC model. (B) DT model. Notes: The candidate factors associated with fracture risk were ordered via RFC algorithm (A and B) prediction node and weight were allocated via DT algorithm. |
 |
Figure 4 Predictive model visualization based on ANN algorithm. (A) ANN model. (B) Variable importance using connection weight. Notes: The candidate factors associated with fracture risk were ordered via ANN algorithm (A and B) prediction node and weight were allocated via ANN algorithm. |
Comparison Among ML-Based Models
Based on the iterative analysis of baseline characteristics, we used five ML-based supervised learning models and two common predictive tools (PMOF, PHF) for fracture risk assessment and to optimize predictive performance. As expected, the RFC model was better able to predict fracture risk. The AUCs of the RFC model reached a plateau when seven variables were introduced, indicating that the RFC model had the highest predictive accuracy, followed by DT, artificial neural network (ANN), support vector machine (SVM), and eXtreme gradient boosting (XGBoost) models (Figure 5). The predictive performance of ML-based models was summarized in Table 2 and Supplementary Table 3. Interestingly, the prediction performance of all supervised learning prediction models was significantly better than that of PMOF and PHF prediction tools.
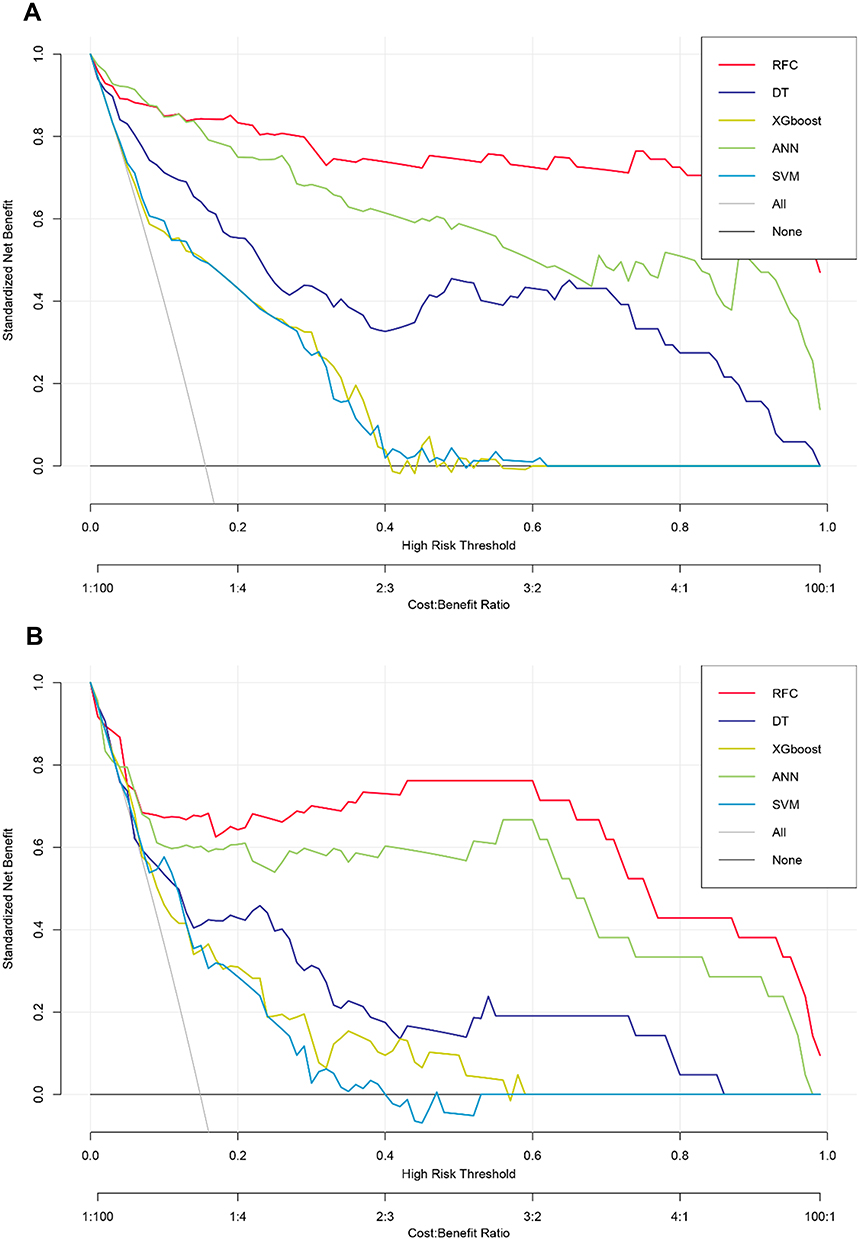 |
Figure 5 Prediction performance of candidate models based on ML-based algorithm. (A) DCA for five ML-based models in the training set. (B) DCA for five ML-based models in the testing set. Abbreviations: RFC, random forest classifier; SVM, support vector machine; DT, decision tree; ANN, artificial neural network; XGboost, eXtreme gradient boosting. |
Internal Validation of the Optimal Predictive Model
To further verify the optimal prediction model, CIC was used to verify the RFC model with the training set and test set respectively. This was supported by fracture risk factors identified in the training focus, as shown in Supplementary Figure 1. In addition, these were also consistent with the results of validation cohorts, indicating that RFC had the best performance across the metrics of discrimination, calibration, and overall performance, especially the candidate clinical indices that were highly relevant to fracture.
Discussion
In this study, we performed a longitudinal cohort study to examine the risk of incident fracture among RA patients with osteoporosis. To our knowledge, few previous studies have assessed the risk of fracture in EORA. Therefore, this study detected the fracture incidence of elderly RA patients with osteoporosis for the first time, we successfully constructed an early warning classification model for guiding diagnosis and treatment.
In this study, we found RA patients with osteoporosis had an increased prevalence of risk factors for fracture. The advantages of this study included a large cohort of patients (487 cases) with an average follow-up of 68.5 years, the use of fracture prediction, in which the definition of exposure (glucocorticoid, RA, BMD code) has been validated, the examination before fracture, and the ability to adjust for other measured risk factors of osteoporosis, including combination medication, BMI and ESR.24–27In addition, since our estimates of rheumatoid arthritis are similar to previous studies, the inclusion of a group of patients with rheumatoid arthritis for internal comparison can provide validity to the results.28,29
Previous studies have investigated the effects of Se on osteoporosis, however, the results are inconclusive.10 Notably, in this study, we found that Se expression was associated with a higher risk of fracture in RA patients with osteoporosis because the expression was significantly lower in patients with fractures than in patients without fractures. Previous studies have shown that selenoprotein expressed in human fetal osteoblasts seems to protect bones from oxidative stress, which may lead to osteoporosis by inhibiting the osteogenic differentiation of bone marrow stromal cells.30,31 We speculate that the trace element selenium is an important component of selenoprotein and may play an important role in the relationship between Se and bone mineral density. Consistent with the expected results, Se accounts for a large weight in the multiple ML-based prediction models, which indicated that Se has potential value in predicting fracture risk.32,33
Supervised machine learning algorithm has always been the mainstream method in the field of data mining.34 Recently, the use of health data for disease prediction has shown the potential application of these methods.35,36 This study demonstrated that the use of machine learning models can accurately predict fracture in RA patients with osteoporosis. As an important branch of supervised learning, the RFC model has been successfully applied to high-dimensional and multi-source data reduction of many diseases.37 The popular supervised learning classifiers, including support vector machines, random forest, convolutional neural networks, and decision trees, have been gradually applied in clinical practice. Consistent with the results of previous research reports,38,39 we found that the RFC model has more advantages in feature selection and classification, and shows better prediction performance than PMOF and PHF.
Our study also has limitations. First, This is a single-center study that needs to be validated with data from other sources. The variables that are input to machine learning algorithms are usually variables that can be obtained or evaluated in most cases, therefore, it is necessary to conduct repeated validation using data from other more clinical medical centers. Second, the added value of roles of serum selenium in RA patients with osteoporosis remains unknown, and further in vivo and in vitro experiments are needed to reveal their functions. Third, all of the samples from this study is retrospective, and future validation should be performed in a prospective multicentre cohort.
Conclusion
In conclusion, fracture, especially osteoporotic fracture, is a major health problem, leading to adverse consequences. Osteoporosis is largely underestimated in the elderly population. Additionally, we have successfully constructed the RFC with the highest prediction accuracy. Further research is needed to develop these models so that they can be used in daily practice and care for elderly RA patients with osteoporosis.
Acknowledgments
The authors thank all study participants for consenting to the use of their medical records. The authors also thank Bullet Edits Limited for the linguistic editing and proofreading of the manuscript.
Author Contributions
All authors contributed to the designing, execution, data acquiring, interpretation, analysis, and manuscript writing; gave final approval of the version to be published; have agreed on the journal to which the article has been submitted; and agreed to be accountable for all aspects of the work.
Funding
This study was funded by Enshi Tujia and Miao Autonomous Prefecture Bureau of Science and technology (Study on steroid-induced osteonecrosis of the femoral head treated by selenium.NO. E20200021).
Disclosure
The authors declare that the research was conducted without any commercial or financial relationships construed as a potential conflict of interest.
References
1. Smolen JS, Aletaha D, McInnes IB. Rheumatoid arthritis. Lancet. 2016;388(10055):2023–2038. doi:10.1016/S0140-6736(16)30173-8
2. Hyndman IJ. Rheumatoid arthritis: past, present and future approaches to treating the disease. Int J Rheum Dis. 2017;20(4):417–419. doi:10.1111/1756-185X.12823
3. Raterman HG, Bultink IE, Lems WF. Osteoporosis in patients with rheumatoid arthritis: an update in epidemiology, pathogenesis, and fracture prevention. Expert Opin Pharmacother. 2020;21(14):1725–1737. doi:10.1080/14656566.2020.1787381
4. Raterman HG, Lems WF. Pharmacological management of osteoporosis in rheumatoid arthritis patients: a review of the literature and practical guide. Drugs Aging. 2019;36(12):1061–1072. doi:10.1007/s40266-019-00714-4
5. Tański W, Wójciga J, Jankowska-Polańska B. Association between malnutrition and quality of life in elderly patients with rheumatoid arthritis. Nutrients. 2021;13(4):1259. doi:10.3390/nu13041259
6. Soubrier M, Mathieu S, Payet S, Dubost JJ, Ristori JM. Elderly-onset rheumatoid arthritis. Joint Bone Spine. 2010;77(4):290–296. doi:10.1016/j.jbspin.2010.04.004
7. Hetland ML. Modern treatment strategies in rheumatoid arthritis. Dan Med Bull. 2011;58(11):B4320.
8. Lu T, Forgetta V, Keller-Baruch J, et al. Improved prediction of fracture risk leveraging a genome-wide polygenic risk score. Genome Med. 2021;13(1):16. doi:10.1186/s13073-021-00838-6
9. Broy SB, Tanner SB. Official positions for FRAX® clinical regarding rheumatoid arthritis from joint official positions development conference of the international society for clinical densitometry and international osteoporosis foundation on FRAX®. J Clin Densitom. 2011;14(3):184–189. doi:10.1016/j.jocd.2011.05.012
10. Wang N, Xie D, Wu J, et al. Selenium and bone health: a protocol for a systematic review and meta-analysis. BMJ open. 2020;10(10):e036612. doi:10.1136/bmjopen-2019-036612
11. Beniczky S, Karoly P, Nurse E, Ryvlin P, Cook M. Machine learning and wearable devices of the future. Epilepsia. 2021;62(Suppl 2):S116–s124. doi:10.1111/epi.16555
12. Deo RC. Machine learning in medicine. Circulation. 2015;132(20):1920–1930. doi:10.1161/CIRCULATIONAHA.115.001593
13. Shehab M, Abualigah L, Shambour Q, et al. Machine learning in medical applications: a review of state-of-The-art methods. Comput Biol Med. 2022;145:105458. doi:10.1016/j.compbiomed.2022.105458
14. Peiffer-Smadja N, Rawson TM, Ahmad R, et al. Machine learning for clinical decision support in infectious diseases: a narrative review of current applications. Clin Microbiol Infect. 2020;26(5):584–595. doi:10.1016/j.cmi.2019.09.009
15. Choy G, Khalilzadeh O, Michalski M, et al. Current applications and future impact of machine learning in radiology. Radiology. 2018;288(2):318–328. doi:10.1148/radiol.2018171820
16. McNamara EA, Feldman AZ, Malabanan AO, et al. Effect of clothing on measurement of bone mineral density. J Clin Densitom. 2016;19(2):216–219. doi:10.1016/j.jocd.2015.05.071
17. Siris ES, Baim S, Nattiv A. Primary care use of FRAX: absolute fracture risk assessment in postmenopausal women and older men. Postgrad Med. 2010;122(1):82–90. doi:10.3810/pgm.2010.01.2102
18. Currie G, Hawk KE, Rohren E, Vial A, Machine Learning KR. Deep learning in medical imaging: intelligent imaging. J Med Imaging Radiat Sci. 2019;50(4):477–487. doi:10.1016/j.jmir.2019.09.005
19. Fan J, Lv J, Selective A. Overview of variable selection in high dimensional feature space. Stat Sin. 2010;20(1):101–148.
20. Shao B. Decomposition of the Gini index by income source for aggregated data and its applications. Comput Stat. 2021;36(3):2135–2159. doi:10.1007/s00180-021-01069-4
21. Van Calster B, Wynants L, Verbeek JFM, et al. Reporting and interpreting decision curve analysis: a guide for investigators. Eur Urol. 2018;74(6):796–804. doi:10.1016/j.eururo.2018.08.038
22. Kerr KF, Brown MD, Marsh TL, Janes H. Assessing the clinical impact of risk models for opting out of treatment. Med Decis Making. 2019;39(2):86–90. doi:10.1177/0272989X18819479
23. Armstrong RA. When to use the Bonferroni correction. Ophthalmic Physiol Opt. 2014;34(5):502–508. doi:10.1111/opo.12131
24. Seminara NM, Abuabara K, Shin DB, et al. Validity of The Health Improvement Network (THIN) for the study of psoriasis. Br J Dermatol. 2011;164(3):602–609. doi:10.1111/j.1365-2133.2010.10134.x
25. Ogdie A, Alehashemi S, Love TJ, et al. Validity of psoriatic arthritis and capture of disease modifying antirheumatic drugs in the health improvement network. Pharmacoepidemiol Drug Saf. 2014;23(9):918–922. doi:10.1002/pds.3677
26. Watson DJ, Rhodes T, Cai B, Guess HA. Lower risk of thromboembolic cardiovascular events with naproxen among patients with rheumatoid arthritis. Arch Intern Med. 2002;162(10):1105–1110. doi:10.1001/archinte.162.10.1105
27. Vosse D, Landewé R, van der Heijde D, van der Linden S, van Staa TP, Geusens P. Ankylosing spondylitis and the risk of fracture: results from a large primary care-based nested case-control study. Ann Rheum Dis. 2009;68(12):1839–1842. doi:10.1136/ard.2008.100503
28. Collins GS, Mallett S, Altman DG. Predicting risk of osteoporotic and Hip fracture in the United Kingdom: prospective independent and external validation of QFractureScores. BMJ. 2011;342:d3651. doi:10.1136/bmj.d3651
29. Hippisley-Cox J, Coupland C. Derivation and validation of updated QFracture algorithm to predict risk of osteoporotic fracture in primary care in the United Kingdom: prospective open cohort study. BMJ. 2012;344:e3427. doi:10.1136/bmj.e3427
30. Dreher I, Schütze N, Baur A, et al. Selenoproteins are expressed in fetal human osteoblast-like cells. Biochem Biophys Res Commun. 1998;245(1):101–107. doi:10.1006/bbrc.1998.8393
31. Xu ZS, Wang XY, Xiao D-M, et al. Hydrogen sulfide protects MC3T3-E1 osteoblastic cells against H2O2-induced oxidative damage—implications for the treatment of osteoporosis. Free Radic Biol Med. 2011;50(10):1314–1323. doi:10.1016/j.freeradbiomed.2011.02.016
32. Vescini F, Chiodini I, Palermo A, et al. Selenium: a trace element for a healthy skeleton - A narrative review. Endocr Metab Immune Disord Drug Targets. 2021;21(4):577–585. doi:10.2174/1871530320666200628030913
33. Park KC, Kwon Y, Lee Y, Kim DK, Jang Y, Lee S. Low selenium levels are associated with decreased bone mineral densities. J Trace Elem Med Biol. 2020;61:126534. doi:10.1016/j.jtemb.2020.126534
34. Uddin S, Khan A, Hossain ME, Moni MA. Comparing different supervised machine learning algorithms for disease prediction. BMC Med Inform Decis Mak. 2019;19(1):281. doi:10.1186/s12911-019-1004-8
35. Zhang Y, Ma Y. Application of supervised machine learning algorithms in the classification of sagittal gait patterns of cerebral palsy children with spastic diplegia. Comput Biol Med. 2019;106:33–39. doi:10.1016/j.compbiomed.2019.01.009
36. Jorayeva M, Akbulut A, Catal C, Mishra A. Machine learning-based software defect prediction for mobile applications: a systematic literature review. Sensors. 2022;22(7):2551
37. Doupe P, Faghmous J, Basu S. Machine learning for health services researchers. Value Health. 2019;22(7):808–815. doi:10.1016/j.jval.2019.02.012
38. Yang L, Wu H, Jin X, et al. Study of cardiovascular disease prediction model based on random forest in eastern China. Sci Rep. 2020;10(1):5245. doi:10.1038/s41598-020-62133-5
39. Li J, Tian Y, Zhu Y, et al. A multicenter random forest model for effective prognosis prediction in collaborative clinical research network. Artif Intell Med. 2020;103:101814. doi:10.1016/j.artmed.2020.101814
 © 2022 The Author(s). This work is published and licensed by Dove Medical Press Limited. The
full terms of this license are available at https://www.dovepress.com/terms
and incorporate the Creative Commons Attribution
- Non Commercial (unported, 3.0) License.
By accessing the work you hereby accept the Terms. Non-commercial uses of the work are permitted
without any further permission from Dove Medical Press Limited, provided the work is properly
attributed. For permission for commercial use of this work, please see paragraphs 4.2 and 5 of our Terms.
© 2022 The Author(s). This work is published and licensed by Dove Medical Press Limited. The
full terms of this license are available at https://www.dovepress.com/terms
and incorporate the Creative Commons Attribution
- Non Commercial (unported, 3.0) License.
By accessing the work you hereby accept the Terms. Non-commercial uses of the work are permitted
without any further permission from Dove Medical Press Limited, provided the work is properly
attributed. For permission for commercial use of this work, please see paragraphs 4.2 and 5 of our Terms.
Recommended articles
Risk Factors and Predictive Model for Dermatomyositis Associated with Rapidly Progressive Interstitial Lung Disease
Wang K, Tian Y, Liu S, Zhang Z, Shen L, Meng D, Li J
Pharmacogenomics and Personalized Medicine 2022, 15:775-783
Published Date: 1 September 2022
Hospital-Treated Infections and 15-year Incidence of Musculoskeletal Disorders: A Large Population-Based Cohort Study
Gao Y, McGagh D, Ding L, Hong S, Ouyang Z, Wei J, Zeng C, Lei G, Xie J
Clinical Epidemiology 2025, 17:251-264
Published Date: 11 March 2025
Exploring the Causal Relationship Between Osteoporosis and Rheumatoid Arthritis: A Bidirectional Mendelian Randomization Study
Li J, Bao L, Dai C, He M
Orthopedic Research and Reviews 2025, 17:147-157
Published Date: 13 April 2025
Nanotechnology in Orthopedic Care: Advances in Drug Delivery, Implants, and Biocompatibility Considerations
Xia L, Zhou C, Li Q, Liu L, Jiang C, Dai H, Zhang H, Zhao J, Liang W
International Journal of Nanomedicine 2025, 20:9251-9274
Published Date: 21 July 2025
The Protective Activity of Apigenin Against Bone and Cartilage Diseases

Chen J, Liao X, Wu L
Clinical Interventions in Aging 2025, 20:1235-1251
Published Date: 13 August 2025