Back to Journals » International Journal of Women's Health » Volume 17
A Predictive Model Based on Machine Learning Algorithm for Vein Thrombosis After Ovarian Cancer Resection
Received 2 July 2025
Accepted for publication 11 October 2025
Published 6 November 2025 Volume 2025:17 Pages 4207—4226
DOI https://doi.org/10.2147/IJWH.S550882
Checked for plagiarism Yes
Review by Single anonymous peer review
Peer reviewer comments 2
Editor who approved publication: Dr Everett Magann
Lei Zhao,1 Lichao Yao2
1Department of Anesthesiology, Shengjing Hospital of China Medical University, Shenyang, Liaoning, People’s Republic of China; 2Department of Obstetrics and Gynaecology, Shengjing Hospital of China Medical University, Shenyang, Liaoning, People’s Republic of China
Correspondence: Lichao Yao, Department of Obstetrics and Gynaecology, Shengjing Hospital of China Medical University, No. 36, Sanhou Street, Heping District, Shenyang, Liaoning, 110004, People’s Republic of China, Email [email protected]
Background: Postoperative venous thromboembolism (VTE) is the most fatal complication of ovarian cancer and adversely affects prognosis. This study aimed to develop and validate predictive models for VTE risk following ovarian cancer resection using machine learning (ML) techniques and incorporating perioperative clinical and surgical variables.
Methods: Retrospective data were collected from 931 patients with ovarian cancer who underwent resection between March 2018 and April 2024 at two tertiary hospitals. The Least Absolute Shrinkage and Selection Operator (LASSO) regression was employed to identify critical predictors of VTE and seven ML models, including Logistic Regression (LR), Decision Tree (DT), Extreme Gradient Boosting Machine (XGBoost), Random Forest (RF), Support Vector Machine (SVM), Naïve Bayes (NB), and Light Gradient Boosting Machine (LGBM) were trained and optimized. Optimal hyperparameters were selected based on a 10-fold cross-validation. Model performance was evaluated using the area under the receiver operating characteristic curve (AUC), precision-recall area under the curve (PR-AUC), balanced accuracy, precision, recall, F1 score, and Brier score. The SHapley Additive exPlanation (SHAP) package was used to interpret the optimal models.
Results: The incidence of postoperative VTE was 10.0% (93/931). Among the models, XGBoost demonstrated superior performance, achieving an AUC of 0.935 (95% CI: 0.902– 0.963) and PR-AUC of 0.620 (95% CI: 0.457– 0.809), recall of 0.849, F1 score of 0.571, and Brier score of 0.116. SHAP analysis identified residual disease, surgical duration, postoperative D-dimer levels, postoperative chemotherapy, and age as the top five contributors to postoperative VTE risk.
Conclusion: The ML-based model, particularly the XGBoost algorithm, effectively predicted the VTE risk in patients with post-resection ovarian cancer. This tool may assist clinicians in early identification of high-risk individuals, thereby enabling personalized thromboprophylaxis and optimizing perioperative management to mitigate VTE-related morbidities.
Keywords: ovarian cancer, machine learning algorithm, predictive model, postoperative venous thromboembolism, risk factors, XGBoost
Introduction
Ovarian cancer remains one of the most lethal gynecologic malignancies, with approximately 230,000 new cases and 150,000 female deaths annually worldwide.1 Despite advances in multimodal therapies, radical ovarian cancer surgery aimed at achieving complete tumor resection continues to be the cornerstone of treatment for this disease.2 However, radical pelvic surgeries—often involving prolonged operative times, multivisceral resections, and extensive lymph node dissection—carry substantial risks of postoperative morbidity.3 These complications not only delay adjuvant therapy but also impose heavy socioeconomic burdens, with prolonged hospital stays and increased healthcare costs. Among these adverse events, venous thromboembolism (VTE), encompassing deep vein thrombosis (DVT) and pulmonary embolism (PE), emerges as a particularly underappreciated yet life-threatening complication in this population.4
The prothrombotic state in ovarian cancer arises from a confluence of tumor biology, surgical factors, and patient-specific vulnerabilities. Malignancy-driven hypercoagulability—mediated by tissue factor overexpression, platelet activation, and cytokine release—is compounded by mechanical compression of pelvic veins by bulky tumors, prolonged immobilization post-surgery, and endothelial injury during dissection.5 Consequently, ovarian cancer patients face a postoperative VTE incidence of up to 16%, nearly triple the rate observed in other gynecologic malignancies.6 Alarmingly, these events are frequently underdiagnosed due to nonspecific symptoms (eg, limb edema, tachycardia) and inconsistent adherence to screening protocols, leading to delayed interventions.7 Notably, VTE independently correlates with reduced five-year survival rates and increased recurrence risks, partly due to thrombosis-induced hypoxia fostering pro-metastatic signaling and delays in initiating adjuvant chemotherapy.8,9 Survivors also endure chronic sequelae such as post-thrombotic syndrome and pulmonary hypertension, severely diminishing quality of life.4 Despite these stakes, current thromboprophylaxis strategies remain suboptimal, with up to 50% of ovarian cancer patients experiencing breakthrough VTE even on guideline-directed low-molecular-weight heparin (LMWH) regimens.10
Existing VTE risk stratification tools, such as the Caprini and Padua scores, fail to address the unique pathophysiology of postoperative ovarian cancer cohorts. The Caprini score, designed for general surgical patients, overemphasizes age and comorbidities while neglecting cancer-specific biomarkers (eg, D-dimer) and dynamic intraoperative variables (eg, estimated blood loss).11 Similarly, the Padua score, developed for chemotherapy-associated VTE, excludes surgical stressors and lacks validation in postoperative settings.12 These tools rely on a linear regression framework that cannot capture complex interactions between tumor biology, surgical trauma, and host responses—a critical limitation given the nonlinear relationship between variables like platelet count, inflammatory markers, and thrombotic risk. Consequently, a large number of high-risk ovarian cancer patients are misclassified as “low risk” by conventional scores, denying them intensified prophylaxis.13
The integration of machine learning algorithms (ML) into healthcare represents a paradigm shift in medical research and clinical decision-making, driven by exponential growth in computational power, algorithmic innovation, and the availability of high-dimensional biomedical data.14 Modern ML techniques—encompassing supervised, unsupervised, and reinforcement learning frameworks—excel at identifying complex, nonlinear patterns within heterogeneous datasets, surpassing traditional statistical methods in predictive accuracy for outcomes ranging from disease diagnosis to treatment response.15,16 These capabilities align with the principles of precision oncology, where tailored risk stratification and targeted interventions are critical for improving survival and reducing treatment-related morbidity.17 For VTE specifically, ensemble ML models that integrate electronic health records and biomarker profiles have achieved superior accuracy in predicting VTE in gynecological cancer cohorts.18 Despite these advancements, the application of ML to predict postoperative VTE in specific patient populations with ovarian cancer remains underexplored.
To address this gap, we develop and validate an interpretable ML model to predict postoperative VTE in ovarian cancer patients undergoing resection. By incorporating preoperative (eg, tumor stage), intraoperative (eg, surgical complexity), and postoperative (eg, D-dimer levels) variables, our model addresses the multifactorial nature of VTE while overcoming the rigidity of existing scores. We employ SHapley Additive exPlanations (SHAP) to quantify feature contributions, enabling clinicians to interpret predictions in the context of biological plausibility—a critical step for fostering trust in AI-driven tools. This study represents the first application of explainable ML to VTE risk stratification in ovarian cancer surgery, with the potential to guide personalized prophylaxis regimens, optimize resource allocation, and ultimately improve survival in this vulnerable population.
Materials and Methods
Study Population
A total of 931 patients admitted to the Shengjing Hospital of China Medical University, who underwent radical ovarian cancer surgery between March 2018 and April 2024, were enrolled. All patients were followed up for six months through hospital visits until the last occurrence of VTE in October 2024. The inclusion criteria were as follows: (1) patients diagnosed with ovarian cancer through histological examination who subsequently underwent radical surgery; (2) age ≥ 18 years; (3) no history of VTE; and (4) missing data < 10%. The exclusion criteria were as follows: (1) individuals with coagulation dysfunction, autoimmune diseases, or hemorrhagic disorders; (2) individuals who received long-term therapeutic anticoagulation within three months prior to surgery; (3) distant metastasis or arterial invasion; (4) lower extremity dysfunction or VTE history; (5) contraindications to surgical intervention; (6) concurrent with other malignancies or life-threatening diseases; and (7) death within six months post-surgery. This study was approved by the Ethics Review Committee of Shengjing Hospital of China Medical University (No. 2025PS1207K) and was conducted in accordance with the Declaration of Helsinki (2013). The requirement for written informed consent was waived because of the retrospective design of the study. All data were de-identified prior to analysis, with personal identifiers (eg, names, IDs, contact details) permanently removed to ensure confidentiality. Data access and storage complied rigorously with institutional guidelines.
Data Collection
Patient data were systematically collected from the electronic medical database of Shengjing Hospital of China Medical University. Demographic characteristics included age (years), body mass index (BMI, kg/m2), duration of disease (years), smoking history, alcohol consumption history, number of childbirths, history of previous pelvic and abdominal surgeries, American Society of Anesthesiologists (ASA) classification (I–IV), and comorbidities, such as diabetes, hypertension, hyperlipidemia, menopause, chronic heart disease (CHD), stroke, pulmonary disease, and anemia. Surgical data included surgical type, duration (minutes), volume of operative bleeding (mL), blood transfusion status, presence of ascites (mL), timing of surgery (primary or recurrent), extent of residual disease (no gross disease or microscopic, 0.1–1 cm, >1 cm), and surgical complexity scores (SCS, categorized as low, intermediate, or high). Tumor-related variables included International Federation of Gynecology and Obstetrics (FIGO) stage, neoadjuvant chemotherapy, tumor size (cm), and histological type (non-serous and serous). Postoperative observations included prophylactic measures (basic thromboprophylaxis, mechanical/anticoagulation drugs, and the combination of mechanical methods with anticoagulation drugs), complications occurring 30 days postoperatively prior to VTE (bowel obstruction, anastomotic leakage, pleural effusion, wound infection, abdominal/pelvic infection, urinary tract infection, and cardiac events), postoperative chemotherapy, and admission to the intensive care unit (ICU). Preoperative laboratory tests were performed after patient admission to mitigate the influence of anticancer treatment on these indicators. The tests included thrombin time (TT, s), prothrombin time (PT, s), activated partial thromboplastin time (APTT, s), fibrinogen level (g/L), D-dimer level (μg/mL), albumin level (g/L), platelet count (109/L), white blood cell count (WBC, 109/L), and Cancer Antigen 125 level (CA125, U/mL). Postoperative evaluations were conducted one day after surgery: Caprini scores, TT (s), PT (s), APTT (s), fibrinogen (g/L), D-dimer (μg/mL), albumin (g/L), platelet count (109/L), and WBC (109/L).
Diagnostic Criteria of VTE
The diagnostic criteria for DVT include clinical manifestations, such as lower-limb swelling, pain, warmth, erythema, and tenderness in the lower limbs. PE is characterized by symptoms such as sudden-onset dyspnea, pleuritic chest pain, cough, hemoptysis, tachycardia, hypotension, syncope, or hypoxia. The diagnosis of VTE (including DVT and PE) was established by two experienced clinicians based on these clinical symptoms and confirmed using diagnostic imaging techniques including vascular ultrasonography, computed tomography (CT), magnetic resonance imaging (MRI), CT pulmonary angiography, or ventilation-perfusion (V/Q) scanning. The primary endpoint of this study was the occurrence of symptomatic VTE within the six-month postoperative period.
Data Processing and Feature Selection
In our study, we addressed the presence of missing data through an understanding of three recognized mechanisms: missing completely at random (MCAR), missing at random (MAR), and not missing at random (NMAR). These classifications are based on the relationships between data missingness and both observed and unobserved values within the dataset.19 In this study, our analysis revealed that the missing data were not associated with the incidence of VTE or any other measured variables, as evidenced by Hawkins’ test and non-parametric test (all p > 0.05) (MissMech R package). This indicates satisfaction of the MCAR assumption.20 The proportions of missing data are presented in Supplementary Table S2.
To mitigate potential bias resulting from missing data, we applied the MissForest imputation method (missForest R package) for variables with <10% of missing data. Constraining missing data to this threshold ensures high data quality by maintaining cases with adequate information for reliable predictive modeling.21 MissForest is a robust iterative imputation technique that utilizes random forests, making it particularly adept at managing complex data structures and interactions. This approach efficiently handles both continuous and categorical data, enhancing the reliability of the derived predictive model. Its proficiency in capturing intricate interactions and nonlinear relationships underscores its widespread application in imputing missing values in medical research contexts.22 The variable distributions before and after the imputation are depicted in Supplementary Figure S1. Following imputation, we randomly partitioned the dataset into training and testing cohorts in a 7:3 ratio.
For feature selection within the training cohort, least absolute shrinkage and selection operator (LASSO) regression (glmnet R package) was employed, followed by multiple logistic regression analysis (glm R package), to further validate the selected features. LASSO regression, integrated with 10-fold cross-validation, was used to systematically determine the optimal regularization parameter (λ) by shrinking the coefficients of the non-informative predictors to zero. This approach minimizes the risk of overfitting and enhances predictive performance. Features with non-zero coefficients following LASSO regularization were retained for subsequent modeling.23
To address class imbalance, a common issue in machine learning involving datasets with skewed class distributions as VTE cases, the SMOTETomek resampling strategy (smotefamily R package) was employed to address the issue of imbalanced data and generate robust models. SMOTETomek combines synthetically generating examples of the minority class with Tomek links undersampling to create a new dataset with a larger sample size and a more balanced distribution. The purpose of using this hybrid method is to balance the training dataset and remove the noisy points at the wrong side of the decision boundary, to find better clusters and create models with good generalization ability.24,25
Model Development
In developing our predictive model for VTE post-ovarian cancer resection, we employed seven ML models: Logistic Regression (LR), Decision Tree (DT), Extreme Gradient Boosting Machine (XGBoost), Random Forest (RF), Support Vector Machine (SVM), Naïve Bayes (NB), and Light Gradient Boosting Machine (LGBM).
LR is a statistical model commonly used for binary classification tasks. It predicts the probability of an event occurrence by fitting data to a logistic function. The model utilizes a linear combination of input features, and applies a logistic transformation to output probabilities, offering simplicity and interpretability through coefficient analysis.26
DT is a type of supervised learning algorithm used for both classification and regression tasks. It split the data into subsets based on the value of input features, constructing a tree-like model of decisions. Although DT can be prone to overfitting without proper tuning or constraints like maximum depth, it is easy to interpret and visualize.27
XGBoost is an advanced implementation of gradient boosting that leverages decision trees. It builds models in stages by sequentially adding trees that correct errors made by the previous ones, thereby improving accuracy. Known for its speed and performance in handling large datasets with complex patterns and non-linear relationships, XGBoost incorporates regularization to prevent overfitting.28
RF is an ensemble learning method that creates a “forest” of decision trees. By averaging the predictions of multiple trees, it reduces variance and increases accuracy compared to a single decision tree. Each tree in a random forest is built from a subset of data and features, which helps to ensure robust performance and minimizes overfitting.29
LGBM is another implementation of gradient boosting that focuses on efficiency and scalability. It uses a histogram-based approach to find optimal splits and it is particularly effective with large datasets. LGBM can handle categorical features directly and provides competitive speed and performance, often outperforming similar algorithms in terms of execution time.30
SVM is a powerful classification algorithm that works well in high-dimensional spaces. It seeks to find the optimal hyperplane that maximizes the margin between different classes in the feature space. SVM is versatile, supporting various kernel functions to handle linearly inseparable data by transforming it into higher dimensions.31
NB is a probabilistic, generative learning algorithm used primarily for classification tasks. It classifies data points based on the Bayes’ theorem, assuming that features are independent given the class label, which is known as the “naïve” assumption. The algorithm calculates the posterior probability of each class given the input features and assigns the class with the highest probability to the data point.32
For the diagnostic models that demonstrated superior performance, we validated their generalization ability and robustness through 10-fold cross-validation, a strategy employed to mitigate overfitting. The hyperparameters of these models were systematically optimized using both grid search and randomized grid search methodologies, aiming to improve predictive performance while minimizing overfitting. For each algorithm, the optimization process incorporated both systematic grid search and expert-guided manual adjustments to achieve the final hyperparameter configuration. The tuned hyperparameters, determined using the caret R package, are detailed in Supplementary Table S1.
Model Performance Evaluation
The performance of the predictive model was evaluated using several key metrics to comprehensively capture its effectiveness and reliability.33 The area under the receiver operating characteristic curve (AUC-ROC) (pROC R package) measures the model’s ability to distinguish between positive and negative classes across all classification thresholds (range: 0–1). This metric is crucial for understanding the model’s diagnostic capability. Accuracy provides a straightforward measure of overall model correctness, though less informative in the presence of imbalanced classes. The Precision-Recall Area Under the Curve (PR-AUC) (PRROC R package) evaluates the trade-off between precision and recall (sensitivity) under class imbalance (range: 0–1). This metric is particularly valuable as it is prioritized over AUC-ROC for imbalanced datasets.34 Balanced accuracy is important for ensuring equitable consideration of class performance, especially in imbalanced datasets. Recall (sensitivity) is crucial in medical applications, where failing to identify a positive diagnosis can lead to severe consequences. Precision evaluates the reliability of positive predictions, which is important when minimizing false positives is undesirable. Specificity quantifies the model’s ability to correctly identify negative cases, thus preventing unnecessary healthcare expenses. F1 score is valuable in situations with uneven class distribution, as it balances precision and recall effectively. Lastly, Brier score (range: 0–1) measures the accuracy of probabilistic predictions, with lower values indicating better accuracy.35 The formula for each evaluation metric is provided below:


(TP: true positive; TN: true negative; FP, false positive; FN, false negative)

(N: total sample;  : predicted risk;
  : actual probability)
Furthermore, calibration of the model was conducted using calibration curves (rms R package), which visually represent the agreement between predicted probabilities and observed frequencies.36 This step is essential for ensuring that the model’s probability estimates reflect actual outcomes accurately. The clinical utility of the model was assessed using decision curve analysis (DCA) (rmda R package), which quantifies the net benefit of clinical decisions across probability thresholds, comparing these against the “treat all” and “treat none” strategies. A higher net benefit indicates that the model provides more clinical value, thereby facilitating more informed decision-making in the clinical setting.37
Model Interpretability Analysis
To understand how each input feature influences our model’s predictions, we used SHapley Additive exPlanations (SHAP) values, a method grounded in cooperative game theory.38 This approach allows us to break down a prediction into the contributions of each feature, showing how they interact and contribute to the final predicted outcomes. The unique advantage of SHAP values is their ability to consider the complex and nonlinear interactions between features, providing a comprehensive view of each feature’s impact. We calculated the overall importance of each feature by taking the average of the absolute SHAP values across all data points in our dataset. This ensures that our assessment of feature significance is reliable and relevant. Furthermore, we created SHAP dependency and summary plots. These visual tools illustrate the positive or negative influence of each feature and the strength of their effects, helping us to clearly distinguish which features are critical in predicting high- or low-risk outcomes. This systematic transparency is essential for effectively applying our model in clinical settings, as it highlights the most influential factors in the decision-making process.
Statistical Analysis
Data processing and analysis were conducted using the SPSS software (version 27.0) and R software (version 4.4.1). Continuous variables that did not follow a normal distribution were expressed as medians (interquartile range [IQR]) and compared using the Mann-Whitney U-test. Categorical variables are presented as frequencies (percentages, %) and were assessed using the chi-square test. ML models were developed in R software using various packages: the glm package for LR, rpart package for DT, randomForest package for RF, e1071 for SVM and NB, xgboost for XGBoost, and lighgbm for LGBM. Statistical significance was defined using two-tailed tests (p < 0.05).
Results
Clinical Characteristics
A flowchart illustrating the participant selection and study process is shown in Figure 1. A total of 931 patients who underwent radical surgery for ovarian cancer were included in this study, with 10.0% (93/931) developing VTE, comprising 75 cases of DVT and 18 cases of PE. A detailed comparison between the VTE and non-VTE groups is shown in Table 1. Univariate analysis revealed significant differences in age (p < 0.001), FIGO stage (p < 0.001), hypertension (p = 0.015), surgical duration (p < 0.001), operative bleeding (p = 0.011), Caprini score (p = 0.007), ASA score (p < 0.001), SCS score (p = 0.033), thromboprophylaxis measures (p = 0.024), residual disease (p = 0.001), postoperative chemotherapy (p < 0.001), postoperative wound infection (p < 0.001), preoperative CA125 level (p = 0.001), preoperative APTT (p = 0.043), preoperative D-dimer level (p = 0.015), preoperative albumin level (p = 0.049), postoperative fibrinogen level (p = 0.008), and postoperative D-dimer level (p < 0.001). The study population was divided into a training cohort of 652 patients (60 VTE cases) and a testing cohort of 279 patients (33 VTE cases). The baseline clinical characteristics of the two cohorts were not significantly different (p > 0.05; Supplementary Table S2).
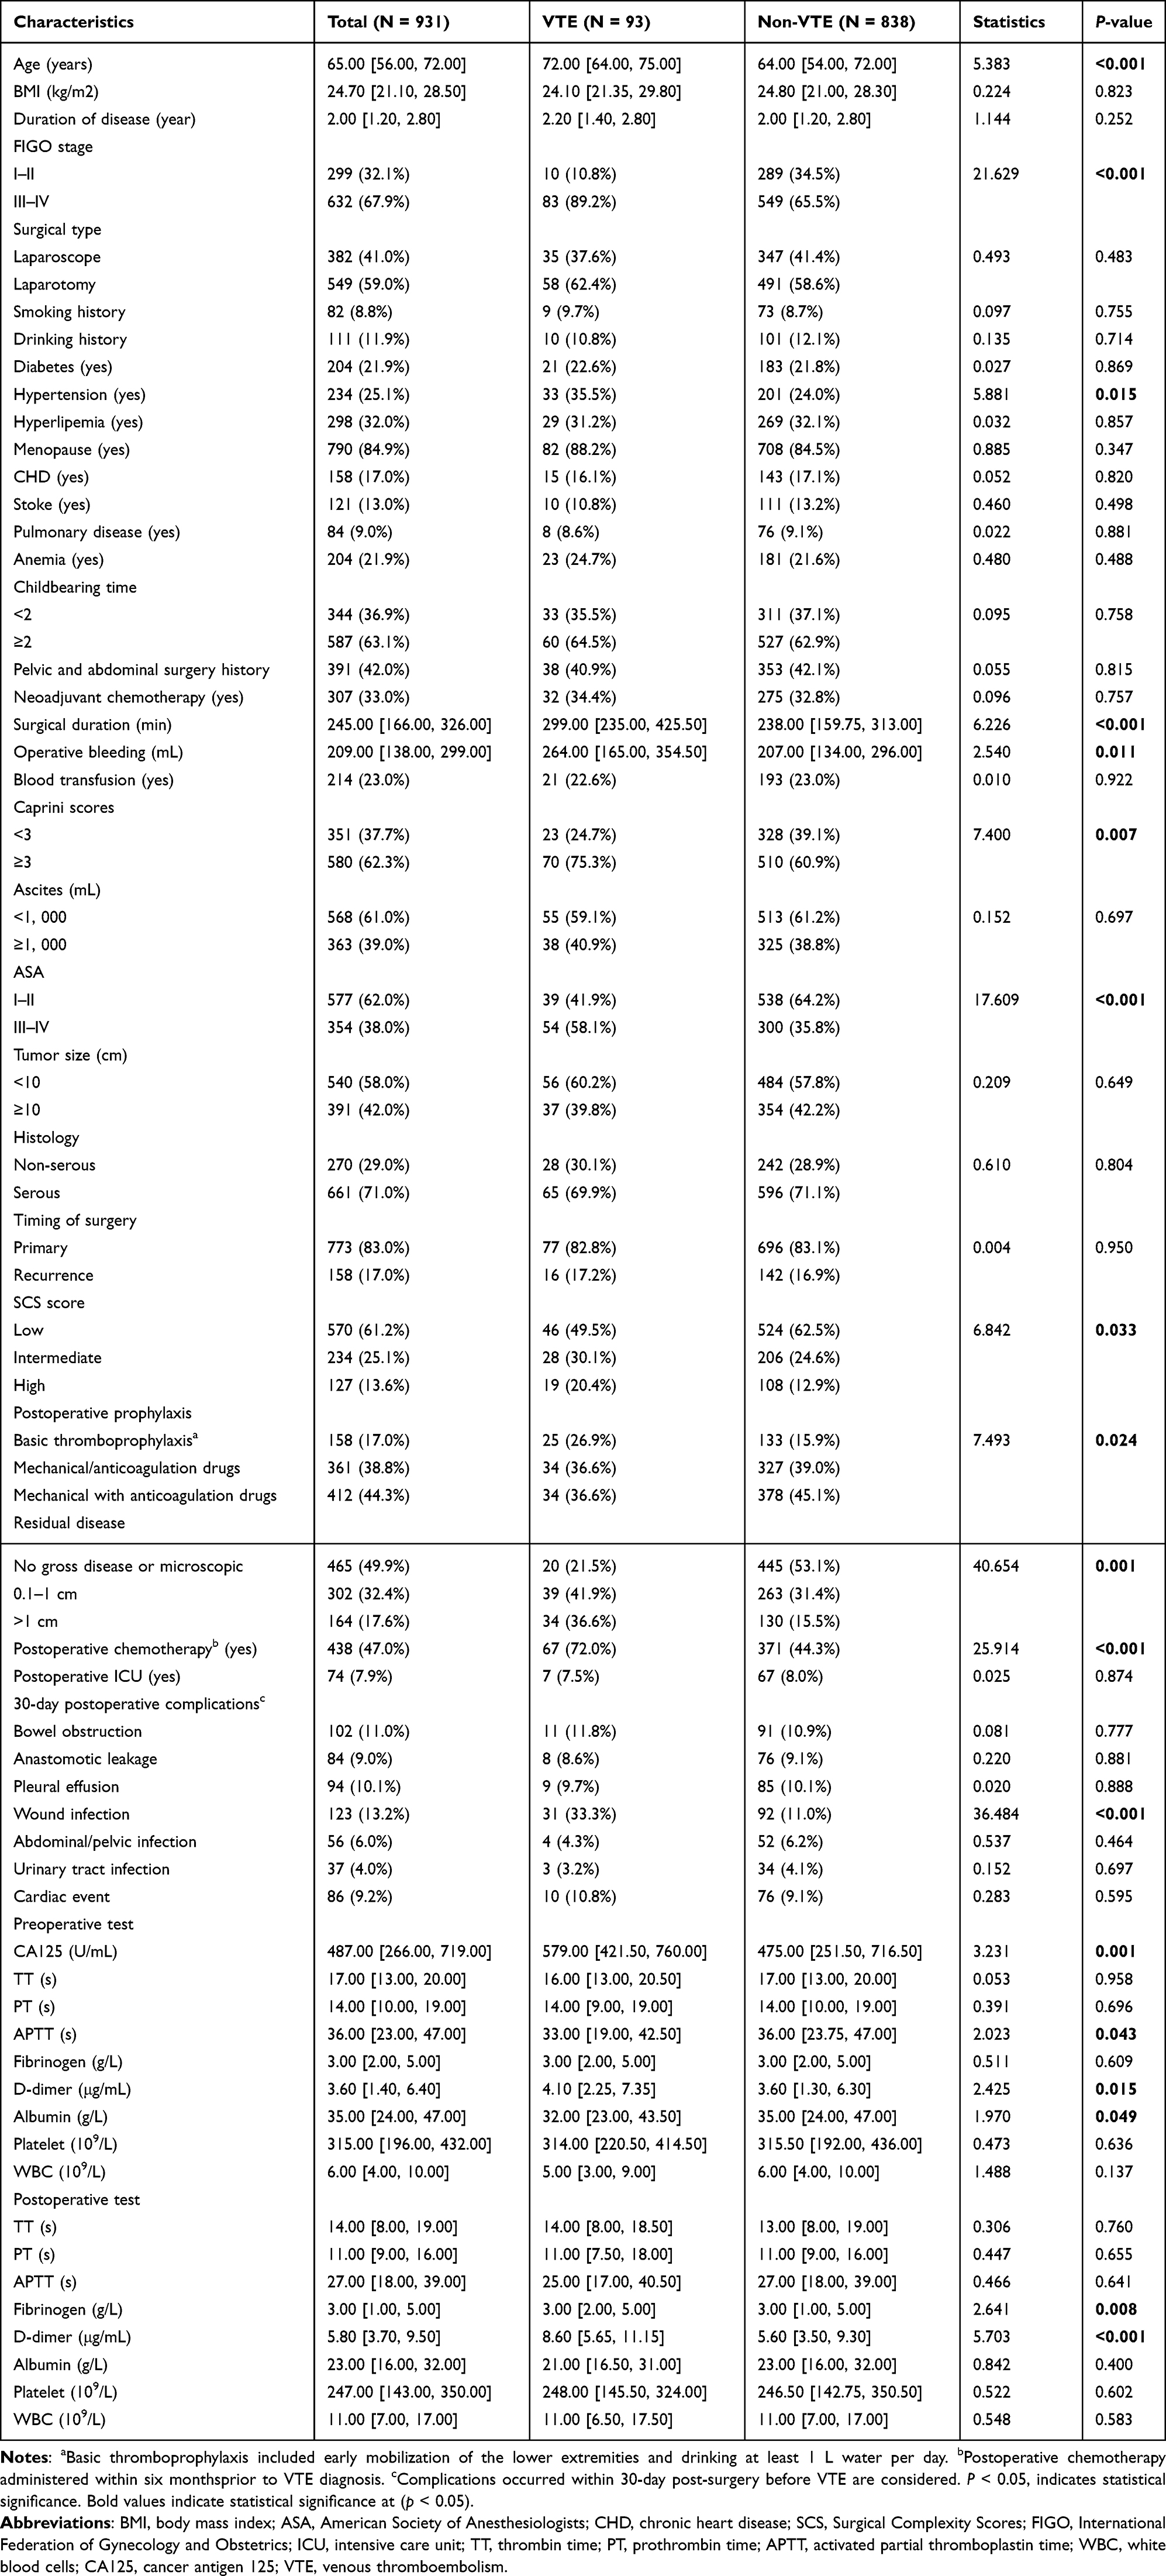 |
Table 1 Baseline Demographic and Clinical Characteristics of Patients with or without VTE |
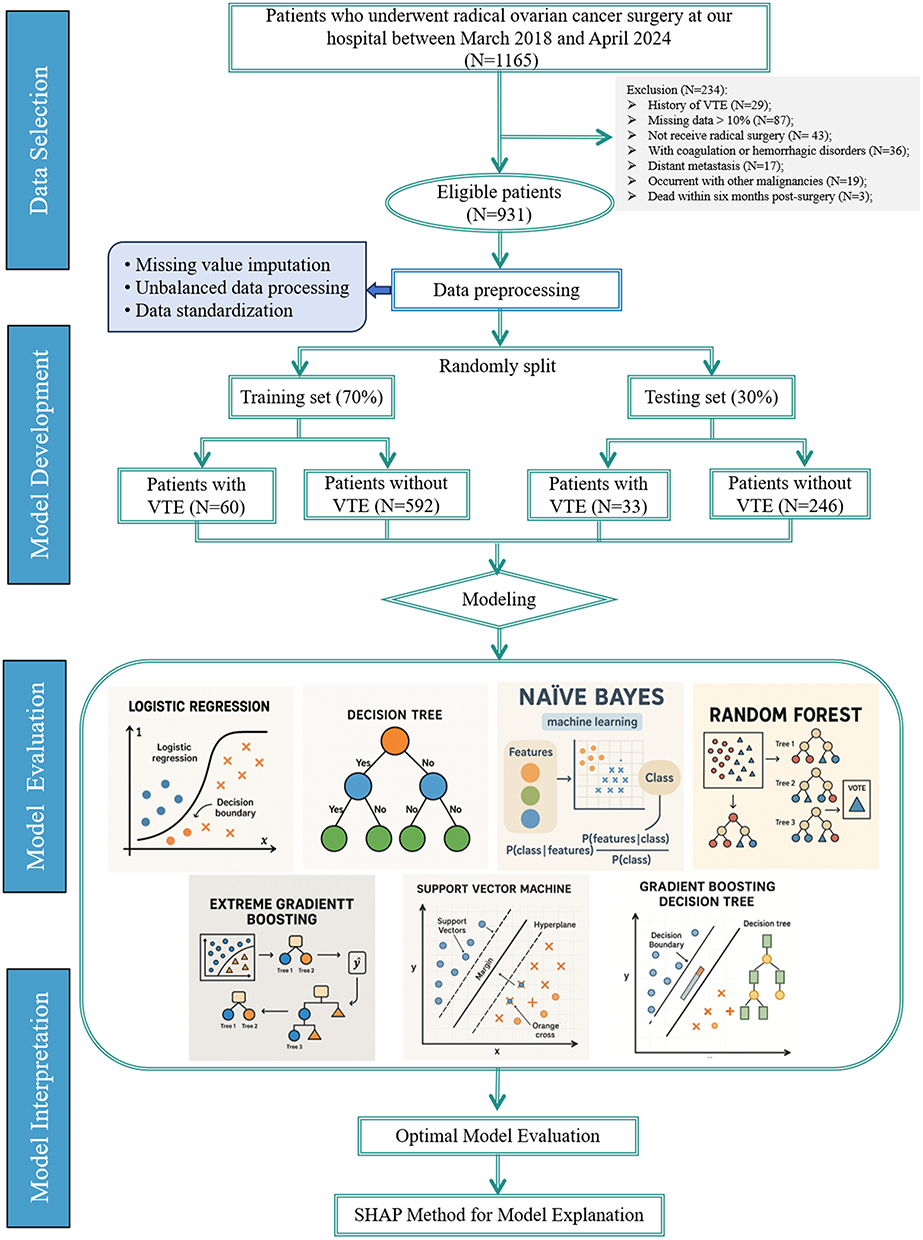 |
Figure 1 Flowchart depicting the patient selection and study process. |
Feature Screening
Feature selection was conducted using the LASSO method. To optimize the regularization parameter λ, 10-fold cross-validation was applied, resulting in a final value of λ = 0.0275 (λ.1se), chosen to prioritize model parsimony. This process retained seven variables (age, FIGO stage, wound infection, residual disease, postoperative chemotherapy, surgical duration, and postoperative D-dimer levels) with non-zero coefficients from an initial set of 56 candidate features, effectively excluding 49 variables whose coefficients approached zero (Figure 2A and B). The selected features were subsequently incorporated into a multiple regression model in which all seven variables demonstrated statistically significant associations with the outcome. These included age (OR = 1.053, 95% CI: 1.021–1.087; p = 0.001), FIGO stage (OR = 3.127, 95% CI: 1.330–7.349; p = 0.008), residual disease (OR = 2.277, 95% CI: 1.542–3.363; p < 0.001), wound infection (OR = 2.358, 95% CI: 1.109–5.014; p = 0.026), surgical duration (OR = 1.004, 95% CI: 1.002−1.006; p < 0.001), postoperative chemotherapy (OR = 3.775, 95% CI: 1.981–7.194; p < 0.001), and postoperative D-dimer levels (OR = 1.085, 95% CI: 1.029–1.144; p = 0.003) (Table 2). The final model retained these features as predictors for the downstream model construction, thereby ensuring a balance between simplicity and predictive accuracy.
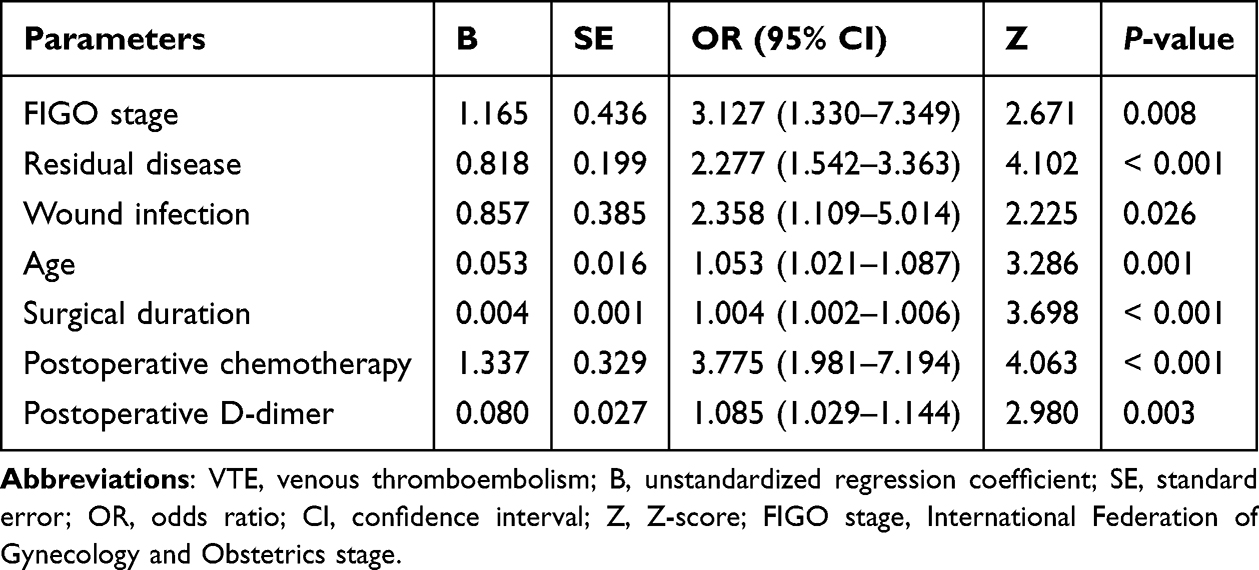 |
Table 2 Multivariate Regression Analysis of Risk Factors for Postoperative VTE in Ovarian Patients |
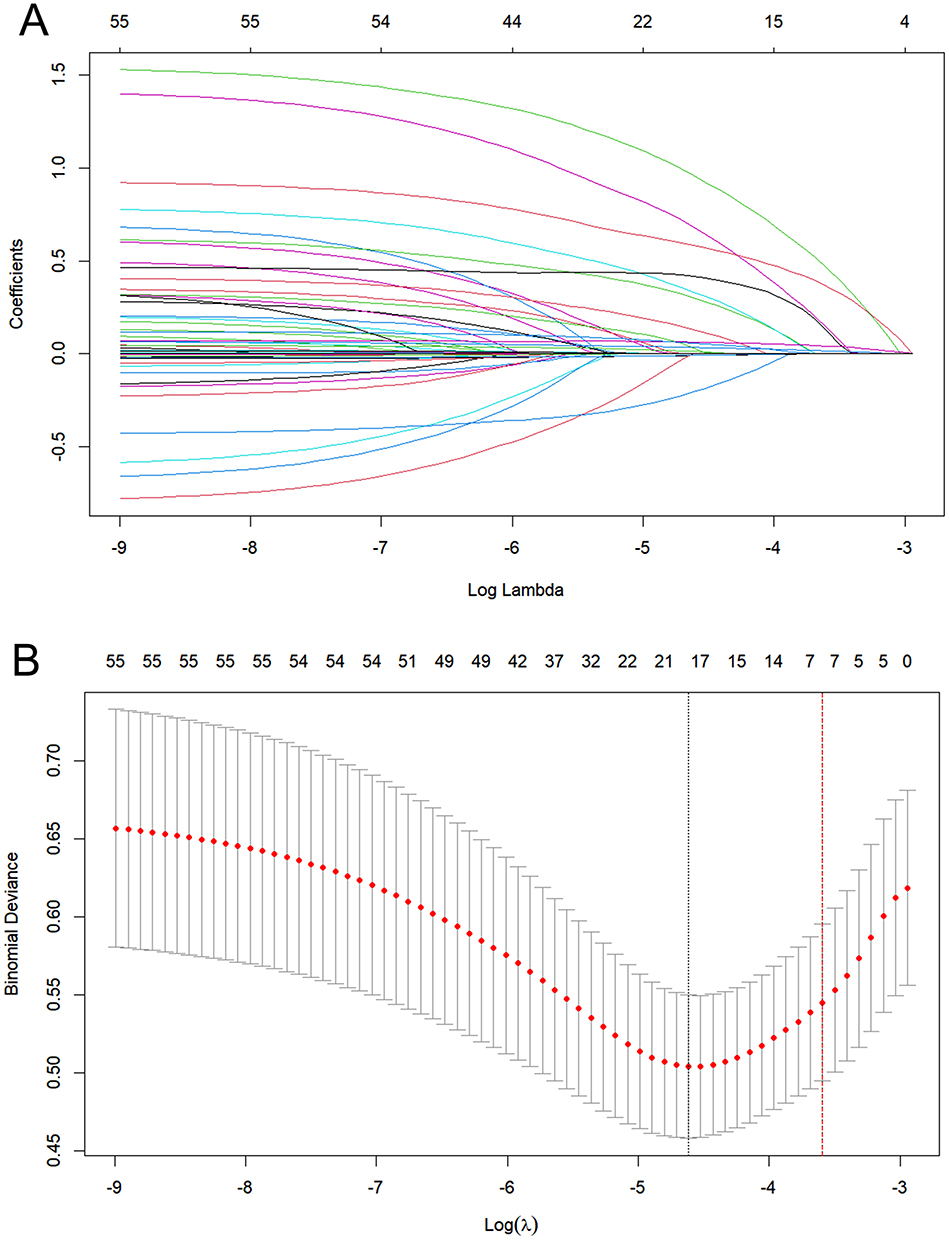 |
Figure 2 Feature Selection using LASSO Regression. (A) LASSO coefficient regulation paths for 56 candidate variables. Each colored trajectory denotes the coefficient magnitude of a variable as the regularization parameter λ decreases. (B) 10-fold cross-validation curve for λ-tuning. The vertical axis represents binomial deviance, with the dotted vertical line marking the λ value corresponding to the minimum error (λ · min, left) and the largest λ within one standard error (λ.1se, right). |
Model Development and Performance
Seven ML algorithms were employed to construct a predictive model to assess the probability of VTE following radical resection of ovarian cancer. In the training cohort, 10-fold cross-validation revealed that the XGBoost model achieved superior discriminative capability, with an AUC of 0.962 (95% CI: 0.941–0.978) and a PR-AUC of 0.950 (95% CI: 0.922–0.974), followed by the DT model, yielding an AUC of 0.955 (95% CI: 0.933–0.974) and a PR-AUC of 0.929 (95% CI: 0.886–0.963) (Figure 3A, B and Table 3). Meanwhile, within the testing cohort, the XGBoost model maintained its robust performance, achieving an AUC of 0.935 (95% CI: 0.902–0.963) and a PR-AUC of 0.620 (95% CI: 0.457–0.809) (Figure 3C and D). Additional metrics included an accuracy of 0.850, recall of 0.849, precision of 0.431, and an F1 score of 0.571 (Figure 4 and Table 3). While the NB model and the LR model exhibited slightly higher PR-AUC values (NB: 0.696, 95% CI: 0.537–0.826 and LR: 0.642, 95% CI: 0.471–0.793) compared to XGBoost, their comparatively lower recall (LR: 0.788) and precision (NB: 0.384) scores indicated reduced reliability in accurately identifying true positive cases within high-risk cohorts. Calibration curves revealed good agreement between predicted probabilities and observed outcomes for the XGBoost model in both training and testing cohorts, with the Brier scores of 0.086 and 0.116, respectively (Figure 5A, B and Table 3). DCA further validated the practical value for the XGBoost model across a wide range of risk thresholds (Figure 5C and D). Notably, for patients with predicted risk probabilities between 1% and 79%, the XGBoost model provided greater net benefit than both “treat-all” and “treat-none” tactics (Figure 5D). Collectively, these findings highlight the XGBoost model as a potential tool for individualized VTE risk stratification in this specific context.
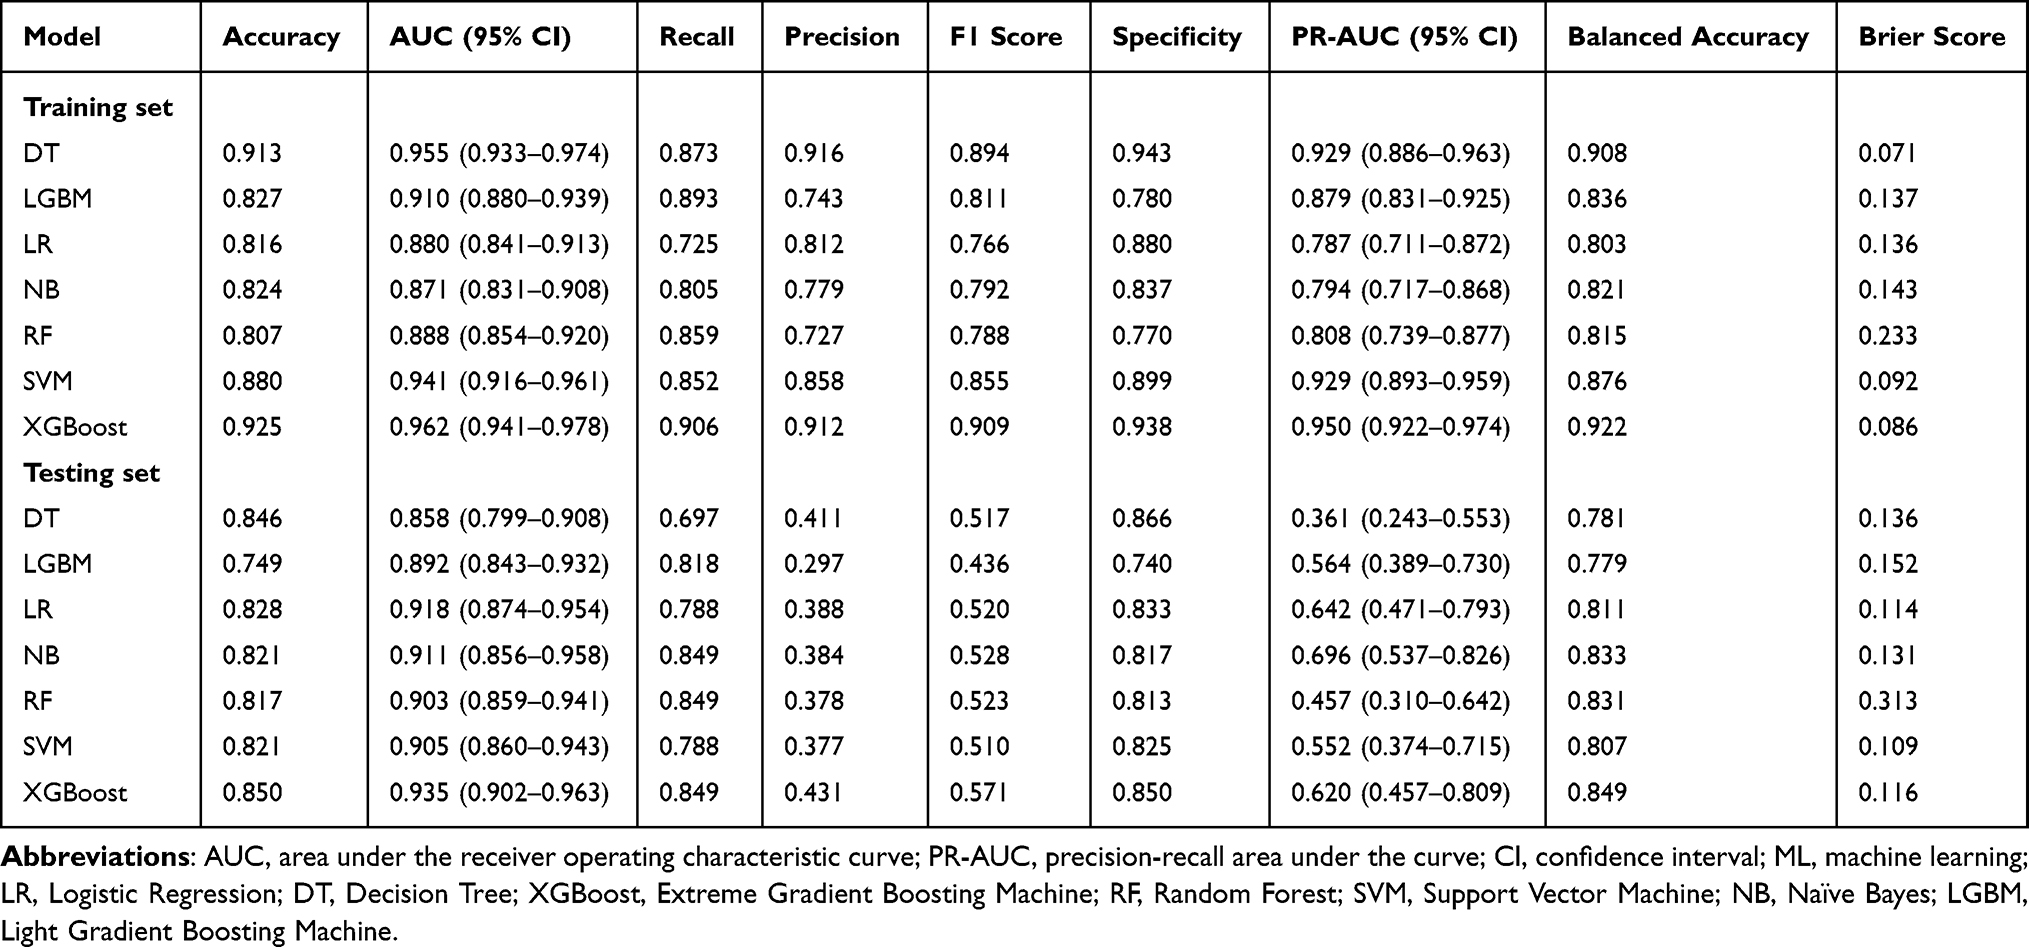 |
Table 3 ML Model Performance Parameters in the Training and Validation Sets |
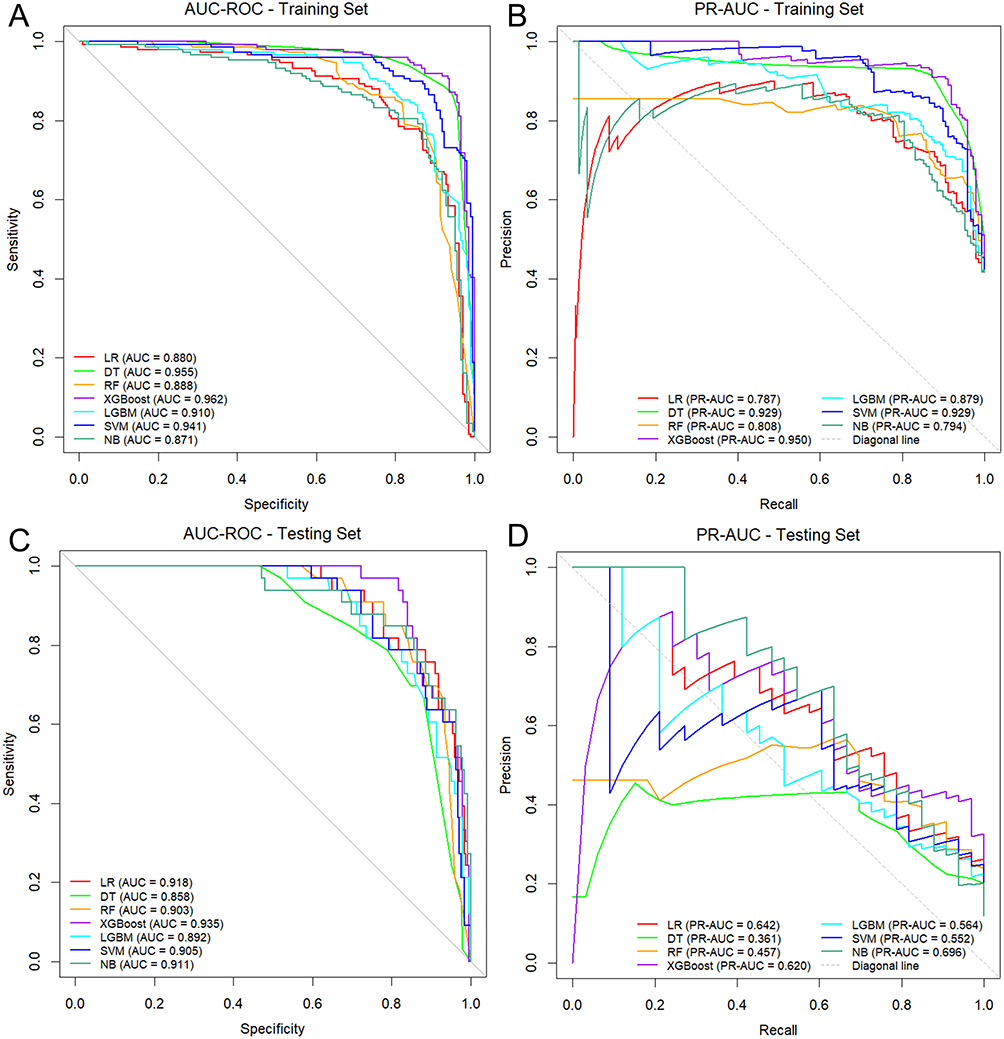 |
Figure 3 Comparison of discriminative performance among seven ML models. (A and B) AUC-ROC and PR-AUC curves for the training cohort. (C and D) AUC-ROC and PR-AUC curves for the testing cohort. |
 |
Figure 4 Radar map illustrating comparative performance analysis of seven ML models across multiple evaluation metrics. Each polygon represents a model with vertices that reflect the normalized score for a given metric. The outermost ring (score = 1) represents the optimal performance. Models with larger polygonal areas indicated superior overall performance. |
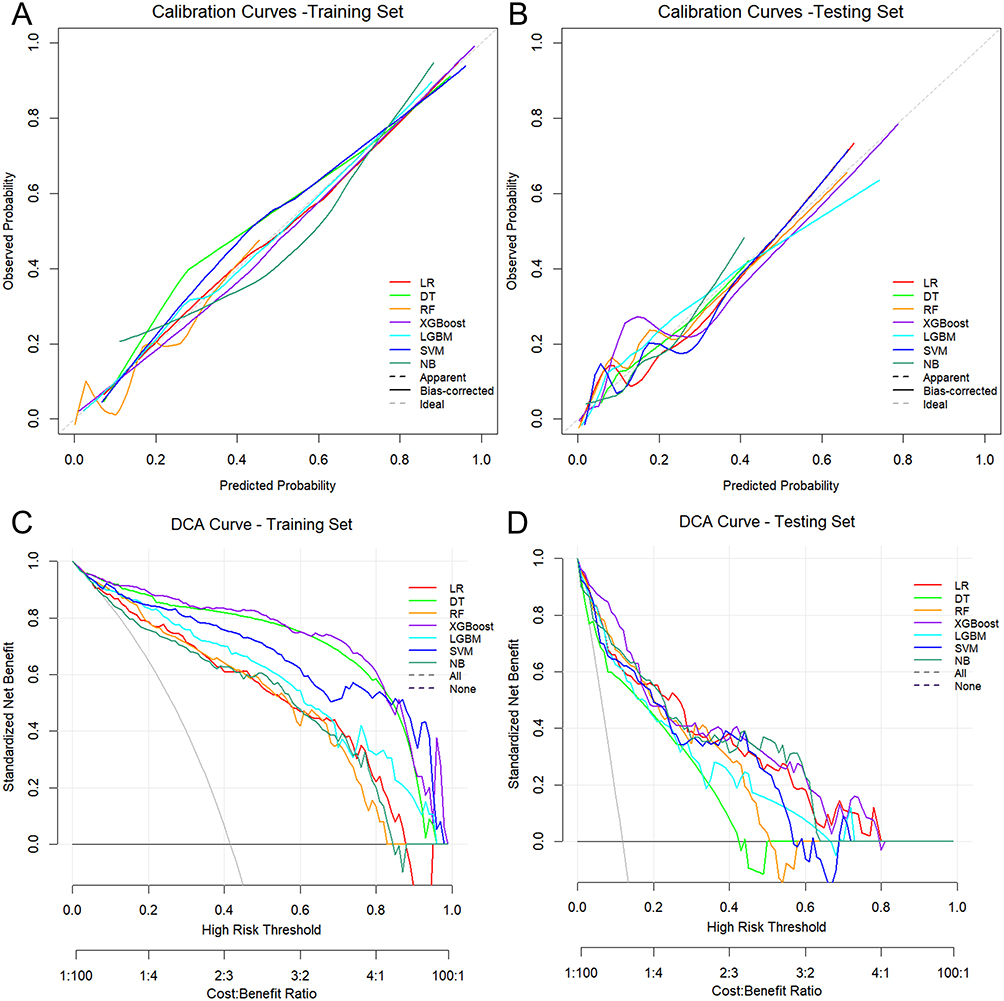 |
Figure 5 Accuracy and clinical utility of seven ML models. (A and B) Calibration curves for the training and testing cohorts. The dashed diagonal line represents the ideal agreement between the predicted probabilities (x-axis) and observed outcomes (y-axis). (C and D) DCA curves of training and testing cohorts. The gray line represents the “treat none” strategy, and the black line represents the “treat all” strategy. Models with curves above these benchmarks demonstrate superior clinical utility. |
Model Interpretation
Variable importance rankings generated by the XGBoost model identified postoperative D-dimer levels as the most significant predictor of postoperative VTE, followed by residual disease, postoperative chemotherapy, and other clinical variables (Figure 6A). To clarify the directional associations of these features with VTE risks, a SHAP summary plot was constructed (Figure 6B). In this visualization, each feature’s contribution was represented by a data point color-coded to reflect its value (yellow: high, purple: low), with horizontal displacement indicating the magnitude and directionality of its effect on risk prediction (rightward: risk-enhancing, leftward: risk-reducing). Notably, macroscopic residual disease (yellow dots) was associated with elevated VTE risk (SHAP > 0), whereas microscopic/no residual disease (purple dots) correlated with reduced risk (SHAP < 0). Prolonged surgical duration (yellow dots) exhibited a positive relationship with VTE risk (SHAP > 0). Similarly, elevated postoperative D-dimer levels (yellow dots) demonstrated a robust positive association with VTE risk (SHAP > 0). Postoperative chemotherapy (yellow dots) consistently increased predicted VTE (SHAP > 0), whereas its omission (purple dots) conferred protective effects (SHAP < 0) (Figure 6B). Advanced FIGO stage (III–IV; SHAP > 0) was linked to heightened VTE risk, in contrast to early-stage disease (I–II; SHAP < 0), which reduced risk. Finally, the presence of wound infection (yellow dots) increased VTE risk (SHAP > 0), while its absence (purple dots) lowered risk (SHAP < 0).
 |
Figure 6 Interpretation of XGBoost model using SHAP analysis. (A) Feature importance ranking for the XGBoost model. (B) SHAP summary plot. Each dot represents a SHAP value for a feature per patient (yellow indicates a higher feature value, and purple indicates a lower feature value). (C and D) SHAP force plots for two representative cases with or without VTE. Color indicates the contribution of each feature, with red being negative (arrow to the left, SHAP value decreases) and yellow being positive (arrow to the right, SHAP value increases). The length of the color bar indicates the strength of the contribution. |
To enhance individual prediction interpretability, SHAP force plots were employed for two clinically representative cases (Figure 6C and D). For the patient diagnosed with VTE (Figure 6C), the omission of postoperative chemotherapy (value = 0, SHAP = −0.0731) served as a protective factor. Conversely, risk-enhancing contributions mainly arose from elevated D-dimer levels (value = 7.8, SHAP = +0.169), macroscopic residual disease (value = 2, SHAP = +0.16), surgical duration (value = 502, SHAP = +0.105), and FIGO stage III–IV (value = 1, SHAP = +0.0791). These factors collectively elevated the predicted risk from a baseline of 0.287 to 0.778. For the non-VTE patient (Figure 6D), protective factors predominated despite advanced age (value = 75, SHAP = +0.0453). Risk-mitigating contributions included lower D-dimer levels (value = 2.9, SHAP = −0.118), absence of residual diseases (value = 0, SHAP = −0.0541), omission of postoperative chemotherapy (value = 0, SHAP = −0.0421), and early FIGO stage (I–II, SHAP = −0.0406), culminating in a final predicted risk of 0.0845, substantially below the baseline value of 0.287.
Discussion
In this study, we developed and validated a ML-based model to predict the risk of VTE in patients undergoing ovarian cancer resection. Among the seven algorithms evaluated, the XGBoost model demonstrated comparatively strong performance, achieving an AUC of 0.935, which may help for high-risk clinical decision-making. Therefore, our findings highlight the potential of ML algorithms to improve risk stratification by capturing nonlinear interactions among clinical parameters. The XGBoost model’s interpretability analysis identified critical predictors of VTE risk, including advanced age, higher FIGO stage, postoperative chemotherapy, extended surgical duration, macroscopic residual disease, elevated postoperative D-dimer levels, and wound infections. Although the XGBoost’s performance is imperfect, its balanced trade-off offers a safer foundational framework for implementation, particularly when supplemented by clinician oversight to adjudicate uncertain cases. These findings could empower healthcare providers and patients to collaboratively consider the likelihood of VTE and weigh it against potential risks and benefits of aggressive anticoagulation strategies, though further validation is needed to bridge the gap between model performance and clinical implementation.
In recent years, there has been significant progress in the application of artificial intelligence (AI) and ML in healthcare, particularly for predicting clinical outcomes in oncology. For ovarian cancer, Ma et al introduced a pioneering AI tool that predicts treatment outcomes via diagnostic laparoscopy, highlighting the potential of AI in enhancing decision-making processes and improving patient management strategies.39 Similarly, Asare et al developed a novel AI modeling tool specifically designed for laparoscopic assessment of ovarian cancer, further demonstrating the transformative role of AI in oncological diagnostics.40 Recent studies have also focused on dynamic risk prediction of VTE in real-world settings using ML algorithms. Lee et al utilized deep learning-based methods to predict VTE risk among ovarian cancer patients, showcasing the ability of advanced algorithms to process electronic health records and provide timely risk assessments.41 Lin et al explored the use of ML models for predicting postoperative VTE in patients with gynecological malignancies, emphasizing the enhanced accuracy of these models over traditional approaches.18
In this study, we observed a six-month postoperative VTE incidence of 10.0%, slightly lower than the previously reported 13.0%.42 This discrepancy might reflect differences in cohort characteristics, such as variations in surgical techniques, tumor stage, or prophylactic protocols. To address the limitations of conventional risk assessment models, which are often reliant on LR and other linear models, we developed an ML-based predictive model using the XGBoost algorithm. This model demonstrated good performance compared to other models, thereby capturing complex, nonlinear interactions among clinical variables—a crucial factor given the multifactorial pathophysiology of postoperative VTE. Our findings align with the emerging evidence supporting the utility of ML models in predicting thromboembolic complications in gynecological cancer.18,43 While traditional LR models remain prevalent due to their interpretability, their linear assumptions limit the ability to model intricate variable interactions.44,45 In contrast, ML algorithms such as RF, XGBoost, and NNet excel at processing heterogeneous datasets, uncovering latent patterns, and generating high-dimensional predictive frameworks.46 Notably, RF and XGBoost models have demonstrated considerable accuracy in predicting VTE risk in gastrointestinal malignancies, further validating the effectiveness of ML approaches in oncology.47,48 In our study, the XGBoost outperformed the other ML algorithms in both the training and testing cohorts. The XGBoost algorithm leverages gradient-boosted decision trees, iteratively refining predictions by sequentially building trees that correct errors of prior models.49 This ensemble approach enhances predictive accuracy by combining weak learners into a robust model, making it particularly effective for uncovering intricate patterns in heterogeneous clinical datasets.50 Its ability to handle nonlinear relationships and feature interactions aligns well with the complexity of clinical outcomes, such as postoperative VTE, where multifactorial risk factors often interplay.
A common critique of ML models, however, is their perceived “black box” nature, where inputs and outputs lack transparent intermediary logic.51 To enhance interpretability, we employed SHAP, a game-theoretic framework that quantifies feature contributions to model predictions.52 SHAP analysis identified seven key predictors of thrombotic risk: age, FlGO stage, postoperative chemotherapy, surgical duration, residual disease, postoperative D-dimer level, and wound infection. These insights not only improve model transparency, but also provide clinicians with actionable mechanistic pathways. For example, advanced age has been consistently identified as a significant independent risk factor for VTE following ovarian cancer resection.45,53 This association may be attributed to age-related physiological declines, such as reduced postoperative mobility leading to venous stasis, diminishing vascular elasticity impairing blood flow dynamics, and endothelial dysfunction that promotes a prothrombotic state.54 Moreover, older patients often have comorbidities like reduced cardiovascular output or respiratory limitations, further slowing venous return and fostering thrombogenesis.55 Therefore, implementing an enhanced recovery after surgery protocol (ERAS) is recommended to counteract age-related fatigue and immobility-driven hypercoagulability in these vulnerable populations.56
Our ML model highlighted the complex multifactorial etiology of postoperative VTE in patients undergoing ovarian cancer resection. Notably, an advanced FIGO stage, macroscopic residual disease, and extended surgical duration were significant predictors of VTE. In particular, advanced FIGO stages (III/IV) may contribute to hypercoagulability through tumor-derived prothrombotic factors, such as tissue factors and inflammatory cytokines, along with an increased tumor burden that compresses pelvic vessels, leading to venous stasis. This finding is consistent with previous studies indicating an increased risk of postoperative VTE in advanced ovarian cancer.57–59 Furthermore, the persistence of residual disease following surgery (notably R1/R2 status) was shown to further elevate the risk of thrombosis, potentially via the ongoing release of pro-coagulant factors and cytokines from the remaining tumor tissue.42 In addition, advanced FIGO stage often necessitates longer surgical procedures, contributing to a compounded risk profile for VTE. Prolonged surgical duration exacerbates this risk by promoting venous stasis due to patient immobilization and escalating endothelial injury through tissue trauma and fluid shifts. This phenomenon is supported by evidence from gynecological oncology cohorts.43,60 By utilizing our predictive model, clinicians can more effectively identify high-risk patients and optimize nursing interventions, such as administering postoperative LMWH to counteract sustained hypercoagulability due to residual tumor burden and enhancing surgical efficiency through multidisciplinary planning aimed at reducing operative time.61,62
Our findings underscore the significant interrelationships among postoperative chemotherapy, D-dimer concentrations, surgical site infections, and VTE in patients undergoing ovarian cancer resection. It is demonstrated that an elevated surgical burden may predispose patients to a hypercoagulable state by upregulating prothrombotic mediators.63 This condition potentially synergizes with postoperative fibrinolytic activation, as evidenced by heightened D-dimer levels, thereby amplifying VTE risk.64 D-dimer, a fibrin split product, is frequently employed as a marker for systemic coagulation activation. Elevated plasma levels of D-dimer are associated with tumor progression and poor survival outcomes in ovarian cancer patients.65 Simultaneously, surgical site infections likely exacerbate endothelial dysfunction and inflammatory responses, further destabilizing hemostatic balance.66 Postoperative chemotherapy also increases thrombotic risk, as adjuvant therapeutic agents induce endothelial dysfunction and platelet activation while suppressing anticoagulant proteins during recovery, which may perpetuate stasis.67 This triad—prolonged prothrombotic state associated with chemotherapy, fibrinolytic dysregulation induced by D-dimer, and localized infection—appears to serve as a multifactorial contributor to thrombogenesis. Clinically, incorporating these biomarkers into our ML model enhanced the predictive accuracy for VTE, emphasizing their utility in identifying high-risk cohorts. This finding aligns with previous studies,9,68 and emphasizes the underrecognized role of wound-related inflammation in the thrombotic pathways associated with ovarian cancer.69 Future research should explore longitudinal biomarker trajectories and targeted interventions to mitigate this synergistic risk.
Limitations
This study has several limitations. First, the retrospective single-center design and the relatively small test dataset (N = 279) inherently limit the generalizability of our findings. The lack of an external validation cohort further restricts the clinical applicability of the predictive model across diverse populations or clinical settings. Second, the dataset imbalance (eg, only 10% VTE incidence) may have inflated metrics like accuracy while masking inefficacy in predicting minority-class outcomes. Although SMOTETomek sampling was employed to address this imbalance, residual confounding bias cannot be ruled out. Third, missing data—particularly regarding anticoagulation adherence and preoperative coagulation parameters—necessitated imputation. While rigorous methods such as MissForest were applied to minimize bias, unmeasured confounding factors may persist. Future prospective investigations should incorporate real-time adherence monitoring and longitudinal coagulation profiling to reduce reliance on imputation. Fourth, the exclusion of patients with prior VTE or coagulation disorders might restrict the applicability of the model to higher-risk cohorts, as predictors were derived from a comparatively lower-risk population. Subsequent research should prioritize stratified analyses or subgroup-specific models tailored to these excluded cohorts. Finally, while seven established ML algorithms were rigorously evaluated, this scope may not encompass the full spectrum of ML methodologies. To enhance clinical utility, future work should focus on external validation in large-scale multicenter cohorts, employ advanced techniques such as synthetic minority oversampling or hybrid ensemble modeling, and rigorously address dataset imbalance to improve robustness for underrepresented outcomes.
Conclusion
This study developed and validated an ML-based predictive model to predict postoperative VTE in patients undergoing ovarian cancer resection, with the XGBoost algorithm achieving good predictive accuracy (AUC: 0.935). Interpretability analysis revealed critical predictors of VTE risk, including advanced age, higher FIGO stage, administration of postoperative chemotherapy, extended surgical duration, macroscopic residual disease, elevated postoperative D-dimer levels, and wound infections. This framework provides a foundation for advancing precision medicine in postoperative care, with the ultimate goal of reducing morbidity and optimizing thromboprophylaxis in high-risk oncology populations.
Data Sharing Statement
The datasets used and analyzed during the current study are available from the corresponding author upon reasonable request.
Ethics Approval and Consent to Participate
This study was approved by the Ethics Review Committee of Shengjing Hospital of China Medical University (No. 2025PS1207K) and was conducted in accordance with the Declaration of Helsinki (2013). The requirement for written informed consent was waived because of the retrospective design of the study.
Author Contributions
All authors made a significant contribution to the work reported, whether in the conception, study design, execution, acquisition of data, analysis, and interpretation, or in all these areas, took part in drafting, revising, or critically reviewing the article; gave final approval of the version to be published; have agreed on the journal to which the article has been submitted; and agree to be accountable for all aspects of the work.
Funding
This study received no funding.
Disclosure
The authors declare that they have no conflicts of interest in this work.
References
1. Sung H, Ferlay J, Siegel RL, et al. Global Cancer Statistics 2020: GLOBOCAN estimates of incidence and mortality worldwide for 36 cancers in 185 countries. CA Cancer J Clin. 2021;71(3):209–249. doi:10.3322/caac.21660
2. Narasimhulu DM, Khoury-Collado F, Chi DS. Radical surgery in ovarian cancer. Curr Oncol Rep. 2015;17(4):16. doi:10.1007/s11912-015-0439-z
3. Lavikainen LI, Guyatt GH, Luomaranta AL, et al. Risk of thrombosis and bleeding in gynecologic cancer surgery: systematic review and meta-analysis. Am J Obstet Gynecol. 2024;230(4):403–416. doi:10.1016/j.ajog.2023.10.006
4. Xu Y, Jia Y, Zhang Q, et al. Incidence and risk factors for postoperative venous thromboembolism in patients with ovarian cancer: systematic review and meta-analysis. Gynecol Oncol. 2021;160(2):610–618. doi:10.1016/j.ygyno.2020.11.010
5. Knisely A, Iniesta MD, Batman S, et al. Efficacy, safety, and feasibility of Apixaban for postoperative venous thromboembolism prophylaxis following open gynecologic cancer surgery at a comprehensive cancer center. Gynecol Oncol. 2024;183:120–125. doi:10.1016/j.ygyno.2024.01.039
6. Tateo S, Mereu L, Salamano S, et al. Ovarian cancer and venous thromboembolic risk. Gynecol Oncol. 2005;99(1):119–125. doi:10.1016/j.ygyno.2005.05.009
7. Rodriguez AO, Wun T, Chew H, et al. Venous thromboembolism in ovarian cancer. Gynecol Oncol. 2007;105(3):784–790. doi:10.1016/j.ygyno.2007.02.024
8. Gunderson CC, Thomas ED, Slaughter KN, et al. The survival detriment of venous thromboembolism with epithelial ovarian cancer. Gynecol Oncol. 2014;134(1):73–77. doi:10.1016/j.ygyno.2014.04.046
9. Abu SF, Norris L, O’Toole S, et al. Venous thromboembolism in ovarian cancer: incidence, risk factors and impact on survival. Eur J Obstet Gynecol Reprod Biol. 2013;170(1):214–218. doi:10.1016/j.ejogrb.2013.06.004
10. Romano F, Di Lorenzo G, Stabile G, et al. A systematic review of the guidelines on venous thromboembolism prophylaxis in gynecologic oncology. Cancers. 2022;14(10):2439. doi:10.3390/cancers14102439
11. Lu X, Zeng W, Zhu L, et al. Application of the Caprini risk assessment model for deep vein thrombosis among patients undergoing laparoscopic surgery for colorectal cancer. Medicine. 2021;100(4):e24479. doi:10.1097/MD.0000000000024479
12. Yang Y, Wang X, Huang Y, et al. Ontology-based venous thromboembolism risk assessment model developing from medical records. BMC Med Inform Decis Mak. 2019;19(Suppl 4):151. doi:10.1186/s12911-019-0856-2
13. Pandor A, Tonkins M, Goodacre S, et al. Risk assessment models for venous thromboembolism in hospitalised adult patients: a systematic review. BMJ Open. 2021;11(7):e045672. doi:10.1136/bmjopen-2020-045672
14. Sadr H, Nazari M, Khodaverdian Z, et al. Unveiling the potential of artificial intelligence in revolutionizing disease diagnosis and prediction: a comprehensive review of machine learning and deep learning approaches. Eur J Med Res. 2025;30(1):418. doi:10.1186/s40001-025-02680-7
15. Eloranta S, Boman M. Predictive models for clinical decision making: deep dives in practical machine learning. J Intern Med. 2022;292(2):278–295. doi:10.1111/joim.13483
16. Chakraborty C, Bhattacharya M, Pal S, et al. From machine learning to deep learning: advances of the recent data-driven paradigm shift in medicine and healthcare. Current Res Biotechnol. 2024;7:100164. doi:10.1016/j.crbiot.2023.100164
17. Tran KA, Kondrashova O, Bradley A, et al. Deep learning in cancer diagnosis, prognosis and treatment selection. Genome Med. 2021;13(1):152. doi:10.1186/s13073-021-00968-x
18. Lin B, Chen F, Wu M, et al. Machine learning models for prediction of postoperative venous thromboembolism in gynecological malignant tumor patients. J Obstet Gynaecol Res. 2024;50(7):1175–1181. doi:10.1111/jog.15960
19. Hu YH, Wu RY, Lin YC, et al. A novel MissForest-based missing values imputation approach with recursive feature elimination in medical applications. BMC Med Res Methodol. 2024;24(1):269. doi:10.1186/s12874-024-02392-2
20. Jamshidian M, Jalal S, Jansen C. MissMech: an R package for testing homoscedasticity, multivariate normality, and missing completely at random (MCAR). J Stat Softw. 2014;56(6):1–31. doi:10.18637/jss.v056.i06
21. Alsaber A, Al-Herz A, Pan J, et al. Handling missing data in a rheumatoid arthritis registry using random forest approach. Int J Rheum Dis. 2021;24(10):1282–1293. doi:10.1111/1756-185X.14203
22. Guo CY, Yang YC, Chen YH. The optimal machine learning-based missing data imputation for the Cox proportional hazard model. Front Public Health. 2021;9:680054. doi:10.3389/fpubh.2021.680054
23. Ma XJ, Mai YQ, Ma Y, et al. Constructing an early warning model for elderly sepsis patients based on machine learning. Sci Rep. 2025;15(1):10580. doi:10.1038/s41598-025-95604-8
24. Khushi M, Shaukat K, Alam TM, et al. A comparative performance analysis of data resampling methods on imbalance medical data. IEEE Access. 2021;9:109960–109975. doi:10.1109/ACCESS.2021.3102399
25. Wang Z, Wu C, Zheng K, et al. SMOTETomek-based resampling for personality recognition. IEEE Access. 2019;7:129678–129689. doi:10.1109/ACCESS.2019.2940061
26. Stoltzfus JC. Logistic regression: a brief primer. Acad Emerg Med. 2011;18(10):1099–1104. doi:10.1111/j.1553-2712.2011.01185.x
27. Song YY, Lu Y. Decision tree methods: applications for classification and prediction. Shanghai Arch Psychiatry. 2015;27(2):130–135. doi:10.11919/j.issn.1002-0829.215044
28. Chen T, Guestrin C. Xgboost: a scalable tree boosting system. In:
29. Breiman L. Random forests. Machine Learning. 2001;45(1):5–32. doi:10.1023/A:1010933404324
30. Ke G, Meng Q, Finley T, et al. Lightgbm: a highly efficient gradient boosting decision tree. Adv Neural Inf Process Syst. 2017;30.
31. Hearst MA, Dumais ST, Osuna E, et al. Support vector machines. IEEE Intell Syst Appl. 1998;13(4):18–28. doi:10.1109/5254.708428
32. Sugahara S, Ueno M. Exact learning augmented Naive Bayes Classifier. Entropy. 2021;23(12):1703. doi:10.3390/e23121703
33. Rainio O, Teuho J, Klén R. Evaluation metrics and statistical tests for machine learning. Sci Rep. 2024;14(1):6086. doi:10.1038/s41598-024-56706-x
34. Boyd K, Eng KH, Page CD. Area under the precision-recall curve: point estimates and confidence intervals. In:
35. Wang L, Li J, Lin Y, et al. Establishment and external validation of an early warning model of diabetic peripheral neuropathy based on random forest and logistic regression. BMC Endocr Disord. 2024;24(1):196. doi:10.1186/s12902-024-01728-9
36. Hanna MG, Olson NH, Zarella M, et al. Recommendations for performance evaluation of machine learning in pathology: a concept paper from the college of American pathologists. Arch Pathol Lab Med. 2024;148(10):e335–e61. doi:10.5858/arpa.2023-0042-CP
37. Vickers AJ, Van Calster B, Steyerberg EW. Net benefit approaches to the evaluation of prediction models, molecular markers, and diagnostic tests. BMJ. 2016;352:i6. doi:10.1136/bmj.i6
38. Nohara Y, Matsumoto K, Soejima H, et al. Explanation of machine learning models using shapley additive explanation and application for real data in hospital. Comput Methods Programs Biomed. 2022;214:106584. doi:10.1016/j.cmpb.2021.106584
39. Ma X, Hsu YC, Asare A, et al. A pioneering artificial intelligence tool to predict treatment outcomes in ovarian cancer via diagnostic laparoscopy. Sci Rep. 2025;15(1):14437. doi:10.1038/s41598-025-98434-w
40. Asare A, Ma X, Hsu YC, et al. Pixel Pioneers: a novel artificial intelligence modeling tool for laparoscopic assessment of ovarian carcinoma. Gynecol Oncol. 2024;190:S46–S7.
41. Lee D, Kim S, Lee S, et al. Deep learning-based dynamic risk prediction of venous thromboembolism for patients with ovarian cancer in real-world settings from electronic health records. JCO Clin Cancer Inform. 2024;8:e2300192. doi:10.1200/CCI.23.00192
42. Wagner BE, Langstraat CL, McGree ME, et al. Beyond prophylaxis: extended risk of venous thromboembolism following primary debulking surgery for ovarian cancer. Gynecol Oncol. 2019;152(2):286–292. doi:10.1016/j.ygyno.2018.11.021
43. Chen X, Hou M, Wang D. Machine learning-based model for prediction of deep vein thrombosis after gynecological laparoscopy: a retrospective cohort study. Medicine. 2024;103(1):e36717. doi:10.1097/MD.0000000000036717
44. Huang Z, Li L, Gong Z, et al. Construction and validation of a nomogram to predict the postoperative venous thromboembolism risk in patients with HGSOC. Clin Appl Thromb Hemost. 2024;30:10760296241255958. doi:10.1177/10760296241255958
45. Chen Y, Li X, Yuan L, et al. Development and validation of a nomogram for predicting venous thromboembolism risk in post-surgery patients with cervical cancer. World J Surg Oncol. 2024;22(1):354. doi:10.1186/s12957-024-03649-2
46. Mudrik A, Efros O. Artificial intelligence and venous thromboembolism: a narrative review of applications, benefits, and limitations. Acta Haematol. 2025;1–10. doi:10.1159/000545760
47. Qin L, Liang Z, Xie J, et al. Development and validation of machine learning models for postoperative venous thromboembolism prediction in colorectal cancer inpatients: a retrospective study. J Gastrointest Oncol. 2023;14(1):220–232. doi:10.21037/jgo-23-18
48. Xu Q, Lei H, Li X, et al. Machine learning predicts cancer-associated venous thromboembolism using clinically available variables in gastric cancer patients. Heliyon. 2023;9(1):e12681. doi:10.1016/j.heliyon.2022.e12681
49. Shi X, Wong YD, Li MZ, et al. A feature learning approach based on XGBoost for driving assessment and risk prediction. Accid Anal Prev. 2019;129:170–179. doi:10.1016/j.aap.2019.05.005
50. Hakkal S, Lahcen AA. XGBoost to enhance learner performance prediction. Comput Educ. 2024;7:100254. doi:10.1016/j.caeai.2024.100254
51. Savage N. Breaking into the black box of artificial intelligence. Nature. 2022. doi:10.1038/d41586-022-00858-1
52. Wang H, Liang Q, Hancock JT, et al. Feature selection strategies: a comparative analysis of SHAP-value and importance-based methods. J Big Data. 2024;11(1):44. doi:10.1186/s40537-024-00905-w
53. Mokri B, Mariani A, Heit JA, et al. Incidence and predictors of venous thromboembolism after debulking surgery for epithelial ovarian cancer. Int J Gynecol Cancer. 2013;23(9):1684–1691. doi:10.1097/IGC.0b013e3182a80aa7
54. Zhou Q, Zhu C, Shen Z, et al. Incidence and potential predictors of thromboembolic events in epithelial ovarian carcinoma patients during perioperative period. Eur J Surg Oncol. 2020;46(5):855–861. doi:10.1016/j.ejso.2020.01.026
55. Linnemann B, Rott H, Zotz R, et al. Venous thromboembolism issues in women. Hamostaseologie. 2022;42(5):290–299. doi:10.1055/a-1919-9558
56. Tankou JI, Foley O, Falzone M, et al. Enhanced recovery after surgery protocols improve time to return to intended oncology treatment following interval cytoreductive surgery for advanced gynecologic cancers. Int J Gynecol Cancer. 2021;31(8):1145–1153. doi:10.1136/ijgc-2021-002495
57. Weeks KS, Herbach E, McDonald M, et al. Meta-analysis of VTE risk: ovarian cancer patients by stage, histology, cytoreduction, and ascites at diagnosis. Obstet Gynecol Int. 2020;2020:2374716. doi:10.1155/2020/2374716
58. Black D, Iasonos A, Ahmed H, et al. Effect of perioperative venous thromboembolism on survival in ovarian, primary peritoneal, and fallopian tube cancer. Gynecol Oncol. 2007;107(1):66–70. doi:10.1016/j.ygyno.2007.05.040
59. Matsuura Y, Robertson G, Marsden DE, et al. Thromboembolic complications in patients with clear cell carcinoma of the ovary. Gynecol Oncol. 2007;104(2):406–410. doi:10.1016/j.ygyno.2006.08.026
60. Clarke-Pearson DL, Abaid LN. Prevention of venous thromboembolic events after gynecologic surgery. Obstet Gynecol. 2012;119(1):155–167. doi:10.1097/AOG.0b013e31823d389e
61. Zhou H, Chen TT, Ye LL, et al. Efficacy and safety of direct oral anticoagulants versus low-molecular-weight heparin for thromboprophylaxis after cancer surgery: a systematic review and meta-analysis. World J Surg Oncol. 2024;22(1):69. doi:10.1186/s12957-024-03341-5
62. Zhou H, Ye LL, Zhou JT, et al. Direct oral anticoagulants (DOACs) versus low-molecular-weight heparin (LMWH) for extended thromboprophylaxis following major abdominal/pelvic cancer-related surgery: a systematic review and meta-analysis. Surg Endosc. 2024;38(3):1131–1138. doi:10.1007/s00464-023-10649-y
63. Kim JY, Khavanin N, Rambachan A, et al. Surgical duration and risk of venous thromboembolism. JAMA Surg. 2015;150(2):110–117. doi:10.1001/jamasurg.2014.1841
64. Swier N, Versteeg HH. Reciprocal links between venous thromboembolism, coagulation factors and ovarian cancer progression. Thromb Res. 2017;150:8–18. doi:10.1016/j.thromres.2016.12.002
65. Sakurai M, Satoh T, Matsumoto K, et al. High pretreatment plasma D-dimer levels are associated with poor prognosis in patients with ovarian cancer independently of venous thromboembolism and tumor extension. Int J Gynecol Cancer. 2015;25(4):593–598. doi:10.1097/IGC.0000000000000415
66. Colling ME, Tourdot BE, Kanthi Y. Inflammation, infection and venous thromboembolism. Circ Res. 2021;128(12):2017–2036. doi:10.1161/CIRCRESAHA.121.318225
67. Htut TW, Thein KZ, Oo TH. Meta-analysis of randomized controlled trials on primary ambulatory thromboprophylaxis in patients with ovarian cancer receiving chemotherapy. Bayl Univ Med Cent Proc. 2022;35(3):332–336. doi:10.1080/08998280.2022.2026187
68. Wang Y, Zhou H, Zhong G, et al. Development and validation of a nomogram to predict the probability of venous thromboembolism in patients with epithelial ovarian cancer. Clin Appl Thromb Hemost. 2022;28:10760296221095558. doi:10.1177/10760296221095558
69. Wang X, Wang E, Kavanagh JJ, et al. Ovarian cancer, the coagulation pathway, and inflammation. J Transl Med. 2005;3:25. doi:10.1186/1479-5876-3-25
 © 2025 The Author(s). This work is published and licensed by Dove Medical Press Limited. The
full terms of this license are available at https://www.dovepress.com/terms
and incorporate the Creative Commons Attribution
- Non Commercial (unported, 4.0) License.
By accessing the work you hereby accept the Terms. Non-commercial uses of the work are permitted
without any further permission from Dove Medical Press Limited, provided the work is properly
attributed. For permission for commercial use of this work, please see paragraphs 4.2 and 5 of our Terms.
© 2025 The Author(s). This work is published and licensed by Dove Medical Press Limited. The
full terms of this license are available at https://www.dovepress.com/terms
and incorporate the Creative Commons Attribution
- Non Commercial (unported, 4.0) License.
By accessing the work you hereby accept the Terms. Non-commercial uses of the work are permitted
without any further permission from Dove Medical Press Limited, provided the work is properly
attributed. For permission for commercial use of this work, please see paragraphs 4.2 and 5 of our Terms.
Recommended articles
Development and Validation of Machine Learning Models for Prediction of Fracture Risk in Patients with Elderly-Onset Rheumatoid Arthritis
Chen R, Huang Q, Chen L
International Journal of General Medicine 2022, 15:7817-7829
Published Date: 14 October 2022
A Lung Ultrasound-Based Nomogram for the Prediction of Refractory Mycoplasma pneumoniae Pneumonia in Hospitalized Children
Liu G, Wang G, Yang Z, Liu G, Ma H, Lv Y, Ma F, Zhu W
Infection and Drug Resistance 2022, 15:6343-6355
Published Date: 31 October 2022
Establishment and Validation of a Predictive Nomogram for Hallux Valgus with Pain Under the Second Metatarsal
Bai Z, Cao X, Yang Y, Sun X, Dong Y, Wen J, Sun W
Journal of Pain Research 2022, 15:3523-3536
Published Date: 7 November 2022
Development and Validation of a Predictive Model for Chronic Postsurgical Pain After Arthroscopic Rotator Cuff Repair: A Prospective Cohort Study
Dai X, Yuan M, Dang M, Liu D, Fei W
Journal of Pain Research 2023, 16:3273-3288
Published Date: 27 September 2023
Unraveling the Predictors of Enlarged Perivascular Spaces: A Comprehensive Logistic Regression Approach in Cerebral Small Vessel Disease
Li N, Shao JM, Jiang Y, Wang CH, Li SB, Wang DC, Di WY
International Journal of General Medicine 2024, 17:2513-2525
Published Date: 1 June 2024