
Back to Journals » International Journal of Chronic Obstructive Pulmonary Disease » Volume 21
A Machine Learning–Derived Risk Score Based on Dietary Nutrient Intake for Early Detection and Prognostic Prediction of Preserved Ratio Impaired Spirometry
Authors Xie Q, Qu H, Xie S, Lan R, Li J
Received 22 August 2025
Accepted for publication 8 January 2026
Published 13 March 2026 Volume 2026:21 562473
DOI https://doi.org/10.2147/COPD.S562473
Checked for plagiarism Yes
Review by Single anonymous peer review
Peer reviewer comments 2
Editor who approved publication: Prof. Dr. Richard Russell
Qihang Xie,1 Haoran Qu,1 Siyu Xie,2 Rui Lan,1 Jianfeng Li3
1Department of Cardiothoracic Surgery, The First Affiliated Hospital of Chongqing Medical University, Chongqing, People’s Republic of China; 2United Graduate School of Child Development, The University of Osaka, Suita, Osaka, 565-0871, Japan; 3Department of Cardiothoracic Surgery, The Second Affiliated Hospital of Chongqing Medical University, Chongqing, 400010, People’s Republic of China
Correspondence: Jianfeng Li, Department of Cardiothoracic Surgery, The Second Affiliated Hospital of Chongqing Medical University, No. 74 Linjiang Road, Yuzhong District, Chongqing, 400010, People’s Republic of China, Email [email protected]
Background: Preserved Ratio Impaired Spirometry (PRISm) is a subclinical pulmonary phenotype associated with increased risk of chronic obstructive pulmonary disease (COPD), cardiovascular disease, and all-cause mortality. Early identification and stratified prevention of PRISm remain a clinical challenge.
Methods: Using data from the US National Health and Nutrition Examination Survey (NHANES) 2007– 2012, we developed and validated a stacked machine learning (ML) model integrating dietary intake and demographic features to generate a continuous PRISm risk score. The dataset was split into training, validation, and test sets. Model performance was evaluated using ROC curves and calibration. The associations between the risk score and adverse health outcomes were assessed using logistic regression and Kaplan–Meier analysis. Subgroup analysis was performed to assess the impact of lifestyle across risk strata.
Results: The stacked ML model demonstrated strong predictive ability, achieving an AUC of 0.818 in the test set. The risk score was significantly associated with multiple chronic conditions, including hypertension, diabetes, cardiovascular disease, and COPD. High-risk individuals had substantially increased mortality rates compared to the low-risk group. In the low-risk group, adherence to a healthy lifestyle was associated with significantly lower odds of adverse outcomes, while no such association was observed in the high-risk group.
Conclusion: This study presents a non-invasive, data-driven model for PRISm risk prediction and health outcome stratification based on dietary and demographic features. The PRISm risk score may aid early screening and inform personalized prevention strategies.
Keywords: preserved ratio impaired spirometry, machine learning, dietary intake, prognosis, stratification
Introduction
Preserved Ratio Impaired Spirometry (PRISm) is a distinct pulmonary condition characterized by a normal ratio of forced expiratory volume in one second to forced vital capacity (FEV1/FVC ≥ 0.70), accompanied by a reduced FEV1 (<80% predicted), indicating impaired lung function without the hallmark signs of obstructive airway disease.1 PRISm has garnered increasing attention as a clinically relevant and heterogeneous spirometric pattern, with a reported prevalence of 7–12% in the general population, rising to 23.6% when more stringent cut-off values predictive of chronic obstructive pulmonary disease (COPD) progression are employed.2
Individuals with PRISm are at elevated risk for a range of adverse health outcomes. Longitudinal studies have shown that PRISm is associated with increased all-cause mortality, heightened respiratory symptoms, and a greater likelihood of progression to COPD.2–4 In addition, PRISm is frequently accompanied by a broad spectrum of cardiometabolic comorbidities, including cardiovascular disease (CVD), hypertension, heart failure, diabetes mellitus, obesity, and obstructive sleep apnea.5–8 These associations underscore the possibility that PRISm reflects a systemic pathological state extending beyond pulmonary dysfunction, highlighting the clinical importance of early detection and monitoring, particularly in older populations.9,10 Given the reversible nature of PRISm and its potential role as a transitional state toward COPD, timely recognition and intervention are crucial to preventing disease progression and improving long-term outcomes.11
Beyond its clinical consequences, understanding which individuals are more susceptible to PRISm is essential for early identification. Demographic characteristics have been strongly linked to PRISm. Prior studies have shown that PRISm is more frequently observed among older adults, women, individuals with higher BMI, and current or former smokers.12–14 These demographic patterns suggest that PRISm arises from complex interactions among biological aging, body composition, socioeconomic factors, and environmental exposures, underscoring the need for predictive approaches that integrate demographic variables.
Emerging evidence suggests that modifiable lifestyle factors—particularly diet—may play a pivotal role in the onset and progression of PRISm. While numerous nutritional epidemiology studies have linked higher intake of micronutrients such as magnesium, folate, and vitamins A, C, and D to better lung function,15,16 recent investigations have begun to directly evaluate dietary patterns in relation to PRISm itself. Individuals with PRISm have been reported to consume fewer antioxidants and essential micronutrients compared with those with normal spirometry, potentially contributing to systemic inflammation and impaired pulmonary physiology.17,18 Furthermore, diets high in ultra-processed foods have been associated with higher odds of PRISm,19 whereas adherence to nutrient-rich, anti-inflammatory dietary patterns—such as the Mediterranean or DASH diets—has been linked to a lower prevalence of PRISm.20 However, accumulating evidence consistently supports a meaningful association between dietary intake and PRISm, suggesting that nutritional exposures may play a substantive role in its development and progression.
Although several studies have investigated the associations between risk factors and PRISm, few have applied predictive modeling approaches to identify individuals at high risk of developing PRISm.12,18,21 Given its reversibility and role as a precursor to more severe pulmonary and cardiometabolic conditions, early identification of PRISm is of critical importance in clinical practice.
Machine learning (ML), a pivotal branch of artificial intelligence, excels in interpreting vast amounts of data and accurately evaluating complex patterns.22,23 By simulating human brain data processing capabilities, ML significantly enhances accuracy and efficiency compared to traditional methods.24 By combining it with dietary data, ML has successfully developed the diagnosis of a variety of diseases, including cardiovascular disease and diabetes.25,26
Therefore, the present study aims to develop and validate a stacked ML model that incorporates demographic characteristics and dietary nutrient intake to generate a continuous PRISm risk score. This score is designed to enable the early prediction of PRISm and its potential progression to COPD and other chronic diseases. In addition, we explore the potential beneficial effects of lifestyle modifications on adverse health outcomes.
Methods
Study Population
Data were obtained from the National Health and Nutrition Examination Survey (NHANES), a nationally representative program conducted by the Centers for Disease Control and Prevention (CDC) to assess the health and nutritional status of the US population. For this study, we included participants from the 2007–2012 survey cycles. Individuals were excluded if they had missing PRISm diagnostic data, incomplete dietary intake information, were under 20 years of age, or lacked data on key covariates, including poverty income ratio (PIR), smoking status, alcohol consumption, education level, or body mass index (BMI). The selection process is illustrated in Supplementary Figure 1.
Assessment of Dietary Nutrient Intake
Dietary data in NHANES were collected through two 24-hour dietary recall interviews: the first was conducted in person at the Mobile Examination Center (MEC), and the second was administered via telephone 3 to 10 days later. To ensure a more accurate estimation of usual dietary intake, we used data from both recalls when available, calculating the average intake across the two days. In instances where only one recall was completed, that single value was used as the estimate of dietary consumption.27,28
A total of 38 nutrient variables were analyzed, derived from NHANES dietary questionnaires. These encompassed a broad range of dietary components, including 8 macronutrients, 17 vitamins, 9 minerals, and 4 additional nutritional factors. The macronutrient group consisted of protein, carbohydrates, total sugars, total fat, cholesterol, saturated fatty acids, monounsaturated fatty acids, and polyunsaturated fatty acids (all measured in grams or milligrams, as appropriate). The vitamin group included vitamin E, retinol, vitamin A, alpha-carotene, beta-carotene, beta-cryptoxanthin, lycopene, lutein + zeaxanthin, thiamine (vitamin B1), riboflavin (vitamin B2), niacin, vitamin B6, choline, vitamin B12, vitamin C, vitamin D, and vitamin K. Mineral intake variables included calcium, phosphorus, magnesium, iron, zinc, copper, sodium, potassium, and selenium. Additionally, we assessed four other dietary components: dietary fiber, caffeine, theobromine, and alcohol.
Measurements of Lung Function Parameters and PRISm Definition
Spirometry assessments were performed at the Mobile Examination Center (MEC), with detailed procedures documented in previous publications.18 Key lung function indices, including forced expiratory volume in one second (FEV1) and forced vital capacity (FVC), were extracted from the NHANES SPX dataset. Predicted values for these parameters were calculated based on the NHANES III reference equations.29 In this study, PRISm was defined as having an FEV1/FVC ratio ≥ 0.70 in conjunction with an FEV1 less than 80% of the predicted value.14,18
Assessment of Lifestyle and Other Covariates
In this study, four modifiable lifestyle factors were evaluated: dietary quality, smoking status, alcohol intake, and physical activity.30 All information was obtained from structured questionnaires and two 24-hour dietary recall interviews. Smoking status was classified as healthy if participants reported having smoked fewer than 100 cigarettes in their lifetime, as per questionnaire definitions. Alcohol consumption was self-reported in terms of frequency and volume, with moderate drinking defined as no more than one drink per day for women and two for men. Physical activity was assessed based on the total time spent in moderate-to-vigorous intensity activities, with at least 150 minutes per week considered indicative of a healthy level.30 Dietary quality was determined using the Healthy Eating Index 2015 (HEI-2015), which evaluates adherence to the Dietary Guidelines for Americans.31 The HEI-2015 includes nine adequacy components (total fruits, whole fruits, vegetables, whole grains, dairy, protein foods, seafood and plant proteins, and the ratio of unsaturated to saturated fats) and four moderation components (refined grains, sodium, added sugars, and saturated fats). A healthy diet was defined as an HEI score falling within the top 40% of the population distribution.32
For each of the four lifestyle domains, participants received 1 point for meeting the healthy criteria and 0 otherwise. The resulting lifestyle score ranged from 0 to 4, with higher scores reflecting a healthier overall lifestyle. Based on the total score, individuals were categorized into three groups: unhealthy (0–1 points), intermediate (2 points), and healthy (3–4 points).33
Based on existing literature, we included covariates previously demonstrated to be associated with lung function and dietary quality. These variables encompassed age, sex, race, body mass index (BMI), education level, and poverty income ratio (PIR). Race was classified into five groups: Mexican American, Other Hispanic, Non-Hispanic White, Non-Hispanic Black, and Other (including multiracial individuals). Education level was categorized as less than high school, high school graduate, or college and above. PIR, an indicator of socioeconomic status, was defined as the ratio of household income to the federal poverty threshold. Alcohol consumption was categorized into four groups: never, mild/moderate, heavy, and former drinkers. Smoking behavior was grouped into never, former, and current smokers.
We also examined several health outcomes, including hypertension, diabetes, cardiovascular disease (CVD), chronic obstructive pulmonary disease (COPD), cardiovascular mortality, and all-cause mortality. Hypertension was defined as systolic blood pressure ≥130 mmHg and/or diastolic blood pressure ≥80 mmHg on at least three separate measurements, or a self-reported physician diagnosis of hypertension, or current use of antihypertensive medication. Diabetes mellitus was identified based on a positive response to the standardized questionnaire item (“Has a doctor ever told you that you have diabetes?”), or meeting one or more of the following validated laboratory criteria: glycated hemoglobin (HbA1c) ≥6.5%, fasting plasma glucose ≥7.0 mmol/L, 2-hour plasma glucose ≥11.1 mmol/L during an oral glucose tolerance test, random plasma glucose ≥11.1 mmol/L, or current use of antidiabetic medication.26 CVD was determined if respondents reported a diagnosis of any of the following conditions by a healthcare professional: congestive heart failure, coronary heart disease, angina, myocardial infarction, or stroke. COPD was defined as FEV1/FVC ratio of less than 0.70.14 Mortality outcomes, including both cardiovascular and all-cause mortality, were obtained from the NHANES Linked Mortality File. This dataset links NHANES participants to National Death Index records, enabling long-term follow-up and survival analysis.34
Pre-Processing of Machine Learning Features
The initial dataset included 38 dietary variables. To address multicollinearity, Pearson correlation coefficients were computed, and features with correlation coefficients greater than 0.9 were excluded. Subsequently, all remaining variables were standardized using the Standard Scaler to ensure that features with larger numeric ranges did not disproportionately influence model training.26,35
Study Design
Phase I: Development and Evaluation of the Predictive Model
The overall study design is illustrated in Figure 1. In this study, a stacked ensemble machine learning model was developed to predict the risk of PRISm based on demographic and dietary features. Stacking ensemble learning is an advanced machine learning technique that combines multiple base learners to improve predictive accuracy and robustness. Compared to individual models, stacking approaches have been shown to deliver superior performance in various domains.36,37 The general framework involves training several base models independently and then using a meta-learner to integrate their outputs into a final prediction.38
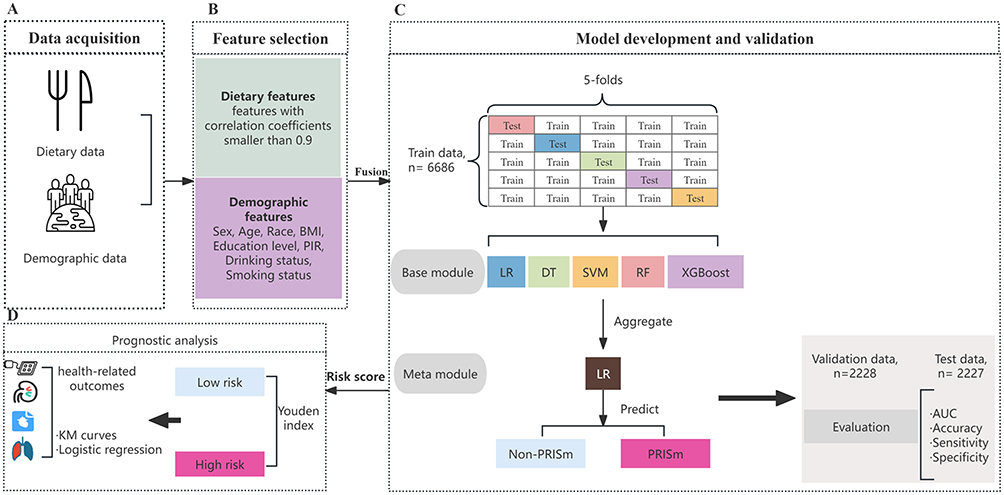 |
Figure 1 Workflow of the established stacked model and study design. (A) Dietary and demographic data acquisition in the NHANES. (B) Feature selection. (C) Development and validation of the stacked machine learning model. (D) Prognostic evaluation of the risk score in the train and test sets. Abbreviations: BMI, Body mass index; PIR, poverty income ratio; LR, logistic regression, DT, decision tree; SVM, support vector machine; RF, random forest, XGBoost, extreme gradient boosting; AUC, the area under the receiver operating characteristic curve; PRISm, Preserved Ratio Impaired Spirometry. |
In this study, the base module of the stacking ensemble consisted of five distinct classifiers: logistic regression (LR), decision tree (DT), support vector machine (SVM), random forest (RF), and extreme gradient boosting (XGBoost). These base classifiers were trained in parallel, each independently predicting the risk of PRISm based on the input features. Their predictions were then aggregated and passed to a meta-classifier, implemented using logistic regression, which synthesized the outputs of the base learners to generate the final PRISm prediction.
To develop and evaluate the stacked ensemble model, the dataset was randomly partitioned into three subsets using stratified sampling: 60% for training, 20% for validation, and 20% for testing. The training set was used to construct both the base learners and the meta-learner through a five-fold cross-validation framework, which aimed to improve generalizability and reduce overfitting. Specifically, the training data were divided into five equal folds. In each iteration, four folds were used to train five base classifiers, while the remaining fold served as the internal validation set. Each base model generated predicted probabilities for the held-out fold. These out-of-fold predictions were collected across all five iterations and used as input features for training the second-layer model, or meta-classifier, which was implemented as a logistic regression model. The corresponding ground truth labels were also retained to supervise this training. After completing the five-fold cross-validation on the training set, each base learner was retrained on the full training data. These finalized base models were then used to predict PRISm probabilities on the independent validation and test sets. The resulting probabilities were passed to the trained meta-classifier, which produced the final prediction. The validation set was used for tuning and intermediate assessment, while the test set provided an unbiased estimate of the model’s predictive performance and robustness.
To assess whether model performance was influenced by chronic comorbidities, we conducted a stratified analysis based on the presence of four major chronic diseases (hypertension, diabetes, cardiovascular disease, and COPD). Participants in the test set were classified into three subgroups: no chronic diseases, one chronic disease, and two or more chronic diseases. The stacked model was applied to each subgroup using the same optimal threshold, and performance metrics (AUC, accuracy, sensitivity, and specificity) with 95% CIs were estimated using 1000 bootstrap iterations.
Phase II: Risk Stratification and Prognostic Analysis
In the second phase, the stacked machine learning model generated a probability score for each participant, which was used as the individual risk score. This score ranged from 0 (lowest predicted probability) to 1 (highest predicted probability), serving as a quantitative indicator of PRISm risk and a potential predictor of future health outcomes.
Based on the maximum Youden’s J index in the training set, an optimal cut-off value was determined to stratify participants into low-risk and high-risk groups. The association between risk groups and health-related outcomes was first assessed within the training set. To evaluate the discriminative power of the risk score, we applied the trained stacked model to the test set to generate probability scores. Using the same cut-off value derived from the training set, test set participants were also classified into low-risk and high-risk groups. Prognostic analyses were then performed to assess the ability of the risk score to quantify the risk of adverse health outcomes in the test population.
Statistical Analysis
To obtain valid estimates and nationally representative statistics for the US adult population, our analysis of the NHANES dataset fully accounted for the complex survey design. Specifically, all analyses incorporated NHANES sampling weights, strata, and primary sampling units (PSU), following the NHANES Analytic Guidelines. Both descriptive statistics and regression models were conducted using survey-weighted procedures to appropriately address oversampling, stratification, and clustering. Data are presented as mean ± standard deviation (SD) or median (interquartile range) for continuous variables, and as frequency or percentage for categorical variables. For baseline characteristics analysis, the statistical differences among train, validation and test groups were tested with t-test or one-way ANOVA for continuous variables and chi-square or fisher test for categorical variables. In Phase II of the analysis, participants with missing data on health outcome variables were excluded. To reduce potential bias due to missing covariate information, multiple imputation (MI) was applied to impute missing values for physical activity and dietary quality as measured by the Healthy Eating Index (HEI). Predictive mean matching (PMM) was used as the imputation method, with five imputed datasets (m = 5) and 20 iterations performed to ensure convergence of the algorithm.
Model performance was assessed using the area under the receiver operating characteristic curve (AUC), calibration plots, and decision curve analysis (DCA). Kaplan–Meier survival curves were generated to compare all-cause and cardiovascular mortality between risk groups. Logistic regression models were used to examine the associations between risk groups and various health-related outcomes. Additionally, logistic regression was applied to evaluate the relationships between lifestyle factors and adverse outcomes within different risk groups.
This study followed the principles outlined in the Transparent Reporting of a Multivariable Prediction Model for Individual Prognosis or Diagnosis (TRIPOD) guidelines to ensure methodological rigor and transparency in the development and validation of our predictive model. All statistical analyses were conducted using R software (version 4.3.3), and a significance level of P < 0.05 was applied throughout the study.
Results
Population Characteristics
The study population was derived from the NHANES 2007–2012 cycles, which initially included 30,442 participants. After excluding individuals with missing PRISm classification (n = 10,862), incomplete dietary data (n = 163), age under 20 years (n = 6413), and missing values for key covariates—including PIR, smoking status, drinking status, education, and BMI (n = 1863)—a total of 11,141 participants were included in the final analysis as shown in Supplementary Figure 1. Baseline characteristics were generally balanced across the training (n = 6686), validation (n = 2228), and test (n = 2227) sets (Supplementary Table 1). The mean age of participants was 46.7 years, and 50.4% were male. Racial composition included 45.5% Non-Hispanic White and 21.4% Non-Hispanic Black. The average BMI was 29.2 kg/m2, and the mean PIR was 2.6. Over half of the participants (53.2%) had attained college-level education or higher. Among all participants, 32.2% had hypertension, 10.6% had diabetes, 7.3% reported cardiovascular disease, and 13.6% were classified as having COPD. PRISm was identified in 28.7% of individuals. In terms of lifestyle patterns, 30.0% of participants had favorable lifestyles, while 15.2% had unfavorable ones. The distribution of variables was similar across all data subsets, with no significant differences observed (all P > 0.05).
Development and Validation of the Stacked ML Model
Prior to model development, we conducted exploratory analyses to examine the distribution and interrelationships among features. Pearson correlation coefficients among dietary variables are presented in Supplementary Figure 2. As shown, several dietary components demonstrated strong correlations, particularly Total fat, lutein + zeaxanthin, Total saturated fatty acids, Total monounsaturated fatty acids and Vitamin K. To address multicollinearity, highly correlated variables were removed as illustrated in Figure 2. Finally, the ML model included 33 dietary features and 7 baseline features.
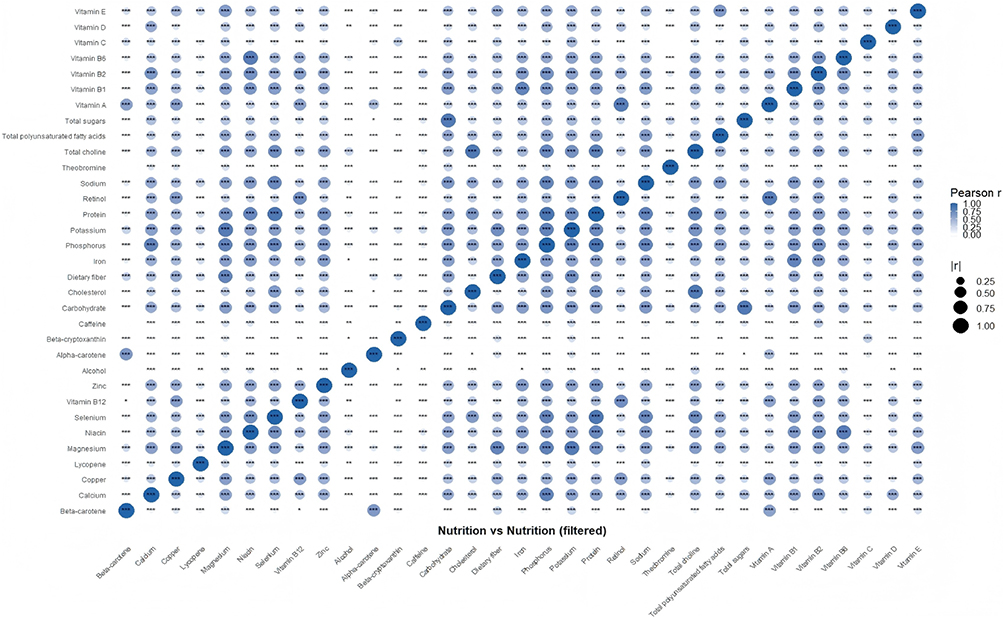 |
Figure 2 Pearson correlation coefficients among dietary variables after removing highly correlated ones. Statistical significance is denoted by asterisks: * p < 0.05; ** p < 0.01; *** p < 0.001. Correlations without asterisks did not reach statistical significance (p ≥ 0.05). |
To enhance predictive performance and stability, we developed a stacked machine learning (ML) model integrating five base classifiers: LR, DT, SVM, RF, and XGBoost. The performance of the stacked model and its base learners was evaluated on the independent test set. As shown in Figure 3A, the stacked model outperformed all single models in terms of discriminative ability, achieving the highest area under the ROC curve (AUC). Supplementary Table 2 summarizes the detailed performance metrics. The stacked model yielded an AUC of 0.818 (95% CI: 0.800–0.836), with an accuracy of 0.765 (95% CI: 0.745–0.781), sensitivity of 0.747 (95% CI: 0.713–0.782), and specificity of 0.771 (95% CI: 0.749–0.792), surpassing the best-performing base model (Random Forest: AUC = 0.815). Clinical utility was assessed using decision curve analysis (DCA), which demonstrated that the stacked model provided the greatest net benefit across a range of threshold probabilities (Figure 3B). Furthermore, calibration analysis showed good agreement between predicted and observed probabilities (Figure 3C), indicating reliable risk estimation. In addition, Supplementary Table 3 reports the performance of the stacked model across the training, validation, and test sets. The model showed consistent AUC, accuracy sensitivity and specificity across datasets, supporting its robustness and external validity. Stratified analyses showed that model discrimination varied across chronic disease subgroups (Supplementary Table 4). The stacked model achieved the highest performance among participants without chronic diseases (AUC = 0.864, 95% CI: 0.841–0.887), followed by those with one chronic disease (AUC = 0.783, 95% CI: 0.745–0.820) and those with two or more chronic diseases (AUC = 0.736, 95% CI: 0.688–0.785). These findings demonstrate that the model maintains robust predictive ability across all strata and that its discriminative performance is not driven by the presence of multimorbidity. Taken together, these findings demonstrate that the continuous risk score derived from the stacked model provides accurate and stable discrimination for PRISm across datasets.
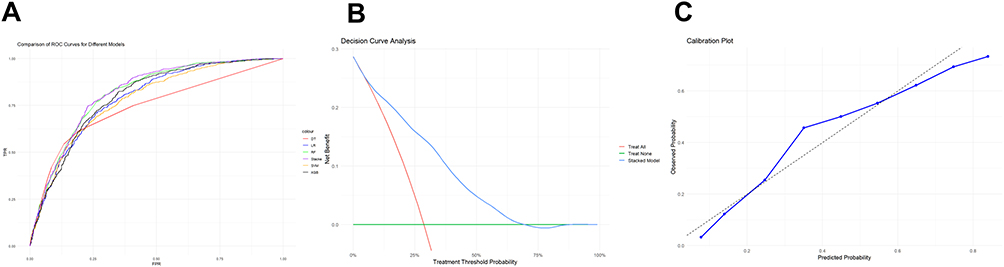 |
Figure 3 Performance of the stacked ML models for predicting PRISm. (A) ROC curve comparison of the stacked model and its five base models. Base models include logistic regression, decision tree, support vector machine (SVM), random forest, and XGBoost. (B) Decision curve analysis (DCA) for the stacked model on the test set. (C) Calibration curve of the stacked model on the test set. |
Prognostic Evaluation of Risk Score
To further evaluate the prognostic utility of the model-derived PRISm risk score, we examined its association with major cardiometabolic and respiratory outcomes. We utilized the PRISm probabilities generated by the stacked ML model as continuous risk scores and examined their association with major health outcomes using logistic regression models. Analyses were conducted separately in the training and test datasets, with three modeling strategies: unadjusted (Model 1), adjusted for individual lifestyle components (Model 2: HEI score, smoking status, drinking status, and physical activity), and adjusted for overall lifestyle pattern (Model 3: unfavorable, intermediate, and favorable). In the training set, the PRISm risk score was significantly associated with increased odds of hypertension (Model 3 OR: 3.61; 95% CI: 2.77–4.69), diabetes (OR: 6.52; 95% CI: 4.96–8.58), CVD (OR: 4.64; 95% CI: 3.28–6.57), and COPD (OR: 7.37; 95% CI: 4.14–13.13) (Supplementary Table 5). Consistent findings were observed in the test set, where the risk score demonstrated robust predictive associations with hypertension (OR: 16.46; 95% CI: 9.53–28.42), diabetes (OR: 17.14; 95% CI: 8.12–36.19), CVD (OR: 42.91; 95% CI: 21.89–84.11), and COPD (OR: 7.37; 95% CI: 4.14–13.13) after full adjustment for lifestyle categories (Table 1). Participants were stratified into high and low risk groups based on the optimal Youden index (threshold = 0.463) derived from the training set. Kaplan–Meier survival analysis demonstrated that individuals in the high-risk group had significantly elevated risks of cardiovascular and all-cause mortality in both the training (Supplementary Figure 3) and test sets (Figure 4).
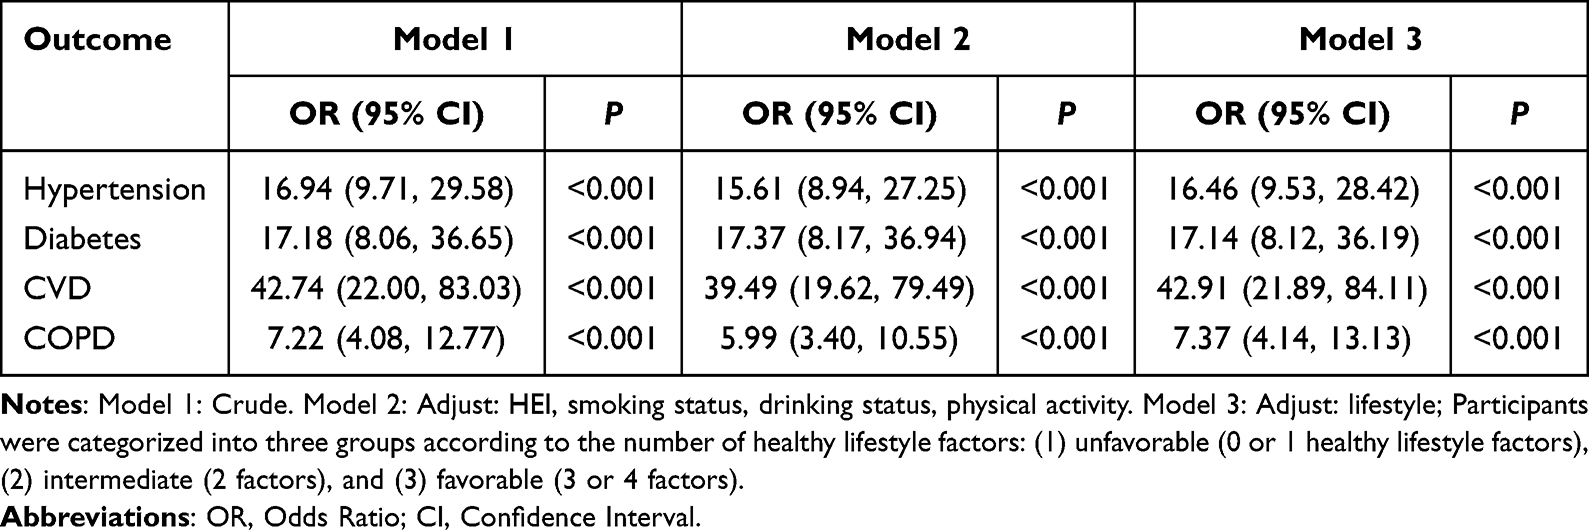 |
Table 1 The Associations of Risk Score with Adverse Health Outcomes in the Test Set |
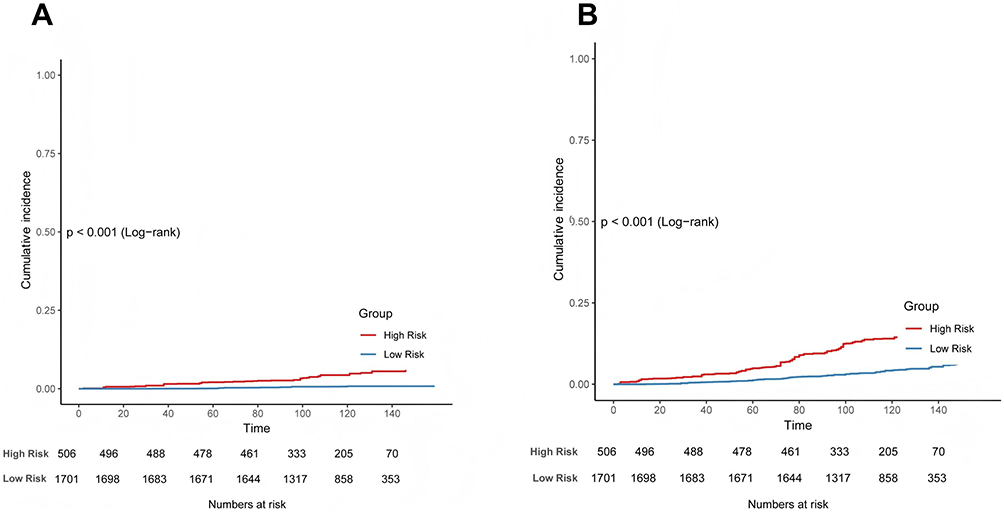 |
Figure 4 Cumulative risks of cardiovascular and all-cause mortality in the test set, stratified by high-risk and low-risk groups. (A) Cardiovascular mortality. (B) All-cause mortality. |
Furthermore, logistic regression models were used to examine the associations between risk groups and adverse health outcomes. In the training set, participants in the high-risk group had increased odds of hypertension (OR = 3.22; 95% CI: 2.42–4.27), diabetes (OR = 3.03; 95% CI: 1.98–4.64), CVD (OR = 2.21; 95% CI: 1.71–2.84), and COPD (OR = 2.02; 95% CI: 1.51–2.71), after adjusting for overall lifestyle categories (Model 3, Supplementary Table 6).
Similar associations were observed in the independent test set. High-risk individuals had significantly higher risks of hypertension (OR = 3.22; 95% CI: 2.42–4.27), diabetes (OR = 3.03; 95% CI: 1.98–4.64), CVD (OR = 4.68; 95% CI: 3.44–6.35), and COPD (OR = 2.02; 95% CI: 1.51–2.71), further supporting the prognostic value of the model-derived risk score (Table 2).
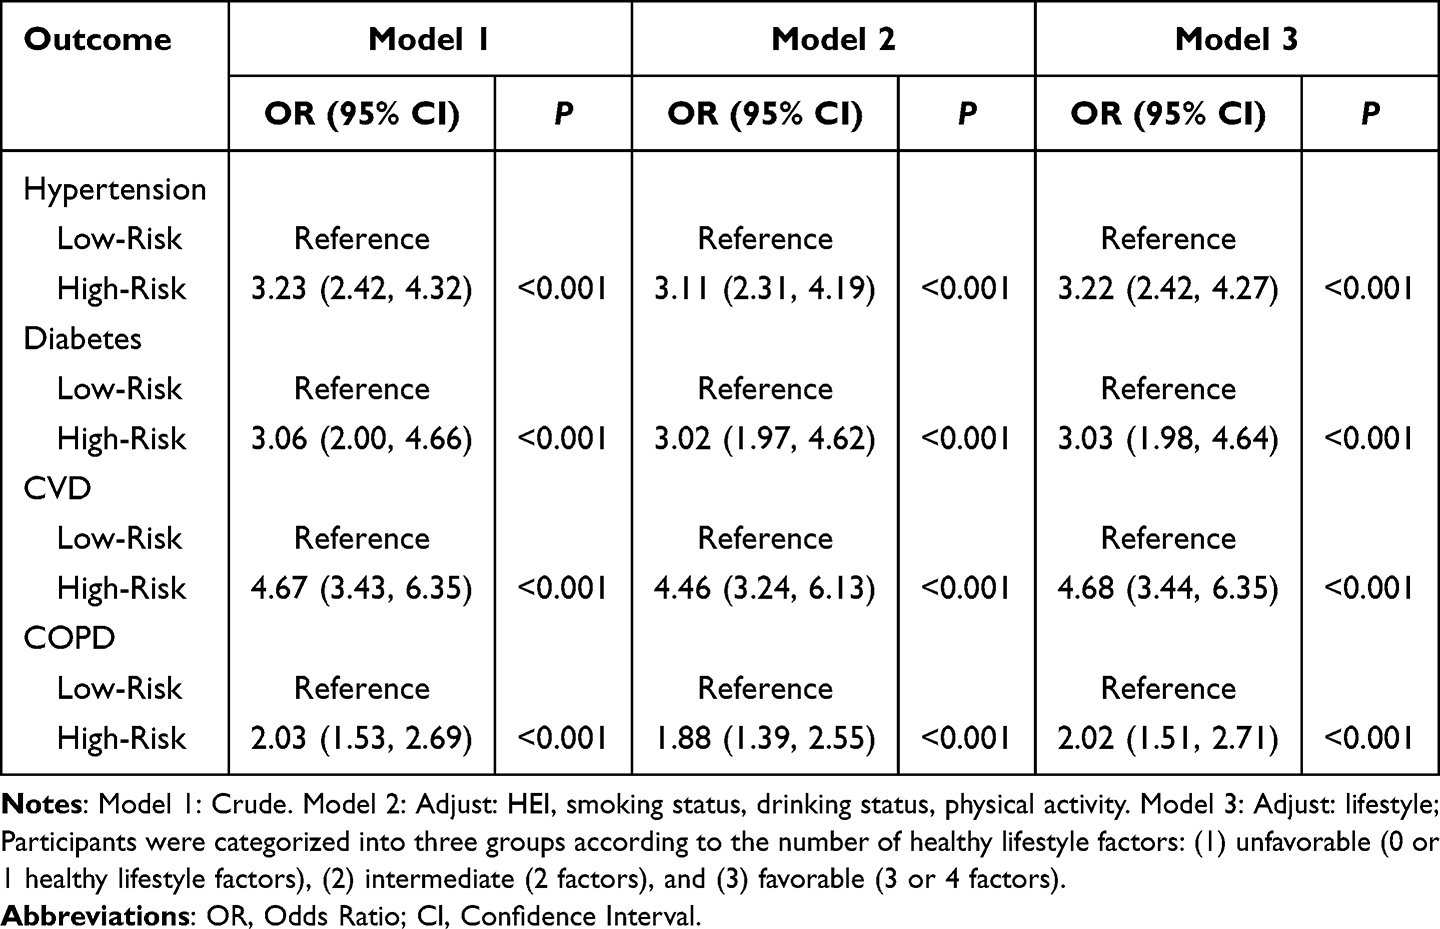 |
Table 2 Associations Between Risk Groups and Adverse Health Outcomes in the Test Set |
Association Between Lifestyle and Adverse Outcomes in the Different Risk Group
We further evaluated whether a favorable lifestyle could attenuate the risk of adverse heath outcomes within different risk groups. In the test set, individuals in the low-risk group who adhered to a favorable lifestyle exhibited significantly lower odds of adverse outcomes. Specifically, compared with participants classified as having an unfavorable lifestyle, those with a favorable lifestyle showed reduced risks of hypertension (OR = 0.67, 95% CI: 0.49–0.93, P = 0.02), diabetes (OR = 0.25, 95% CI: 0.11–0.61, P = 0.003), CVD (OR = 0.43, 95% CI: 0.19–1.00, P = 0.05), and COPD (OR = 0.18, 95% CI: 0.09–0.33, P < 0.001). A significant linear trend (P for trend) was observed across increasing levels of lifestyle quality for all outcomes (Figure 5). Conversely, in the high-risk group, the associations did not reach statistical significance; however, the effect estimates for CVD and COPD suggested a possible protective trend (ORs <1), although the confidence intervals crossed the null. To evaluate whether lifestyle effects differed between risk strata in the test set, we conducted interaction analyses. The P for interaction values were 0.22 for hypertension, 0.013 for diabetes, 0.367 for CVD, and 0.047 for COPD, indicating statistically significant interactions for diabetes and COPD. Although none of the interaction terms in the training set reached statistical significance, the overall pattern and direction of associations were similar to those observed in the test set (Supplementary Figure 4). These findings collectively suggest that the protective effect of a favorable lifestyle may be more pronounced in individuals classified as low risk.
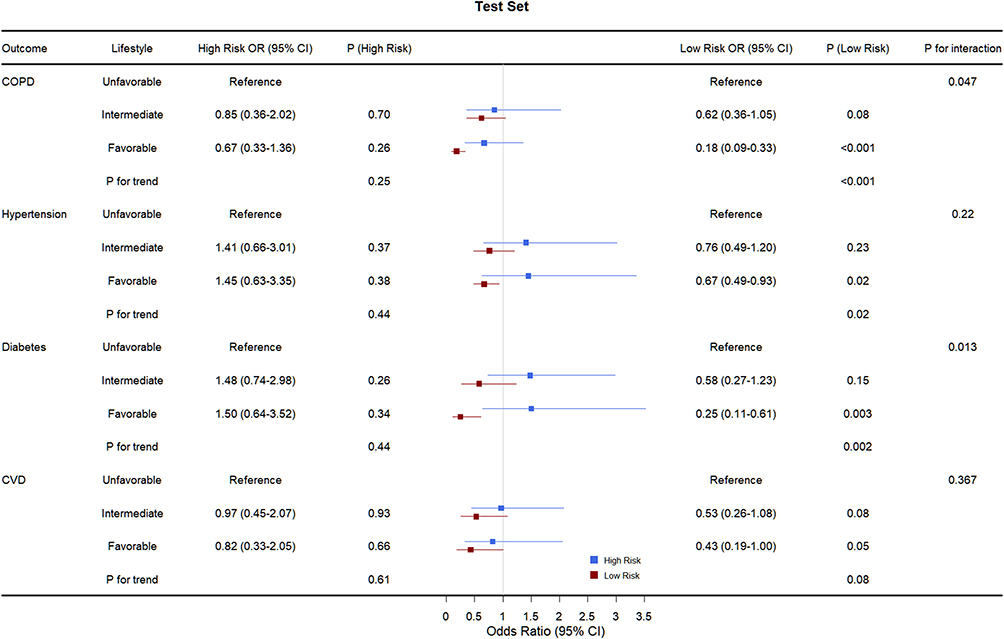 |
Figure 5 Associations between lifestyle categories and adverse health outcomes stratified by risk groups in the test set. The odds ratio (OR) values were obtained from logistic regressions. Participants were categorized into three groups according to the healthy lifestyle scores: (1) unfavorable lifestyle (0 or 1), (2) intermediate lifestyle (2), and (3) favorable lifestyle (3 or 4). Abbreviations: CVD, cardiovascular disease; COPD, chronic obstructive pulmonary disease. |
Discussion
In this population-based study utilizing data from the NHANES 2007–2012 cycles, we developed a novel stacked machine learning (ML) model integrating dietary intake and demographic characteristics to generate a continuous risk score for PRISm. The stacked model outperformed all individual unimodal ML algorithms, achieving an area under the ROC curve (AUC) of 0.818 in the independent test set, and demonstrated consistent and robust predictive performance across datasets. These findings highlight the strong predictive and prognostic utility of the continuous risk score, supporting its potential role in early detection and clinical risk stratification.
The PRISm risk score was significantly associated with a range of adverse health outcomes and effectively stratified individuals into low- and high-risk groups. Individuals in the high-risk group exhibited a substantially increased likelihood of developing PRISm as well as other chronic conditions. Importantly, our findings revealed that adherence to a favorable lifestyle was associated with a reduced risk of adverse outcomes among low-risk individuals, whereas such protective effects were not observed in the high-risk group—suggesting that additional strategies may be required for effective risk mitigation in this subgroup. These insights provide valuable implications for personalized prevention and management of PRISm and related chronic diseases such as COPD in clinical practice. In addition, the results of our chronic disease–stratified analysis further reinforce the robustness of the model. Specifically, these stratified findings confirm that the model captures risk signals independent of chronic comorbidities, with consistently strong performance across all subgroups and the highest discrimination observed in individuals without chronic diseases.
The application of ML in disease prediction using nutritional data has gained increasing attention in recent years, demonstrating the versatility of ML techniques in capturing complex, nonlinear relationships in dietary datasets.39 For instance, one study employed a random forest algorithm to explore the association between low-carbohydrate dietary scores and chronic obstructive pulmonary disease (COPD), achieving a predictive AUC of 71.6%.40 Another study used interpretable ML approaches to examine the relationship between dietary antioxidant intake and cardio-cancer comorbidity, identifying LightGBM as the best-performing model.26 Additionally, an ML-guided personalized postprandial-targeting (PPT) diet integrating clinical and microbiome data has shown superior effects on glycemic control compared to a conventional Mediterranean diet in individuals with prediabetes.41 These findings collectively underscore the feasibility of using ML models in dietary-related disease prediction. However, to the best of our knowledge, the present study is the first to develop a stacked ML model combining dietary and demographic features to predict PRISm. Our model achieved a high discriminative performance with an AUC of 0.818 in the test set, offering a novel tool for early risk stratification in pulmonary health.
An expanding body of literature highlights the pivotal influence of dietary patterns on pulmonary function and chronic disease susceptibility through inflammatory, metabolic, and oxidative pathways.42 Bioactive peptides derived from dietary proteins have been reported to modulate redox status and regulate physiological processes related to obesity, hypertension, and diabetes.43 Beyond these epidemiological findings, several biological mechanisms help explain how diet influences susceptibility to PRISm and related respiratory conditions. Diets rich in antioxidants, polyphenols, and anti-inflammatory nutrients can reduce oxidative stress and airway inflammation by modulating NF-κB signaling, limiting pro-inflammatory cytokine release, and improving endothelial function.44,45 In contrast, diets high in saturated fats, refined carbohydrates, and ultra-processed foods promote systemic low-grade inflammation, oxidative imbalance, and impaired mitochondrial function, contributing to accelerated decline in FEV1.19,46 Additionally, the gut–lung axis offers an emerging framework linking nutrition, microbiota composition, and pulmonary immune regulation. High-fiber diets enhance short-chain fatty acid production, which exerts anti-inflammatory and immune-modulatory effects, whereas low-fiber Western dietary patterns promote dysbiosis, systemic inflammation, and heightened respiratory vulnerability.47 Nutrient deficiencies—particularly magnesium, folate, vitamin D, and antioxidant vitamins—may further impair respiratory muscle performance and immune function, thereby exacerbating susceptibility to chronic airway disorders.48 Collectively, these mechanistic pathways suggest that dietary exposures play a critical role in shaping pulmonary health and may contribute to the development of PRISm. These insights support the integration of detailed nutritional data into predictive models for early identification of individuals at elevated risk for PRISm and related diseases.
This study offers several implications for clinical practice and public health. First, the satisfactory predictive performance of our model suggests that dietary data—routinely collected through non-invasive questionnaires—can be effectively leveraged to assess disease risk. The proposed risk score provides a continuous, quantifiable measure of PRISm susceptibility and associated health outcomes, enabling stratification of individuals into low- and high-risk groups. Our findings further demonstrate that among low-risk individuals, adherence to a healthy lifestyle is associated with a reduced incidence of adverse outcomes, highlighting the potential of early lifestyle-based prevention. Second, since lifestyle and dietary habits are modifiable factors, the model’s outputs may support the development of personalized nutritional interventions aimed at reducing future disease risk. Integrating the risk score into routine clinical workflows could facilitate dynamic monitoring and stratified management of PRISm and related conditions during standard health evaluations. For low-risk populations, emphasis on patient education, improved disease awareness, and behavioral counseling may help prevent the development of conditions such as hypertension, diabetes, and cardiovascular disease, thereby alleviating the long-term burden associated with PRISm. In contrast, individuals identified as high risk demonstrated substantially higher rates of adverse outcomes, and no significant benefit from lifestyle modification was observed in this group. This finding suggests that additional or alternative intervention strategies may be required and warrants further investigation. Collectively, the application of this model may offer a practical framework for early detection, prevention, and individualized disease management across risk spectrums.
Several limitations of this study should be acknowledged. First, some health-related outcomes, including hypertension and diabetes, were identified based on self-reported data from the NHANES interview questionnaires. Such self-reported diagnoses are subject to potential information bias due to recall inaccuracies or limited health literacy. Second, although the proposed risk score showed promising predictive performance, its application in clinical practice remains preliminary. The model was developed using data from the US NHANES 2007–2012 cycles, which represent a nationally representative sample. In addition to dietary variables, the model incorporated demographic, socioeconomic, lifestyle, and health-related characteristics such as sex, race/ethnicity, education level, and comorbidities. While these factors enhance the generalizability of the findings within the US population, differences in dietary patterns, health systems, and disease prevalence across countries may limit the external validity of our results. Therefore, future research should aim to train and validate similar models in diverse populations and dietary contexts to ensure broader applicability. Finally, prospective studies are needed to assess the long-term clinical utility and predictive value of the risk score in real-world settings.
Conclusion
In this study, we developed and validated a stacked machine learning model incorporating dietary and demographic features to generate a continuous risk score for PRISm. The model demonstrated robust predictive performance and effectively stratified individuals by risk level, with high-risk individuals exhibiting increased susceptibility to PRISm and multiple chronic conditions. Importantly, adherence to a healthy lifestyle was associated with reduced adverse outcomes among low-risk individuals, underscoring the value of early prevention. This non-invasive, data-driven approach provides a promising tool for identifying at-risk populations and guiding personalized dietary and lifestyle interventions.
Data Sharing Statement
Publicly available datasets were analyzed in this study. This data can be found here: https://www.cdc.gov/nchs/nhanes/.
Ethical Statement
This study was conducted in accordance with the Declaration of Helsinki and approved by the National Center for Health Statistics (NCHS) Research Ethics Review Board. All participants provided written informed consent. According to the institutional and national regulations, additional ethical approval was not required for this secondary analysis because the NHANES dataset is fully de-identified and publicly accessible. In line with the Measures for Ethical Review of Life Science and Medical Research Involving Human Subjects (China, 2023; Article 32, Items 1 and 2), research using public, de-identified human data without any new data collection or intervention is exempt from ethical review.
Acknowledgments
We would like to express our gratitude to the participants and researchers who participated in the National Health and Nutrition Examination Survey.
Author Contributions
Qihang Xie and Haoran Qu should be considered co-first author.
Jianfeng Li should be considered the senior author. All authors made a significant contribution to the work reported, whether that is in the conception, study design, execution, acquisition of data, analysis and interpretation, or in all these areas; took part in drafting, revising or critically reviewing the article; gave final approval of the version to be published; have agreed on the journal to which the article has been submitted; and agree to be accountable for all aspects of the work.
Funding
This research did not receive any specific grant from funding agencies in the public, commercial, or not-for-profit sectors.
Disclosure
All authors affirm that there are no conflicts of interest.
References
1. Krishnan S, Tan WC, Farias R, et al. Impaired spirometry and COPD increase the risk of cardiovascular disease: a Canadian cohort study. Chest. 2023;164(3):637–14. doi:10.1016/j.chest.2023.02.045
2. Kanetake R, Takamatsu K, Park K, Yokoyama A. Prevalence and risk factors for COPD in subjects with preserved ratio impaired spirometry. BMJ Open Respir Res. 2022;9(1):e001298. doi:10.1136/bmjresp-2022-001298
3. Park HJ, Byun MK, Rhee CK, et al. Significant predictors of medically diagnosed chronic obstructive pulmonary disease in patients with preserved ratio impaired spirometry: a 3-year cohort study. Respir Res. 2018;19(1):185. doi:10.1186/s12931-018-0896-7
4. Wan ES, Fortis S, Regan EA, et al. Longitudinal phenotypes and mortality in preserved ratio impaired spirometry in the COPDGene study. Am J Respir Crit Care Med. 2018;198(11):1397–1405. doi:10.1164/rccm.201804-0663OC
5. Wade RC, Wells JM. Preserved ratio with impaired spirometry: the lung’s contribution to metabolic syndrome. Chest. 2023;164(5):1075–1076. doi:10.1016/j.chest.2023.06.030
6. Chen C, Huang Z, Liu L, et al. Lung function impairment and risks of incident cardiovascular diseases and mortality among people with type 2 diabetes: a prospective cohort study. Diabetes Care. 2025:dc242188. doi:10.2337/dc24-2188
7. Kaufmann CC, Breyer M-K, Hartl S, et al. Association of preserved ratio impaired spirometry with arterial stiffness. Ann Am Thorac Soc. 2024;21(9):1289–1298. doi:10.1513/AnnalsATS.202310-859OC
8. Li G, Jankowich MD, Wu L, et al. Preserved ratio impaired spirometry and risks of macrovascular, microvascular complications and mortality among individuals with type 2 diabetes. Chest. 2023;164(5):1268–1280. doi:10.1016/j.chest.2023.05.031
9. Lei J, Huang K, Wu S, et al. Heterogeneities and impact profiles of early chronic obstructive pulmonary disease status: findings from the China pulmonary health study. Lancet Reg Health West Pac. 2024;45:101021. doi:10.1016/j.lanwpc.2024.101021
10. Bertels X, Ross JC, Faner R, et al. Clinical relevance of lung function trajectory clusters in middle-aged and older adults. ERJ Open Res. 2024;10(1):00793–02023. doi:10.1183/23120541.00793-2023
11. Doña E, Reinoso-Arija R, Carrasco-Hernandez L, et al. Exploring current concepts and challenges in the identification and management of early-stage COPD. J Clin Med. 2023;12(16):5293. doi:10.3390/jcm12165293
12. Higbee DH, Granell R, Davey Smith G, Dodd JW. Prevalence, risk factors, and clinical implications of preserved ratio impaired spirometry: a UK Biobank cohort analysis. Lancet Respir Med. 2022;10(2):149–157. doi:10.1016/S2213-2600(21)00369-6
13. Wan ES, Balte P, Schwartz JE, et al. Association between preserved ratio impaired spirometry and clinical outcomes in US adults. JAMA. 2021;326(22):2287–2298. doi:10.1001/jama.2021.20939
14. Wijnant SRA, De Roos E, Kavousi M, et al. Trajectory and mortality of preserved ratio impaired spirometry: the Rotterdam study. Eur Respir J. 2020;55(1):1901217. doi:10.1183/13993003.01217-2019
15. Bentley AR, Kritchevsky SB, Harris TB, et al. Dietary antioxidants and forced expiratory volume in 1 s decline: the health, aging and body composition study. Eur Respir J. 2012;39(4):979–984. doi:10.1183/09031936.00190010
16. Leng S, Picchi MA, Tesfaigzi Y, et al. Dietary nutrients associated with preservation of lung function in hispanic and non-hispanic white smokers from New Mexico. Int J Chron Obstruct Pulmon Dis. 2017;12:3171–3181. doi:10.2147/COPD.S142237
17. Pounis G, Arcari A, Costanzo S, et al. Favorable association of polyphenol-rich diets with lung function: cross-sectional findings from the Moli-sani study. Respir Med. 2018;136:48–57. doi:10.1016/j.rmed.2017.12.007
18. Zheng Y, Liu W, Zhu X, et al. Associations of dietary inflammation index and composite dietary antioxidant index with preserved ratio impaired spirometry in US adults and the mediating roles of triglyceride-glucose index: NHANES 2007-2012. Redox Biol. 2024;76:103334. doi:10.1016/j.redox.2024.103334
19. Kong W. Associations between ultra-processed foods intake and preserved ratio impaired spirometry in U.S. adults. Front Nutr. 2025;12:1523736. doi:10.3389/fnut.2025.1523736
20. Wen J, Gu S, Wang X, Qi X. Associations of adherence to the DASH diet and the Mediterranean diet with chronic obstructive pulmonary disease among US adults. Front Nutr. 2023;10:1031071. doi:10.3389/fnut.2023.1031071
21. Wan ES, Hokanson JE, Regan EA, et al. Significant spirometric transitions and preserved ratio impaired spirometry among ever smokers. Chest. 2022;161(3):651–661. doi:10.1016/j.chest.2021.09.021
22. Greener JG, Kandathil SM, Moffat L, Jones DT. A guide to machine learning for biologists. Nat Rev Mol Cell Biol. 2022;23(1):40–55. doi:10.1038/s41580-021-00407-0
23. Chen X, Shu W, Zhao L, Wan J. Advanced mass spectrometric and spectroscopic methods coupled with machine learning for in vitro diagnosis. VIEW. 2023;4(1):20220038. doi:10.1002/VIW.20220038
24. Camacho DM, Collins KM, Powers RK, Costello JC, Collins JJ. Next-generation machine learning for biological networks. Cell. 2018;173(7):1581–1592. doi:10.1016/j.cell.2018.05.015
25. Gou W, Ling C-W, He Y, et al. Interpretable machine learning framework reveals robust gut microbiome features associated with type 2 diabetes. Diabetes Care. 2021;44(2):358–366. doi:10.2337/dc20-1536
26. Qi X, Wang S, Fang C, et al. Machine learning and SHAP value interpretation for predicting comorbidity of cardiovascular disease and cancer with dietary antioxidants. Redox Biol. 2025;79:103470. doi:10.1016/j.redox.2024.103470
27. Chen S, Liu J, Kang X, Cui K, Zhang D. Association of dietary mineral mixture with depressive symptoms: a combination of Bayesian approaches. Prev Med. 2023;175:107661. doi:10.1016/j.ypmed.2023.107661
28. Ma J, Li P, Jiang Y, et al. The association between dietary nutrient intake and acceleration of aging: evidence from NHANES. Nutrients. 2024;16(11):1635. doi:10.3390/nu16111635
29. Bowerman C, Bhakta NR, Brazzale D, et al. A race-neutral approach to the interpretation of lung function measurements. Am J Respir Crit Care Med. 2023;207(6):768–774. doi:10.1164/rccm.202205-0963OC
30. Liu G, Li Y, Hu Y, et al. Influence of lifestyle on incident cardiovascular disease and mortality in patients with diabetes mellitus. J Am Coll Cardiol. 2018;71(25):2867–2876. doi:10.1016/j.jacc.2018.04.027
31. Liu J, Rehm CD, Onopa J, Mozaffarian D. Trends in diet quality among youth in the United States, 1999-2016. JAMA. 2020;323(12):1161–1174. doi:10.1001/jama.2020.0878
32. Li Y, Schoufour J, Wang DD, et al. Healthy lifestyle and life expectancy free of cancer, cardiovascular disease, and type 2 diabetes: prospective cohort study. BMJ. 2020;368:l6669. doi:10.1136/bmj.l6669
33. Zhang Y-B, Chen C, Pan X-F, et al. Associations of healthy lifestyle and socioeconomic status with mortality and incident cardiovascular disease: two prospective cohort studies. BMJ. 2021;373:n604. doi:10.1136/bmj.n604
34. Sun Y, Liu B, Rong S, et al. Association of seafood consumption and mercury exposure with cardiovascular and all-cause mortality among US adults. JAMA Network Open. 2021;4(11):e2136367. doi:10.1001/jamanetworkopen.2021.36367
35. Nasief HG, Parchur AK, Omari E, et al. Predicting necessity of daily online adaptive replanning based on wavelet image features for MRI guided adaptive radiation therapy. Radiother Oncol. 2022;176:165–171. doi:10.1016/j.radonc.2022.10.001
36. Zandi O, Zahraie B, Nasseri M, Behrangi A. Stacking machine learning models versus a locally weighted linear model to generate high-resolution monthly precipitation over a topographically complex area. Atmos Res. 2022;272:106159. doi:10.1016/j.atmosres.2022.106159
37. Kumar M, Singhal S, Shekhar S, Sharma B, Srivastava G. Optimized stacking ensemble learning model for breast cancer detection and classification using machine learning. Sustainability. 2022;14(21):13998. doi:10.3390/su142113998
38. Chatzimparmpas A, Martins RM, Kucher K, Kerren A. StackGenVis: alignment of data, algorithms, and models for stacking ensemble learning using performance metrics. IEEE Trans Visualization Comput Graphics. 2021;27(2):1547–1557. doi:10.1109/TVCG.2020.3030352
39. Theodore Armand TP, Nfor KA, Kim J-I, Kim H-C. Applications of artificial intelligence, machine learning, and deep learning in nutrition: a systematic review. Nutrients. 2024;16(7):1073. doi:10.3390/nu16071073
40. Zhang X, Mo J, Yang K, et al. Low-carbohydrate diet score and chronic obstructive pulmonary disease: a machine learning analysis of NHANES data. Front Nutr. 2024;11:1519782. doi:10.3389/fnut.2024.1519782
41. Ben-Yacov O, Godneva A, Rein M, et al. Personalized postprandial glucose response-targeting diet versus mediterranean diet for glycemic control in prediabetes. Diabetes Care. 2021;44(9):1980–1991. doi:10.2337/dc21-0162
42. Arifuzzaman M, Collins N, Guo C-J, Artis D. Nutritional regulation of microbiota-derived metabolites: implications for immunity and inflammation. Immunity. 2024;57(1):14–27. doi:10.1016/j.immuni.2023.12.009
43. Qiao Q, Chen L, Li X, Lu X, Xu Q. Roles of dietary bioactive peptides in redox balance and metabolic disorders. Oxid Med Cell Longev. 2021;2021(1):5582245. doi:10.1155/2021/5582245
44. Khan H, Ullah H, Castilho PCMF, et al. Targeting NF-κB signaling pathway in cancer by dietary polyphenols. Crit Rev Food Sci Nutr. 2020;60(16):2790–2800. doi:10.1080/10408398.2019.1661827
45. Liu Z, Li J, Chen T, et al. Association between dietary antioxidant levels and chronic obstructive pulmonary disease: a mediation analysis of inflammatory factors. Front Immunol. 2023;14:1310399. doi:10.3389/fimmu.2023.1310399
46. Adolph TE, Tilg H. Western diets and chronic diseases. Nat Med. 2024;30:2133–2147.
47. Trompette A, Gollwitzer ES, Yadava K, et al. Gut microbiota metabolism of dietary fiber influences allergic airway disease and hematopoiesis. Nat Med. 2014;20(2):159–166. doi:10.1038/nm.3444
48. Alexander M, Turnbaugh PJ. Deconstructing mechanisms of diet-microbiome-immune interactions. Immunity. 2020;53(2):264–276. doi:10.1016/j.immuni.2020.07.015
 © 2026 The Author(s). This work is published and licensed by Dove Medical Press Limited. The
full terms of this license are available at https://www.dovepress.com/terms
and incorporate the Creative Commons Attribution
- Non Commercial (unported, 4.0) License.
By accessing the work you hereby accept the Terms. Non-commercial uses of the work are permitted
without any further permission from Dove Medical Press Limited, provided the work is properly
attributed. For permission for commercial use of this work, please see paragraphs 4.2 and 5 of our Terms.
© 2026 The Author(s). This work is published and licensed by Dove Medical Press Limited. The
full terms of this license are available at https://www.dovepress.com/terms
and incorporate the Creative Commons Attribution
- Non Commercial (unported, 4.0) License.
By accessing the work you hereby accept the Terms. Non-commercial uses of the work are permitted
without any further permission from Dove Medical Press Limited, provided the work is properly
attributed. For permission for commercial use of this work, please see paragraphs 4.2 and 5 of our Terms.
Recommended articles

RuleFit-Based Nomogram Using Inflammatory Indicators for Predicting Survival in Nasopharyngeal Carcinoma, a Bi-Center Study
Luo C, Li S, Zhao Q, Ou Q, Huang W, Ruan G, Liang S, Liu L, Zhang Y, Li H
Journal of Inflammation Research 2022, 15:4803-4815
Published Date: 24 August 2022
Prognosis and Personalized Treatment Prediction in Different Mutation-Signature Hepatocellular Carcinoma
Zhang Y, Liu Z, Li J, Li X, Duo M, Weng S, Lv P, Jiang G, Wang C, Li Y, Liu S, Li Z
Journal of Hepatocellular Carcinoma 2023, 10:241-255
Published Date: 15 February 2023
Identification of High-Risk Patients for Postoperative Myocardial Injury After CME Using Machine Learning: A 10-Year Multicenter Retrospective Study
Liu Y, Song C, Tian Z, Shen W
International Journal of General Medicine 2023, 16:1251-1264
Published Date: 7 April 2023
Identification and Validation of Anoikis-Related Signatures for Predicting Prognosis in Lung Adenocarcinoma with Machine Learning
Wang Q, Sun N, Zhang M
International Journal of General Medicine 2023, 16:1833-1844
Published Date: 16 May 2023
Multiomics-Based Deep Learning Prediction of Prognosis and Therapeutic Response in Patients With Extensive-Stage Small Cell Lung Cancer Receiving Chemoimmunotherapy: A Retrospective Cohort Study
Nie F, Pei X, Du J, Shi W, Wang J, Feng L, Liu Y
International Journal of General Medicine 2025, 18:981-996
Published Date: 24 February 2025