Back to Journals » Journal of Hepatocellular Carcinoma » Volume 10
Prognosis and Personalized Treatment Prediction in Different Mutation-Signature Hepatocellular Carcinoma
Authors Zhang Y, Liu Z, Li J, Li X, Duo M, Weng S, Lv P, Jiang G ![]() , Wang C, Li Y, Liu S, Li Z
, Wang C, Li Y, Liu S, Li Z ![]()
Received 3 December 2022
Accepted for publication 7 February 2023
Published 15 February 2023 Volume 2023:10 Pages 241—255
DOI https://doi.org/10.2147/JHC.S398431
Checked for plagiarism Yes
Review by Single anonymous peer review
Peer reviewer comments 2
Editor who approved publication: Dr Mohamed Shaker
Yuyuan Zhang,1,* Zaoqu Liu,1,* Jie Li,1 Xin Li,1 Mengjie Duo,2 Siyuan Weng,1 Peijie Lv,3 Guozhong Jiang,4 Caihong Wang,5 Yan Li,6 Shichao Liu,6 Zhen Li1
1Department of Interventional Radiology, The First Affiliated Hospital of Zhengzhou University, Zhengzhou, Henan, People’s Republic of China; 2Department of Respiratory and Critical Care Medicine, The First Affiliated Hospital of Zhengzhou University, Zhengzhou, Henan, People’s Republic of China; 3Department of Radiology, Zhengzhou University First Affiliated Hospital, Zhengzhou, Henan, People’s Republic of China; 4Department of Pathology, The First Affiliated Hospital of Zhengzhou University, Zhengzhou, Henan, People’s Republic of China; 5Department of Magnetic Resonance Imaging, The First Affiliated Hospital of Zhengzhou University, Zhengzhou, Henan, People’s Republic of China; 6Department Cardiology, The Second Affiliated Hospital of Zhengzhou University, Zhengzhou, Henan, People’s Republic of China
*These authors contributed equally to this work
Correspondence: Zhen Li, Email [email protected]
Introduction: Mutation patterns have been extensively explored to decipher the etiologies of hepatocellular carcinoma (HCC). However, the study and potential clinical role of mutation patterns to stratify high-risk patients and optimize precision therapeutic strategies remain elusive in HCC.
Methods: Using exon-sequencing data in public (n=362) and in-house (n=30) cohorts, mutation signatures were extracted to decipher relationships with the etiology and prognosis in HCC. The proteomics (n=159) and cell-line transcriptome data (n=1019) were collected to screen the implication of sensitive drugs. A novel multi-step machine-learning framework was then performed to construct a classification predictor, including recognizing stable reversed gene pairs, establishing a robust prediction model, and validating the robustness of the predictor in five independent cohorts (n=900).
Results: Two heterogeneous mutation signature clusters were identified, and a high-risk prognosis cluster was recognized for further analysis. Notably, mutation signature cluster 1 (MSC1) was featured by activated anti-tumor immune and metabolism dysfunctional states, higher genomic instability (high TMB, SNV neoantigen, indel neoantigens, and total neoantigens), and a dismal prognosis. Notably, MSC performed as an independent risk factor than clinical traits (eg, stage, vascular invasion). Additionally, afatinib and canertinib were recognized which might have potential therapeutic implications in MSC1, and the targets of these drugs presented a higher expression in both gene and protein levels in HCC.
Discussion: Our studies may provide a promising platform for improving prognosis and tailoring therapy in HCC.
Keywords: hepatocellular carcinoma, mutation signature, gene pairs, precision therapy, machine learning, prognosis
Introduction
Hepatocellular carcinoma (HCC) ranks sixth among the most frequent malignant neoplasms with an incidence of over 906,000 cases, and the third leading cause of cancer-related mortality causing 830,000 deaths annually, according to the latest global cancer statistic in 2020.1 Although astonishing progress has been made in HCC treatment, spatial and temporal heterogeneity in internal HCC results in a variable response in patients, and consequently, the five-year survival rate remains only 12.1%.1,2 The latest decade has witnessed considerable effort invested in deciphering the association between aberrant genome alterations and precision treatment. A previous study identified several agents for TP53-mutation patients,3 and another study indicated that CTNNB1 mutation-related WNT pathway alteration might be evidence of sorafenib resistance.4 Whereas, solely focusing on specific genes would obscure the influence of gene alteration order and patterns on prognosis and drug resistance.5,6 Thereby, it is imperative to comprehensively estimate the mutation signature in HCC and further throw light on prognosis prediction and precision therapeutic strategies.
Mutation signatures comprehensively unraveled somatic mutation patterns resulting from diverse processes and etiology, and recent studies have identified several specific mutation signatures in HCC.7,8 The predominant risk factor of HCC comprises viral infection (HBV, HCV, AAV28), alcohol abuse (Signature 16), or metabolic syndrome.9 Furthermore, some specific mutation signatures also correlate with exposure to aflatoxin B1 (Signature 24) and aristolochic acid carcinogens (Signature 22) which contribute to tumorigenesis. Except for HCC-specific signatures, some ubiquitous mutation signatures including Signature 1 and 5 generally correlated with age were also prevalent in HCC. In addition, some of these signatures recurrently altered in HCC were reported preferentially associated with specific risk factors. For example, signatures 4, 12, and 16 are found to have a strong correlation with age, while signatures 5 are more prevalent in poorly differentiated HCC patients.10 However, mutation signatures contributing to prognostic risk stratification and precision treatment strategies are incompletely understood.
To address this issue, the mutation signature landscape inner HCC was decoded based on the exon-sequencing data in public and in-house. Consequently, we identified a subset of HCC patients with dismal prognoses characterized by signatures 5, 6, 12, 16, and 24. Besides, a novel machine-learning computerizing framework resting on gene pairs was conducted to predict the mutation signature clusters, which may modify the limitations of the clinical utility of exon sequencing data and batch effects in multiple platforms. Notably, MSC1 displayed as an independent risk factor in distinct stages and vascular invasion states, representing a valuable complement to clinical stages. Additionally, two therapeutic agents (afatinib and canertinib) were screened for these high-risk HCC patients, offering great promise for improving the efficacy of therapeutic strategies in HCC.
Materials and Methods
Data Procession and Integration
RNA-Sequencing Cohorts
Multi-omics data from 362 HCC patients, including RNA-seq raw counts data, somatic mutation data, copy number variants data, methylation 450 data, and clinical data, were achieved from The Cancer Genome Atlas (TCGA) (https://portal.gdc.cancer.gov/repository). Gene expression data (raw counts) and corresponding clinical data from the JP project including 232 HCC samples were achieved from the International Cancer Genome Consortium (ICGC) portal (https://dcc.icgc.org/projects/LIRI-JP). Raw counts data were converted to transcripts per kilobase million (TPM), and further log-2 transformed.
Proteomics Data
Chinese HCC patients with 159 samples consisting of paired tumor and non-tumor liver tissues were also retrieved, and the gene-level proteomics data were obtained from the supplementary files of Gao et al.11 In addition, the protein abundances were log2-transformed and centered on the median.
Microarray Cohorts
The expression data and the corresponding prognosis information of GSE14520 (n=222), GSE76427 (n=167), GSE54236 (n=81), and GSE144269 (n=68) were downloaded from the Gene Expression Omnibus (GEO) (http://www.ncbi.nlm.nih.gov/geo/). For the GSE14520 cohort, raw expression data from Affymetrix were normalized using R-package Affy’s robust multi-array average (RMA) method. For GSE76427 and GSE114269, raw expression data from Illumina were normalized using R-package lumi’s robust spline normalization method. For GSE54236, the raw data from Agilent were normalized using R-package limma’s expression intensities normalization method.
Cancer Cell Line Data
The expression profiles for 1019 cell lines were achieved from the Broad Institute Cancer Cell Line Encyclopedia (CCLE) (https://portals.broadinstitute.org/ccle/). Two pharmacogenomic drug datasets, CTRP v.2.0 (https://portals.broadinstitute.org/ctrp) and PRISM (https://depmap.org/portal/prism/), were retrieved to obtain large-scale drug sensitivity and detailed molecular information. The area under the dose–response curve (AUC) value in both datasets was used to estimate drug sensitivity. The lower the AUC value, the more sensitive to a specific drug. In drug sensitivity data, those with missing data of more than 20% were excluded, and the rest missing AUC values were imputed by performing K-nearest neighbor (k-NN).
In-House Cohort
The researchers enlisted 30 HCC patients who had needle biopsies at the First Affiliated Hospital (Zhengzhou University, Henan, China). All the patients had written informed consent and received no preoperative chemotherapy or radiation. The proposal of Zhengzhou University’s First Affiliated Hospital was authorized by the Ethics Committee Board. To clarify the genetic alterations of the tumor, we performed NGS on DNA isolated from the formalin-fixed paraffin-embedded (FFPE) tissue acquired from the primary tumor biopsy, based on a 654-gene panel (Berry Oncology Corporation, Fujian, China).
Identifying Mutation Signature-Related Clusters
Mutation signature is a specific pattern of nucleotide substitutions in the progress of cancers, which has been systematically demonstrated in the Catalogue Of Somatic Mutations In Cancer (COSMIC) database by Alexandrov et al12 Before signature analysis, a mutation matrix constituted of 96 substitution classes was first extracted from a matrix of nucleotide substitutions via the maftools R package. Then, the following steps were performed: 1) non-negative matrix factorization (NMF) algorithm was performed on a range of values (k=2–10) and measures the goodness-of-fit in terms of cophenetic correlation (k=6), 2) NMF was applied to decompose the substitution matrix into mutation signatures, 3) cosine similarity was calculated to compare extracted signatures with the known signatures from the COSMIC database. Based on the extracted mutation signatures, consensus NMF clustering in the NMF R package was applied with the parameters: 50 runs per value of the rank, method of “lee”. Ultimately, two heterogeneous clusters in HCC patients were extracted relying on the cophenetic correlation.
Identification of the Qualitative REO-Based Predictor
This study constructed the within-sample relative expression orderings (REOs) of genes to eliminate experimental batch effects and individual differences.13,14 First, genes in all enrolled cohorts were selected for further analysis. Second, receiver operating characteristic (ROC) was performed, and the area under the ROC curve (AUC) was computed to identify genes with significant diagnosis values via the pROC package. Third, stable-reversal gene pairs (SRGPs) between the two clusters were identified. For a gene pair, if gene a has a higher expression level than gene b, we denoted it as Ga | Gb. SRGPs refereed to a gene pair pattern (Ga | Gb) which is kept in more than 60% of cluster 1 HCC patients in the training data and reversed in more than 60% of cluster 2 HCC patients.
HCC patients in TCGA-LIHC cohorts were divided into test (0.3) and training (0.7) partitions by using the createDataPartition function in the caret R package. Using the SRGPs in the training set, we developed a mutation signature-related cluster predictor via the Least absolute shrinkage and selection operator (LASSO) logistic regression algorithm. The optimal was cross-validated by tenfold cross-validation when the partial likelihood of deviance reached the minimum value. In addition, based on the cross-validation optimal lambda, SRGPs with nonzero coefficients were selected to establish the predictor. The predicted score for each patient was calculated with LASSO model weighting coefficient as follows: MSCS = 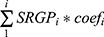 . Where n is the number of SRGP,
  is the status of
  , and
, and  is the LASSO coefficient of
  .
.
Functional Annotation
To descript the underlying biological behaviors in two MSCs, 186 KEGG gene sets and 10,402 Gene Ontology terms were downloaded from MSigDB (http://www.gsea-msigdb.org/gsea/index.jsp), and then Gene Set Enrichment Analysis (GSEA) in the clusterProfiler R package was performed based on the gene sets and molecular profile data. The terms with FDR <0.05 was considered significant terms, and single sample gene set enrichment analysis (ssGSEA) in the GSVA R package was performed to investigate 50 Hallmark gene sets enrichment for each sample.15
Immune Infiltration Assessment and Immune Escape Indicators Investigation
The abundances of 22 immune cells were estimated via the CIBERSORT algorithm from the gene expression profile of TCGA-LIHC.16 In this analysis, the validated leukocyte gene signature containing 547 genes was used to distinguish 22 cell phenotypes, including seven T-cell types, naïve and memory B cells, plasma cells, natural killer (NK) cells, and myeloid subsets. Additionally, different parts involved in the immune escape were investigated. First, single-nucleotide variant (SNV) neoantigens, Indel neoantigens, cancer-testis antigens (CTA) score, intratumor heterogeneity, number of segments, fraction altered, number or fraction of segments with loss of heterozygosity (LOH), homologous recombination deficiency (HRD), aneuploidy score, T-cell receptor (TCR) diversity (Shannon Entropy and Richness) score, and the expression of immunomodulatory molecules17 were enrolled or calculated for the investigation of potential immune escape mechanisms in the two clusters.
Genomic Alterations and Methylation Analysis
To decode the molecular mechanisms underlying two MSCs, we systemically investigated the mutation, copy number variant (CNV), and methylation data in the TCGA-LIHC cohort. The top 30 mutated genes and local CNV genes were depicted which were proved as the frequently mutated genes (FMGs), frequently amplification (FAMs), and frequently homozygous deletion (FHGs) according to previous studies.18 The indicators to demonstrate the genomic instability such as tumor mutation burden (TMB), tumor neoantigen, arm gain, arm loss, focal gain, focal loss, and a fraction of genome gained (FGG) were also assessed or collected.19,20 In these indicators, arm gain, arm loss, focal gain, and focal loss were defined as the burdens with copy number changes at focal and arm levels, which were calculated based on the recurrently altered regions derived from the GISTIC 2.0 pipeline.21 From the perspective of methylation, we deciphered how methylation regulates the expression and identified methylation-driving genes for each MSC via the MethylMix R package.
Results
Mutation Signatures in HCC Progression Associated with Poor Prognosis
The workflow of this study is illustrated in Figure 1. The mutation landscape of 30 patients from the in-house cohort was displayed in Supplementary Figure S1, and the top five genes were TP53, ARID1A, TERT, CTNNB1, and KEAP1. Then, the underlying interactions between these alterations and prognosis were explored (Supplementary Table S1), and the results suggested a clue that distinctive somatic mutations related to various etiology and clinical traits. However, tumorigenesis generally was the consequence of successive somatic alterations, and single mutation limited the understanding of molecular heterogeneity. Thereby, somatic mutation patterns were investigated to decipher the latent interactions.
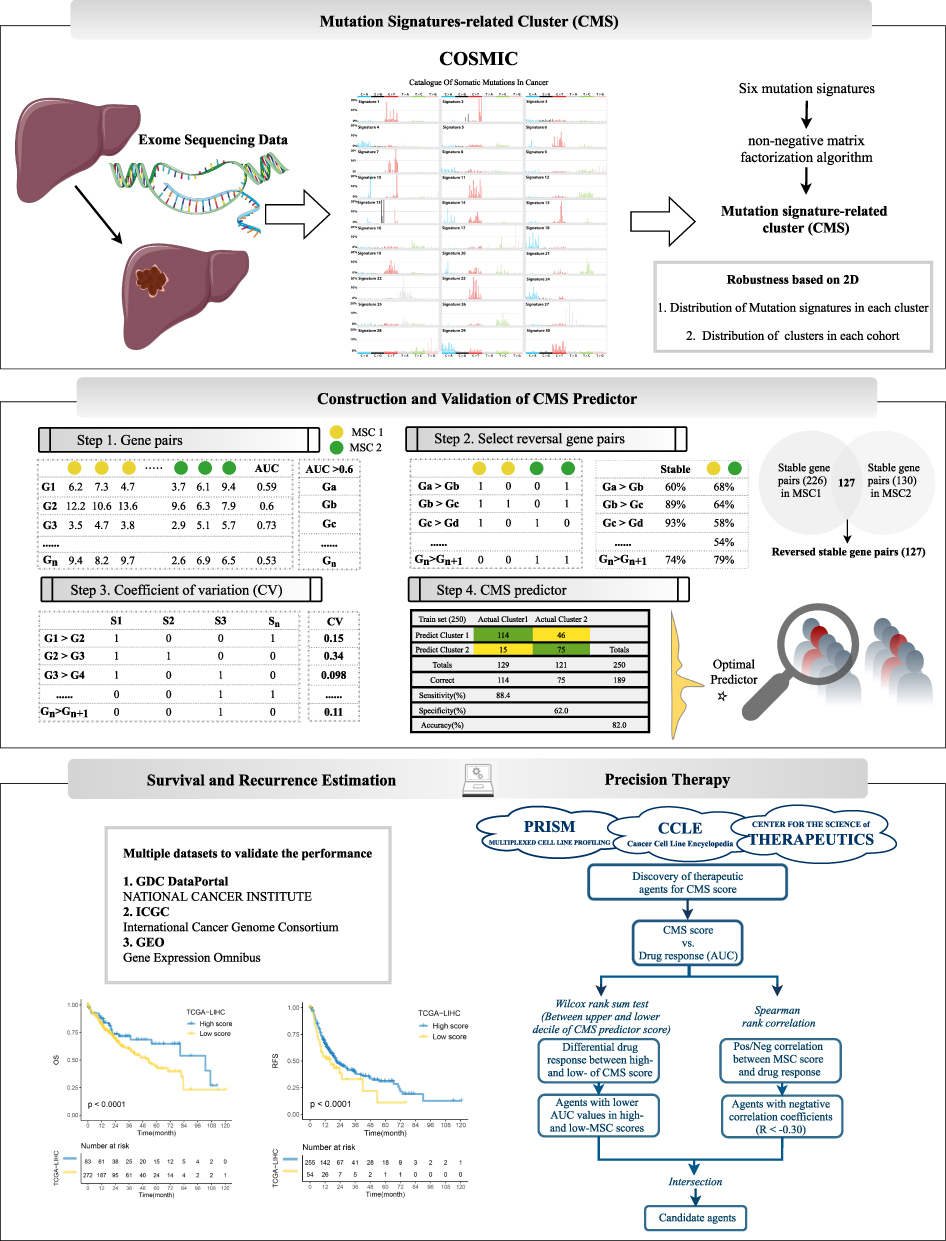 |
Figure 1 The flow gram of this study. |
In the TCGA-LIHC dataset, a similar mutation landscape in HCC patients was exhibited (Figure 2A and Supplementary Figure S2A) and further six mutation signatures regarding the consequence of multiple mutational processes have been extracted (Figure 2B). According to the COSMIC dataset, they were regarded as Signatures 5, 6, 12, 16, 22, and 24, separately (Supplementary Figure S2B). In previous research, S12, 16, 22, and 24 have been widely found in liver cancer with specific etiology, such as S16 related to alcohol and transcription-coupled damage, S22 related to aristolochic acid, and S24 related to aflatoxin. Additionally, S6 was related to defective DNA mismatch repair, S5 with aging, and S12 with unknown etiology. Next, NMF clustering analysis based on identified signatures displayed two different clusters across 362 HCC patients, denoted MSC 1–2 (Figure 2C and D). MSC1 (n=226) was dominant by exposures to aristolochic acid (S12), exposure to aflatoxin (S24), and strong transcriptional strand bias for T>C substitutions (S16), while MSC2 (n=130) shared features with aging (S5) and defective DNA mismatch repair (S6) (Figure 2E and Supplementary Figure S2C). Overall, environmental exposures inducing genomic alterations predominantly drive tumorigenesis in MSC1, while endogenous cellular progress is the main cause that drives tumorigenesis in MSC2. Interestingly, two specific mutation-signature dominant clusters correlated with distinct clinical characteristics (Supplementary Table S2). We found a great proportion of HCC in MSC1 were male (73.9% vs 55.4%, p=0.001), a higher mutation level (p=0.032), and a dismal prognosis in both overall survival (Figure 2F, p=0.0041) and recurrence (Figure 2G, p=0.043). Both the univariant and multivariant Cox regression validated that MSC1 was an independent risk factor for OS and RFS (Figure 2H–K and Supplementary Table S2). As we know, stage and vascular invasion revealed malignant degrees in HCC patients and were prevalent in clinical practice to stratify HCC patients, estimate prognosis, and provided tailed therapy. Our study demonstrated MSC could be treated as a vital supplement to the clinical parameters. In the stratified analysis (Figure 2L), MSC1 presented as a risk predictor in both vascular invasion (HR = 2.84[1.05, 4.63], p=0.037) and non-vascular invasion (HR = 1.74[0.96, 2.52], p=0.072), and both stage I/II (HR = 2.52[0.94, 4.11], p=0.075) and stage II/IV (HR = 1.83[1.02, 2.63], p=0.04). We identified a group of HCC patients characterized by exogenous mutagen-related signatures (S12, 14, and 24), and a high risk of disease-specific mortality and recurrence.
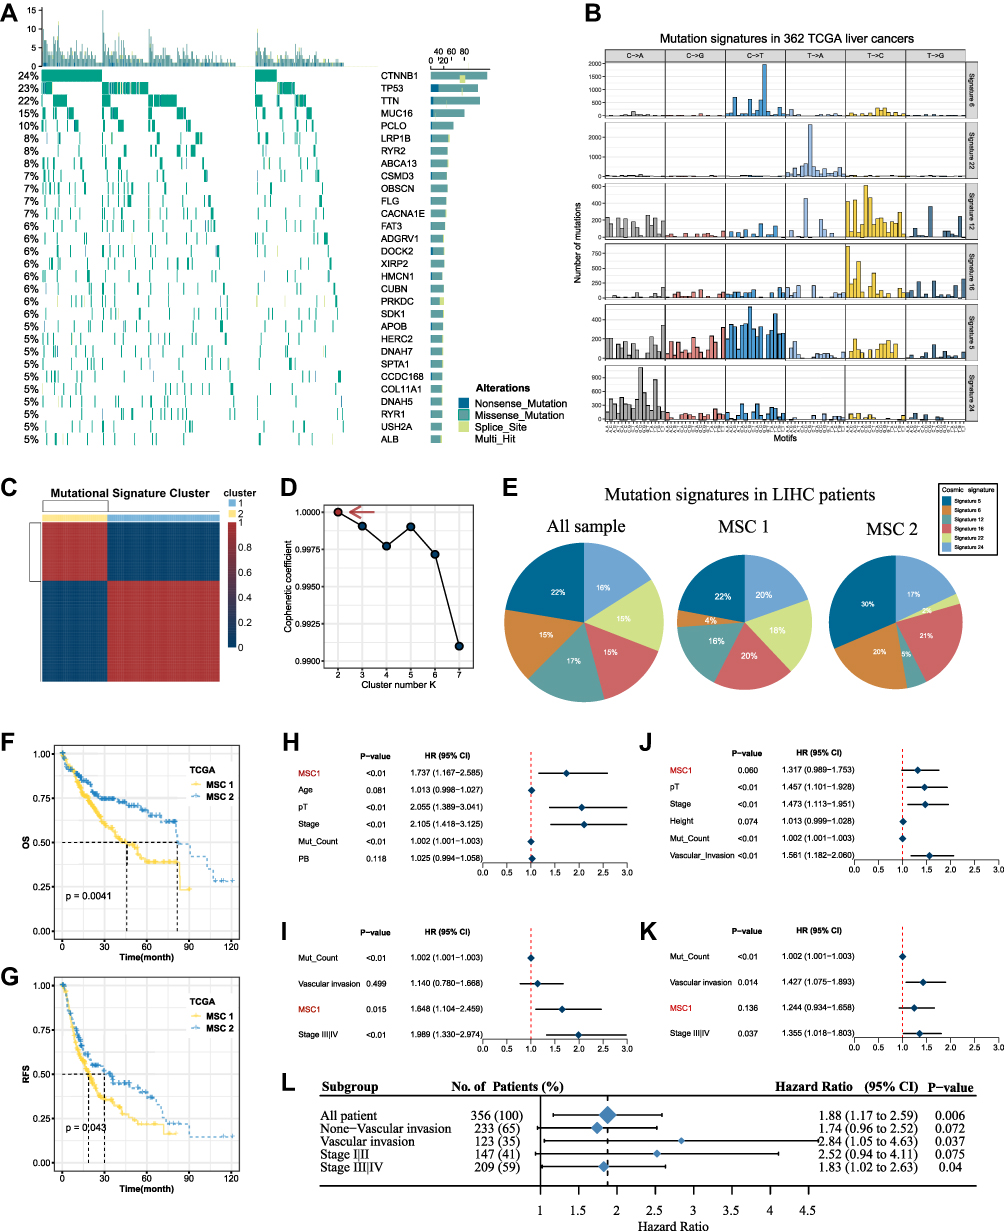 |
Figure 2 Mutation signature landscape in HCC and the clinical applications of a mutation-signature related cluster. (A) Waterfall plot of top 30 genes with significantly mutation of HCC patients. (B) Six mutation signatures extracted using NMF in HCC. (C) NMF identifies two clusters of LIHC patients with distinct mutation signatures. (D) Cophenetic curve for a different number of clusters. (E) Pie charts indicate the fraction of distinct mutation signatures in all samples, MSC1, and MSC2 HCC patients. (F and G) Kaplan–Meier curve of overall survival (F) and relapse-free survival (G). (H and I) Univariant Cox regression for overall survival (H) and relapse-free survival (I). (J and K) Multivariant Cox regression for overall survival (J) and Relapse free survival (K). (L) Cox regression analysis stratified by stage and vascular invasion. |
A Robust Model for Predicting MSCs Based on Gene Pairs
To realize clinical prediction in different cohorts, a robust model for classification predictor was constructed via the LASSO regression algorithm (Figure 3). Based on six cohorts, 634 common genes were identified with AUC >0.6 in the TCGA-LIHC dataset (Step 1). Then, from the 50,018 gene pairs, 127 stable reversal gene pairs were selected for further model construction (Supplementary Table S3). In the training cohort, we fitted a LASSO logistic regression model and eventually identified 22 gene pairs that were strongly predictive of MSC status (Step 2). The area under the ROC curve in the train set and test set were displayed as 0.819 and 0.814 (Step 3), and further analysis demonstrated that the model could predict MSC1 with a sensitivity of 0.884, an accuracy of 0.820 in the train set (Supplementary Figure S2D). The MSC predictor was calculated using the formula based on the detailed gene pairs and coefficients in Supplementary Table S4. To validate the reproduction of prognosis value, the other five cohorts in GEO with prognosis information were retrieved (Step 4). A similar tendency was displayed, high scores linked to MSC2 processed significantly favorable OS and RFS, which demonstrated the practicability and reproduction of MSC predictors in HCC patients.
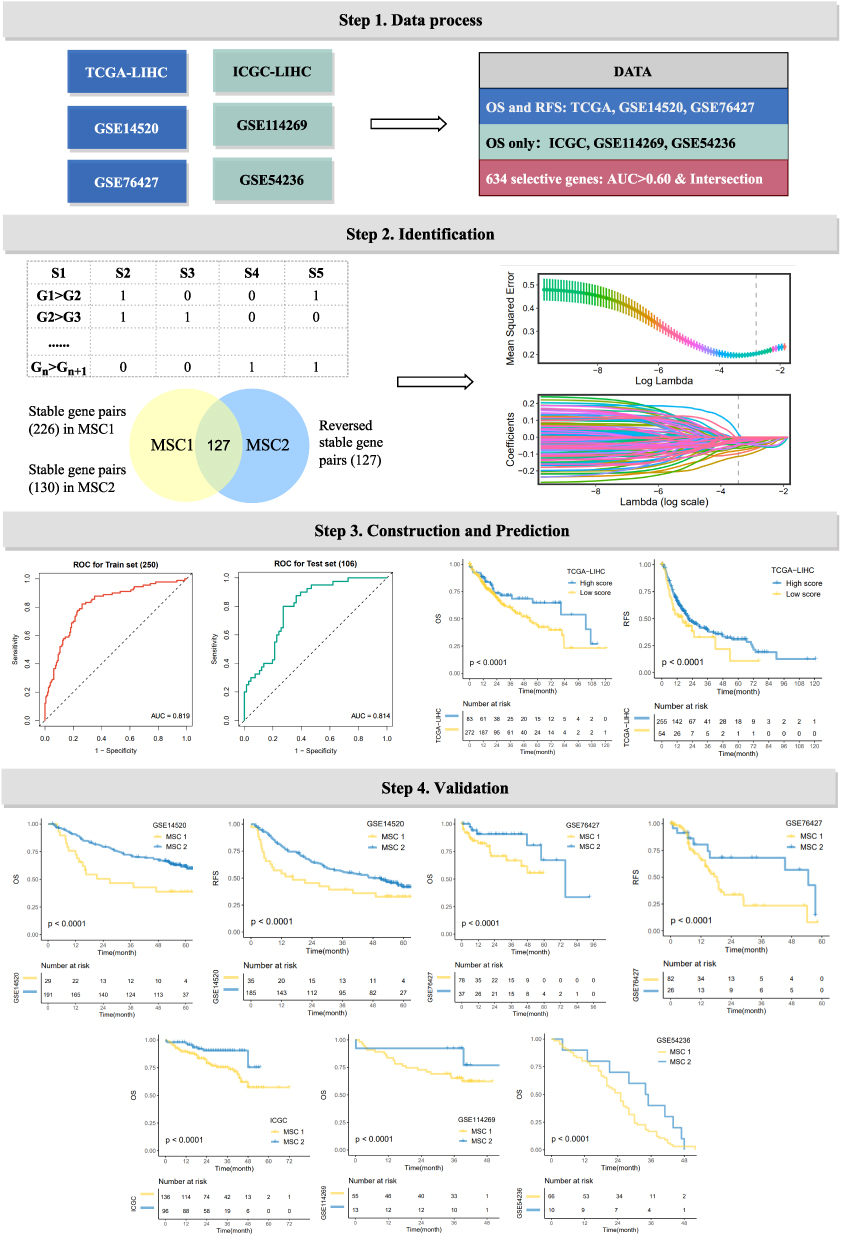 |
Figure 3 The development of a robust classification predictor depends on four steps. Step 1. Datasets with prognostic information were retrieved and processed, and 634 genes with AUC >0.6 between tumor and normal samples were selected. Step 2. Construction of gene pairs, identification of 130 stable reversed gene pairs, and further selection relying on LASSO regression model. Step 3. Construction and validation of the LASSO logistic model in the train and test cohorts. Step 4. Prognosis prediction in five cohorts with prognosis information (GSE14520, GSE76427, GSE114269, GSE54236, ICGC). |
MSC1 Presents Specific Metabolism and Immunotherapy Response Patterns
Considering the crosstalk between different biological functions and the immune environment contributed to HCC progression, we attempted to decipher the underlying functional status and tumor immune microenvironment (TIME) to illustrate diverse clinical outcomes in two MSCs. GSEA analysis (Figure 4A and B, and Supplementary Table S5) illustrated active metabolism pathways were enriched in MSC1, such as cellular amino acid metabolic process, fatty acid metabolic progress, butanoate metabolism, and retinol metabolism; cell-junction- and cell proliferation-related pathways displayed in enrichment in MSC2 (eg, cell junction assembly). Additionally, further cancer hallmarks analysis (Figure 4C) indicated that KRAS signaling, myogenesis, and apical surface upregulated in MSC1, while MSC2 was enriched for multiple oncogenic pathways, such as DNA repair, G2M checkpoint, PI3K AKT MTOR signaling.
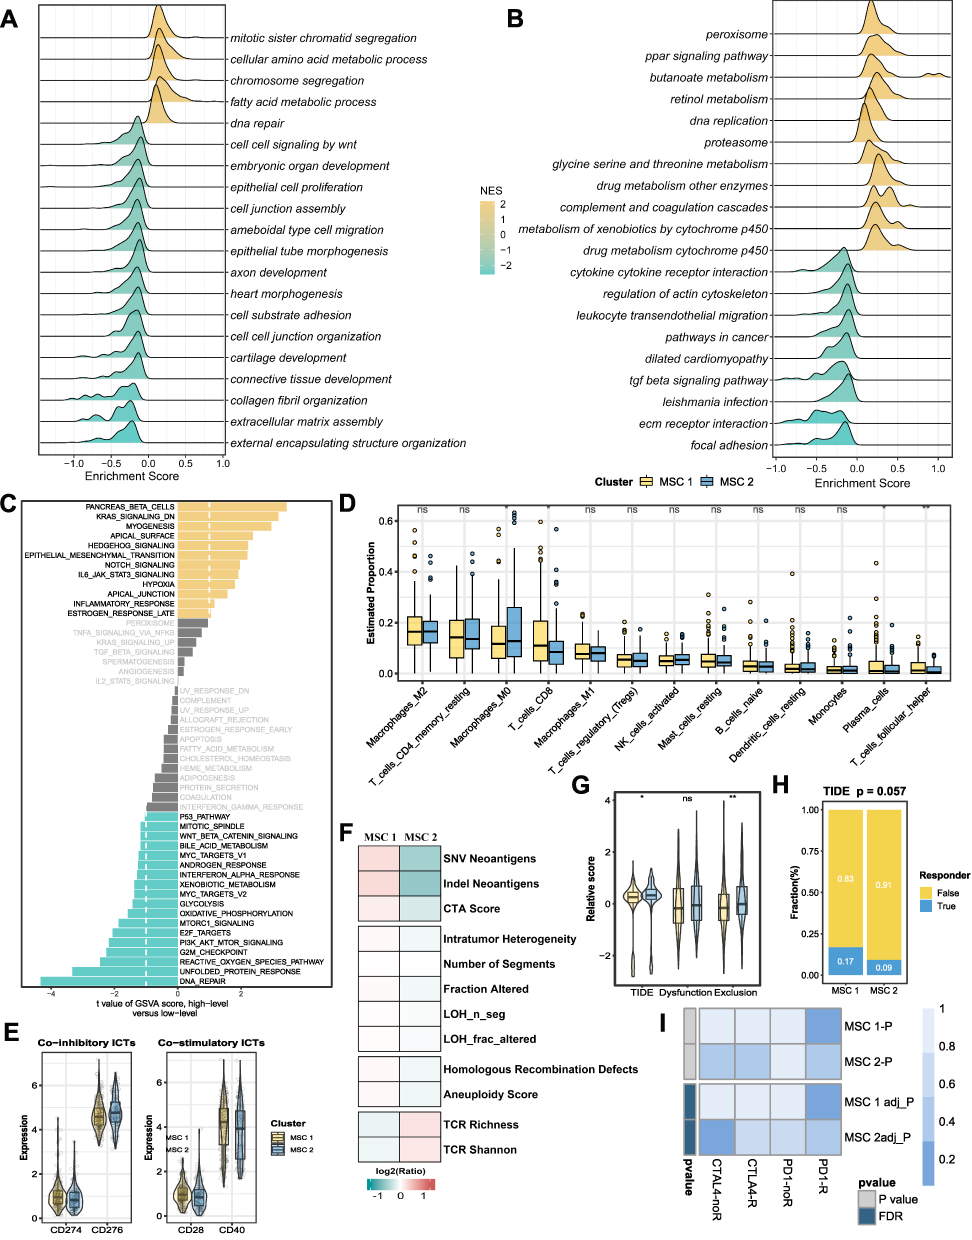 |
Figure 4 Underlying biologic function and distinct immune microenvironment patterns of two CMSs. (A–C) Gene set enrichment analysis (GSEA) of GO (A), KEGG (B), and cancer hallmark gene sets (C) according to the MSCs. (D) Immune cell infiltration calculated by CIBERSORT algorithm. (E) The expression of specific co-inhibitory and co-stimulatory immune checkpoints (ICPs) in two clusters. (F) immune indicators were collected and compared between two CMSs. (G and H) The TIDE algorithm was used to predict the immune status including exclusion and dysfunction and estimated the sensitivity (G) of two MSCs to immunotherapy (H) in the TCGA cohort. (I) SubMap analysis manifested that the MSC1 could be more sensitive to the anti-PD-1 therapy. *P <0.05, **P <0.01. |
To further access the TIME and immunotherapy efficacy, comprehensive TME consisting of immune infiltration cells, immune checkpoints, and some immune indicators were evaluated. As displayed in Figure 4D, we observed distinct immune cell composition in two MSCs, some cells including CD8 T cells, T cell follicular cells, and plasma cells preferred to infiltrate the microenvironment of MSC1, while macrophages M0 cells were upregulated in MSC2. Besides, high CD274 (PD-L1) expression in CSM1 patients was predictive of efficient immunotherapy response (Figure 4E). Therefore, immune indicators (Supplementary Table S6) were collected to further decode the mechanism of immunotherapy response. We discovered that MSC1 presented higher immunogenicity (eg, SNV, indel neoantigens, CTA score), a higher genomic instability (eg, intratumor heterogeneity, number of segments, LOH segment, LOH fraction alteration, homologous recombination defects, and aneuploidy score), by contrast, a lower TCR richness (eg, TCR richness and Shannon) (Figure 4F). TIDE analysis22 kept consistency with the above analysis. MSC1 processed an inferior exclusive score and TIDE score (Figure 4G) and showed up-regulated in response to immunotherapy (Figure 4H). The immune therapy response was further explored in the SubMap framework, similar expression patterns were demonstrated between MSC1 and PD1 response groups, as well as between MSC2 and CTAL-4 nonresponse (Figure 4I). Ultimately, we identified patients in MSC1 that harnessed active metabolism pathways and superior immunotherapy efficacy.
Multi-Omics Profiles of HCC Patients Indicate Diverse Drivers in Two MSCs
As illustrated in Figure 5A, the mutation landscape of the top 30 mutated genes was depicted (Supplementary Figure S3A and B, and Supplementary Table S7). We found most FMGs mutated with a high frequency in MSC1, including CTNNB1, TP53, RYR2, and OBSCN (Figure 5A). In line with the mutational profiles of these FMGs, TMB (Figure 5B and Supplementary Table S8) and neoantigen (Figure 5C) were also observed notably upregulated in MSC1. Furthermore, we featured the CNV patterns of 30 FAGs/FHGs between the two MSCs (Supplementary Table S9). MSC1 was characterized by a few FHGs, such as 4q21.3 and 4q24, and FAGs between the two MSCs exhibited no difference (Figure 5D and E). In addition, all the burden of arm gain (Figure 5F), focal gain (Figure 5G), and a faction of genome gain (Figure 5H) demonstrated higher levels, and loss burden displayed no difference (Supplementary Figure S3C-E). Consequently, DNA methylation-driven genes were also identified by modeling DNA methylation data in HCC and normal, and only functional DNA methylation events were defined as a driven methylation state (Figure 5I and J, and Supplementary Table S10). In MSC1, several DNA methylation-driven genes (eg, GIPC2, IGF1, KCTD14, LIPG, and PALMD) with a high level of gene expression were displayed, and some others were found in MSC2 (eg, EPCAM and SLC25A36) (Supplementary Figure S3F). Taken together, MSC1 was genomic instability and multiple omics-driven.
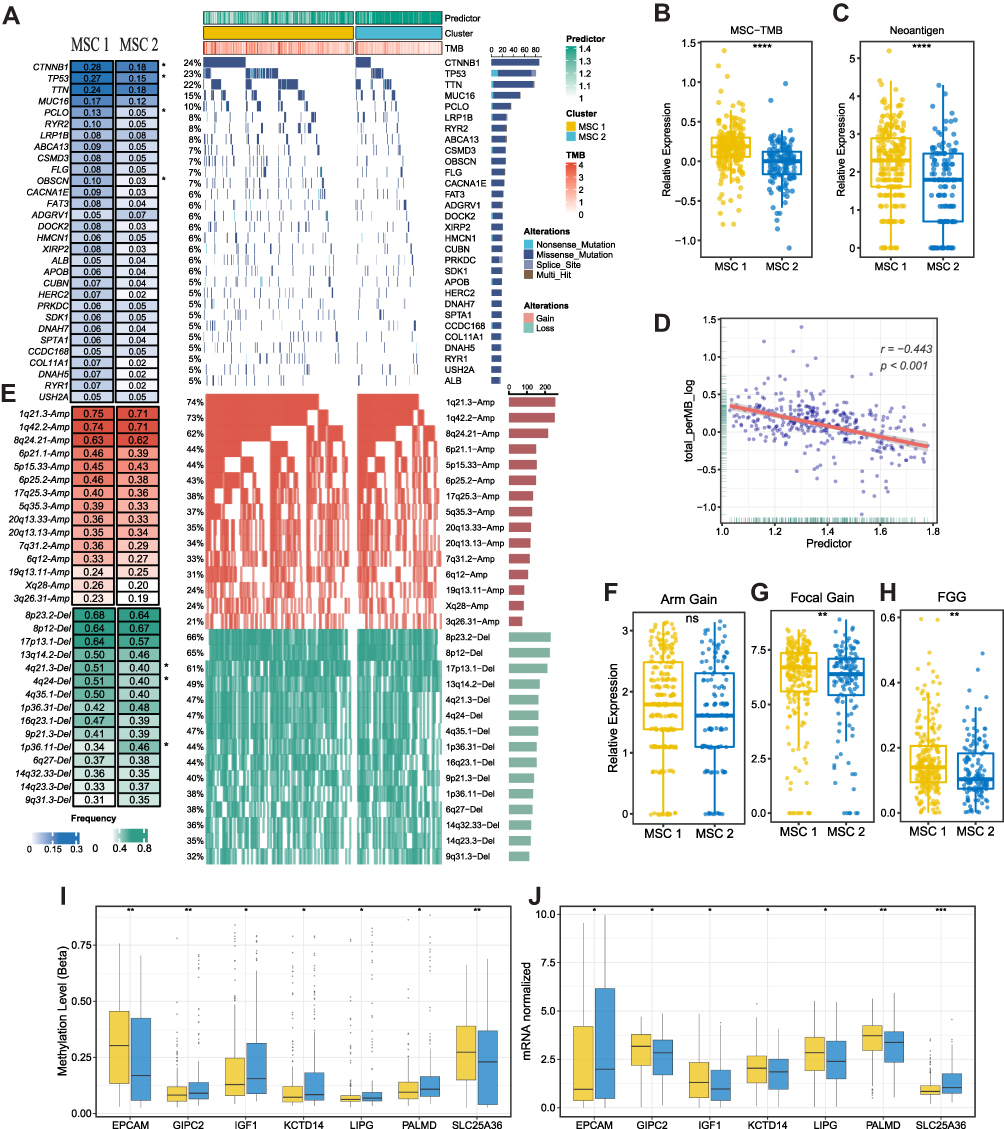 |
Figure 5 The multi-omics landscape of the MSCs. (A) Mutation landscape (right) and frequency (left) of the top 30 FMGs in TWO MSCs. (B and C) Differences in TMB (B) and neoantigen (C) between two CMSs. (D) The relation dot plot for TMB and predictor score. (E) CNV landscape (right) and frequency (left) of top 30 FHGs in two MSCs. (F–H) Differences of arm gain (F), focal gain (G), FGG (H) between two groups. (I and J) Differences of methylation drive genes in methylation level (I) and mRNA expression level (J). *P <0.05, **P <0.01, ***P <0.001. |
Identification of Potential Drug Targets and Potential Therapeutic Agents for MSCs
Two different drug sensitivity datasets, CTRP and PRISM, were adopted to identify potential drugs in two MSCs. Based on the expression profile of cell lines and TCGA-LIHC, a ridge regression model via the pRRophetic package23 was constructed and applied (Figure 6A). Ultimately, six compounds with lower AUC were yielded referenced to the thresholds of difference (log2FC >0.15) and correlation coefficients (R <-0.3) in both drug-sensitive datasets. Notably, four candidate agents for MSC1, namely afatinib, dasatinib, canertinib, and vinblastine, were identified, and two candidate agents including tosedostat and KX2−391 were yielded for MSC2 (Figure 6B–G). The results were further validated in HCC patients from multiple perspectives, which provided additional support for the results. Firstly, the Connectivity Map (CMap) was performed to compare the gene-expression signatures between HCC patients and the treatment of the corresponding drug. Ultimately, three drugs, Afatinib, Canertinib, and Vinblastine, had negative CMap scores which represented potential therapeutic efficacy in MSC1. The second step involved a comprehensive literature search in PubMed for clinical and experimental evidence of certain drugs in treating HCC. Thirdly, candidate targets and potential pathways of this drug were collected and exhibited in the figure Tumor and normal tissue expression profiles of the candidate targets were compared to calculate the fold-change, and all the target genes harnessed higher expression levels in tumor tissue suggesting a superior treatment potential in HCC patients. All the detailed information were available in Figure 6H and Supplementary Table S11. Altogether, robust evidence in experimental and clinical trials demonstrated that afatinib, dasatinib, canertinib, and vinblastine might process a promising treatment potential in MSC1 HCC patients with a lower predicted score.
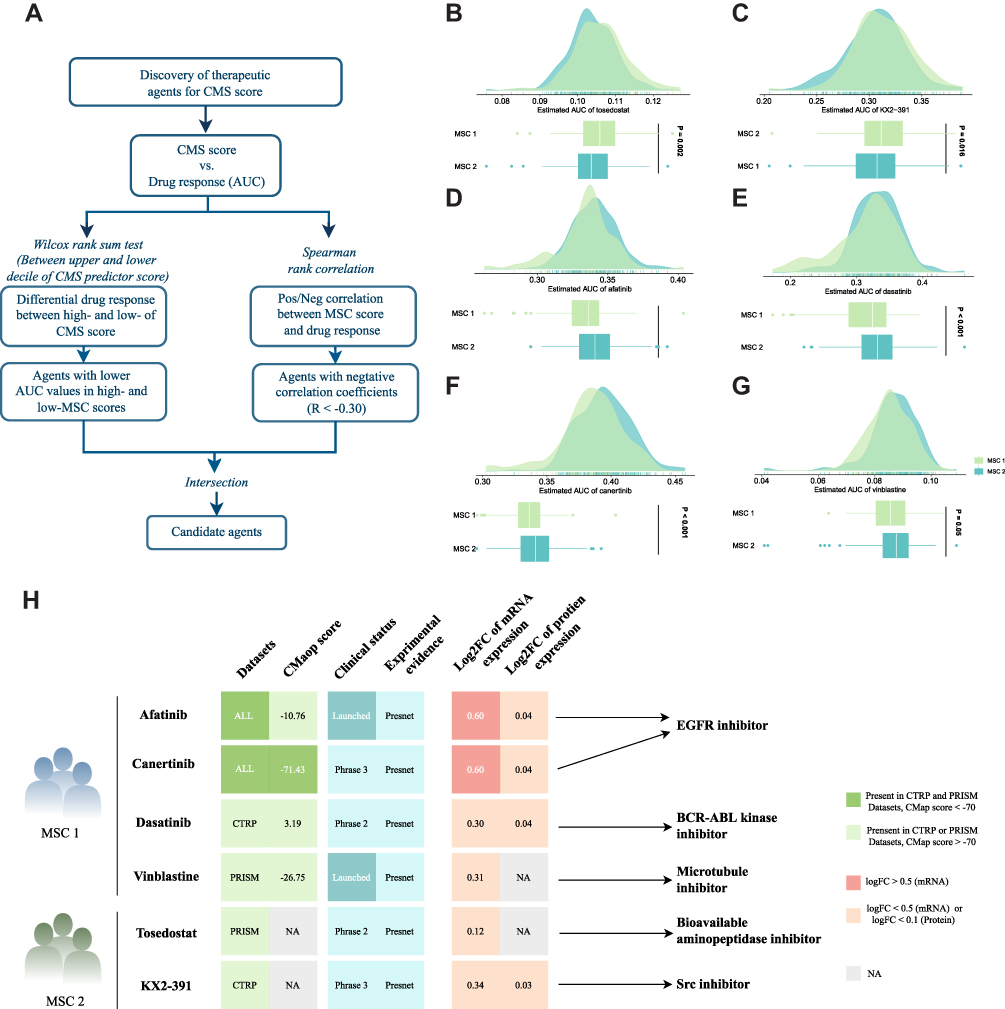 |
Figure 6 Identification of candidate agents with higher sensitivity in MSC1, high-risk patients. (A) Schematic outlining the strategy to identify agents with higher drug sensitivity for MSC1 patients. (B–G) Identification of six potential therapeutic agents using estimated AUC. (H) Identification of most promising therapeutic agents for two MSCs according to the evidence from multiple sources, including CMap dataset, experimental and clinical evidence, as well as expression at both the mRNA and protein levels. |
Discussion
Considerable efforts have been devoted to investigating the genomic alterations in HCC involving treatment sensitivity or resistance. Unfortunately, high-frequency mutation genes in HCC, including TERT, TP53, CTNNB1, and TTN absent from corresponding target agents.24 Consequently, how to transfer the molecular alterations and gene defects into manipulated targets for drugs is a crucial question and in major need of further investigation.25 Research supports that mutation signatures resulting from the interaction of environmental exposure and internal cellular progress might hold promise for not only prognostication stratification but also for precision therapy.10 Our study aimed to structure a mutation signature-based classification in HCC, develop a gene pair-based model which eliminates the batch effects, and eventually assist clinicians in prognosis prediction and tailored therapy. As expected, we identified HCC patients featured by S12, 16, and 24 with dismal survival and recurrence, and the corresponding predictor provided reliable support for personalized prognosis estimation and tailored therapy.
Extensive heterogeneity of biological function, immune microenvironment, and genomic variations was detected between the two MSCs, suggesting a clue on potential agents for us to explore further. Patients in MSC1 who exhibited a high antigenicity (eg, SNV neoantigens, indel neoantigens, and total neoantigens) maintained an inferior TCR enrichment. Combined with its clinical characteristics and prognosis phenotype, we speculated other dysfunctional pathways in CMS1 might interact with the immune microenvironment. As expected, multiple metabolism-related pathway disturbances appeared in MSC1. During hepatocarcinogenesis, metabolic reprogramming in the liver leading to deceleration of the tricarboxylic acid cycle and activation of fatty acid oxidation (FAO) provided sufficient ATP for cell proliferation, enhanced chemoresistance,26 and crosstalk with the immune microenvironment.27 Overall, CMS1 was defined by higher antigenicity (eg, SNV neoantigens, indel neoantigens, and total neoantigens), elevated co-stimulatory molecular (eg, CD28, CD40), and better T cell function states. However, a high rate of metabolism dysfunction in MSC1 gave rise to decreased glucose uptake and lactate accumulation in tumor killer cells, further propelling immune evasion and thereby limiting the prognosis of patients.28
Currently, personalized therapeutic strategies for HCC are still a major challenge as TKI represents the only first-line treatment option. Our study comprehensively explored cell line expression and drug sensitivity datasets to filter several potential drugs for MSC1 patients. Two EGFR inhibitors identified, namely afatinib and canertinib, demonstrated unparalleled potential in MSC1 patients. Afatinib is an EGFR inhibitor that has been widely used as a first-line target drug in several anticancer therapies, such as non-small cell lung cancer,29 head and neck squamous cell carcinoma,30,31 glioblastoma,32 and liver cancer.33 In vitro, afatinib could inhibit the proliferation, invasion, and metastasis of HCC cells.33 Further study demonstrated that afatinib could inhibit the expression of epithelial-mesenchymal transition-related genes by regulating the ERK-VEGF/MMP9 signaling pathway.34 Canertinib is a pan-erbB inhibitor exerting a role in suppressing the proliferation and migration of esophageal squamous cells in both Vivo and Vitro. Canertinib treatment showed significant antitumor activity and inhibited tumor xenograft growth for more than 50 days on oral doses.35 Moreover, canertinib treatment might influence the states of metabolism, immune, and hyperoxia, indicating that canertinib might achieve better therapeutic effectiveness in MSC1 HCCs. Tosedostat sensitive to MSC2 has not been used in HCC treatment widely. Currently, tosedostat is an inhibitor of aminopeptidases in Phase II clinical trial for the treatment of blood-related cancers.36 Besides, KX2-391, a non-ATP-competitive inhibitor of SRC kinase and tubulin polymerization, was identified as a lead candidate for an anti-HBV drug.37 The current study provided new insights into improving the therapeutic effect of high-risk HCC patients, and thus shed light on delivering precision medicine for HCCs.
As a comprehensive mutation signature-related classification identified for HCC patients, MSCs represented superior performance in risk stratification and precision therapeutic prediction. However, this study had several limitations. Firstly, the number of whole-exome sequencing data is limited in public datasets, and the batched effects accounting for differences in samples and sequencing platforms could also be discounted. For a more robust predictor model, the concept of gene pair resting on relative expression order was adopted by machine learning to eliminate the batch effects. Secondly, several signatures could be related to known etiologies (S16 related to alcohol, S22 related to aristolochic acid, S24 related to aflatoxin, S6 was related to defective DNA mismatch repair, and S5 with aging), but some remain unexplained (S6). Thirdly, as a heterogeneous tumor with a complex tumor microenvironment, although we identified MSC1 HCCs as high-risk for prognosis and systematically explored two compounds with potential therapeutic efficacy, only part rather than of the patients in MSC1 responded to the two compounds. Thereby, more precision classification is essential to establish personalized treatment and prognostication strategies.
Conclusions
Current work systematically sheds light on the application of the HCC mutation signatures in clinical management. Further, a robust predictor model was established to increase its clinical utility which successfully identified MSC1 in HCC patients regardless of batch effects. For MSC1 HCCs, our study provided several potential compounds to improve outcomes for high-risk HCCs. For MSC2 HCCs, clinicians should focus on how to improve the quality of life of patients and decrease the side effects of conventional treatment. Overall, the work not only revealed the significance of HCC mutation signatures in prognosis prediction and treatment options but also provided additional insights into personalized treatment strategies.
Institutional Review Board Statement
The study was conducted following the Declaration of Helsinki and was approved by the Institutional Review Board (or Ethics Committee) of the First Affiliated Hospital of Zhengzhou University (ChiECRCT20220109/2022).
Data Sharing Statement
The raw datasets supporting the conclusions of this article are available via The Cancer Genome Atlas (TCGA) web portal (https://portal.gdc.cancer.gov/projects/TCGA-LIHC), the International Cancer Genome Consortium (ICGC) portal (https://dcc.icgc.org/projects/LIRI-JP), the Gene Expression Omnibus (GEO) (http://www.ncbi.nlm.nih.gov/geo/), the Cancer Cell Line Encyclopedia (CCLE) (https://portals.broadinstitute.org/ccle/), and two pharmacogenomic drug datasets, CTRP v.2.0 (https://portals.broadinstitute.org/ctrp) and PRISM (https://depmap.org/portal/prism/).
Funding
This study was supported by the National Natural Science Foundation of China (U1904143), Key Projects Jointly Built by Provinces and Ministries (SBGJ202102099), and Major Public Welfare Projects of Henan Province (201300310400).
Disclosure
The authors report no conflicts of interest in this work.
References
1. Sung H, Ferlay J, Siegel RL, et al. Global cancer statistics 2020: GLOBOCAN estimates of incidence and mortality worldwide for 36 cancers in 185 countries. CA Cancer J Clin. 2021;71(3):209–249. doi:10.3322/caac.21660
2. Sun Y. Tumor microenvironment and cancer therapy resistance. Cancer Lett. 2016;380(1):205–215. doi:10.1016/j.canlet.2015.07.044
3. Yang C, Huang X, Li Y, Chen J, Lv Y, Dai S. Prognosis and personalized treatment prediction in TP53-mutant hepatocellular carcinoma: an in silico strategy towards precision oncology. Brief Bioinform. 2021;22(3). doi:10.1093/bib/bbaa164
4. Lachenmayer A, Alsinet C, Savic R, et al. Wnt-pathway activation in two molecular classes of hepatocellular carcinoma and experimental modulation by sorafenib. Clin Cancer Res. 2012;18(18):4997–5007. doi:10.1158/1078-0432.Ccr-11-2322
5. Chen M, Zhang C, Liu W, Du X, Liu X, Xing B. Long noncoding RNA LINC01234 promotes hepatocellular carcinoma progression through orchestrating aspartate metabolic reprogramming. Mol Ther. 2022;30(6):2354–2369. doi:10.1016/j.ymthe.2022.02.020
6. Zhang C, Yang Y, Wang K, et al. The systematic analyses of RING finger gene signature for predicting the prognosis of patients with hepatocellular carcinoma. J Oncol. 2022;2022:2466006. doi:10.1155/2022/2466006
7. Alexandrov LB, Nik-Zainal S, Wedge DC, Campbell PJ, Stratton MR. Deciphering signatures of mutational processes operative in human cancer. Cell Rep. 2013;3(1):246–259. doi:10.1016/j.celrep.2012.12.008
8. Helleday T, Eshtad S, Nik-Zainal S. Mechanisms underlying mutational signatures in human cancers. Nat Rev Genet. 2014;15(9):585–598. doi:10.1038/nrg3729
9. Craig AJ, von Felden J, Garcia-Lezana T, Sarcognato S, Villanueva A. Tumour evolution in hepatocellular carcinoma. Nat Rev Gastroenterol Hepatol. 2020;17(3):139–152. doi:10.1038/s41575-019-0229-4
10. Letouzé E, Shinde J, Renault V, et al. Mutational signatures reveal the dynamic interplay of risk factors and cellular processes during liver tumorigenesis. Nat Commun. 2017;8(1):1315. doi:10.1038/s41467-017-01358-x
11. Gao Q, Zhu H, Dong L, et al. Integrated proteogenomic characterization of HBV-related hepatocellular carcinoma. Cell. 2019;179(2):561–577.e22. doi:10.1016/j.cell.2019.08.052
12. Tamborero D, Gonzalez-Perez A, Lopez-Bigas N. OncodriveCLUST: exploiting the positional clustering of somatic mutations to identify cancer genes. Bioinformatics. 2013;29(18):2238–2244. doi:10.1093/bioinformatics/btt395
13. Ao L, Zhang Z, Guan Q, et al. A qualitative signature for early diagnosis of hepatocellular carcinoma based on relative expression orderings. Liver Int. 2018;38(10):1812–1819. doi:10.1111/liv.13864
14. Peng F, Wang R, Zhang Y, et al. Differential expression analysis at the individual level reveals a lncRNA prognostic signature for lung adenocarcinoma. Mol Cancer. 2017;16(1):98. doi:10.1186/s12943-017-0666-z
15. Hänzelmann S, Castelo R, Guinney J. GSVA: gene set variation analysis for microarray and RNA-seq data. BMC Bioinform. 2013;14:7. doi:10.1186/1471-2105-14-7
16. Newman AM, Liu CL, Green MR, et al. Robust enumeration of cell subsets from tissue expression profiles. Nat Methods. 2015;12(5):453–457. doi:10.1038/nmeth.3337
17. Thorsson V, Gibbs DL, Brown SD, et al. The Immune Landscape of Cancer. Immunity. 2018;48(4):812–830.e14. doi:10.1016/j.immuni.2018.03.023
18. Liu Z, Xu H, Weng S, Ren Y, Han X. Stemness refines the classification of colorectal cancer with stratified prognosis, multi-omics landscape, potential mechanisms, and treatment options. Front Immunol. 2022;13:828330. doi:10.3389/fimmu.2022.828330
19. Liu Z, Wang L, Guo C, et al. TTN/OBSCN ‘Double-Hit’ predicts favourable prognosis, ‘immune-hot’ subtype and potentially better immunotherapeutic efficacy in colorectal cancer. J Cell Mol Med. 2021;25(7):3239–3251. doi:10.1111/jcmm.16393
20. Liu Z, Liu L, Jiao D, et al. Association of RYR2 mutation with tumor mutation burden, prognosis, and antitumor immunity in patients with esophageal adenocarcinoma. Front Genet. 2021;12:669694. doi:10.3389/fgene.2021.669694
21. Mermel CH, Schumacher SE, Hill B, Meyerson ML, Beroukhim R, Getz G. GISTIC2.0 facilitates sensitive and confident localization of the targets of focal somatic copy-number alteration in human cancers. Genome Biol. 2011;12(4):R41. doi:10.1186/gb-2011-12-4-r41
22. Jiang P, Gu S, Pan D, et al. Signatures of T cell dysfunction and exclusion predict cancer immunotherapy response. Nat Med. 2018;24(10):1550–1558. doi:10.1038/s41591-018-0136-1
23. Geeleher P, Cox N, Huang RS. pRRophetic: an R package for prediction of clinical chemotherapeutic response from tumor gene expression levels. PLoS One. 2014;9(9):e107468. doi:10.1371/journal.pone.0107468
24. Ally A, Balasundaram M, Carlsen R, et al. Comprehensive and integrative genomic characterization of hepatocellular carcinoma. Cell. 2017;169(7):1327–1341.e23. doi:10.1016/j.cell.2017.05.046
25. Sun HC, Zhou J, Wang Z, et al. Chinese expert consensus on conversion therapy for hepatocellular carcinoma (2021 edition). Hepatobiliary Surg Nutr. 2022;11(2):227–252. doi:10.21037/hbsn-21-328
26. Wu T, Luo G, Lian Q, et al. Discovery of a carbamoyl phosphate synthetase 1-deficient HCC subtype with therapeutic potential through integrative genomic and experimental analysis. Hepatology. 2021;74(6):3249–3268. doi:10.1002/hep.32088
27. Wang Y, Zheng XD, Zhu GQ, et al. Crosstalk between metabolism and immune activity reveals four subtypes with therapeutic implications in clear cell renal cell carcinoma. Front Immunol. 2022;13:861328. doi:10.3389/fimmu.2022.861328
28. Oh S, Yeom J, Cho HJ, et al. Integrated pharmaco-proteogenomics defines two subgroups in isocitrate dehydrogenase wild-type glioblastoma with prognostic and therapeutic opportunities. Nat Commun. 2020;11(1):3288. doi:10.1038/s41467-020-17139-y
29. Yang JC, Schuler M, Popat S, et al. Afatinib for the treatment of NSCLC harboring uncommon EGFR mutations: a database of 693 cases. J Thorac Oncol. 2020;15(5):803–815. doi:10.1016/j.jtho.2019.12.126
30. Machiels JP, Haddad RI, Fayette J, et al. Afatinib versus methotrexate as second-line treatment in patients with recurrent or metastatic squamous-cell carcinoma of the head and neck progressing on or after platinum-based therapy (LUX-Head & Neck 1): an open-label, randomised Phase 3 trial. Lancet Oncol. 2015;16(5):583–594. doi:10.1016/s1470-2045(15)70124-5
31. Specenier P, Vermorken J. Afatinib in squamous cell carcinoma of the head and neck. Expert Opin Pharmacother. 2016;17(9):1295–1301. doi:10.1080/14656566.2016.1183647
32. Vengoji R, Macha MA, Nimmakayala RK, et al. Afatinib and Temozolomide combination inhibits tumorigenesis by targeting EGFRvIII-cMet signaling in glioblastoma cells. J Exp Clin Cancer Res. 2019;38(1):266. doi:10.1186/s13046-019-1264-2
33. Chen Y, Chen X, Ding X, Wang Y. Afatinib, an EGFR inhibitor, decreases EMT and tumorigenesis of Huh‑7 cells by regulating the ERK‑VEGF/MMP9 signaling pathway. Mol Med Rep. 2019;20(4):3317–3325. doi:10.3892/mmr.2019.10562
34. Almalki SG, Agrawal DK. ERK signaling is required for VEGF-A/VEGFR2-induced differentiation of porcine adipose-derived mesenchymal stem cells into endothelial cells. Stem Cell Res Ther. 2017;8(1):113. doi:10.1186/s13287-017-0568-4
35. Smaill JB, Rewcastle GW, Loo JA, et al. Tyrosine kinase inhibitors. 17. Irreversible inhibitors of the epidermal growth factor receptor: 4-(phenylamino)quinazoline- and 4-(phenylamino)pyrido[3,2-d]pyrimidine-6-acrylamides bearing additional solubilizing functions. J Med Chem. 2000;43(7):1380–1397. doi:10.1021/jm990482t
36. Löwenberg B, Morgan G, Ossenkoppele GJ, et al. Phase I/II clinical study of Tosedostat, an inhibitor of aminopeptidases, in patients with acute myeloid leukemia and myelodysplasia. J Clin Oncol. 2010;28(28):4333–4338. doi:10.1200/jco.2009.27.6295
37. Harada K, Nishitsuji H, Ujino S, Shimotohno K. Identification of KX2-391 as an inhibitor of HBV transcription by a recombinant HBV-based screening assay. Antiviral Res. 2017;144:138–146. doi:10.1016/j.antiviral.2017.06.005
 © 2023 The Author(s). This work is published and licensed by Dove Medical Press Limited. The
full terms of this license are available at https://www.dovepress.com/terms
and incorporate the Creative Commons Attribution
- Non Commercial (unported, 3.0) License.
By accessing the work you hereby accept the Terms. Non-commercial uses of the work are permitted
without any further permission from Dove Medical Press Limited, provided the work is properly
attributed. For permission for commercial use of this work, please see paragraphs 4.2 and 5 of our Terms.
© 2023 The Author(s). This work is published and licensed by Dove Medical Press Limited. The
full terms of this license are available at https://www.dovepress.com/terms
and incorporate the Creative Commons Attribution
- Non Commercial (unported, 3.0) License.
By accessing the work you hereby accept the Terms. Non-commercial uses of the work are permitted
without any further permission from Dove Medical Press Limited, provided the work is properly
attributed. For permission for commercial use of this work, please see paragraphs 4.2 and 5 of our Terms.
Recommended articles
Identification of KRBA1 as a Potential Prognostic Biomarker Associated with Immune Infiltration and m6A Modification in Hepatocellular Carcinoma
Liu Y, Fu B, Yu Z, Song G, Zeng H, Gong Y, Ding Y, Huang D
Journal of Hepatocellular Carcinoma 2022, 9:497-516
Published Date: 31 May 2022
A Machine Learning Model Based on Health Records for Predicting Recurrence After Microwave Ablation of Hepatocellular Carcinoma
An C, Yang H, Yu X, Han Z, Cheng Z, Liu F, Dou J, Li B, Li Y, Li Y, Yu J, Liang P
Journal of Hepatocellular Carcinoma 2022, 9:671-684
Published Date: 28 July 2022
High Midkine Expression Correlates with Poor Prognosis and Immune Cell Infiltration in Hepatocellular Carcinoma
Yan L, Lv J, Xu M, Jia H, Li S
International Journal of General Medicine 2025, 18:2567-2579
Published Date: 13 May 2025
Machine Learning-Based Sialylation-Associated Gene Signature Predicts Prognosis and Immune Landscape in Hepatocellular Carcinoma: Validation via Multi-Omics Analysis and in vitro Assays
Zheng Z, Wang Y, Zhang W, Du G, Luo B
Journal of Hepatocellular Carcinoma 2026, 13:575986
Published Date: 18 February 2026
Machine Learning-Based Radiopatho-Clinical Model Integrating Ultrasound Radiomics and Kleiner Score for Prognosis Prediction in NAFLD-Related Hepatocellular Carcinoma
Li CL, Jia Z, Yao ZY, Cui XT, Sun A, Hao AY, Chen ZY, Chen F, Cao JY, Wang ZS
Journal of Hepatocellular Carcinoma 2026, 13:611041
Published Date: 19 June 2026