Back to Journals » Journal of Hepatocellular Carcinoma » Volume 11
A Deep Learning Model Combining Multimodal Factors to Predict the Overall Survival of Transarterial Chemoembolization
Authors Sun Z ![]() , Li X, Liang H, Shi Z, Ren H
, Li X, Liang H, Shi Z, Ren H
Received 11 October 2023
Accepted for publication 30 January 2024
Published 26 February 2024 Volume 2024:11 Pages 385—397
DOI https://doi.org/10.2147/JHC.S443660
Checked for plagiarism Yes
Review by Single anonymous peer review
Peer reviewer comments 3
Editor who approved publication: Dr David Gerber
Zhongqi Sun,1 Xin Li,1 Hongwei Liang,1 Zhongxing Shi,2 Hongjia Ren3
1Department of Radiology, the Second Affiliated Hospital of Harbin Medical University, Harbin, 150086, People’s Republic of China; 2Department of Interventional Radiology, the Second Affiliated Hospital of Harbin Medical University, Harbin, 150086, People’s Republic of China; 3School of Information Science and Engineering, Yanshan University, Qinhuangdao, 066004, People’s Republic of China
Correspondence: Zhongqi Sun, Email [email protected]; Hongjia Ren, Email [email protected]
Background: To develop and validate an overall survival (OS) prediction model for transarterial chemoembolization (TACE).
Methods: In this retrospective study, 301 patients with hepatocellular carcinoma (HCC) who received TACE from 2012 to 2015 were collected. The residual network was used to extract prognostic information from CT images, which was then combined with the clinical factors adjusted by COX regression to predict survival using a modified deep learning model (DLOPCombin). The DLOPCombin model was compared with the residual network model (DLOPCTR), multiple COX regression model (DLOPCox), Radiomic model (Radiomic), and clinical model.
Results: In the validation cohort, DLOPCombin shows the highest TD AUC of all cohorts, which compared with Radiomic (TD AUC: 0.96vs 0.63) and clinical model (TD AUC: 0.96 vs 0.62) model. DLOPCombin showed significant difference in C index compared with DLOPCTR and DLOPCox models (P < 0.05). Moreover, the DLOPCombin showed good calibration and overall net benefit. Patients with DLOPCombin model score ≤ 0.902 had better OS (33 months vs 15.5 months, P < 0.0001).
Conclusion: The deep learning model can effectively predict the patients’ overall survival of TACE.
Keywords: deep learning, transarterial chemoembolization, hepatocellular carcinoma
Introduction
Liver cancer is the third leading cause of cancer-related deaths worldwide.1,2 Hepatocellular carcinoma (HCC) is the most common type of liver cancer.3 Patients with early HCC are therapeutic with transplantation, resection, and ablation, and have an overall 5-year survival rate reaching 70–80%.4 However, approximately 80% of patients are in the Barcelona Clinic Liver Cancer staging classification B (BCLC B) at the time of diagnosis, with significantly decreased survival.5 Currently, transcatheter arterial chemoembolization (TACE) is the first-line therapy for patients in BCLC B stage.6 Nevertheless, the objective response rate for TACE was 52.5% and the 3-year overall survival (OS) was 40.4%.7 Accordingly, understanding the prognosis of TACE patients and predicting the survival period of TACE patients is crucial in the overall treatment, which can stratify the risk of diseases and help clinicians to make more personalized decisions, such as determining the follow-up time and planning the treatment programme.
Previous studies have suggested several clinical factors are associated with the prognosis of TACE, including tumor size, tumor numbers, and alpha-fetoprotein (AFP) levels.8–10 Moreover, relevant researchers have developed scoring systems that integrate various clinical information, such as the BCLC B subclassification, albumin-bilirubin (ALBI) grade, and neutrophil-to-lymphocyte ratio.11–13 The above methods can assist clinicians in predicting survival to some extent, whereas, they implicitly assume that the relationship between predictor variables and output results is linear, which may not be a valid assumption, and few studies incorporate radiomic information. CT examination contains not only tumor size and imaging features, but also more information about the prognosis of the primary tumor.14,15 Studies have shown that illustrates that the imaging phenotype at the macro level is closely related to the tissue phenotype at the micro level, and even closely related to molecular pathways and genetic changes.16,17 Obviously, high-dimensional information mined from CT can be used to predict the survival of TACE patients.
In recent years, image-based deep learning methods have shown promising potential for predicting survival, it constructs a model with a large number of hidden layers, automatically extract features, and find various complex nonlinear relationships between input and output after repeated correction.18,19 Therefore, deep learning can be used to predict the survival problem of TACE based on CT images.20 However, in these studies, the prediction model did not account for important confounders (such as preoperative clinical variables and postoperative treatment response after TACE), particularly, postoperative treatment response is an important predictor of TACE survival.21,22 In other words, the deep learning model based on CT images and clinical factors (preoperative and postoperative) to predict the survival of TACE is worthy of further study.
In this study, we aim to develop a deep learning survival prediction model (DLOPCombin) based on preoperative CT images, clinical factors, and postoperative treatment responses to predict the overall survival (OS) prognosis of TACE in HCC patients in the BCLC B stage, and compare it with other models, to finally provide a reference for individual decision making after TACE and overall treatment.
Materials and Methods
The study was approved by the institutional review board of Harbin Medical University (KY2020-267) and performed by the ethical standards outlined in the Declaration of Helsinki. Written informed consent was waived as this study was collected retrospectively, but patient data is kept strictly confidential.
Patients
A total of 301 patients from the Second Hospital of Harbin Medical University between January 2012 to December 2015 were enrolled. Eligible patients were those primary patients diagnosed with HCC and treated with TACE for the first time. Exclusion criteria were radiotherapy, ablation, or other systemic treatment before TACE, cancers other than HCC, lymph node or distant metastases, lack of necessary clinical information, poor CT image affecting analysis, and no available survival data. All patients were randomly divided into a training cohort and a validation cohort in a ratio of 8:2 (Figure S1).
Patient demographic and clinical characteristics (including age, gender, diabetes, cirrhosis, hepatitis), laboratory variables (including alpha-fetoprotein (AFP), alanine aminotransferase (ALT), aspartate aminotransferase (AST), albumin (ALB), total bilirubin (TBIL), microvascular infiltration (MVI), BCLC B subclassification, albumin-bilirubin grade (ALBI), child-pugh score were obtained from the electronic medical records. Tumor characteristics (number, size, location) were recorded from radiology reports.
CT Image Acquisition
All enrolled patients underwent enhanced abdominal CT scans before treatment. Detailed CT scans are given in Appendix E1. CT images of all patients were reviewed by radiologists with 8 and 10 years of diagnostic imaging experience, respectively, without knowledge of clinical information and follow-up data.
Follow-Up and Treatment Response
The endpoint was overall survival, defined as the time between the date of initial TACE and death from causes relevant to this study. To ensure that OS was evaluated in the context of clinical practice, patients received subsequent radiotherapy, surgery, or sorafenib after TACE treatment according to clinical guidelines. Data from patients lost to follow-up or surviving at the last follow-up (January 2022) were considered as censored data.
Appendix E2 for details of the TACE process. CT enhancement /MRI follow-up was performed every 4–6 weeks after TACE until disease stabilization. The treatment response of target lesions was assessed according to the modified Response Evaluation Criteria in Solid Tumors (mRECIST1.1).23 Treatment response was assessed independently by 2 radiologists with ≥ 8 years of experience, and results were categorized as complete response (CR), partial response (PR), stable disease (SD), and progressive disease (PD).
Model Construction
The workflow is shown in Figure 1.To integrate CT images and clinical data, we propose an improved resnet101 deep learning model (DLOPCombin) Appendix E3. The model consists of three main parts: CT feature extraction, clinical feature integration and multimodal features fusion.
 |
Figure 1 Workflow of TACE patient survival prediction model based on deep learning (DLOPcombin). |
(2) Clinical feature integration - We trained a multilayer perceptron classifier (MLP) consisting of three fully connected 16, 32, and 64 hidden units to splice clinical factors after univariate and multivariate COX regression analysis.
Model Comparison
To verify the validity of the deep learning model proposed in this study, DLOPCombin was compared with the following four survival prediction models (Appendix E4).
Statistical Analysis
Patient characteristics were compared using the x2 test or Fisher test. Univariate and multifactorial COX regression analyses were performed to screen for the factors most associated with survival. To assess the discriminatory performance of DLOP, we calculated the Harrell C index. The performance of the model was evaluated using time-dependent area under the receiver operating characteristic curves (TD AUCs) and positive and negative predictive values were calculated. The calibration curves were plotted to assess the degree of overfitting of the model. The Youden index was used to calculate the optimal cut-off point and to classify patients into high-risk and low-risk classes. The clinical efficacy of the model was analyzed using DCA curves. The discriminatory performance of DLOPCombin was benchmarked and the student’s t-test was used to compare the C indices of other models. DeLong test is used to compare TD AUC between models. The false discovery rate (FDR) method is used for calibration. In addition, the output of DLOPCombin was used as a separate variable to reconcile multivariate risk ratios (HRs) using Cox regression analysis.
All statistical analyses were performed using R software. P < 0.05 were considered statistically different Appendix E5.
Results
Patient Characteristics
A total of 301 patients with HCC were included in our retrospective study. The detailed results of patients in the training cohort (n=241), validation cohort (n=60) are summarized in Table 1. There was no significant difference between the training cohort and the validation cohort in all patient characteristics.
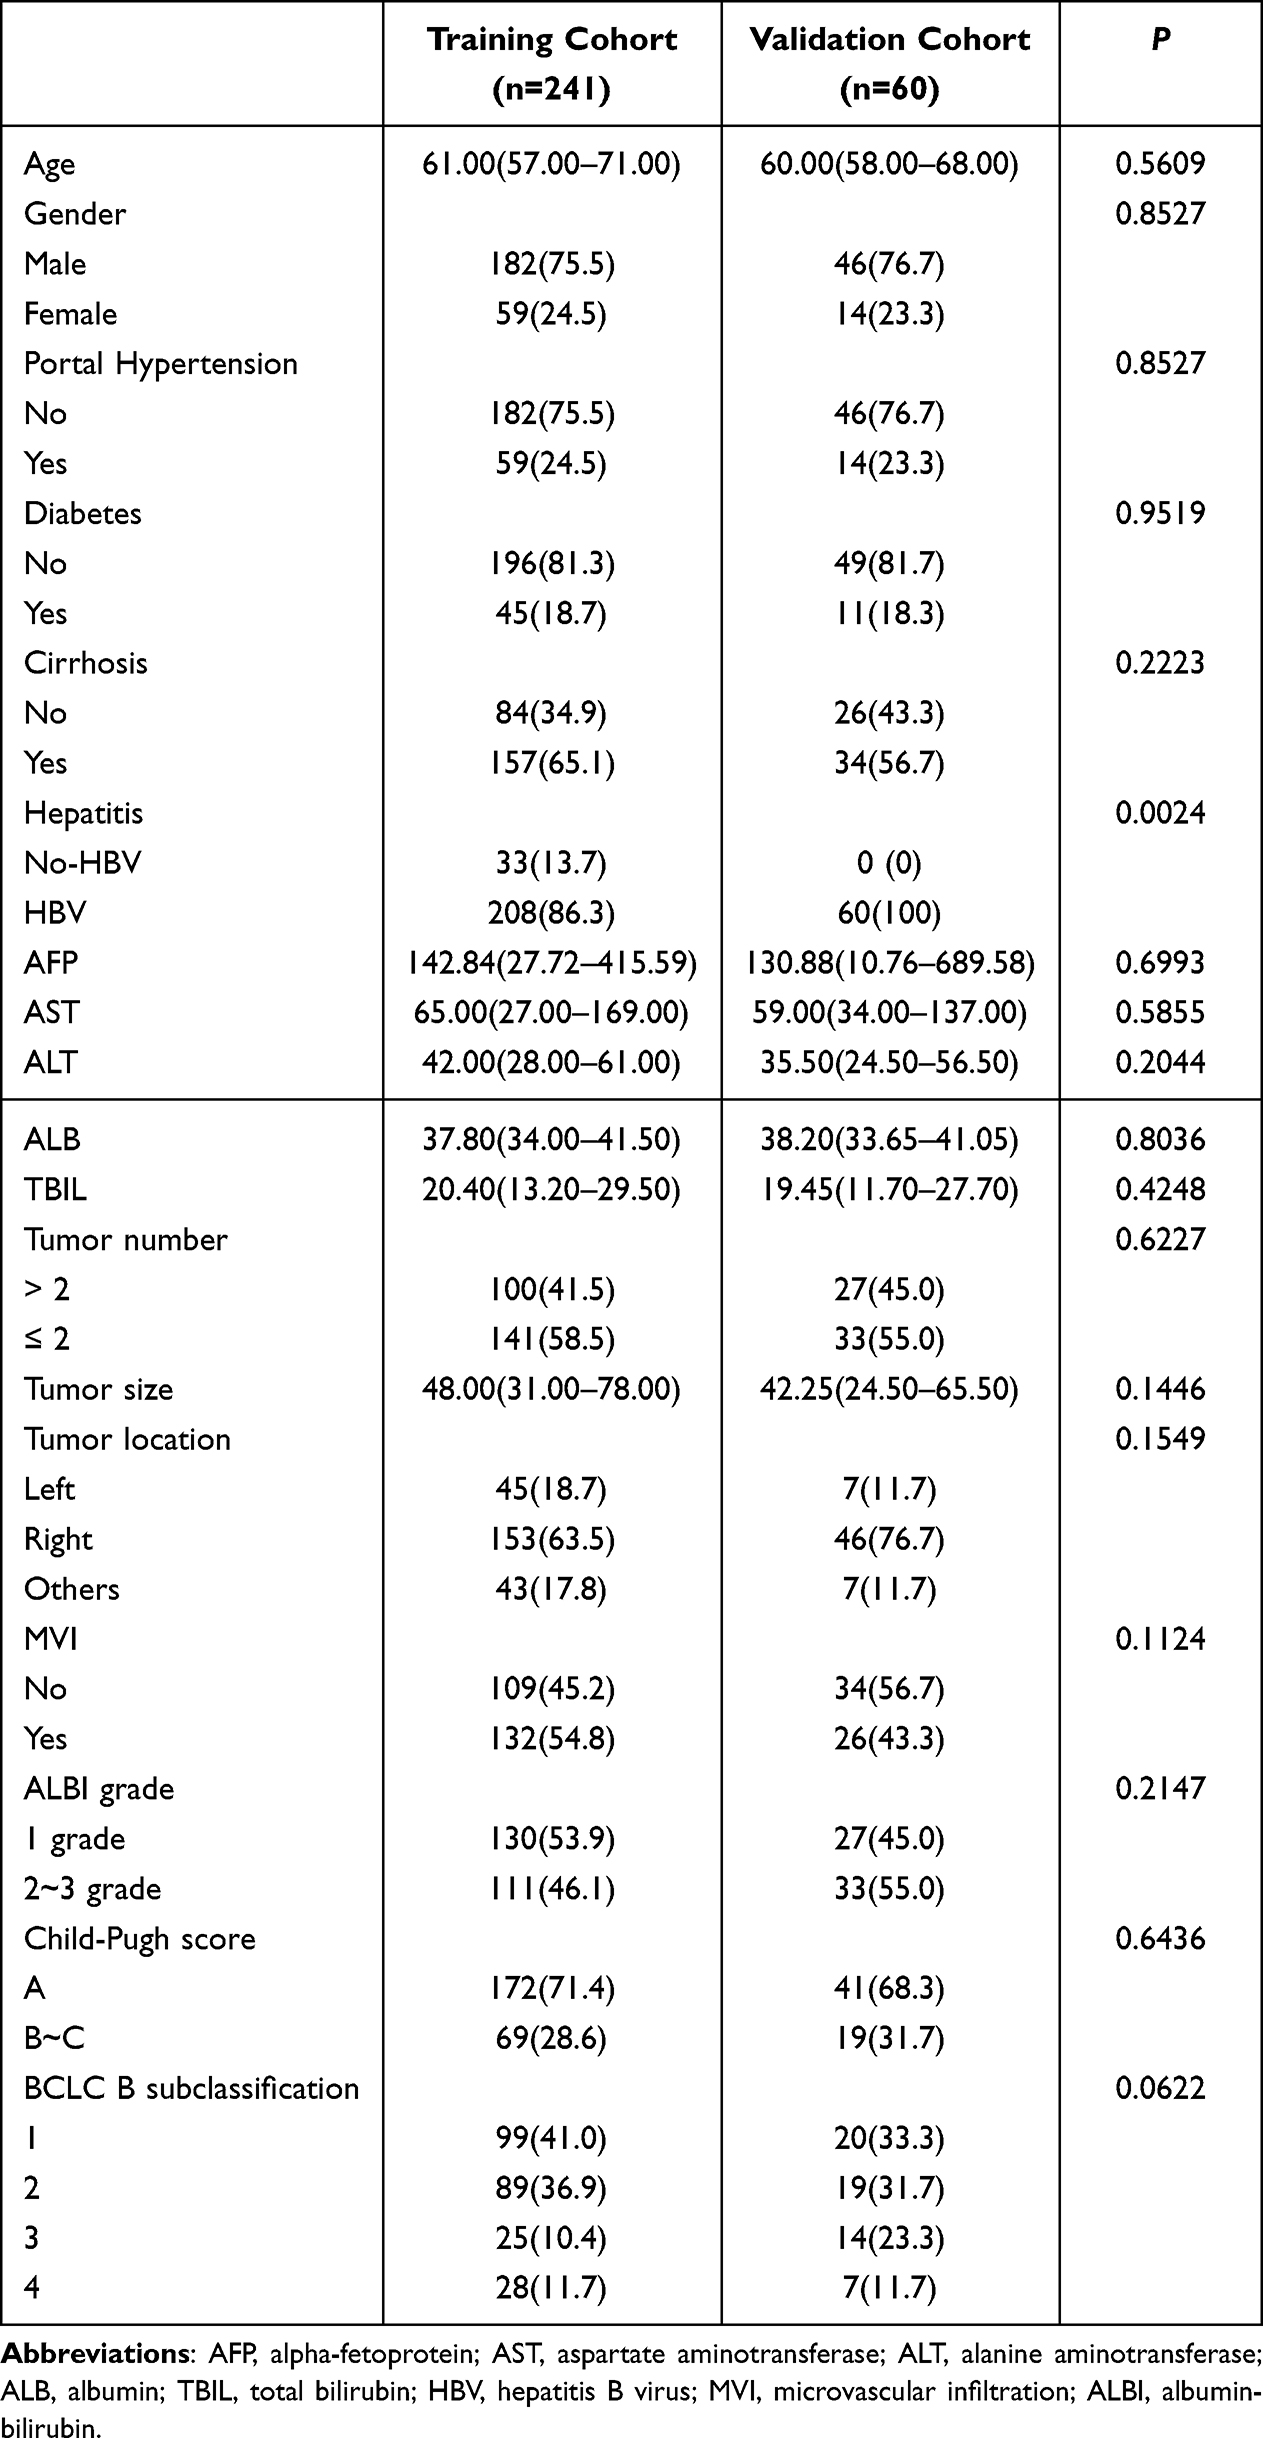 |
Table 1 Baseline Demographic and Clinical Characteristics |
Development and Validation of DLOPCombin
After adjusting for variables in the multivariate Cox regression model in the training cohort, treatment response, MVI, ALBI score and BCLC B subclassification were significant prognostic factors in predicting OS (Table 2). The TD AUC of DLOPCombin in predicting 3-year survival in the training and validation cohorts were 0.98 (95% CI: 0.94, 1.00) and 0.96 (95% CI: 0.88, 1.00), respectively (Table 3 and Figure 2A and B). The C-index of the DLOPCombin for OS prognosis was 0.90 (95% CI: 0.85, 0.95) in the training cohort and 0.88 (95% CI: 0.80, 0.96) in the validation cohort (Table 4). Calibration curves show good agreement between observations and predictions (Figure 2C and D).The Youden index is 0.902, Figure 3A and B show that patients with a score ≤ 0.902 showed significantly better OS than those with scores higher than 0.902.
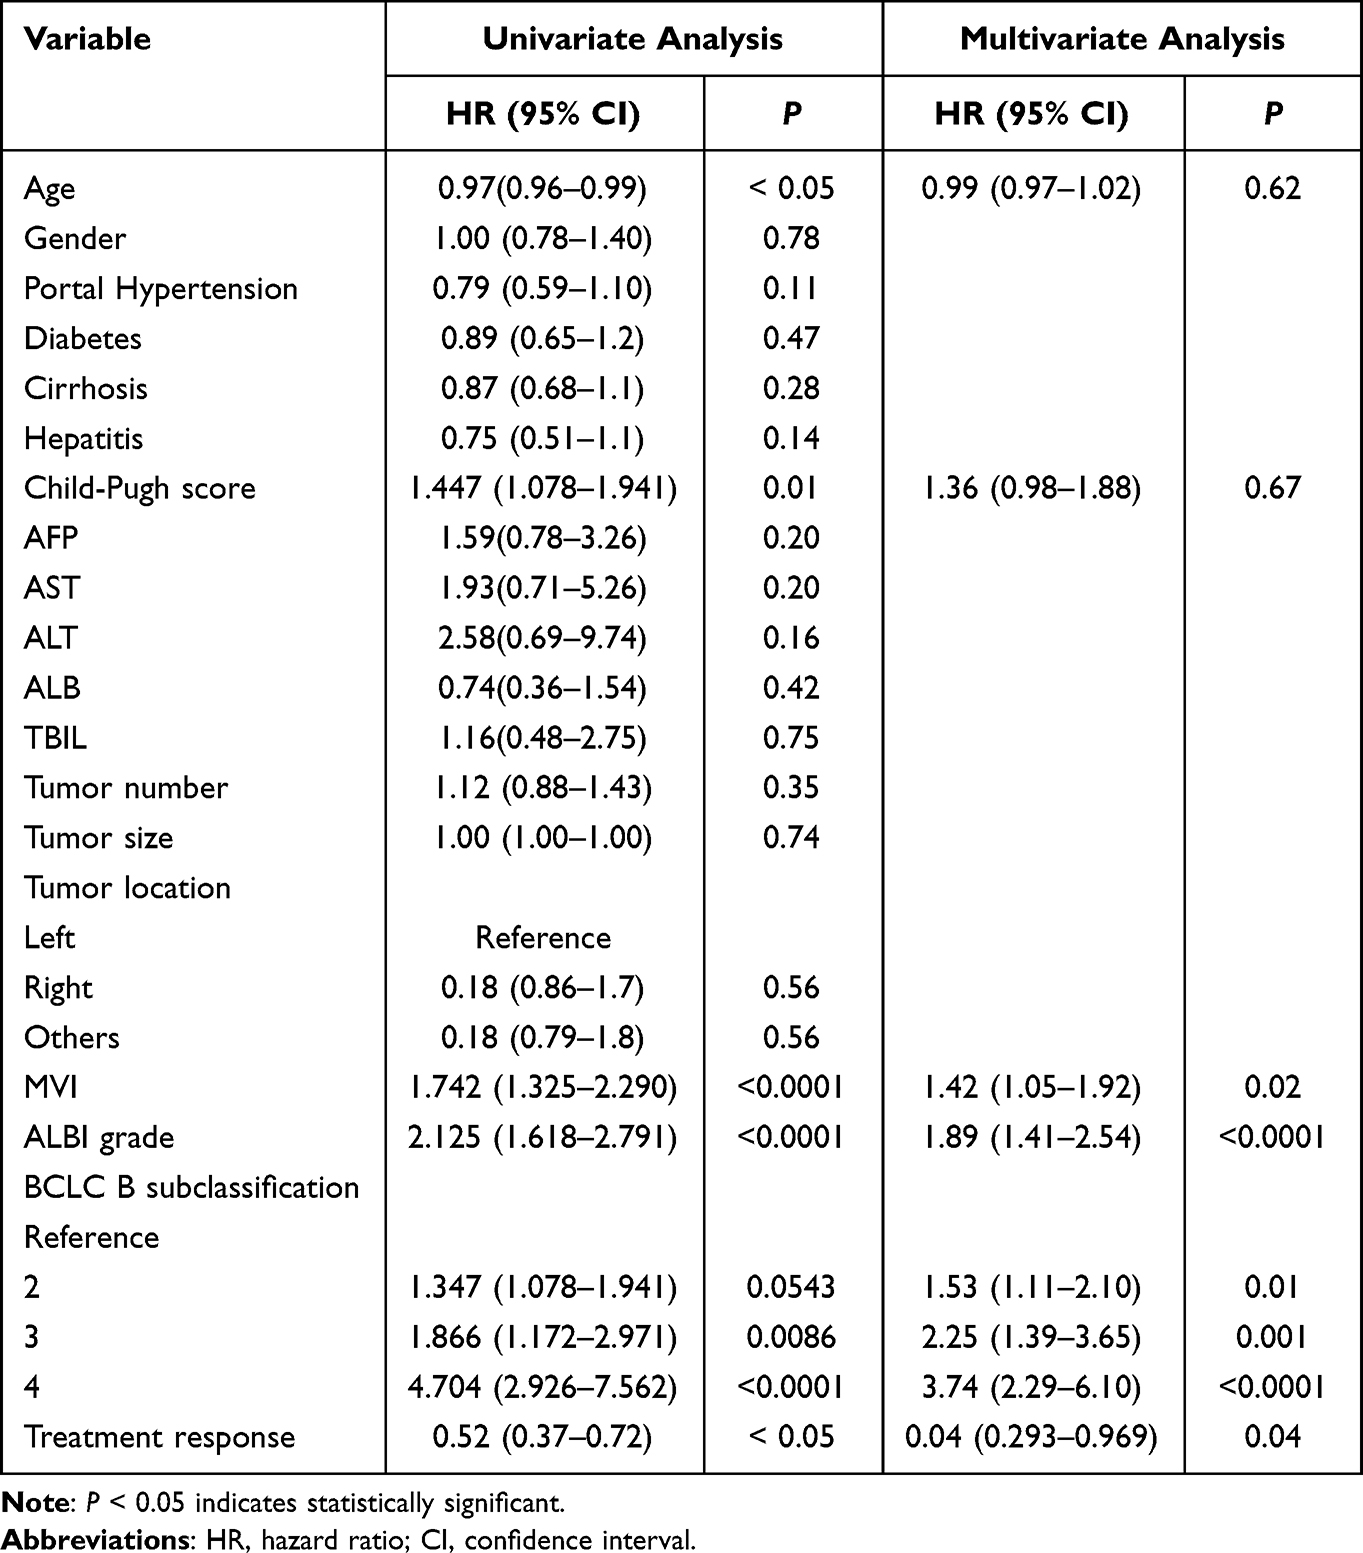 |
Table 2 Univariate and Multivariate Cox Regression Analysis of Clinical Factors in the Training Cohort |
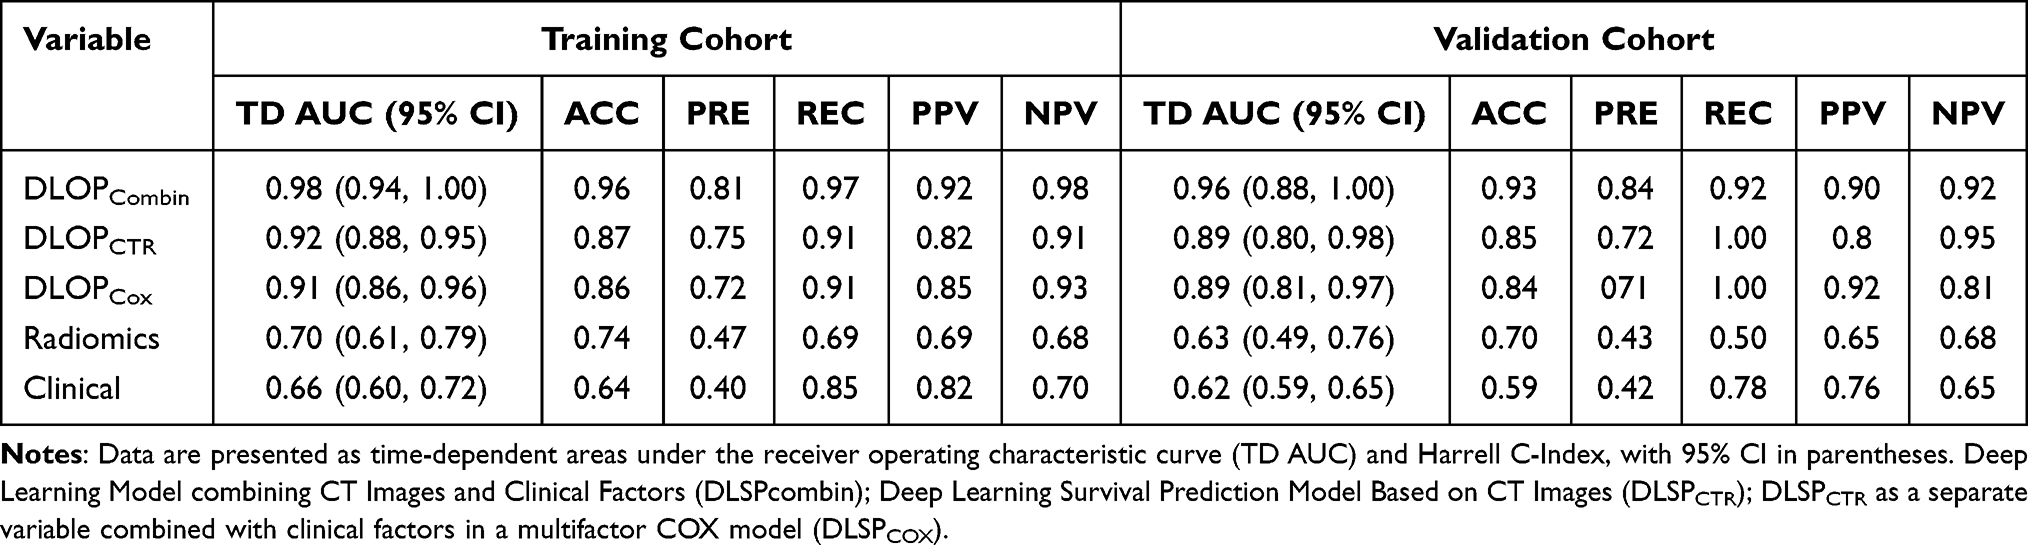 |
Table 3 Performance of the Model in Predicting the Prognosis of HCC Patients in the Training Cohort and the Validation Cohort |
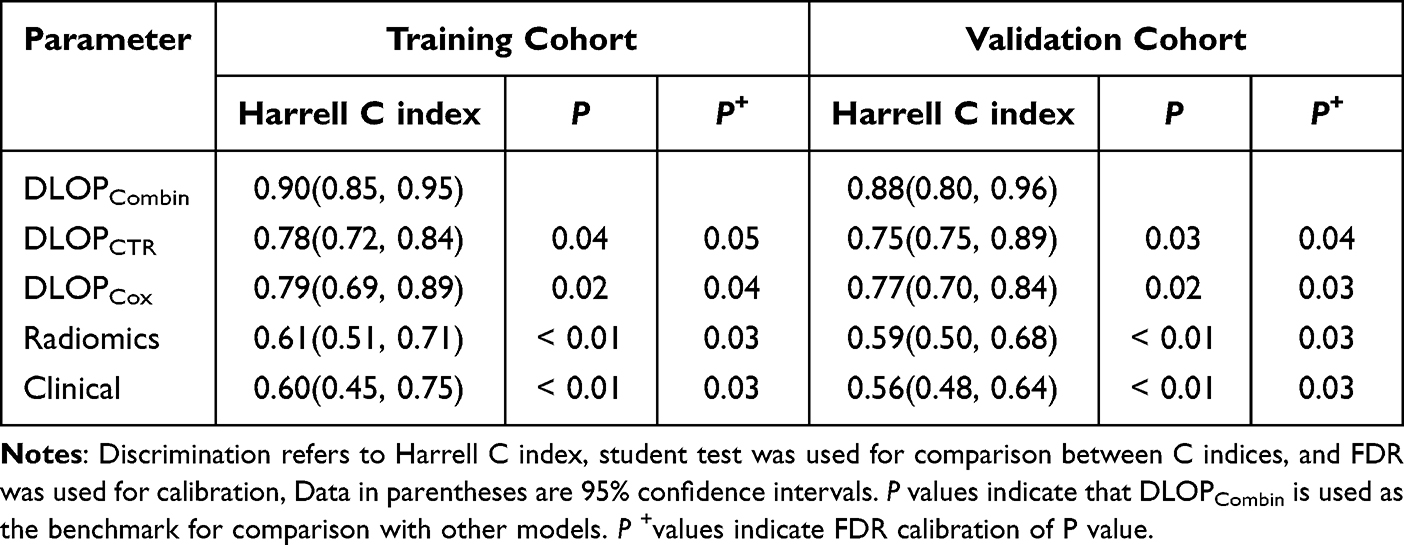 |
Table 4 Discrimination Performance and Calibration of the Survival Prediction Model |
 |
Figure 2 Performance of different survival prediction models. Time-dependent receiver operating curves under the area for 3-year survival of patients (A) training cohort (B) validation cohort. Calibration curves of the model (C) training cohort (D) validation cohort. |
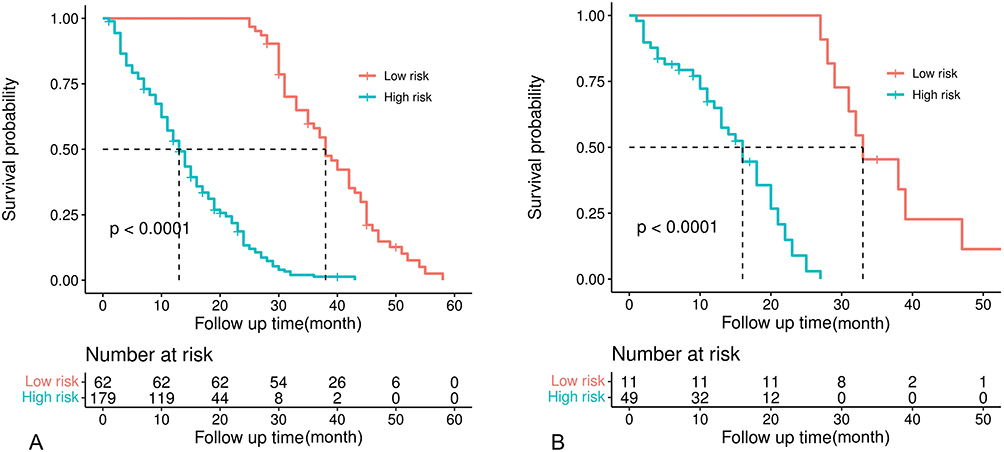 |
Figure 3 Kaplan-Meier estimates of overall survival according to the Youden index of DLSPcombin categorized high- and low-risk groups (A) training cohort (B) validation cohort. |
Comparison of DLOPCombin with Other Models
In the validation cohort, the TD AUC of DLOPCTR was 0.89 (95% CI: 0.80, 0.98) and the C-index was 0.75 (95% CI: 0.75, 0.89) (Table 3 and Table 4). In addition, multifactorial COX regression analysis of the training set showed that the output variables of DLOPCTR were significantly associated with OS (HR: 0.14; 95% CI: 0.10, 0.21; P < 0.01) (Table S1). For the clinically adjusted model (DLOPCox), the C-index was 0.79 (95% CI: 0.69, 0.89) for the DLOPcox training set and 0.77 (95% CI: 0.70, 0.84) for the validation set (Table 4).
Five radiomic features were selected by LASSO COX regression analysis to construct the radiomic model (Table S2 and Figures S2, S3). The TD AUC of the Radiomic model was 0.70 (95% CI: 0.61, 0.79) and 0.63 (95% CI: 0.49, 0.76) for the training and validation sets, respectively. In addition, the clinical model showed the lowest TD AUC: 0.66 (95% CI: 0.60, 0.72) (Table 3). The details as shown in Appendix E6.
The TD AUC of DLOPCombin was 7.9%, 7.9%, 52.4%, and 54.8% higher than those of DLOPCTR, DLOPcox, Radiomic, and clinical model, respectively. DeLong test results show that DLOPCombin model is significantly different from other models (Figure 4A–D). The NPV of DLOPCombin was higher than those of the above four models (Table 3). Furthermore, DLOPCombin has a significant difference with other models in C index (P < 0.05) (Table 4). In addition, the DCA in the validation cohort showed that the DLOPCombin model had higher overall net benefit than other models (Figure 5A and B). Furthermore, the Kaplan-Meier analysis of OS of BCLC substage is shown in Figure S3.
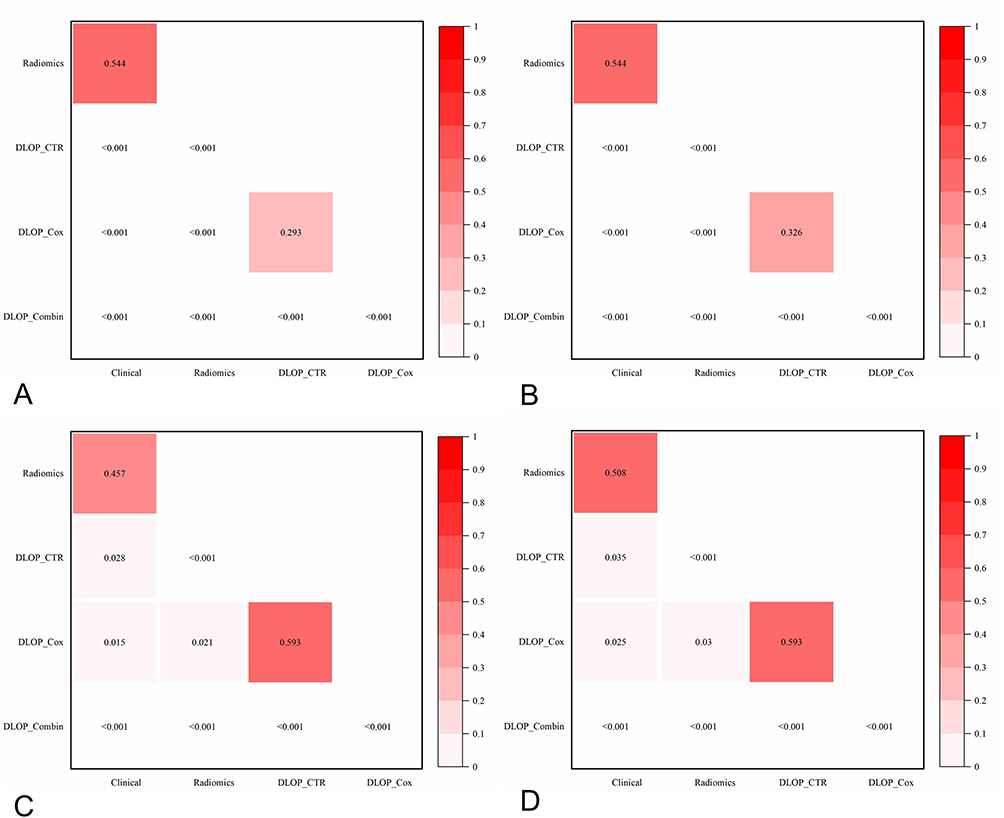 |
Figure 4 Results of the DeLong test between the different models (A) training cohort (B) validation cohort. Results of the FDR after calibration of the p-value (C) training cohort (D) validation cohort. |
 |
Figure 5 Decision curve analysis of the (A) training cohort (B) validation cohort. |
Activation Mapping of the DLOPCombin
Activation profiles of HCC tumors showed that the deep learning survival prediction model had different phenotypic patterns among patients. As shown in Figure 6, the characteristic maps of patients with longer survival periods showed richer activity in the tumor internal heat map (Figure 6A1-3). In contrast, in patients with poor TACE response, the peritumor heat map activity was relatively complex (Figure 6B1-3). An example of a prediction error is shown (Figure 6C1-3), which may indicate that different activation patterns predict TACE postharcoma.
 |
Figure 6 Examples of CT images (A), Heatmap (B), and their corresponding gradient-class activation maps (C) on the validation cohort. On both the heat map and the gradient class activation map, red areas indicate that the area may be associated with a high probability of survival for the patient, while blue lesions indicate a low probability of survival. (A) A 64-year-old woman with 4 years of survival after TACE and Ct-based deep learning survival prediction model activation focused on the tumor region. (B) A 52-year-old male with no internal tumor activation and a disease-free survival of 240 days. (C) The patient with the incorrect prediction, a 48-year-old male, survived 397 days after surgery. The model predicted low risk; however, death occurred after 1254 days. |
Discussion
We developed a deep learning survival prediction model (DLOPCombin) based on CT images and postoperative treatment responses for the first time to successfully predict 3-year survival in patients with HCC undergoing TACE. The model performed well in the training set and validation set. The results were better than DLOPCox and DLOPCTR models (C index: 0.98 vs 0.92, P < 0.001; 0.96 vs 0.89, P < 0.001). In addition, the TD AUC of DLOPCombin was higher than the Radiomic model (0.96 vs 0.63; P < 0.001) and clinical model (0.96 vs 0.62; P < 0.001).
CT images contain some important information reflecting HCC.15 It shows the status of the tumor and contains information about the tumor perimeter, which is 5 cm around the tumor and is an important cause of death in patients with TACE. Previous studies have shown that CT-driven parameters have been shown to correlate with disease prognosis or severity. In this regard, deep learning can not only extract important prognostic information directly from CT images through end-to-end learning, but also learn more complex decision boundaries by training complex multivariate functions to fit the data.18,19 In this paper, our constructed CT-only deep learning model successfully extracts important features from CT images, quantifies them into values that are correlated with patient outcomes and showed good performance. However, further in-depth study showed that the DLOPCombin model after combining CT images and clinical variables yielded a model with the best performance.
In the past, the prediction of survival in TACE patients by clinical factors has been extensively explored. For example, Campani et al used different clinical variables to study survival in TACE with some success.24–26 Jung found that treatment response was an important variable in predicting prognosis in TACE,21 and similarly this paper found that TACE treatment response was an independent prognostic factor associated with survival through multivariate COX regression studies. In fact, treatment response contains important information after TACE, including the status of the target lesion, lymph node condition, and the presence of new lesions, and may provide more prognostic information than pre-TACE treatment variables.22
More interestingly, two different approaches, deep learning and Cox regression, were tried in integrating CT images with postoperative treatment response. The results reveal that the performance of deep learning is higher than that of Cox regression, which may be mainly due to the following points: (1) the deep model represents CT images and clinical features in different network layers, which is easy to classify and identify the information; (2) the deep learning model is a nonlinear framework, which can fit the data better by optimizing and adjusting the parameters. To further validate the performance of the proposed DLOPCombin model in terms of survival prognosis, we also built a radiomics model, and the results showed that the DLOPCombin model outperformed the radiomics model in predicting the survival prognosis of TACE.Jiang also obtained the same results, and the analysis may be due to the fact that the multilayer structure in the deep learning neural network can automatically learn hierarchical rich image features to improve robustness.27 At the same time, the deep learning model avoids redundant proposal generation, caused by the lower learning efficiency.
In our study, we controlled for several important confounders, including the number and size of HCC, by univariate and multifactorial cox regression analyses that were not shown in prognostic models. Previous studies have shown that the number and size of HCC are important prognostic factors for survival.28 The reason for not including these factors in this study is that treatment response contains both variables and there is linear overlap in multivariate COX analysis. Our study also showed that BCLC B subclassification, albumin-bilirubin (ALBI) grade and microvascular infiltration are clinical factors associated with TACE prognosis, which is consistent with previous studies.29–31 Finally, clinical model as also has some predictive power for the prognosis of TACE. However, in our study, the TD AUC of the clinical model validation set was 0.62. The analysis may be that the clinical model ignores the information of image heterogeneity, which may be the reason for the decreased performance.
Our study has some limitations. Firstly, as a retrospective study, treatment route was an important confounding factor that was difficult to control for, including potential differences in immunotherapy and adjuvant therapy. Although treatment was performed according to treatment guidelines, some variability may still exist in actual clinical practice. Secondly, although we proposed a CT image activation map, the mechanism of DLOPCombin model to predict TACE prognosis is unclear and not better explained at present, and the mechanism of deep learning characterization needs to be further investigated. Thirdly, regarding differences in cancer biology, our model was developed and validated in the context of the majority of HBV-associated HCC patients, but hepatitis C and alcoholism are the leading causes of HCC in Western countries. This may lead to differences in the choice of TACE treatment options in clinical practice, therefore, the model should be validated in a Western setting. Finally, this study is a single-center study and lacks an external validation set. In the future, we will expand the sample size and introduce an external validation set to further improve the reliability and generalization of the study.
In conclusion, deep learning models based on preoperative CT and postoperative treatment response for predicting disease-free survival in HCC patients are important tools for preoperative risk stratification and can facilitate clinical decision making in the era of precision medicine.
Acknowledgment
Thanks to Dr. Wang Guokun from the Second Affiliated Hospital of Harbin Medical University for his assistance in the manuscript revision process.
Disclosure
The authors report no conflicts of interest in this work.
References
1. Vogel A, Meyer T, Sapisochin G, et al. Hepatocellular carcinoma. Lancet. 2022;400(10360):1345–1362. doi:10.1016/S0140-6736(22)01200-4
2. Kelley RK, Greten TF. Hepatocellular carcinoma—origins and outcomes. New Engl J Med. 2021;385(3):280–282. doi:10.1056/NEJMcibr2106594
3. Dash S, Aydin Y, Widmer KE, et al. Hepatocellular carcinoma mechanisms associated with chronic HCV infection and the impact of direct-acting antiviral treatment. J Hepatocell Carcinoma. 2020;7:45–76. doi:10.2147/JHC.S221187
4. Cai X. Laparoscopic liver resection: the current status and the future. Hepatobiliary Surg Nutr. 2018;7(2):98–104. doi:10.21037/hbsn.2018.02.07
5. Chow PKH, Gandhi M, Tan SB, et al. SIRveNIB: selective internal radiation therapy versus sorafenib in Asia-pacific patients with hepatocellular carcinoma. J Clin Oncol. 2018;36(19):1913–1921. doi:10.1200/JCO.2017.76.0892
6. Geraldes FO. Annual congress of the European Association of nuclear medicine 2021. Lancet Oncol. 2021;22(12):1655. doi:10.1016/S1470-2045(21)00634-3
7. Lencioni R, de Baere T, Soulen MC, et al. Lipiodol transarterial chemoembolization for hepatocellular carcinoma: a systematic review of efficacy and safety data. Hepatology. 2016;64(1):106–116. doi:10.1002/hep.28453
8. Sheng Y, Wang Q, Liu HF, et al. Preoperative nomogram incorporating clinical factors, serological markers and LI-RADS MRI features to predict early recurrence of hepatocellular carcinoma treated with transarterial chemoembolization. Acad Radiol. 2022;30:1288–1297. doi:10.1016/j.acra.2022.10.020
9. Katayama K, Imai T, Abe Y, et al. Number of nodules but not size of hepatocellular carcinoma can predict refractoriness to transarterial chemoembolization and poor prognosis. J Clin Med Res. 2018;10(10):765–771. doi:10.14740/jocmr3559w
10. Liu S, Li H, Guo L, et al. Tumor size affects efficacy of adjuvant transarterial chemoembolization in patients with hepatocellular carcinoma and microvascular invasion. Oncologist. 2019;24(4):513–520. doi:10.1634/theoncologist.2018-0305
11. Biolato M, Gallusi G, Iavarone M, et al. Prognostic ability of BCLC-B subclassification in patients with hepatocellular carcinoma undergoing transarterial chemoembolization. Ann Hepatol. 2018;17(1):110–118. doi:10.5604/01.3001.0010.7542
12. Johnson PJ, Berhane S, Kagebayashi C, et al. Assessment of liver function in patients with hepatocellular carcinoma: a new evidence-based approach-The ALBI grade. J Clin Oncol. 2015;33(6):550–558. doi:10.1200/JCO.2014.57.9151
13. Chon YE, Park H, Hyun HK, et al. Development of a new nomogram including neutrophil-to-lymphocyte ratio to predict survival in patients with hepatocellular carcinoma undergoing transarterial chemoembolization. Cancers. 2019;11(4):509. doi:10.3390/cancers11040509
14. Kourou K, Exarchos TP, Exarchos KP, et al. Machine learning applications in cancer prognosis and prediction. Comput Struct Biotechnol J. 2014;13:8–17. doi:10.1016/j.csbj.2014.11.005
15. Lee G, Lee HY, Park H, et al. Radiomics and its emerging role in lung cancer research, imaging biomarkers and clinical management: state of the art. Eur J Radiol. 2017;86:297–307. doi:10.1016/j.ejrad.2016.09.005
16. Aerts HJ, Velazquez ER, Leijenaar RT, et al. Decoding tumour phenotype by noninvasive imaging using a quantitative radiomics approach. Nat Commun. 2014;5(1):4006. doi:10.1038/ncomms5006
17. Lee SH, Yim SY, Jeong YS, et al. Consensus subtypes of hepatocellular carcinoma associated with clinical outcomes and genomic phenotypes. Hepatology. 2022;76(6):1634–1648. doi:10.1002/hep.32490
18. Shi JY, Wang X, Ding GY, et al. Exploring prognostic indicators in the pathological images of hepatocellular carcinoma based on deep learning. GUT. 2021;70(5):951–961. doi:10.1136/gutjnl-2020-320930
19. Saillard C, Schmauch B, Laifa O, et al. Predicting survival after hepatocellular carcinoma resection using deep learning on histological slides. Hepatology. 2020;72(6):2000–2013. doi:10.1002/hep.31207
20. Wang H, Liu Y, Xu N, et al. Development and validation of a deep learning model for survival prognosis of transcatheter arterial chemoembolization in patients with intermediate-stage hepatocellular carcinoma. Eur J Radiol. 2022;156:110527. doi:10.1016/j.ejrad.2022.110527
21. Jung J, Joo JH, Kim SY, et al. Radiologic response as a prognostic factor in advanced hepatocellular carcinoma with macroscopic vascular invasion after transarterial chemoembolization and radiotherapy. Liver Can. 2021;11(2):152–161. doi:10.1159/000521227
22. Han G, Berhane S, Toyoda H, et al. Prediction of survival among patients receiving transarterial chemoembolization for hepatocellular carcinoma: a response-based approach. Hepatology. 2020;72(1):198–212. doi:10.1002/hep.31022
23. Cucchetti A, Serenari M, Sposito C, et al. Including mRECIST in the Metroticket 2.0 criteria improves prediction of hepatocellular carcinoma-related death after liver transplant. J Hepatol. 2020;73(2):342–348. doi:10.1016/j.jhep.2020.03.018
24. Campani C, Vitale A, Dragoni G, et al. Time-varying mHAP-III is the most accurate predictor of survival in patients with hepatocellular carcinoma undergoing transarterial chemoembolization. Liver Cancer. 2021;10(2):126–136. doi:10.1159/000513404
25. Park C, Kim JH, Kim PH, et al. Imaging predictors of survival in patients with single small hepatocellular carcinoma treated with transarterial chemoembolization. Korean J Radiol. 2021;22(2):213–224. doi:10.3348/kjr.2020.0325
26. Fu S, Lai H, Huang M, et al. Multi-task deep learning network to predict future macrovascular invasion in hepatocellular carcinoma. EClinicalMedicine. 2021;42:101201. doi:10.1016/j.eclinm.2021.101201
27. Jiang Y, Zhang Z, Yuan Q, et al. Predicting peritoneal recurrence and disease-free survival from CT images in gastric cancer with multitask deep learning: a retrospective study. Lancet Digit Health. 2022;4(5):e340–e350. doi:10.1016/S2589-7500(22)00040-1
28. Purcell Y, Sartoris R, Paradis V, Vilgrain V, Ronot M. Influence of pretreatment tumor growth rate on objective response of hepatocellular carcinoma treated with transarterial chemoembolization. J Gastroenterol Hepatol. 2020;35(2):305–313. doi:10.1111/jgh.14816
29. Xu J, Qin S, Wei H, Chen Y, Peng Y, Qi L. Prognostic factors and an innovative nomogram model for patients with hepatocellular carcinoma treated with postoperative adjuvant transarterial chemoembolization. Anna Med. 2023;55(1):2199219. doi:10.1080/07853890.2023.2199219
30. Young L, Tabrizian P, Sung J, et al. Survival analysis using albumin-bilirubin (ALBI) grade for patients treated with drug-eluting embolic transarterial chemoembolization for hepatocellular carcinoma. J Vasc Interv Radiol. 2022;33(5):510–517.e1. doi:10.1016/j.jvir.2022.02.005
31. Zhong B, Jiang J, Sun J, et al. Prognostic performance of the china liver cancer staging system in hepatocellular carcinoma following transarterial chemoembolization. J Clin Translat Hepatol. 2023;11(6):1321–1328. doi:10.14218/JCTH.2023.00099
 © 2024 The Author(s). This work is published and licensed by Dove Medical Press Limited. The
full terms of this license are available at https://www.dovepress.com/terms
and incorporate the Creative Commons Attribution
- Non Commercial (unported, 3.0) License.
By accessing the work you hereby accept the Terms. Non-commercial uses of the work are permitted
without any further permission from Dove Medical Press Limited, provided the work is properly
attributed. For permission for commercial use of this work, please see paragraphs 4.2 and 5 of our Terms.
© 2024 The Author(s). This work is published and licensed by Dove Medical Press Limited. The
full terms of this license are available at https://www.dovepress.com/terms
and incorporate the Creative Commons Attribution
- Non Commercial (unported, 3.0) License.
By accessing the work you hereby accept the Terms. Non-commercial uses of the work are permitted
without any further permission from Dove Medical Press Limited, provided the work is properly
attributed. For permission for commercial use of this work, please see paragraphs 4.2 and 5 of our Terms.
Recommended articles
Effects of Early TACE Refractoriness on Survival in Patients with Hepatocellular Carcinoma: A Real-World Study
Yang C, Luo YG, Yang HC, Yao ZH, Li X
Journal of Hepatocellular Carcinoma 2022, 9:621-631
Published Date: 21 July 2022
Comparison of the Efficacy and Safety of Transarterial Chemoembolization with or without Lenvatinib for Unresectable Hepatocellular Carcinoma: A Retrospective Propensity Score–Matched Analysis
Chen YX, Zhang JX, Zhou CG, Liu J, Liu S, Shi HB, Zu QQ
Journal of Hepatocellular Carcinoma 2022, 9:685-694
Published Date: 1 August 2022
Retrospective Study of the Efficacy and Safety of Chemoembolization with Drug-Eluting Microspheres Combined with Intra-Arterial Infusion of Bevacizumab for Unresectable Hepatocellular Carcinoma
Ueda S, Hori S, Hori A, Makitani K, Wan K, Sonomura T
Journal of Hepatocellular Carcinoma 2022, 9:973-985
Published Date: 12 September 2022
Adjuvant Transarterial Chemoembolization Plus Immunotherapy for Huge Hepatocellular Carcinoma: A Propensity Score Matching Cohort Study
Huang H, Liao W, Zhang K, Wang H, Cheng Q, Mei B
Journal of Hepatocellular Carcinoma 2024, 11:721-735
Published Date: 8 April 2024
A CT-Based Deep Learning Radiomics Scoring System for Predicting the Prognosis to Repeat TACE in Patients with Hepatocellular Carcinoma: A Multicenter Cohort Study
Dai Y, Zhao S, Wu Q, Zhang J, Zeng X, Jiang H
Journal of Hepatocellular Carcinoma 2025, 12:1647-1659
Published Date: 29 July 2025