Back to Journals » Journal of Multidisciplinary Healthcare » Volume 19
A Bedside Coagulation-Platelet Tipping Point for Mortality in Nontraumatic Subarachnoid Hemorrhage
Authors Xia S ![]() , Wu J, Wang C, Li W, Chen L, Zhang X, Wang J, Yang X
, Wu J, Wang C, Li W, Chen L, Zhang X, Wang J, Yang X
Received 3 March 2026
Accepted for publication 19 May 2026
Published 22 May 2026 Volume 2026:19 606643
DOI https://doi.org/10.2147/JMDH.S606643
Checked for plagiarism Yes
Review by Single anonymous peer review
Peer reviewer comments 2
Editor who approved publication: Professor Charles V Pollack
Shaohuai Xia,1,* Jing Wu,2,* Ce Wang,3,* Wencai Li,4 Li Chen,5 Xingyu Zhang,6 Junping Wang,6 Xinyu Yang1
1Department of Neurosurgery, Tianjin Medical University General Hospital, Tianjin, 300052, People’s Republic of China; 2Department of Neuro-Oncology, Beijing Xiaotangshan Hospital, Beijing, 100000, People’s Republic of China; 3Department of Neuro-Oncology, Cancer Center, Beijing Tiantan Hospital, Capital Medical University, Beijing, 100000, People’s Republic of China; 4Department of Neurosurgery, Huizhou Central People’s Hospital, Huizhou, 516000, People’s Republic of China; 5Department of Neurosurgery, Fuzong Clinical Medical College of Fujian Medical University, Fuzhou, Fujian, 350001, People’s Republic of China; 6Department of Radiology and Tianjin Key Laboratory of Functional Imaging & Tianjin Institute of Radiology, Tianjin Medical University General Hospital, Tianjin, 300052, People’s Republic of China
*The authors contributed equally to this article
Correspondence: Junping Wang, Department of Radiology and Tianjin Key Laboratory of Functional Imaging & Tianjin Institute of Radiology, Tianjin Medical University General Hospital, Tianjin, 300052, People’s Republic of China, Email [email protected] Xinyu Yang, Department of Neurosurgery, Tianjin Medical University General Hospital, Tianjin, 300052, People’s Republic of China, Email [email protected]
Purpose: Nontraumatic subarachnoid hemorrhage (ntSAH) is associated with high in-hospital mortality, and current prognostic models often overlook systemic hemostatic disturbances. We aimed to develop a coagulation-platelet index (INR_PLT) for mortality risk, quantify its nonlinear threshold, and construct an externally validated risk model using stacking ensemble learning.
Patients and Methods: This retrospective study included ntSAH patients from Huizhou Central People’s Hospital (n = 287, training cohort) and the MIMIC-IV (n = 621, external validation). INR_PLT was derived by logistic regression: − 1.596 + 1.364×INR − 0.008×PLT. Nonlinear relationships and thresholds were identified using restricted cubic splines and segmented regression. Nomograms and machine learning models (LR, SVM, DT, and LGBM) were developed, with a stacking ensemble as the final model. The performance of the models was evaluated by receiver operating characteristic (ROC) curves, calibration plots, and SHAP.
Results: Of the 908 patients, 163 (17.95%) died. The independent predictors included age, GCS score, nimodipine use, and the INR_PLT (OR 2.425). INR_PLT was significantly correlated with antiplatelet therapy (P = 0.006) and mediated 19.8% of diabetes-associated mortality risk. A threshold at INR_PLT = − 2.457 markedly increased mortality risk (OR 2.527, P = 0.002). The nomogram (C-index 0.847) and stacking model (AUC 0.80, F1 = 0.763) demonstrated strong performance.
Conclusion: The INR_PLT is a bedside index for identifying a significant mortality threshold in patients with ntSAH, supporting precise risk stratification with external validation.
Keywords: subarachnoid hemorrhage, coagulation, platelet count, machine learning, risk stratification, prognosis
Introduction
Nontraumatic subarachnoid hemorrhage (ntSAH) constitutes a significant global stroke burden (incidence: 6–10/100,000 annually), predominantly from intracranial aneurysm rupture,1,2 yet 15–20% of cases originate from nonaneurysmal subtypes (eg., perimesencephalic hemorrhage, vascular malformations) that remain understudied despite their distinct clinical implications,3 leading to an underestimated disease burden.1,2 Critically, global burden of disease (GBD) data (1990–2021) reveal divergent trends: declining incidence in high-income regions versus rising mortality/disability in low/middle-income countries due to aging populations, socioeconomic disparities, and limited healthcare resources,4,5 underscoring the urgent need for novel early risk markers to guide interventions.
Traditional research bifurcates mechanisms into aneurysm-related pathways (size/location biomechanics and hemodynamic stresses)6–8 and systemic vascular risks (hypertension/smoking via endothelial dysfunction.7,9,10 However, current models face three unresolved gaps: (1) Mechanistic oversimplification—clinical scales (Hunt-Hess, WFNS) prioritize neurological/imaging features but ignore dynamic coagulation‒platelet interactions (thromboxane A2-mediated platelet activation and thrombin cascade regulation11 and fail to quantify threshold effects;12 (2) pathological homogeneity bias—coagulopathy’s role in nonaneurysmal subtypes (hypercoagulability, consumptive thrombocytopenia, or hyperfibrinolysis)13 remains contentious despite putative genetic signatures;14 (3) limited generalizability—conventional algorithms (eg., logistic regression) cannot capture coagulation markers’ nonlinear dynamics,15 while emerging machine learning models suffer from single-center overfitting, poor interpretability (“black-box” effect), and the absence of external validation, stalling clinical translation. To address these voids, we develop and validate a novel coagulation‒platelet index (INR_PLT) with threshold detection, establish its multicenter prognostic utility, and construct an interpretable machine learning framework for precision risk stratification.
Materials and Methods
Data Availability
This retrospective observational analysis utilized data from Huizhou Central Hospital and the Medical Information Mart for Intensive Care IV (MIMIC-IV) database. The study protocol received approval from the Ethics Committee of Huizhou Central Hospital (Approval No. ky112025105). MIMIC-IV is a widely recognized, publicly accessible database, with data deidentified to exempt the requirement for informed consent. The study was conducted in accordance with the ethical principles outlined in the Declaration of Helsinki.
Patient Selection
This retrospective study initially identified 1011 patients who were diagnosed with ntSAH at Huizhou Central Hospital between January 2021 and December 2024 in the MIMIC-IV database. In accordance with the application of the exclusion criteria, a total of 908 patients were included. Specifically, the Huizhou Central Hospital cohort initially included 336 patients; 49 patients were excluded because they were under 18 years of age and had a hospitalization duration of less than 24 hours, concomitant malignancy, or severe hepatic or renal disease, yielding 287 patients for the training set. The MIMIC-IV cohort was prescreened using similar exclusion criteria (age <18 years, hospitalization <24 hours), resulting in 675 patients, of whom 54 were further excluded because of malignancy or severe hepatic or renal conditions, leaving 621 patients for the validation set (Figure 1).
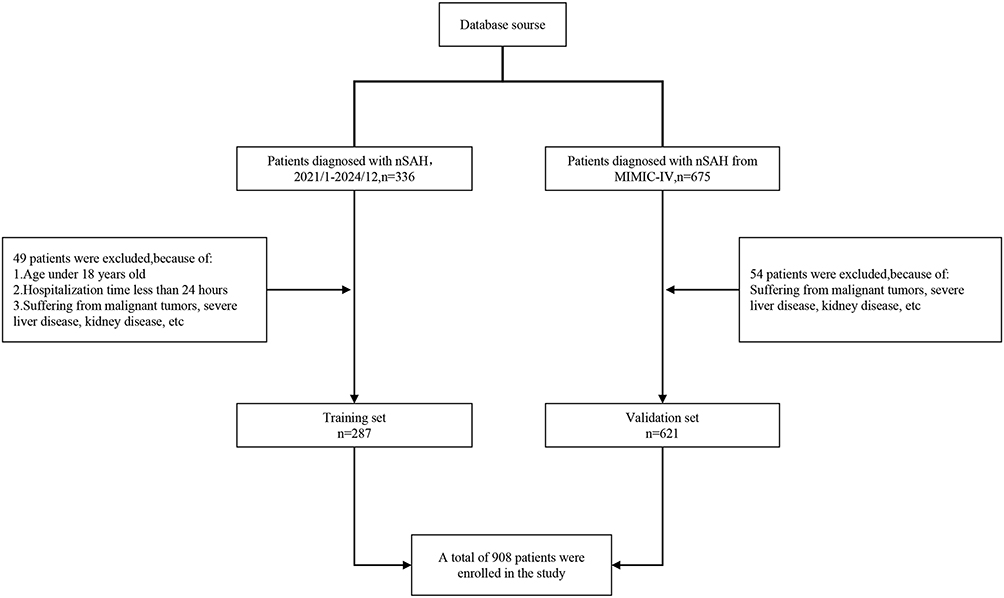 |
Figure 1 Flowchart of Patient Selection. |
MIMIC-IV Cohort Extraction and Variable Time Window
Patients in the MIMIC-IV (v3.1) were identified using structured diagnosis codes for subarachnoid hemorrhage and exclusion of trauma-related diagnoses and admissions with hospitalization times <24 h, in accordance with the training cohort criteria. For laboratory and vital sign variables, we extracted the first available measurement after admission (or ICU entry, when hospital-level timestamps were unavailable) to reflect early physiological status. Full code lists and query logic can be provided by the authors upon reasonable request to facilitate reproducibility.
Definitions of Outcomes
The primary outcome was all-cause in-hospital mortality, defined as death occurring during the index hospitalization for ntSAH. The mortality status of the Huizhou Central People’s Hospital cohort was obtained from discharge records, and the mortality status in the MIMIC-IV was obtained from the hospital discharge disposition field. To ensure cross-cohort comparability, the outcome window was restricted to the index hospitalization in both datasets.
Statistical Analysis
Statistical analyses were conducted using two platforms: R software (version 4.2.2) for core statistical modeling and Python (version 3.6.8) dedicated to stacking ensemble learning. The patient cohort from Huizhou Central Hospital (2021–2024, n = 287) served as the training set, while the MIMIC-IV database cohort (n = 621) was used as the external validation set. Following multiple imputation to address missing data, complete datasets were generated for analysis. The baseline characteristics of the training cohort are detailed in Table S1, with performance metrics of multiple imputation (m = 10) shown in Table S2; validation cohort baselines and imputation performance are presented in Tables S3 and S4, respectively.
Descriptive statistics summarized the demographic and clinical features of all included patients. Continuous variables were assessed for normality using the Shapiro‒Wilk test; nonnormally distributed data are expressed as medians with interquartile ranges and were compared via the Mann‒Whitney U-test. Categorical variables are reported as counts and percentages, with group differences evaluated using the chi-square test or Fisher’s exact test when expected counts were less than five.
Predictor selection was performed using least absolute shrinkage and selection operator (LASSO) regression, followed by multivariable logistic regression to derive the coagulation‒platelet composite index (INR_PLT), which was calculated as follows:

To elucidate the mechanistic association between the INR_PLT and clinical outcomes, a series of analyses, including subgroup stratification, mediation modeling, restricted cubic spline (RCS) nonlinear fitting, and segmented regression, were performed to explore threshold effects. A multivariable logistic regression model was subsequently developed to construct a nomogram for mortality prediction. Model discrimination was evaluated by the area under the receiver operating characteristic curve (AUC). Calibration was assessed via calibration plots employing bootstrap resampling combined with the Hosmer-Lemeshow goodness-of-fit test. Clinical net benefit was quantified using decision curve analysis (DCA). Subsequently, machine learning algorithms—support vector machines (SVMs), decision trees (DTs), and light gradient boosting machines (LGBMs)—were trained to optimize the predictive performance. The feature importance and decision contributions were interpreted using SHapley Additive exPlanations (SHAP) values. Finally, a stacking ensemble strategy was implemented to integrate the model outputs, thereby enhancing the overall predictive accuracy.
Methodological Details for Reproducibility
For machine learning, continuous predictors were standardized (Z score). The hyperparameters were tuned via 10-fold cross-validation within the training cohort. The stacking ensemble used DT, SVM, and LGBM as base learners and LR as the meta-learner; to minimize information leakage, the meta-learner was trained using out-of-fold predictions from the base learners. Model discrimination was assessed using the AUC with 95% confidence intervals, and additional metrics included precision, recall, accuracy, F1 score, PPV, and NPV. Calibration was evaluated using calibration curves and, when relevant, summary calibration indices (eg., Brier score) to support clinical deployment.
Missing data were handled using multiple imputation with10 imputations, incorporating all the candidate predictors and the outcome to satisfy the missing-at-random assumption as closely as possible. For variable selection, LASSO with 10-fold cross-validation was used to identify predictors with nonzero coefficients. For nonlinear assessment, restricted cubic splines were fitted with a knot number selected by the Akaike information criterion, and nonlinearity was tested using the Wald test for the spline terms. Threshold points were determined by segmented regression (piecewise logistic regression) and compared against the linear model using likelihood ratio tests. Where applicable, threshold estimates were checked for robustness using bootstrap resampling.
Results
Patient Selection and Baseline Characteristics
Analysis based on the multiply imputed dataset revealed that the training cohort (n = 287) included 43 nonsurvivors and 244 survivors (Table 1). Significant differences were observed between the nonsurviving and surviving groups in terms of age, initial Glasgow Coma Scale (GCS) score, blood glucose (GLU), systolic blood pressure (SBP), international normalized ratio (INR), platelet count (PLT), sex distribution, incidence of hydrocephalus, occurrence of cerebral infarction, use of nimodipine, and incidence of diabetes (all P < 0.05). No significant differences were found in the remaining variables.
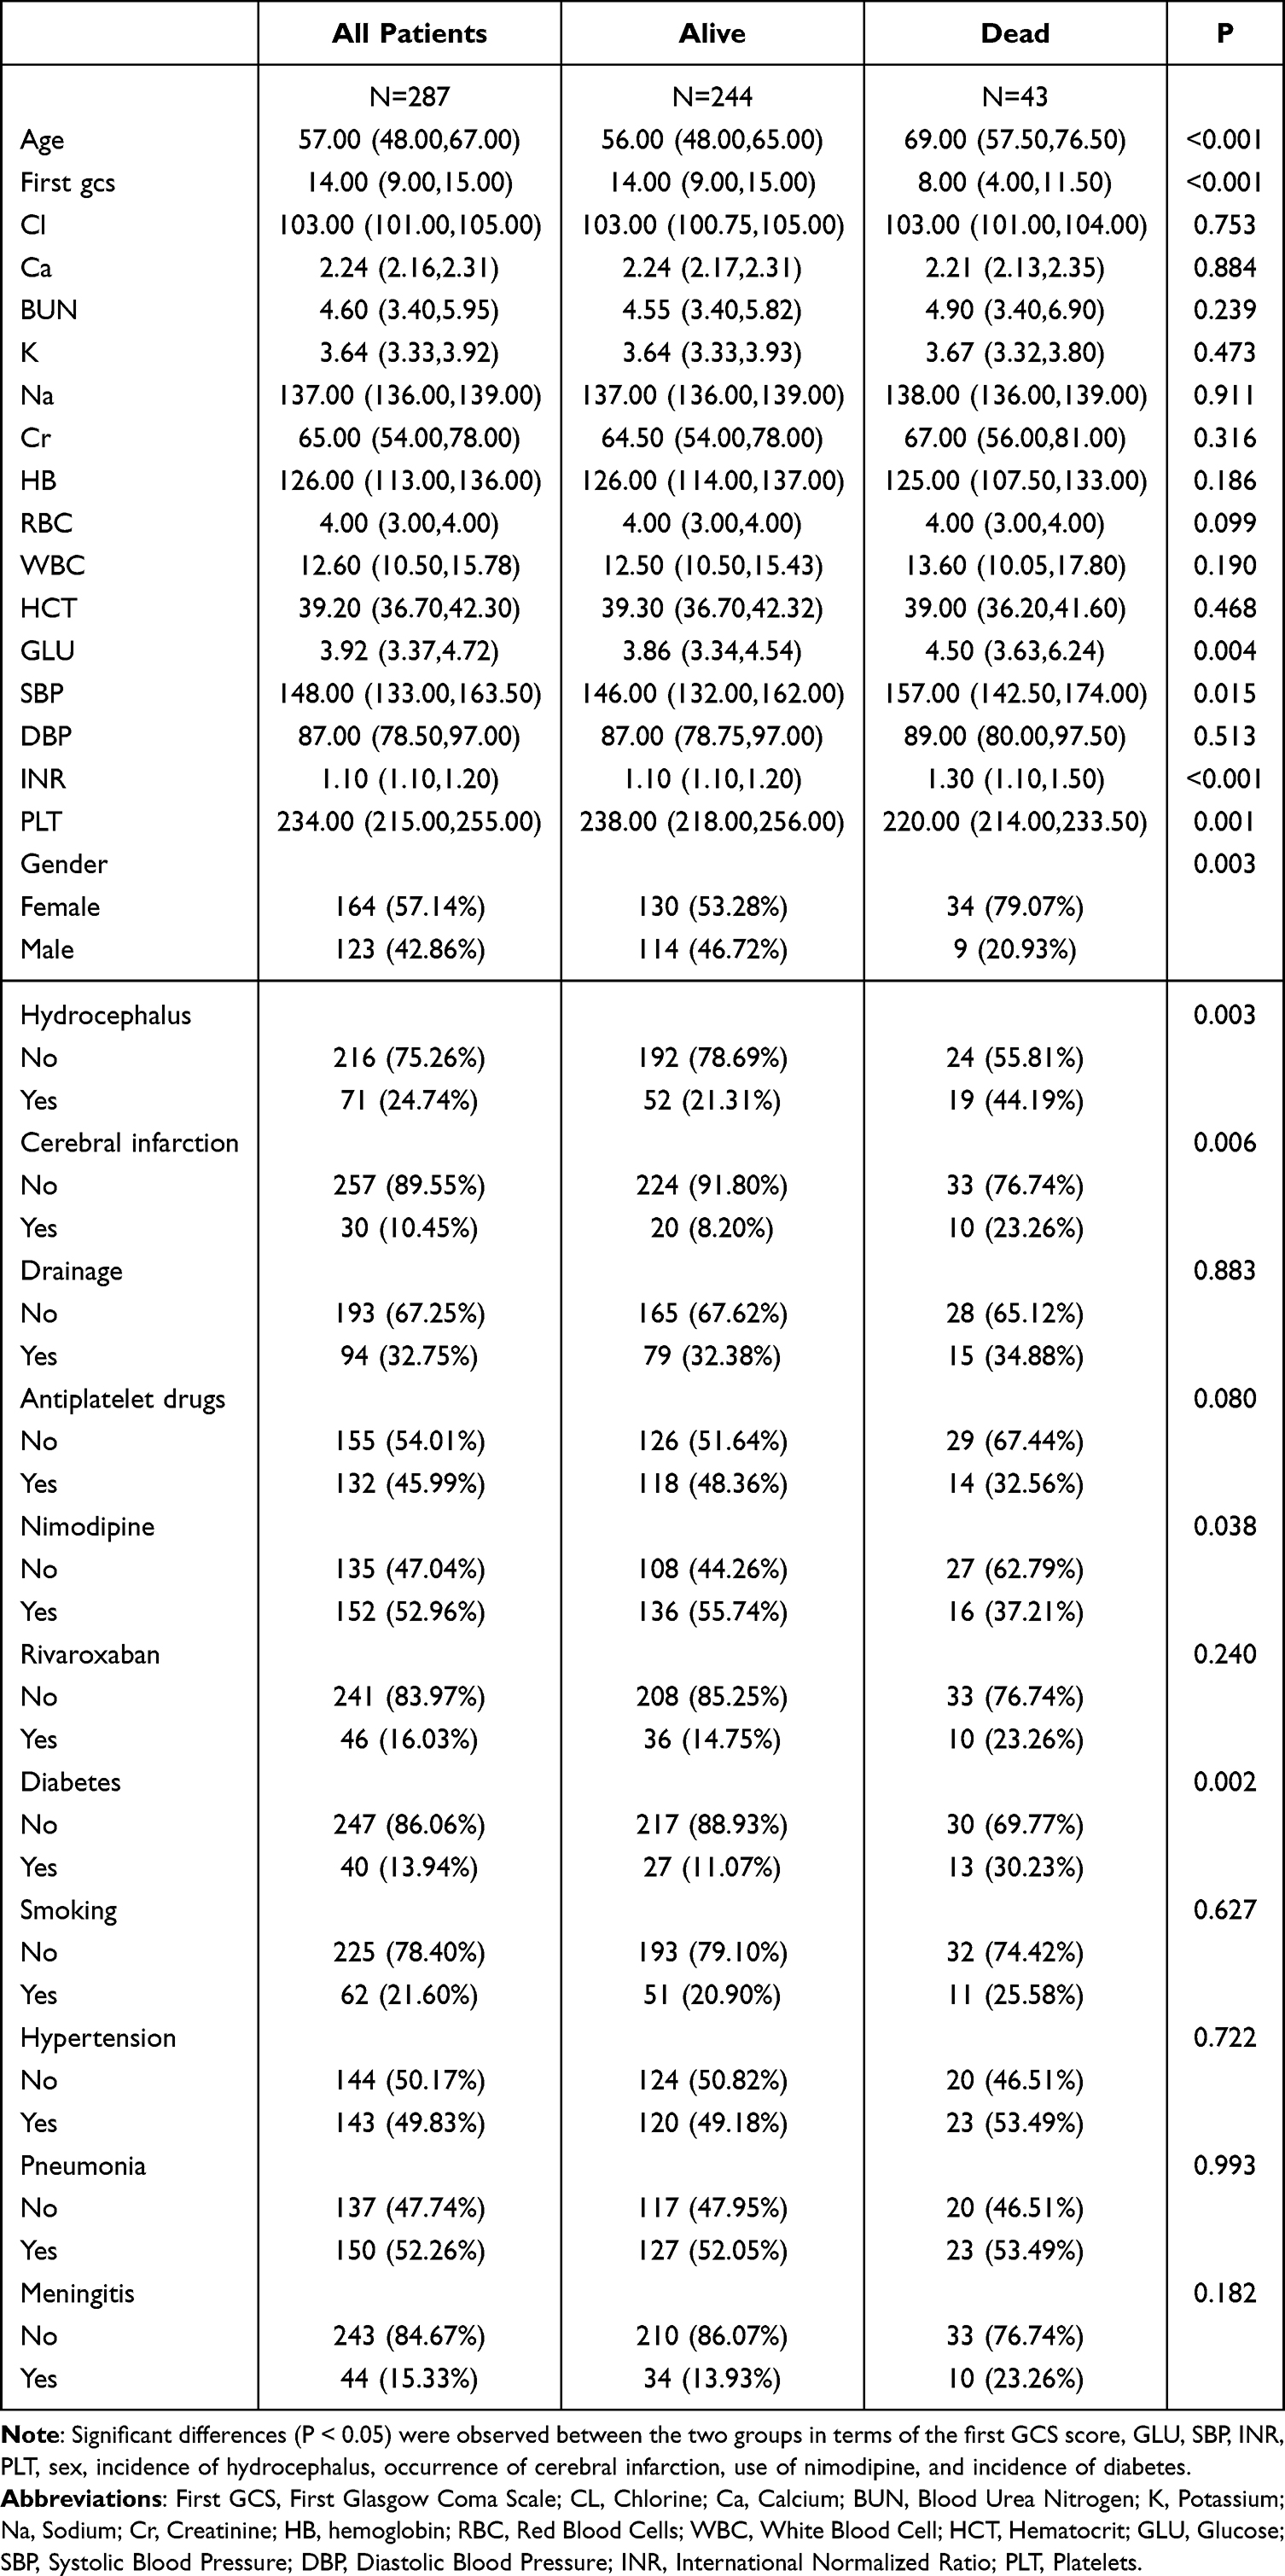 |
Table 1 Baseline Data of the Training Set |
The external validation cohort (n = 621) included 120 nonsurvivors and 501 survivors (Table 2). Similarly, the survival group differed significantly from the survival group with respect to age, initial GCS score, blood urea nitrogen (BUN), serum potassium (K), creatinine (Cr), GLU, INR, PLT, sex distribution, incidence of hydrocephalus, antiplatelet agent use, nimodipine use, diabetes incidence, and occurrence of pneumonia (all P < 0.05).
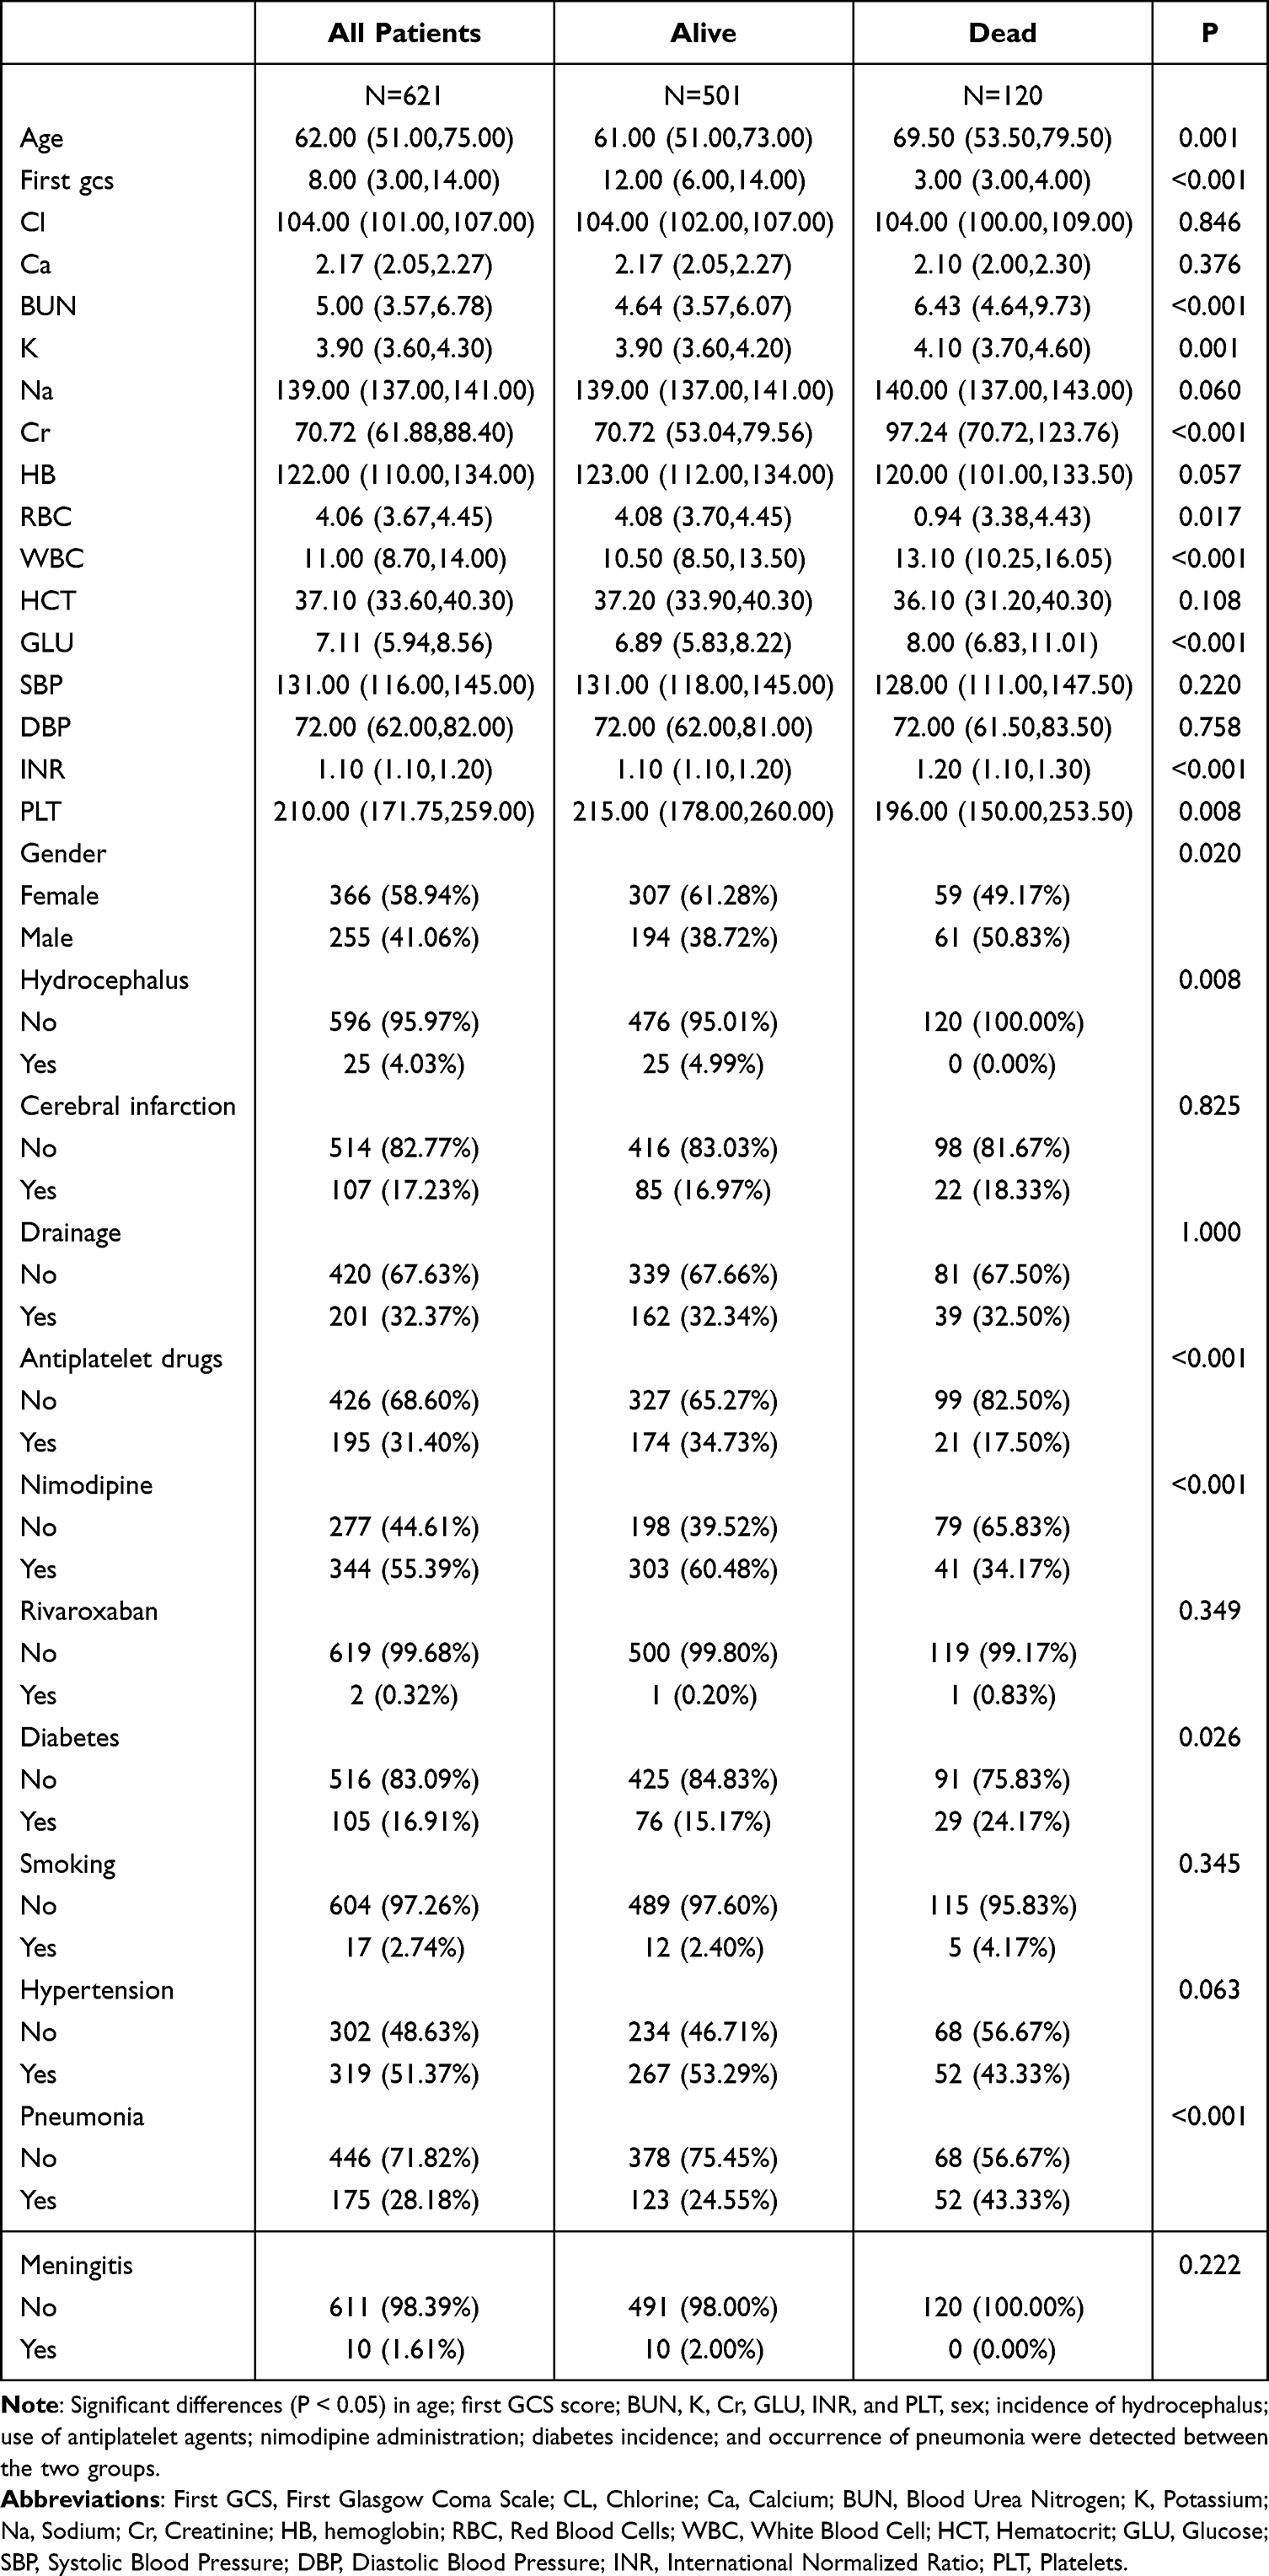 |
Table 2 Baseline Data of the Validation Set |
Variable Selection
Following the least absolute shrinkage and selection operator (LASSO) regression, a total of 13 predictors were ultimately identified for inclusion in the subsequent models: first Glasgow Coma Scale (First GCS), international normalized ratio (INR), age (Age), nimodipine use (Nimodipine), sex (Gender), diabetes (Diabetes), hematocrit (HCT), red blood cell count (RBC), hemoglobin (HB), antiplatelet drug use (antiplatelet drugs), cerebral infarction (cerebral infarction), platelet count (PLT), and glucose (GLU) (Figure 2).
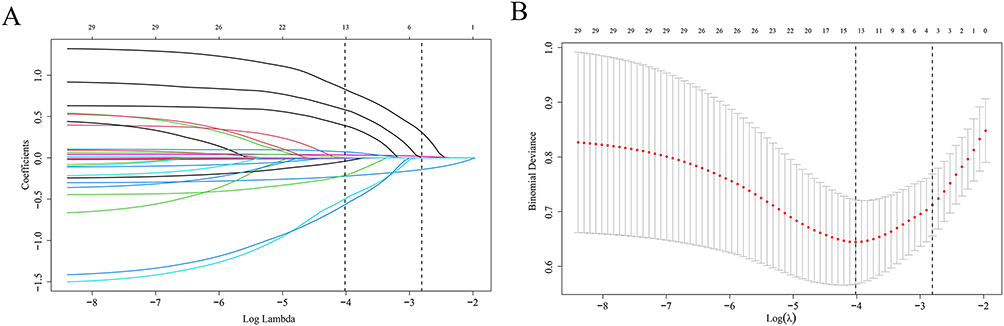 |
Figure 2 LASSO Coefficient Profile Plot and Lambda Selection for Variable Shrinkage. Identification of optimal predictors via least absolute shrinkage and selection operator (LASSO) regression analysis. Coefficient profiles of candidate predictors plotted against Log Lambda, with vertical dashed lines indicating key lambda values (A). Binomial deviance plotted against Log(λ), with the vertical dashed line indicating the optimal lambda value for predictor selection (B). |
Analysis of Influencing Factors and Construction of a Composite Index
Thirteen predictive variables selected via LASSO regression were incorporated into a multivariate logistic regression model. The intercept was not statistically significant (P = 0.624). Each one-point increase in the initial Glasgow Coma Scale score (First gcs) corresponded to a 26.5% reduction in mortality risk (OR = 0.735; 95% CI: 0.632–0.854; P < 0.001), indicating that it was an independent protective factor. An increase of one unit in the international normalized ratio (INR) was associated with a 291.3% increase in mortality risk (OR = 3.913; 95% CI: 1.512–10.129; P = 0.005), indicating that it is an independent risk factor. Age (per additional year) increased mortality risk by 5.2% (OR = 1.052; 95% CI: 1.015–1.091; P = 0.006), confirming that age was an independent risk factor. Nimodipine administration reduced mortality risk by 69.9% (OR = 0.301; 95% CI: 0.118–0.769; P = 0.013), indicating that it had an independent protective effect. Compared with female patients, male patients had a 65% lower mortality risk (OR = 0.350, 95% CI: 0.125–0.981; P = 0.045). On the basis of these pivotal variables, the coagulation‒platelet composite index was ultimately formulated as follows:

The INR_PLT composite index was calculated as INR_PLT = β0 + β1×INR + β2×PLT, where β0 = −1.596 (model intercept), β1 = 1.364 (INR coefficient, P = 0.005), and β2 = −0.008 (PLT coefficient), all obtained from the multivariable logistic regression model presented in Table 3. This weighting strategy follows the standard methodological framework for deriving prognostic indices from logistic regression weights.
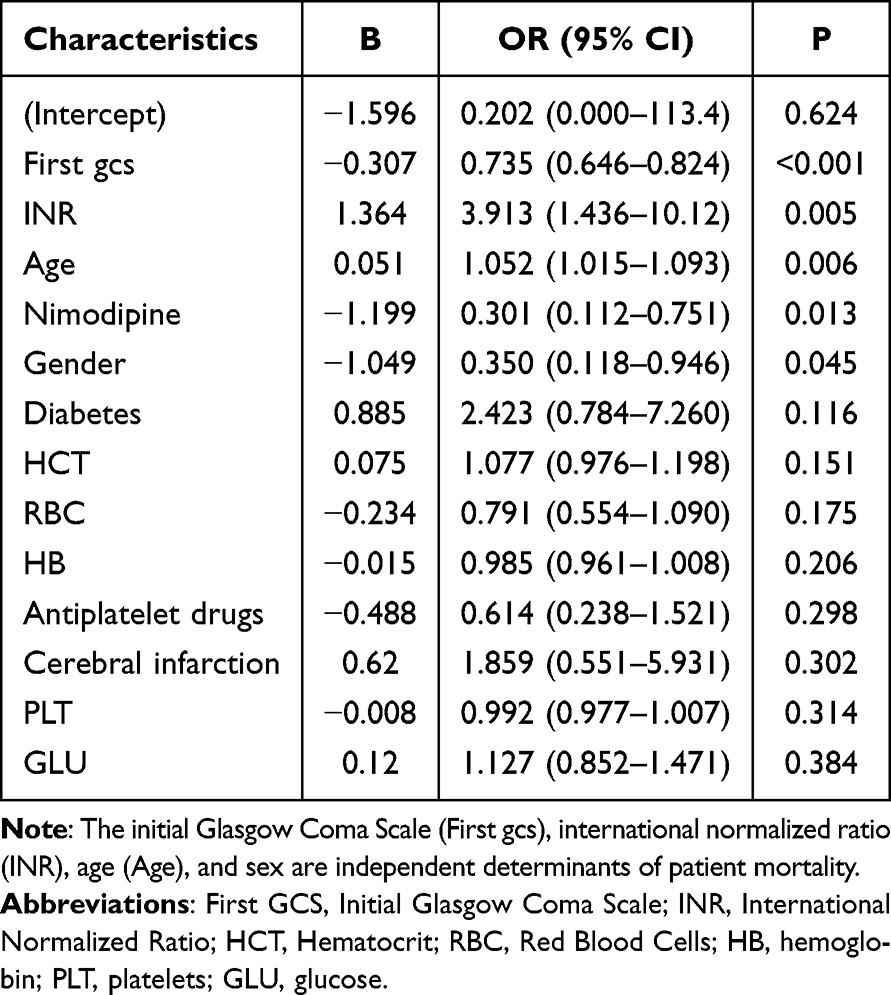 |
Table 3 Multivariable Logistic Regression Analysis |
Integrated Effect and Predictive Value of the INR_PLT
Age, sex, first gcs, and nimodipine administration were consistently identified in Tables 3 and 4 as significant determinants of patient outcomes, with congruent directions of effect. The analysis revealed that each one-unit increase in the INR_PLT was associated with a 142.5% increase in mortality risk (OR = 2.425, P = 0.001), establishing the INR_PLT as an independent prognostic risk factor for mortality. Notably, in the univariate analysis presented in Table 3, the INR had a significant effect on outcomes, whereas the PLT did not. However, upon integration into the composite variable INR_PLT in Table 4, the combined influence attained statistical significance. These findings underscore that amalgamating the INR and PLT into the INR_PLT more effectively elucidates their synergistic contribution to patient prognosis, thereby uncovering associations obscured in isolated analyses.
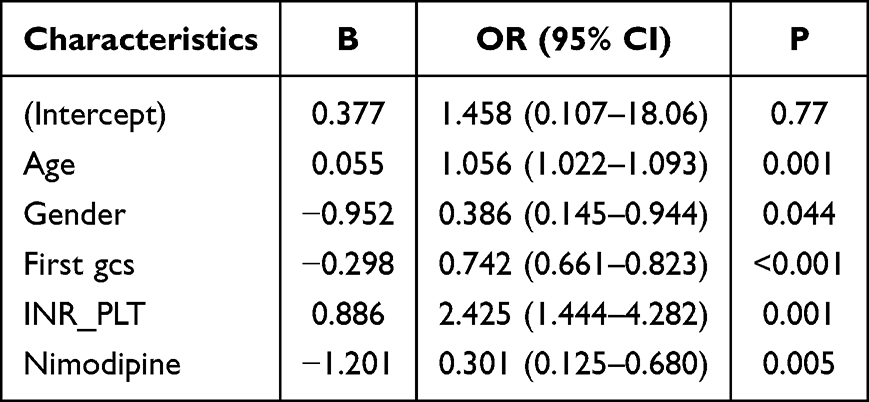 |
Table 4 Multivariable Logistic Regression Analysis on the INR_PLT |
Subgroup Specificity and Heterogeneity Analysis of the Effect of the INR_PLT
INR_PLT was significantly positively correlated with mortality risk in nontraumatic subarachnoid hemorrhage patients across both the training and validation cohorts, although the overall effect size (OR) was more pronounced in the training set (Figure 3). Importantly, this association demonstrated marked heterogeneity within certain subgroups: among patients who did not receive antiplatelet therapy, the impact of the INR_PLT on mortality was significantly amplified (interaction P < 0.001); similarly, in patients aged ≥57 years, this effect was also notably intensified (interaction P = 0.001). Further subgroup analyses revealed dataset-dependent sex differences—where male sex was significantly associated with outcomes in the Huizhou cohort but not in the MIMIC-IV cohort. Conversely, a history of cerebral infarction and antiplatelet drug use consistently modulated the relationship between the INR_PLT and mortality risk across both datasets. The influence patterns of nimodipine administration, diabetes mellitus, and age, however, varied between the cohorts. These cross-cohort heterogeneities likely reflect disparities in sample origin, size, comorbidity distributions, and therapeutic regimens, underscoring the need to integrate population-specific characteristics when evaluating the prognostic relevance of the INR_PLT and tailoring individualized clinical interventions.
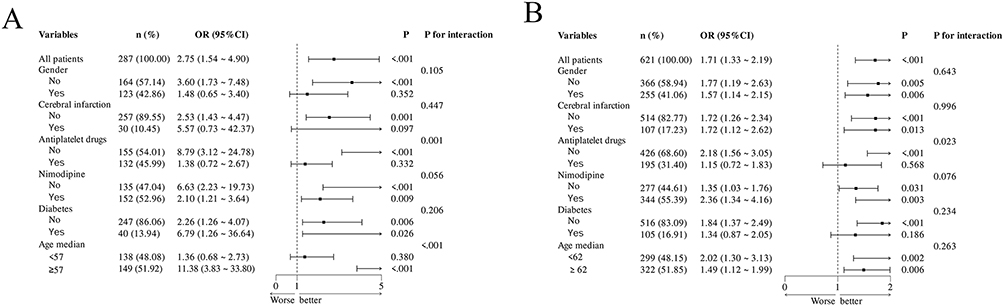 |
Figure 3 Forest Plot of Subgroup Analyses Forest plots of subgroup analyses. Subgroup analyses in the training cohort (A). Subgroup analyses in the validation cohort (B). |
Dual-Pathway Mechanism of Diabetes-Associated Mortality Risk Mediated by the INR_PLT
Path analysis (Table 5) revealed statistically significant associations between diabetes and the INR_PLT and between diabetes and mortality and between the INR_PLT and mortality (all paths P < 0.05). The standardized effect (SE) of diabetes on the INR_PLT was 0.107, indicating a modest positive influence, whereby diabetes contributes to elevated INR_PLT levels (β = 0.232), although the strength of this effect remains relatively limited. Further mechanistic exploration demonstrated that diabetes not only directly increased mortality risk (direct effect β = 1.130) but also indirectly influenced mortality risk via increased INR_PLT (β = 0.232). An elevated INR_PLT itself was strongly associated with a greater mortality risk (β = 0.966). These nonrandom associations are of practical significance, underscoring that in evaluating mortality risk among patients with ntSAH with diabetes, it is imperative to consider not only the direct impact of diabetes but also the mediating role of the INR_PLT as a potential intermediary variable. Mediation proportion = (0.232 × 0.966)/1.130 × 100% = 19.8%.
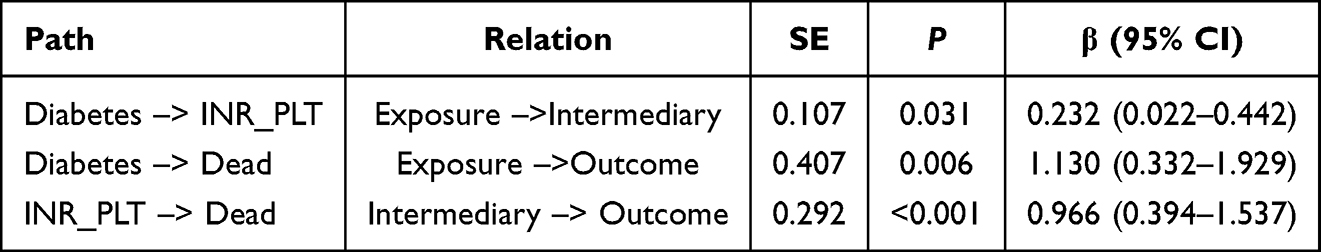 |
Table 5 Mediation Analysis Table |
Cross-Cohort Validation of Nonlinear Associations of Key Variables
In the training cohort (Figure 4), the first GCS, INR_PLT, and age were significantly associated with mortality risk (overall association P < 0.001), each of which exhibited a nonlinear relationship (nonlinear association P < 0.05). However, in the validation cohort (Figure 4), although the first GCS score remained significantly associated with mortality risk (overall association P < 0.05), its nonlinear relationship was no longer significant (nonlinear association P = 0.572).
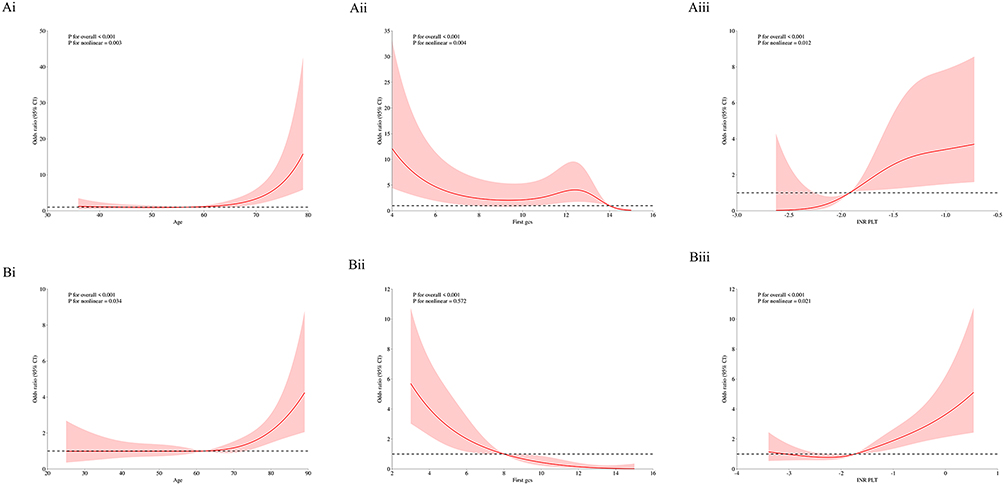 |
Figure 4 Restricted cubic spline (RCS) plots Restricted cubic spline (RCS) plots of key predictors and all-cause mortality. RCS plot of age and mortality in the training cohort (Ai). RCS plot of the first GCS score and mortality in the training cohort (Aii). RCS plot of the INR_PLT and mortality in the training cohort (Aiii). RCS plot of age and mortality in the validation cohort (Bi). RCS plot of the first GCS score and mortality in the validation cohort (Bii). RCS plot of the INR_PLT and mortality in the validation cohort (Biii). |
Robustness Validation of the Nonlinear Effects of Age and INR_PLT
Threshold analysis (Table 6) demonstrated that in both the training and validation cohorts, advanced age (overall trend P < 0.001) and elevated INR_PLT (overall trend P < 0.001) were significantly associated with increased mortality risk, whereas higher First GCS scores were significantly linked to reduced risk (overall trend P < 0.001). Both age and the INR_PLT exhibited robust nonlinear relationships, with segmented regression models offering superior fit. The age threshold in the training cohort was 61 years (<61 years: P = 0.743; ≥61 years: effect = 1.184, 95% CI: 1.091–1.284, P < 0.001), whereas in the validation cohort, the threshold was approximately 60.545 years (<60.545 years: P = 0.526; ≥60.545 years: P = 0.001). For the INR_PLT, the threshold in the training cohort was −2.457 (<−2.457: P = 1; ≥−2.457: P = 0.002), and in the validation cohort, it was −1.925 (<−1.925: P = 0.502; ≥−1.925: P < 0.001). In the threshold analysis, the GCS score was regarded as a continuous variable; thus, the first GCS demonstrated a threshold effect in the training cohort (threshold 13.783: <13.783 P = 0.016; ≥13.783 effect = 0.109; 95% CI: 0.012–0.960; P = 0.046), whereas no significant threshold effect was observed in the validation cohort, suggesting that the nonlinear model for the first GCS warrants cautious extrapolation. In summary, age, first GCS, and the INR_PLT emerged as key correlates of mortality risk, with the nonlinear patterns of age and the INR_PLT demonstrating greater cross-cohort stability.
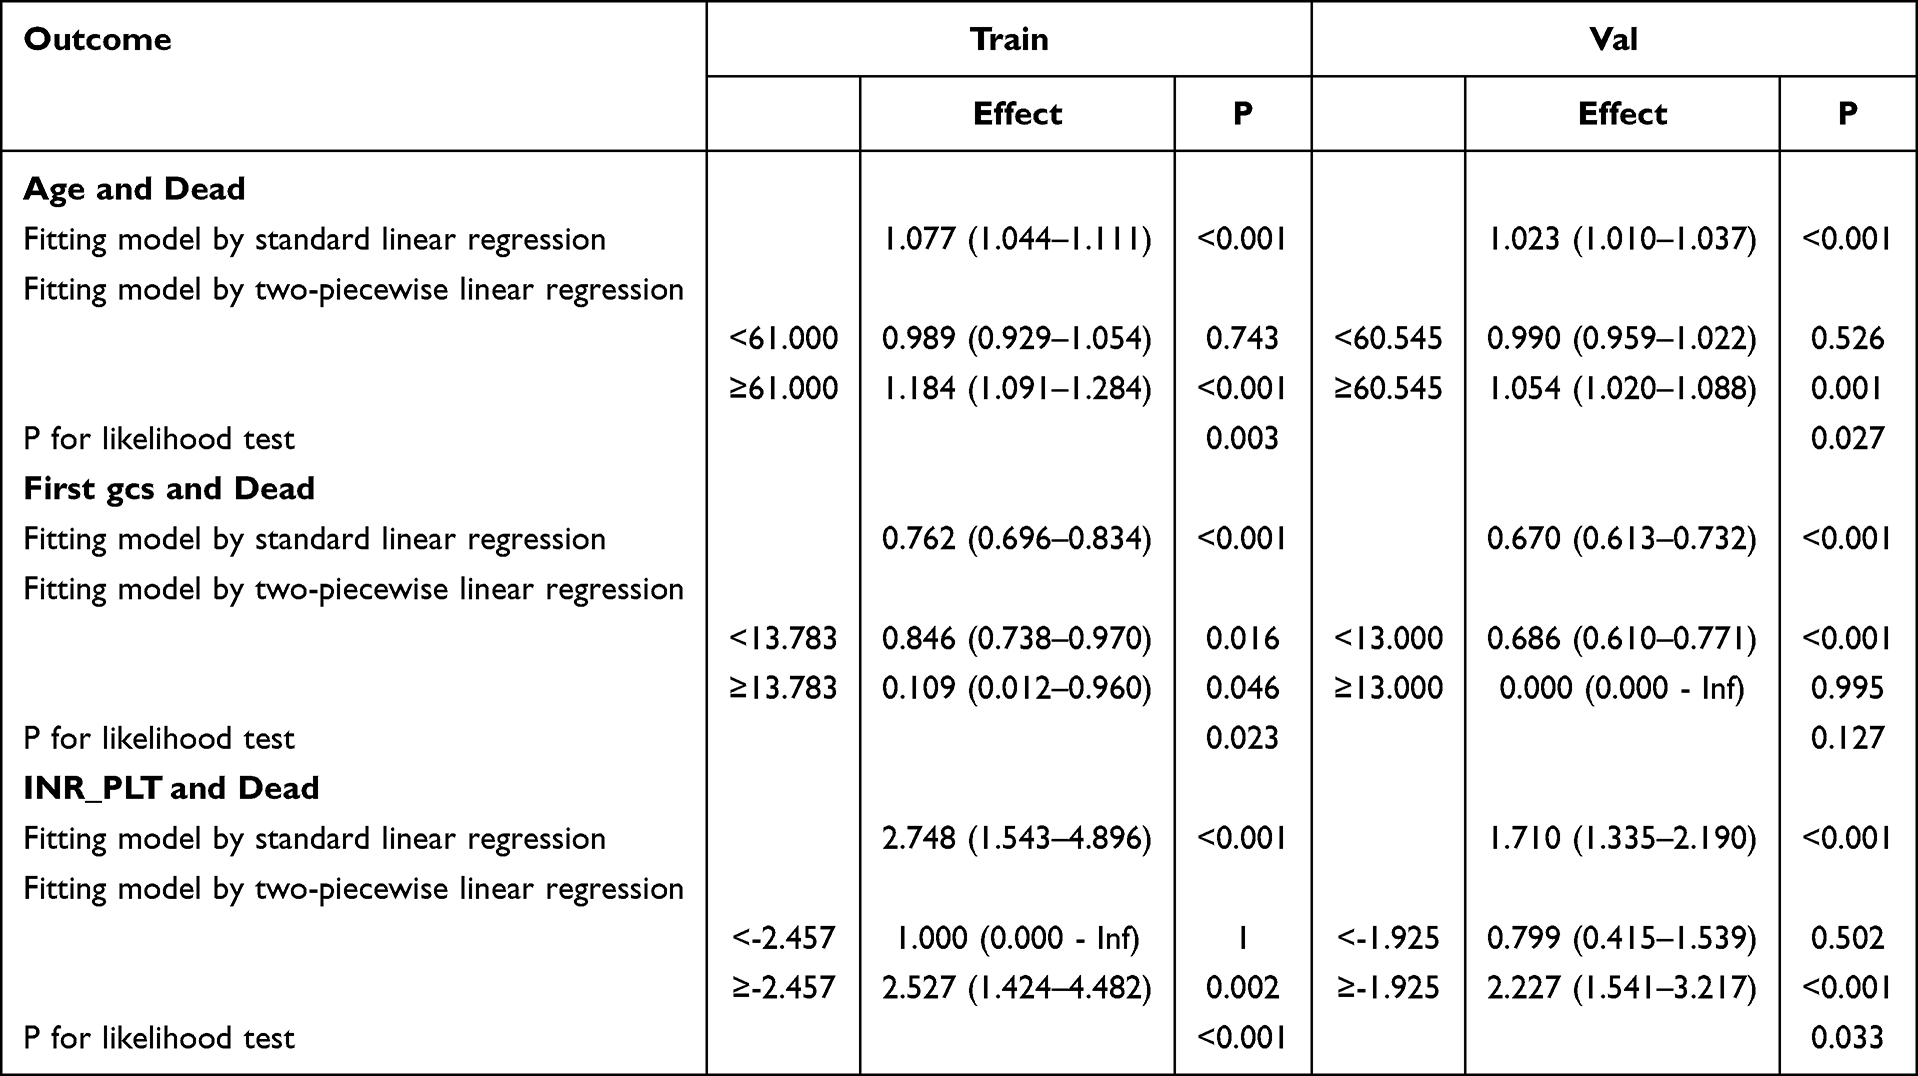 |
Table 6 Threshold Effect Analysis Table |
The threshold INR_PLT = −2.457 can be interpreted at the bedside using the boundary equation PLT ≈ 170.5 × INR + 107.6. For example, a patient with an INR of 1.3 and a platelet count of 150×109/L would have an INR_PLT ≈ −2.03, exceeding the threshold and indicating a transition from compensated to decompensated hemostatic disruption (OR = 2.527; P = 0.002).
Mortality Risk Prediction Nomogram Based on the INR_PLT
The nomogram (Figure 5) integrates multiple key prognostic variables—including sex, INR_PLT, nimodipine administration, age, and initial Glasgow Coma Scale (First gcs)—to construct a quantitative tool for predicting mortality risk in patients with nontraumatic subarachnoid hemorrhage. Each variable is assigned a corresponding score (for instance, female sex, higher INR_PLT values, absence of nimodipine use, advanced age, and lower first gcs scores typically yield higher point values and greater mortality risk). The cumulative score can then be mapped onto a scale to determine the predicted probability of death. For example, the sixth case yielded a total score of 206 points, corresponding to a predicted mortality probability of 43.9%, indicating a moderately elevated mortality risk. This model offers clinicians an intuitive framework for risk assessment, facilitating a more comprehensive evaluation of patient condition, the development of individualized therapeutic and nursing strategies, and providing a valuable quantitative reference for related clinical research.
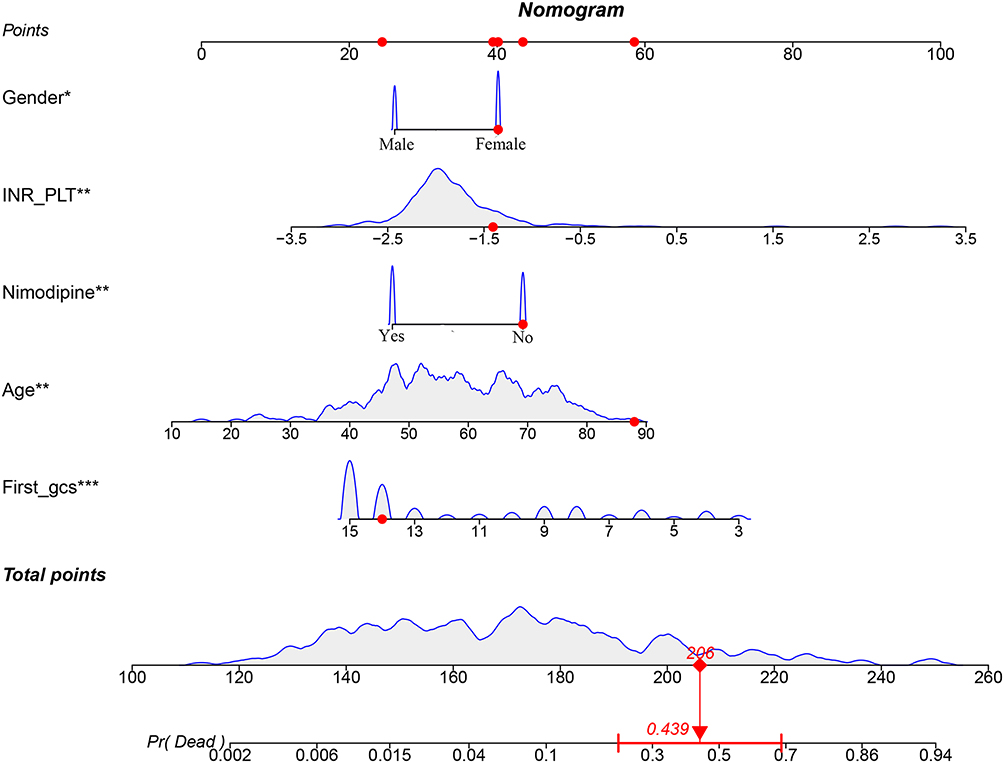 |
Figure 5 Example case nomogram. For each variable, the corresponding points are read from the top axis; the sum of these points is located on the “Total points” axis, and the predicted mortality probability (Pr(Dead)) is obtained by projection vertically to the bottom axis. The sixth case is shown as an example: the patient’s total score is 206 points, with a predicted mortality risk of 43.9%. Symbols indicate variable significance: *p < 0.05, **p < 0.01, ***p < 0.001. The red diamonds and arrows denote the total score and corresponding predicted mortality probability for the representative case, respectively. |
Validation of the Performance of the Nomogram Model
Combined analyses of the training and validation cohorts using ROC curves with 500-fold internal bootstrap resampling demonstrated that the discriminative capacity of the nomogram was satisfactory (training cohort AUC = 0.847; validation cohort AUC = 0.860). Calibration analysis (Hosmer-Lemeshow test P = 0.177) and decision curve analysis (DCA) further indicated that the nomogram model performed well in terms of predictive accuracy and clinical utility (Figure 6).
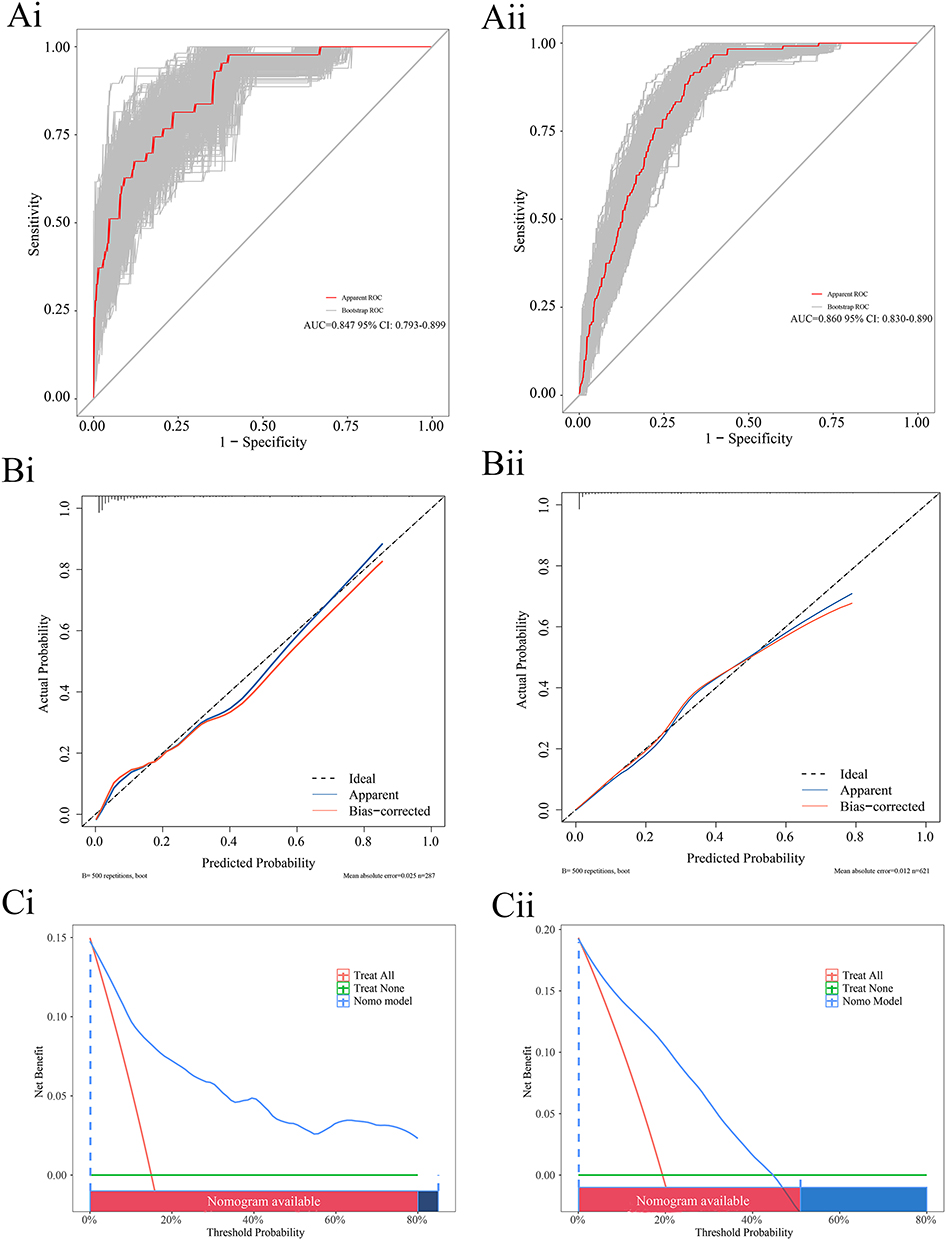 |
Figure 6 Nomogram model evaluation. Note: Figure 6. ROC curves, calibration curves, and decision curve analyses (DCIs) of the model. ROC curve with internal bootstrap resampling for the training cohort (Ai). ROC curve with internal bootstrap resampling for the testing cohort (Aii). Calibration curve for the training cohort (Bi). Calibration curve for the testing cohort (Bii). Decision curve analysis for the training cohort (Ci). Decision curve analysis for the validation cohort (Cii). |
Multimodel Predictive Performance and Robustness Validation
Across both the training and validation cohorts, the logistic regression (LR), support vector machine (SVM), and decision tree (DT) models consistently demonstrated strong predictive performance, with AUC values exceeding 0.8. In contrast, the Light Gradient Boosting Machine (LGBM) model exhibited relatively lower discrimination in the training cohort (AUC = 0.643) but showed a marked improvement in the validation cohort (AUC = 0.809). These findings indicate some heterogeneity in model performance across datasets; nonetheless, all the models displayed robust discriminative capabilities, confirming their effectiveness in distinguishing target outcomes (Figure 7).
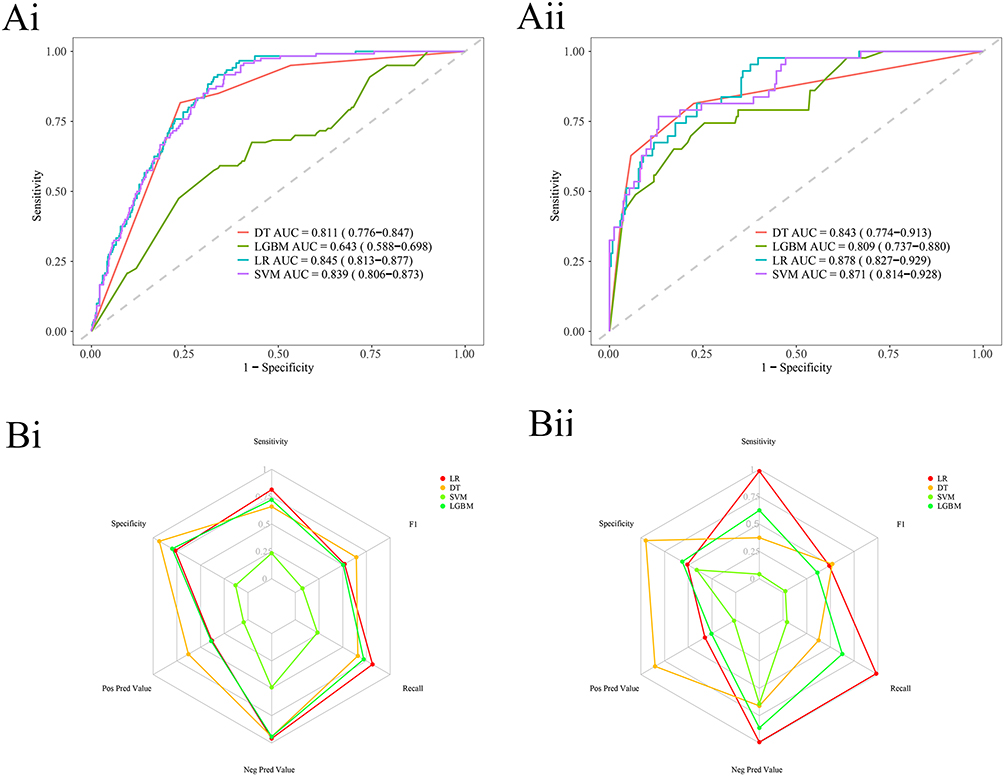 |
Figure 7 Machine learning ROC curves and radar plots. Note: Figure 7. Machine learning ROC curves and radar plots. ML ROC curve for the training cohort (Ai). Machine learning ROC curve for the testing cohort (Aii). Machine learning radar plot for the training cohort (Bi). Machine learning radar plot for the testing cohort (Bii). |
SHAP Analysis Reveals the Importance of Nimodipine Use and the INR_PLT
SHAP (SHapley Additive exPlanations) analysis revealed that nimodipine administration and the composite INR_PLT index were pivotal contributors to model predictions, indicating high feature importance (Figure 8).
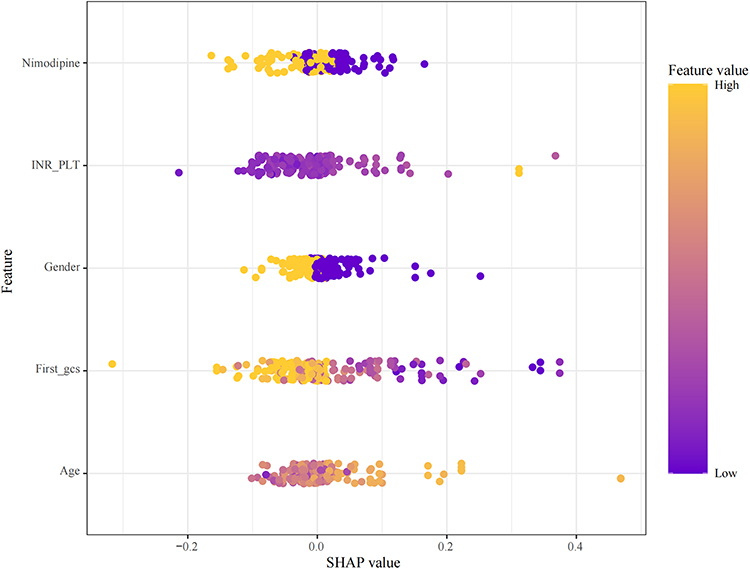 |
Figure 8 SHAP summary plot generated using the SVM method. Note: Features positioned higher on the plot indicate greater importance. |
Strong Negative Correlations Drive the Optimization of the Stacking Ensemble
Correlation analysis among the models revealed moderate positive correlations between the support vector machine (SVM) and decision tree (DT) and between the SVM and light gradient boosting machine (LGBM) (r = 0.64 and r = 0.68, respectively), indicating partial overlap in their predictive logic without full concordance. In contrast, a strong negative correlation was observed between DT and LGBM (r = −0.70), reflecting fundamentally opposing decision mechanisms—manifested as conflicting feature importance rankings or mutually exclusive sample predictions (Figure 9A). This correlation spectrum (which ranges from −1.0 to 1.0) provides a pivotal direction for optimizing stacking ensembles: positively correlated models (eg., SVM-DT) offer limited incremental value because of redundancy, whereas negatively correlated pairs (eg., DT-LGBM) substantially enhance generalizability by complementing each other’s feature representation space, thereby capturing complex sample patterns and improving robustness. The current ensemble framework (DT/SVM/LGBM) demonstrated synergistic efficacy, with an AUC of 0.8 (Figure 9B), and the confusion matrix further corroborated its robust performance (Figure 9C). Future efforts should prioritize the selection of strongly negatively correlated models and dynamically adjust their weights, integrating ROC threshold optimization to better suit the precision demands of clinical diagnostic applications.
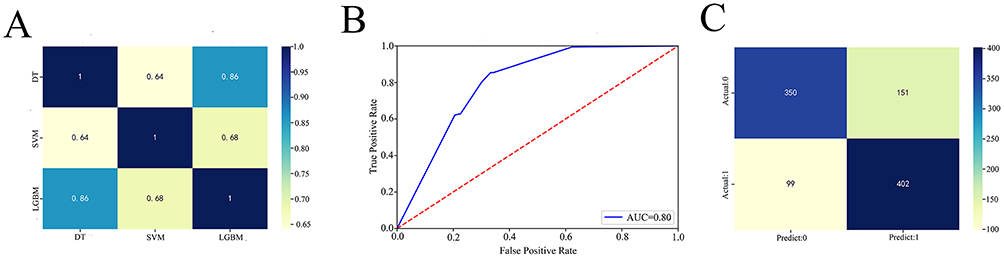 |
Figure 9 Stacking machine learning models. Note: Figure 9. Correlation matrix, ROC curve, and confusion matrix of the stacking ensemble model. Correlation matrix among machine learning models within the Stacking ensemble (A). ROC curve of the Stacking model (B). Prediction confusion matrix of the stacking model (C). |
Comparative Performance of Individual and Ensemble Machine Learning Models
Table 7 presents a comparative analysis of logistic regression (LR), decision tree (DT), support vector machine (SVM), and light gradient boosting machine (LGBM) as standalone models alongside the stacking ensemble model across training and validation cohorts, evaluating metrics such as precision, recall, accuracy, and F1 score. The findings revealed that among the individual models, the DT model exhibited relatively balanced performance in the training set but had poor generalizability during validation, characterized by high precision (0.850) but markedly low recall (0.375). LR demonstrated a tendency toward high recall (0.983 in validation) but at the expense of extremely low precision (0.324), indicating significant generalization bias. LGBM showed moderate training performance (recall 0.721, F1 0.504) but experienced pronounced degradation in validation (F1 decreased to 0.362), reflecting limited stability. The SVM performed poorly across both datasets, with F1 scores less than 0.08. All the individual models displayed notable performance declines upon validation, underscoring their limited generalizability. In contrast, the stacking ensemble model achieved comprehensive superiority, integrating the strengths of base learners to achieve balanced precision (0.727), recall (0.802), accuracy (0.751), and a robust F1 score (0.763). This enhancement significantly increased the discriminative power, accuracy, and stability of the classification, establishing the stacking model as the best and most reliable solution currently available.
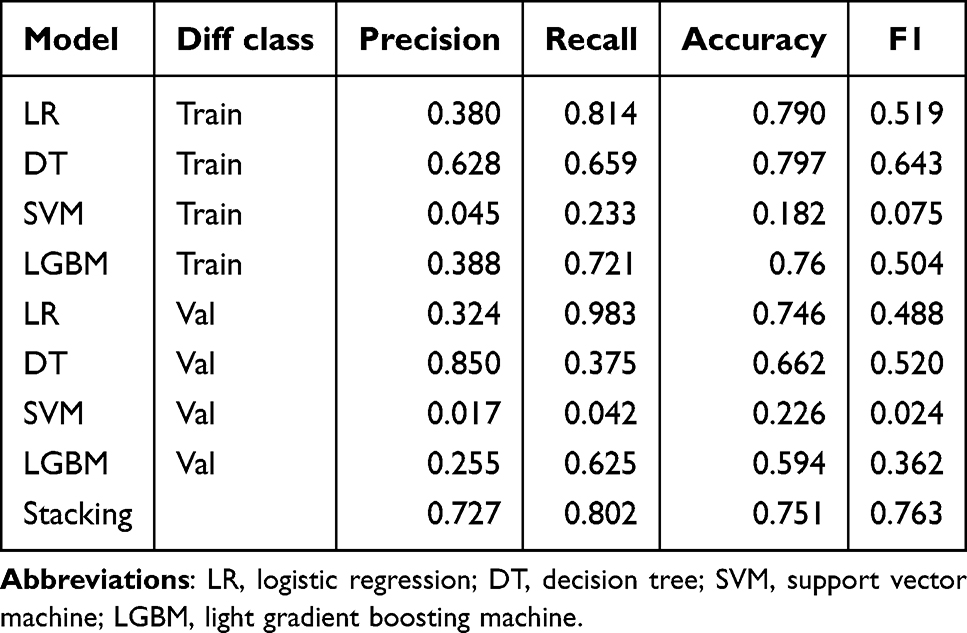 |
Table 7 Machine Learning Evaluation Metrics |
Discussion
In this multicenter retrospective study with external validation, we developed a composite coagulation-platelet index (INR_PLT), verified its independent association with in-hospital mortality in patients with ntSAH, and identified a clinically interpretable nonlinear threshold. We further provided complementary risk tools (nomograms and explainable stacking ensembles) to support early, individualized risk stratification without changing routine bedside workflows.
Clinical and Pathophysiological Significance of the INR_PLT
Coagulation-platelet dysregulation is closely linked to early brain injury, delayed ischemia and other complications after ntSAH.16–19 The INR reflects extrinsic coagulation function, whereas the platelet count reflects primary hemostasis. By integrating both dimensions, the INR_PLT captures hemostatic imbalance more comprehensively than either marker alone does and remains an independent predictor of mortality (per 1-unit increase in the OR = 2.425).
Mechanistically, hemorrhage-related tissue factor release may activate the extrinsic pathway, increase thrombin generation, and promote platelet activation via protease-activated receptors, amplifying local prothrombotic signaling.16–23 Ongoing consumption of platelets and coagulation factors can result in lower platelet counts and higher INRs, increasing the INR_PLT. Limited endogenous anticoagulant capacity and blood-brain barrier disruption may further couple hemostatic disturbance with neuroinflammation and microvascular injury.24–28 Consistent with a tipping-point pattern, the risk increased sharply above the INR_PLT of −2.457, suggesting a transition from compensated to decompensated hemostatic disruption.
Clinical Heterogeneity and Mechanism of the Prognostic Effect of the INR_PLT
Mediation analysis indicated that the INR_PLT accounted for 19.8% of diabetes-associated mortality risk. Diabetes-related endothelial injury and prothrombotic alterations (eg., platelet-leukocyte interactions and increased coagulation factor activity) may increase the INR_PLT and contribute to adverse outcomes.29,30 In addition, hyperglycemia may increase fibrinogen and coagulation factor activity, further supporting a prothrombotic milieu,31,32 and has been linked to neuronal injury after subarachnoid hemorrhage.33 This highlights a potentially actionable pathway for closer hemostatic monitoring in diabetic patients with ntSAH.
Subgroup analyses suggested clinically relevant heterogeneity. The prognostic effect of the INR_PLT was stronger in patients who did not receive antiplatelet therapy (interaction P < 0.001) and in older patients (≥57 years; interaction P = 0.001). Age-related endothelial dysfunction and reduced physiological reserve may increase vulnerability to hemostatic imbalance.34,35 These findings support the use of the INR_PLT for higher-resolution stratification, particularly in older patients and those who are not receiving antiplatelet agents.
Clinical Application Value of the INR_PLT-Based Prognostic Model
The nomogram integrating the INR_PLT with sex, nimodipine use, age, and initial GCS showed strong discrimination and calibration across cohorts (C-index 0.847/0.860), supporting rapid bedside estimation of mortality risk. The stacking ensemble provided a higher-balance classifier (AUC 0.80; F1 0.763) for settings where automated decision support is feasible.
SHAP analysis highlighted INR_PLT and nimodipine use as dominant contributors. Nimodipine remains a cornerstone therapy to reduce vasospasm-related complications, and its protective effect in our models aligns with that in established clinical practice.36,37 For patients with an INR_PLT ≥ −2.457, intensified monitoring of hemostasis and early correction of clinically significant coagulopathy may be considered within standard care pathways.
Research Advantages and Innovations
Key strengths include (1) a simple, bedside-computable composite index derived from routine labs; (2) explicit modeling of nonlinear/threshold effects to yield an actionable boundary; (3) a multicenter design with external validation to reduce overfitting; and (4) interpretable prediction using both traditional regression (nomogram) and explainable machine learning.
Limitations
This study has several limitations. First, its retrospective design may introduce selection and residual confounding. Second, the primary outcome was in-hospital mortality because postdischarge follow-up data were not available in the MIMIC-IV and were largely missing in the Huizhou cohort; although in-hospital mortality is a widely used endpoint in SAH research, we acknowledge that longer-term events may have been missed. Third, the MIMIC-IV is a general intensive‑care database that does not contain structured neuroimaging findings (eg., aneurysm characteristics, Fisher grade), detailed procedural variables, or certain neurological severity scores; the absence of these data is an inherent limitation of this resource and should be addressed in future studies with dedicated neuroimaging and clinical data collection. Fourth, only admission INRs and platelet counts were used, and dynamic INR_PLT trajectories were unavailable. Fifth, treatment practices and laboratory platforms may differ across centers, contributing to heterogeneity. Sixth, etiologic subtyping (aneurysmal vs non‑aneurysmal) was not performed. Finally, the training cohort sample size (n = 287) is modest for ensemble machine learning; however, we mitigated this through independent external validation, rigorous cross‑validation, and an ensemble design consistent with recent evidence supporting stacking with comparable neurosurgical sample sizes. Future work should incorporate longer‑term outcomes, richer neuroimaging and procedural data, and larger prospective multicenter cohorts.
Future Research Directions
Future prospective multicenter studies should incorporate richer neurological severity measures and broader coagulation panels, evaluate dynamic changes in the INR_PLT, and test whether INR_PLT-guided monitoring or correction strategies improve outcomes. Etiology-stratified analyses and user-friendly clinical tools (eg., calculators or electronic prompts) may further support translation.
Conclusion
In this multicenter study with external validation, we developed a novel coagulation-platelet index (INR_PLT) that independently predicts mortality in patients with ntSAH and demonstrates a reproducible nonlinear threshold pattern. The identified tipping point (−2.457) provides an objective, clinically interpretable boundary for early risk stratification. By integrating conventional regression, nomogram deployment, and explainable stacking ensemble learning, we offer complementary tools that balance bedside interpretability with predictive performance. The observed effect modification by age and antiplatelet therapy, together with partial mediation of diabetes-associated risk, highlights a potential link between systemic hemostasis and outcome and underscores the need for prospective studies to evaluate whether INR_PLT-guided monitoring and management can improve clinical outcomes.
Abbreviations
ntSAH, nontraumatic subarachnoid hemorrhage; INR_PLT, international normalized ratio and platelet count composite index; LASSO, least absolute shrinkage and selection operator; RCS, restricted cubic splines; ROC, receiver operating characteristic; AUC, area under the curve; CAL, calibration analysis; DCA, decision curve analysis; SVM, support vector machine; DT, decision tree; LGBM, light gradient boosting machine; SHAP, SHapley additive exPlanations; Stacking, stacked generalization; GCS, Glasgow Coma Scale; CL, chlorine; Ca, calcium; BUN, blood urea nitrogen; K, potassium; Na, sodium; Cr, creatinine; HB, hemoglobin; RBC, red blood cells; WBC, white blood cells; HCT, hematocrit; GLU, glucose; SBP, systolic blood pressure; DBP, diastolic blood pressure; INR, international normalized ratio; PLT, platelet count; DALYs, disability-adjusted life years; Hunt-Hess, Hunt and Hess scale; WFNS, World Federation of Neurosurgical Societies scale.
Data Sharing Statement
The data that support the findings of this study are available from two sources: Data from the MIMIC-IV38 database (version 3.1) are openly available in the PhysioNet repository at https://doi.org/10.13026/kpb9-mt58. Data from the Huizhou Central Hospital cohort are not publicly available because of privacy and ethical restrictions. These data are available from the corresponding author, Xinyu Yang, upon reasonable request.
Ethics Approval and Consent to Participate
The study protocol was approved by the Medical Ethics Committee of Huizhou Central Hospital (Approval No. ky112025105). Although approval was obtained after the initiation of data collection, this retrospective study involved no prospective interventions and utilized only anonymized clinical data collected during routine care; therefore, the requirement for informed consent was waived. MIMIC-IV is a widely recognized, publicly accessible database, with data deidentified to exempt the requirement for informed consent. The study was conducted in accordance with the ethical principles outlined in the Declaration of Helsinki.
Acknowledgments
This study was conducted and reported in accordance with the RECORD statement. This paper has been uploaded to Research Square as a preprint: https://www.researchsquare.com/article/rs-7215846/v1.
Author Contributions
All the authors made a significant contribution to the work reported, whether it is in the conception, study design, execution, acquisition of data, analysis and interpretation, or in all these areas; took part in drafting, revising or critically reviewing the article; gave final approval of the version to be published; agreed on the journal to which the article has been submitted; and agree to be accountable for all aspects of the work.
Funding
This research received no specific grant from any funding agency in the public, commercial, or not-for-profit sectors.
Disclosure
The authors declare that the research was conducted in the absence of any commercial or financial relationships that could be construed as potential conflicts of interest.
References
1. Huang YW, Zhang Y, Li ZP, Yin XS. Association between a four-parameter inflammatory index and all-cause mortality in critically ill patients with non-traumatic subarachnoid hemorrhage: a retrospective analysis of the MIMIC-IV database (2012–2019). Front Immunol. 2023;14:1235266. doi:10.3389/fimmu.2023.1235266
2. Rautalin I, Volovici V, Stark BA, et al. Global, regional, and national burden of nontraumatic subarachnoid hemorrhage: the Global Burden of Disease Study 2021. JAMA Neurol. 2025;82:765–19. doi:10.1001/jamaneurol.2025.1522
3. Wu R, Hu F, Liu C, Liang J. The value of modified Hijdra score in patients with aneurysmal subarachnoid hemorrhage. Heliyon. 2024;10(7):e28550. doi:10.1016/j.heliyon.2024.e28550
4. Lv B, Lan JX, Si YF, et al. Epidemiological trends of subarachnoid hemorrhage at global, regional, and national level: a trend analysis study from 1990 to 2021. Mil Med Res. 2024;11(1):46. doi:10.1186/s40779-024-00551-6
5. Gu L, Zhou J, Zhang L, et al. Global, regional, and national burden of subarachnoid hemorrhage: trends from 1990 to 2021 and 20-year forecasts. Stroke. 2025;56(4):887–897. doi:10.1161/STROKEAHA.124.048950
6. van Lieshout JH, Mijderwijk H-J, Nieboer HJ, et al. Development and internal validation of the ARISE prediction models for rebleeding after aneurysmal subarachnoid hemorrhage. Neurosurgery. 2022;91(3):450–458. doi:10.1227/neu.0000000000002045
7. Song M, Wang S, Qian Q, et al. Intracranial aneurysm CTA images and 3D models dataset with clinical morphological and hemodynamic data. Sci Data. 2024;11(1):1213. doi:10.1038/s41597-024-04056-8
8. He Y, Shiu YT, Imrey PB, et al. Association of shear stress with subsequent lumen remodeling in hemodialysis arteriovenous fistulas. Clin J Am Soc Nephrol. 2023;18(1):72–83. doi:10.2215/CJN.04630422
9. Malik K, Alam F, Santamaria J, Krishnamurthy M, Malik G. Toward grading subarachnoid hemorrhage risk prediction: a machine learning-based aneurysm rupture score. World Neurosurg. 2023;172:e19–e38. doi:10.1016/j.wneu.2022.11.065
10. Ali M, van Eldik MJA, Rietkerken S, et al. Risk factors of aneurysmal subarachnoid hemorrhage including analysis by sex: a systematic review and meta-analysis. Neurology. 2025;104(8):e213511. doi:10.1212/WNL.0000000000213511
11. Savarraj JPJ, Hergenroeder GW, Zhu L, et al. Machine learning to predict delayed cerebral ischemia and outcomes in subarachnoid hemorrhage. Neurology. 2021;96(4):e553–e562. doi:10.1212/WNL.0000000000011211
12. Sebök M, Hostettler IC, Keller E, et al. Prehemorrhage antiplatelet use in aneurysmal subarachnoid hemorrhage and impact on clinical outcome. Int J Stroke. 2022;17(5):545–552. doi:10.1177/17474930211035647
13. Raatikainen E, Kiiski H, Kuitunen A, et al. Increased blood coagulation is associated with poor neurological outcome in aneurysmal subarachnoid hemorrhage. J Neurol Sci. 2024;458:122943. doi:10.1016/j.jns.2024.122943
14. Joos GS, Gottschalk A, Ewelt C, et al. Risk factors associated with vasospasm after non-traumatic subarachnoid hemorrhage: a retrospective analysis of 456 patients. J Neurosurg Sci. 2023;67(5):576–584. doi:10.23736/S0390-5616.22.05497-2
15. Parekh A, Satish S, Dulhanty L, Berzuini C, Patel H. Clinical prediction models for aneurysmal subarachnoid hemorrhage: a systematic review update. J Neurointerv Surg. 2023. doi:10.1136/jnis-2023-021107
16. Fang Y, Liu Y, Chen L, et al. Cerebrospinal fluid markers of neuroinflammation and coagulation in severe cerebral edema and chronic hydrocephalus after subarachnoid hemorrhage: a prospective study. J Neuroinflammation. 2024;21(1):237. doi:10.1186/s12974-024-03236-y
17. Qian Y, Wang J, Chen J, et al. Multifaceted role of thrombin in subarachnoid hemorrhage: focusing on cerebrospinal fluid circulation disorder. Exp Neurol. 2025;383:115036. doi:10.1016/j.expneurol.2024.115036
18. Fang Y, Wang X, Lu J, et al. Inhibition of caspase-1-mediated inflammasome activation reduced blood coagulation in cerebrospinal fluid after subarachnoid haemorrhage. EBioMedicine. 2022;76:103843. doi:10.1016/j.ebiom.2022.103843
19. Aleksandrowicz K, Hempel D, Politynska B, et al. The complex role of thrombin in cancer and metastasis: focus on interactions with the immune system. Semin Thromb Hemost. 2024;50(3):462–473. doi:10.1055/s-0043-1776875
20. Sone A, Aki K, Yasui T, Hosoi E. Inhibitory effects of aspirin and cilostazol on intracellular Ca2+ mobilization and aggregation in thrombin-activated human platelets. J Med Invest. 2023;70(1–2):94–100. doi:10.2152/jmi.70.94
21. Navarro S, Stegner D, Nieswandt B, Heemskerk JWM, Kuijpers MJE. Temporal roles of platelet and coagulation pathways in collagen- and tissue factor-induced thrombus formation. Int J Mol Sci. 2021;23(1):358. doi:10.3390/ijms23010358
22. Geraldini F, De Cassai A, Correale C, et al. Predictors of deep-vein thrombosis in subarachnoid hemorrhage: a retrospective analysis. Acta Neurochir. 2020;162(9):2295–2301. doi:10.1007/s00701-020-04455-x
23. Menon N, Journeycake J, Huang R, Riley P, Zia A. Thrombin generation in children with sickle cell anemia is higher in the presence of platelets. Transfus Apher Sci. 2020;59(5):102852. doi:10.1016/j.transci.2020.102852
24. ElSaadani M, Ahmed SM, Jacovides C, et al. Antithrombin III ameliorates post-traumatic brain injury cerebral leukocyte mobilization enhancing recovery of blood-brain barrier integrity. J Trauma Acute Care Surg. 2021;90(2):274–280. doi:10.1097/TA.0000000000003000
25. Dean T, Mendiola AS, Yan Z, et al. Fibrin promotes oxidative stress and neuronal loss in traumatic brain injury via innate immune activation. J Neuroinflammation. 2024;21(1):94. doi:10.1186/s12974-024-03092-w
26. Chen Y, Han L, Zhu DS, Guan YT. Fibrinogen and neuroinflammation in the neurovascular unit in stroke. J Inflamm Res. 2025;18:4567–4584. doi:10.2147/JIR.S496433
27. Robert SM, Reeves BC, Kiziltug E, et al. The choroid plexus links innate immunity to CSF dysregulation in hydrocephalus. Cell. 2023;186(4):764–785.e21. doi:10.1016/j.cell.2023.01.017
28. Lohmeier J, Silva RV, Tietze A, et al. Fibrin-targeting molecular MRI in inflammatory CNS disorders. Eur J Nucl Med Mol Imaging. 2022;49(11):3692–3704. doi:10.1007/s00259-022-05807-8
29. V M, Wang K. Dietary natural products as a potential inhibitor towards advanced glycation end products and hyperglycemic complications: a phytotherapy approach. Biomed Pharmacother. 2021;144:112336. doi:10.1016/j.biopha.2021.112336
30. Wang B, Jiang T, Qi Y, et al. AGE-RAGE axis and cardiovascular diseases: pathophysiologic mechanisms and prospects for clinical applications. Cardiovasc Drugs Ther. 2024.
31. Han J, van Hylckama Vlieg A, de Mutsert R, et al. Associations of coagulation parameters and thrombin generation potential with the incidence of type 2 diabetes: mediating role of glycoprotein acetylation. Eur J Epidemiol. 2024;39(10):1171–1181. doi:10.1007/s10654-024-01162-0
32. Gromotowicz-Poplawska A, Szoka P, Zakrzeska A, et al. Hyperglycemia potentiates prothrombotic effect of aldosterone in a rat arterial thrombosis model. Cells. 2021;10(2):471. doi:10.3390/cells10020471
33. Huang YH, Chung CL, Tsai HP, et al. Impact of hyperglycemia on neuronal apoptosis after subarachnoid hemorrhage in rodent brain: an experimental research. Int J Surg. 2020;83:246–252. doi:10.1016/j.ijsu.2020.07.009
34. Oddo M, Taccone FS, Petrosino M, et al. The neurological pupil index for outcome prognostication in people with acute brain injury (Orange): a prospective, observational, multicentre cohort study. Lancet Neurol. 2023;22(10):925–933. doi:10.1016/S1474-4422(23)00271-5
35. Wang Y, Wang J, Chen S, et al. Different changing patterns for stroke subtype mortality attributable to high sodium intake in China during 1990 to 2019. Stroke. 2023;54(4):1078–1087. doi:10.1161/STROKEAHA.122.040848
36. Sonneville R, Mazighi M, Collet M, et al. One-year outcomes in patients with acute stroke requiring mechanical ventilation. Stroke. 2023;54(9):2328–2337. doi:10.1161/STROKEAHA.123.042910
37. Morotti A, Li Q, Nawabi J, et al. Volume tolerance and prognostic impact of hematoma expansion in deep and lobar intracerebral hemorrhage. Stroke. 2025;56(5):1224–1231. doi:10.1161/STROKEAHA.124.049008
38. Johnson AEW, Bulgarelli L, Shen L, et al. MIMIC-IV, a freely accessible electronic health record dataset. Sci Data. 2023;10(1):1. doi:10.1038/s41597-022-01899-x
 © 2026 The Author(s). This work is published and licensed by Dove Medical Press Limited. The
full terms of this license are available at https://www.dovepress.com/terms
and incorporate the Creative Commons Attribution
- Non Commercial (unported, 4.0) License.
By accessing the work you hereby accept the Terms. Non-commercial uses of the work are permitted
without any further permission from Dove Medical Press Limited, provided the work is properly
attributed. For permission for commercial use of this work, please see paragraphs 4.2 and 5 of our Terms.
© 2026 The Author(s). This work is published and licensed by Dove Medical Press Limited. The
full terms of this license are available at https://www.dovepress.com/terms
and incorporate the Creative Commons Attribution
- Non Commercial (unported, 4.0) License.
By accessing the work you hereby accept the Terms. Non-commercial uses of the work are permitted
without any further permission from Dove Medical Press Limited, provided the work is properly
attributed. For permission for commercial use of this work, please see paragraphs 4.2 and 5 of our Terms.
Recommended articles
Thrombo-Inflammatory Prognostic Scores Improve BISAP-Based Risk Stratification in Acute Pancreatitis Patients: A Retrospective Cohort Study
Han T, Cheng T, Liao Y, Lai Q, Tang S, Liu B, He Y, Lei C, Cao Y, Cao Y
Journal of Inflammation Research 2022, 15:3323-3335
Published Date: 4 June 2022
A Machine Learning Model Based on Health Records for Predicting Recurrence After Microwave Ablation of Hepatocellular Carcinoma
An C, Yang H, Yu X, Han Z, Cheng Z, Liu F, Dou J, Li B, Li Y, Li Y, Yu J, Liang P
Journal of Hepatocellular Carcinoma 2022, 9:671-684
Published Date: 28 July 2022
A Novel Biomarker Scoring System Alone or in Combination with the GRACE Score for the Prognostic Assessment in Non-ST-Elevation Myocardial Infarction
Yao Y, Shao C, Li X, Wang Z, Zuo C, Yan Y, Lv Q
Clinical Epidemiology 2022, 14:911-923
Published Date: 2 August 2022
RuleFit-Based Nomogram Using Inflammatory Indicators for Predicting Survival in Nasopharyngeal Carcinoma, a Bi-Center Study
Luo C, Li S, Zhao Q, Ou Q, Huang W, Ruan G, Liang S, Liu L, Zhang Y, Li H
Journal of Inflammation Research 2022, 15:4803-4815
Published Date: 24 August 2022
Prognosis and Personalized Treatment Prediction in Different Mutation-Signature Hepatocellular Carcinoma
Zhang Y, Liu Z, Li J, Li X, Duo M, Weng S, Lv P, Jiang G, Wang C, Li Y, Liu S, Li Z
Journal of Hepatocellular Carcinoma 2023, 10:241-255
Published Date: 15 February 2023