
Back to Journals » Diabetes, Metabolic Syndrome and Obesity » Volume 18
Uric Acid Metabolism and Its Relationship with Glucose and Lipid Metabolism in Overweight and Obese Children and Adolescents: A Cross-Sectional Study in South China
Authors Tang B, Li Y, Lin J, Zhu Y, Chen D, Mou Y, Zhu S
Received 25 March 2025
Accepted for publication 28 July 2025
Published 9 August 2025 Volume 2025:18 Pages 2797—2806
DOI https://doi.org/10.2147/DMSO.S527026
Checked for plagiarism Yes
Review by Single anonymous peer review
Peer reviewer comments 2
Editor who approved publication: Dr Pablo Corral
Benyu Tang,* Yinya Li,* Juan Lin,* Yuxing Zhu, Danchun Chen, Yikun Mou, Shunye Zhu
Children’s Medical Center, The Third Affiliated Hospital of Sun Yat-Sen University, Guangzhou, Guangdong, 510630, People’s Republic of China
*These authors contributed equally to this work
Correspondence: Shunye Zhu, Children’s Medical Center, The Third Affiliated Hospital of Sun Yat-Sen University, 600 Tianhe Road, Tianhe District, Guangzhou, Guangdong, 510630, People’s Republic of China, Email [email protected] Yikun Mou, Children’s Medical Center, The Third Affiliated Hospital of Sun Yat-Sen University, 600 Tianhe Road, Tianhe District, Guangzhou, Guangdong, 510630, People’s Republic of China, Email [email protected]
Background: Overweight and obesity in children and adolescents have emerged as significant public health issues in China. This study aims to analyze the characteristics of serum uric acid (SUA) metabolism in overweight and obese children and adolescents in South China, exploring its associations with metabolic parameters.
Methods: A single-center retrospective study was conducted, involving children and adolescents aged 3 to 18 years diagnosed with overweight and obesity. Spearman correlation coefficients were calculated to evaluate relationships between SUA and other metabolic parameters. Multivariate linear regression analyses were conducted to adjust for confounders. Comparisons were made between participants with hyperuricemia and those with normal SUA levels, and logistic regression analyses were conducted to adjust for confounders. Hierarchical clustering was performed to explore the relationships among the parameters. A dendrogram was generated to visualize the cluster structure.
Results: Among 172 participants (96 males, 76 females), the mean age was 10.88± 2.70 years. The prevalence of hyperuricemia was 36.30%, with 38.46% in males and 33.82% in females. Every 1 kg/m² increase in body mass index was associated with a 7.156 μmol/L increase in SUA and an 8.9% increase in hyperuricemia risk. Significant correlations were observed between SUA levels and insulin resistance (HOMA-IR), fasting insulin, and high-density lipoprotein cholesterol. Hierarchical clustering analysis revealed two distinct clusters. One cluster includes SUA along with insulin resistance and lipid metabolism parameters, while the other comprises obesity metrics, urinary microalbumin, and blood glucose.
Conclusion: The findings show a high prevalence of hyperuricemia in overweight and obese children and adolescents, linked to insulin resistance and dyslipidemia. These results highlight the need for early screening and targeted interventions to improve metabolic health outcomes in this vulnerable population.
Keywords: pediatric obesity, uric acid, hyperuricemia, blood glucose, lipid metabolism, cluster analysis
Introduction
In recent decades, the global rate of childhood obesity has been steadily increasing. Obesity has become an increasingly important global health epidemic for children and adolescents. In 2015, 107.7 million children worldwide were suffering from obesity, with a global prevalence of 5.0%.1 Among the 20 most populous countries, the highest rate of childhood obesity was in the United States at 12.7%, while China and India had the highest number of children with obesity.2 In China, the prevalence of overweight and obesity among children and adolescents aged 6–17 years was 11.1% and 7.9%, respectively, and 6.8% and 3.6% for children under 6 years of age,3 which means that one in five children is overweight or obese. In recent years, the rates of overweight and obesity among children have shown an increasing trend.4 Obesity not only brings psychological pressure and inconvenience to children’s lives, but is also accompanied by hyperuricemia, dyslipidemia, hyperglycemia or insulin resistance, and persistent hypertension, which have severe effects on various body systems, such as obesity-related glomerulopathy, gout and kidney stones caused by hyperuricemia, chronic kidney disease, and renal failure.5
While hyperuricemia has traditionally been regarded as a laboratory abnormality with limited diagnostic value, recent studies have illuminated its associations with serious health complications, prompting a reevaluation of its clinical significance in pediatric populations.6 Serum uric acid (SUA) levels typically increase with age, with notable differences emerging between sexes around the onset of puberty.7 The incidence of hyperuricemia in children increases with age, mainly due to obesity and diet, and the prevalence of hyperuricemia in children with obesity is higher than in children of normal weight.8–10 The etiology of hyperuricemia in children is multifaceted, encompassing both chronic and acute conditions. Chronic conditions such as obesity, metabolic syndrome, and genetic disorders are significant contributors. Obesity, in particular, has emerged as a major risk factor for hyperuricemia,9 with studies indicating a strong correlation between elevated SUA levels and components of metabolic syndrome, including insulin resistance and dyslipidemia.11,12 Furthermore, hyperuricemia has been associated with increased risk factors for cardiovascular diseases,13 underscoring the need for early detection and intervention.
Despite the increasing recognition of hyperuricemia as a significant health issue in children and adolescents, evidence gaps remain regarding its mechanisms and associations with metabolic disorders. While existing studies have established links between hyperuricemia, obesity, and components of metabolic syndrome, there is limited research focusing on the clinical features and metabolic characteristics of hyperuricemia specifically in pediatric populations. Additionally, the complexities of how uric acid metabolism interacts with different physiological parameters in overweight and obese children remain poorly understood. Therefore, the objective of this study is to analyze the characteristics of uric acid metabolism in overweight and obese children and adolescents in South China, examining its associations with metabolic parameters, including insulin resistance and dyslipidemia.
Materials and Methods
Study Design and Population
This is a cross-sectional study conducted in China. The study population consists of all children and adolescents with overweight and obesity who visited the outpatient clinic and were hospitalized for treatment at the Third Affiliated Hospital of Sun Yat-sen University between April 2022 and March 2023.
The inclusion criteria for this clinical study were as follows: (1) participants must be aged between 3 and 18 years (≥3 years and <18 years); (2) they must meet the criteria for overweight or obesity; and (3) they must fulfill the clinical diagnostic criteria for simple obesity. Overweight and obesity were defined according to local guidelines.14 The sex- and age-specific BMI reference cut-off points for overweight and obesity were based on studies and reference standards in China for children aged 3 to 5 years15 and for those aged 6 to 18 years,16 respectively. Simple obesity was diagnosed based on the following criteria: (1) a history of excessive or rapid weight gain; (2) excessive energy intake and insufficient energy expenditure due to unhealthy lifestyle habits; (3) a medical history excluding obesity caused by cranial trauma, cranial surgery, central nervous system infections, central nervous system inflammation, or central nervous system degeneration; (4) a medical history excluding obesity related to antiepileptic drugs, antipsychotic drugs, or corticosteroid medications; and (5) laboratory tests and examinations ruling out organic lesions. The exclusion criteria for this study include secondary overweight and obesity resulting from factors such as medication use, endocrine disorders, hypothalamic-pituitary disorders, and genetic syndromes. Additionally, individuals who have received urate-lowering therapy for hyperuricemia will also be excluded from the study.
This study was approved by the Ethics Committee of the Third Affiliated Hospital of Sun Yat-Sen University (II2023-197-01). As it utilized previously collected clinical data, there was no requirement for direct interaction with participants, and the study did not impact their clinical care. The requirement for informed consent was waived due to the use of anonymized data, which does not involve patient privacy. We ensured that the data was strictly de-identified to maintain confidentiality. This study was conducted in accordance with the principles outlined in the Declaration of Helsinki.
Data Collection
Data were retrospectively collected from the hospital’s electronic medical record system, including age, sex, weight, height, waist circumference, blood pressure, Tanner stage, SUA, urinary microalbumin, blood glucose, insulin, C-peptide, low-density lipoprotein (LDL-C), high-density lipoprotein (HDL-C), follicle-stimulating hormone (FSH), luteinizing hormone (LH), estradiol (E2), testosterone (T), dehydroepiandrosterone sulfate (DHEA), and bone age (BA).
Height, weight, waist circumference, and blood pressure were measured in the morning while the participants were in a fasting state. Height measurements were taken without shoes, weight was recorded without clothing and shoes, and waist circumference was measured without clothing.
Blood samples were obtained from the antecubital vein following an overnight fast of at least 8 hours and were subsequently analyzed in the hospital’s clinical laboratory. Blood glucose levels were measured using the glucose oxidase method. Insulin and C-peptide were assessed via the direct chemiluminescence method. SUA levels were determined using the uricase method. HDL-C and LDL-C were measured using the direct method. LH, FSH, E2, and T were analyzed through the chemiluminescent microparticle immunoassay method. Urinary microalbumin was measured using the immunoturbidimetric method.
Calculations were performed as follows: BMI (kg/m2) = weight (kg) / height (m)2. Waist-height ratio (WHtR) = waist circumference (cm) / height (cm). Difference between bone age and chronological age (ΔBA-CA, years) = bone age (years) - chronological age (years). Homeostasis model assessment of insulin resistance (HOMA-IR) = fasting blood glucose (FPG, mmol/L) × fasting insulin (Fins, μU/mL) / 22.5. Homeostasis model assessment of β-cell function (HOMA-β) = 20 × Fins (μU/mL) / (FPG [mmol/L] - 3.5).
Based on the literature,17 SUA levels were relatively stable in boys aged 3–9, 10–14, and 15–18 years, as well as in girls aged 3–8, 9–14, and 15–18 years. These age groups correspond to the prepubertal, pubertal, and post-pubertal stages in Chinese boys and girls. Therefore, age stratification was performed according to these classifications. In this study, hyperuricemia was defined as SUA levels exceeding the reference values for the corresponding sex and age group: 405.7 µmol/L for boys aged 3–9 years, 519.1 µmol/L for boys aged 10–14 years, 530.1 µmol/L for boys aged 15–18 years, 403.6 µmol/L for girls aged 3–8 years, 417.6 µmol/L for girls aged 9–14 years, and 439 µmol/L for girls aged 15–18 years.17
Statistical Analysis
All statistical analyses were performed using the R software (version 4.1.2). The normality of continuous variables was assessed using QQ plots and density plots. Variables conforming to a normal distribution were presented as mean ± SD and compared using Welch Two Sample t-test. For variables that did not conform to a normal distribution, data were expressed as median (interquartile range [IQR]), and comparisons were performed using the Wilcoxon rank sum test. Categorical variables were presented as counts (%) and compared using Pearson’s Chi-squared test or Fisher’s exact test as appropriate. Sex and age variables had no missing data, while analyses for other variables were conducted based on available data without imputing missing values. All statistical tests were two-sided, and statistical significance was established at P < 0.05.
Spearman correlation coefficients were calculated to evaluate the relationships between SUA and other physiological parameters. Multivariate linear regression analyses were conducted to assess the associations after adjusting for confounding factors of sex and age, taking into account interactions with sex. Regression coefficients for the physiological parameters and their corresponding 95% confidence intervals (CIs) were reported. Additionally, multivariate logistic regression analyses were performed to evaluate the association between hyperuricemia and other physiological parameters, also adjusting for confounding factors of sex and age, taking into account interactions with sex. Odds ratios (ORs) for the physiological parameters and their corresponding 95% CIs were reported. Multicollinearity among the independent variables was assessed using variance inflation factor (VIF) values. A threshold of 5 was used to identify potential multicollinearity issues with the main effects. For physiological parameters with potential multicollinearity—C-P at 120 min and E2 for linear regression; WHtR and E2 for logistic regression—interaction terms were removed.
For cluster analysis, each variable was scaled and centered to ensure comparability. Hierarchical cluster analysis was conducted using complete linkage, which focuses on the maximum distance between elements in different clusters to determine cluster formation. This method facilitates the identification of distinct groupings within the data. The resulting dendrogram was used to visualize the cluster structure and assess the relationships among the variables.
Results
Characteristics of the Study Population
A total of 172 children and adolescents diagnosed with overweight and obesity were included in the study. The characteristics of the study population are shown in Table 1. Among the participants, there were 96 males and 76 females, with an average age of 10.88 years (±2.70). The mean BMI was 26.77 ± 4.90 kg/m² (2.77 ± 0.80 SD). The mean waist circumference was 83.53 ± 11.84 cm, resulting in a mean WHtR of 0.56 ± 0.05.
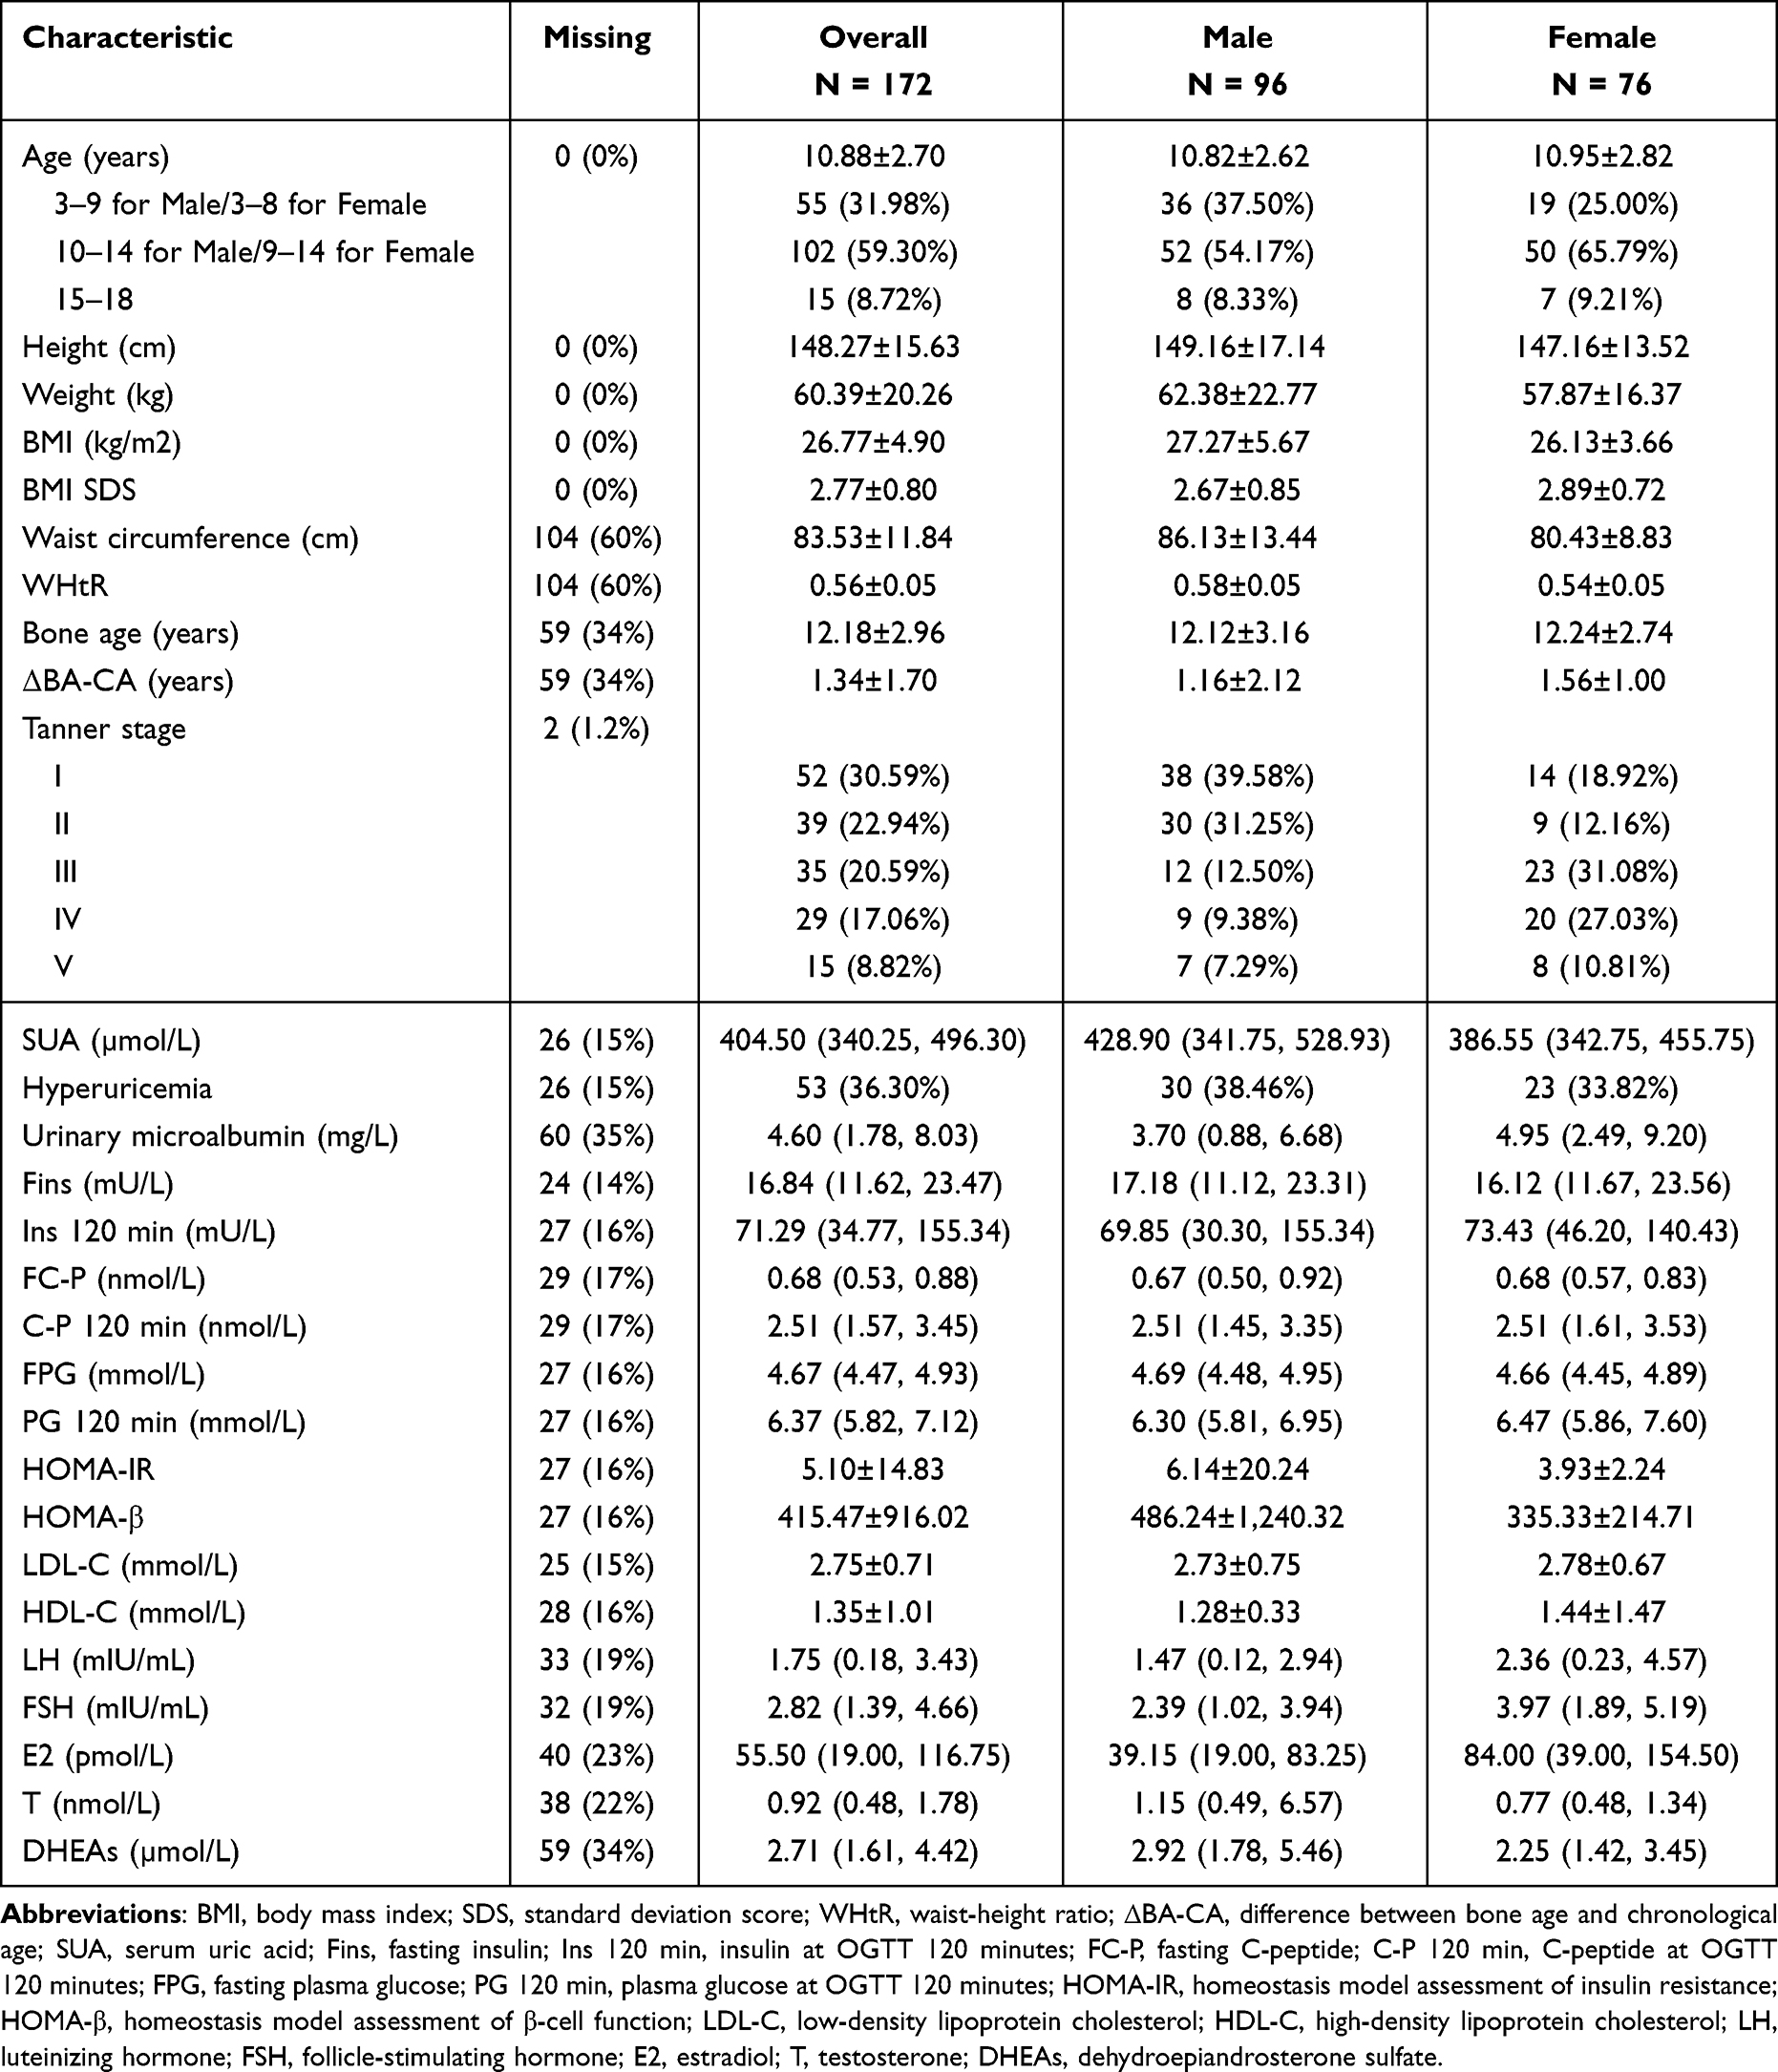 |
Table 1 Characteristics of the Study Population |
The SUA level was 404.50 µmol/L (IQR: 340.25, 496.30), with levels of 428.90 µmol/L (IQR: 341.75, 528.93) for males and 386.55 µmol/L (IQR: 342.75, 455.75) for females. Overall, 53 participants (36.30%) were classified as hyperuricemic, including 30 males (38.46%) and 23 females (33.82%). We further analyzed the distributions in different age groups. As shown in Figure 1, in Group 1 (ages 3–9 for males, 3–8 for females), the median SUA level for males was 372 µmol/L (IQR: 329, 462), while for females it was 339 µmol/L (IQR: 286, 400). The prevalence of hyperuricemia in this group was 41% for males and 18% for females. In Group 2 (ages 10–14 for males, 9–14 for females), males had a median SUA of 429 µmol/L (IQR: 365, 548), compared to 388 µmol/L (IQR: 355, 458) in females, with hyperuricemia rates of 34% for males and 36% for females. Group 3 (ages 15–18) exhibited the highest SUA levels, with males at 573 µmol/L (IQR: 520, 616) and females at 496 µmol/L (IQR: 418, 576), and a higher prevalence of hyperuricemia, at 57% for males and 67% for females.
 |
Figure 1 Serum uric acid levels (a) and prevalence of hyperuricemia (b) by age group and sex. The box plots on the left (a) display the distribution of serum uric acid levels for males (blue) and females (red) across three age groups: Group 1 (ages 3–9 for males, 3–8 for females), Group 2 (ages 10–14 for males, 9–14 for females), and Group 3 (ages 15–18). The bars on the right (b) illustrate the percentage of participants with hyperuricemia in each age group. Abbreviation: SUA, serum uric acid. |
Relationship Between Serum Uric Acid and Other Parameters
The relationship between SUA levels and various physiological parameters was assessed using Spearman correlation and regression analysis, adjusting for age and sex. The results are summarized in Table 2. Significant correlations were found for several parameters in both the Spearman correlation analysis and regression analysis. Notably, BMI showed a significant positive correlation with SUA levels (Spearman ρ = 0.353, P < 0.001), and regression analysis indicated an increase of 7.156 µmol/L in SUA for each unit increase in BMI (95% CI: 2.900, 11.412, P = 0.001). Fins were positively correlated with SUA (Spearman ρ = 0.207, P = 0.014), with regression results showing an increase of 3.272 µmol/L in SUA for each unit increase in Fins (95% CI: 1.155, 5.388, P = 0.003). HOMA-IR also demonstrated a positive correlation (Spearman ρ = 0.233, P = 0.006), and regression analysis revealed an increase of 14.598 µmol/L in SUA for each unit increase in HOMA-IR (95% CI: 4.924, 24.271, P = 0.003). Conversely, HDL-C exhibited a significant negative correlation with SUA levels (Spearman ρ = −0.290, P < 0.001), with regression analysis indicating that SUA levels decreased by 121.018 µmol/L for each unit increase in HDL-C (95% CI: −192.136, −49.899, P = 0.001). LH showed a positive correlation with SUA levels in both males and females, even after adjusting for age and sex. Several parameters, including FC-P, C-P 120 min, HOMA-β, and LDL-C, demonstrated significant correlations in the Spearman analysis but did not maintain significance in the regression model after adjustments. Additionally, some correlations appeared to be sex-specific; for instance, FSH, E2, and T were positively correlated with SUA levels in males but not in females.
 |
Table 2 Relationship Between Serum Uric Acid Levels and Other Parameters |
Relationship Between Hyperuricemia and Other Parameters
The relationship between hyperuricemia and various physiological parameters was assessed using logistic regression, adjusting for age and sex. The results are summarized in Table 3. Significant associations were identified for several parameters in both the comparison of groups and the regression analysis. BMI was higher in individuals with hyperuricemia compared to those with normal SUA levels (28.27 ± 5.40 vs 26.10 ± 4.42, P = 0.015), with an OR of 1.089 (95% CI: 0.995, 1.210, P = 0.079). Fins also showed a trend toward higher levels in the hyperuricemia group (19.85 [11.33, 27.76] vs 15.00 [11.63, 20.46], P = 0.056), with regression results indicating an OR of 1.067 (95% CI: 1.009, 1.144, P = 0.044). HOMA-IR demonstrated a significant association with hyperuricemia (4.61 ± 2.95 vs 3.48 ± 1.92, P = 0.02), revealing an OR of 1.429 (95% CI: 1.086, 2.012, P = 0.024). Conversely, HDL-C levels were significantly lower in individuals with hyperuricemia (1.17 ± 0.35 vs 1.48 ± 1.27, P = 0.038), with an OR of 0.078 (95% CI: 0.008, 0.527, P = 0.016), indicating a protective effect against hyperuricemia. Hormonal parameters, such as LH, FSH, and E2, did not show significant associations; however, T levels were significantly elevated in males with hyperuricemia (5.01 [1.12, 8.11] vs 0.71 [0.47, 2.89], P = 0.023).
 |
Table 3 Relationship Between Hyperuricemia and Other Parameters |
Hierarchical Clustering of Serum Uric Acid and Other Parameters
Hierarchical clustering was utilized to explore the similarity between SUA, urinary microalbumin, and various physiological parameters. The results are presented in Figure 2. The analysis revealed two distinct clusters. The first cluster includes SUA along with several metabolic indicators: HOMA-β, Fins, HOMA-IR, FC-P, LDL-C, ΔBA-CA, C-P at 120 min, and HDL-C. This grouping indicates an interrelationship among these parameters, suggesting a close link between hyperuricemia, insulin resistance, and lipid metabolism. The second cluster comprises PG 120 min, Ins 120 min, WHtR, BMI, urinary microalbumin, and FPG. Notably, BMI and WHtR are included in this cluster, reflecting a relationship between obesity metrics and metabolic dysfunction.
 |
Figure 2 Hierarchical clustering of hyperuricemia and associated parameters. The dendrogram illustrates the similarity between hyperuricemia and various physiological parameters based on hierarchical clustering analysis. Two distinct clusters were identified, denoted with red and blue. Abbreviations: BMI, body mass index; WHtR, waist-height ratio; ΔBA-CA, difference between bone age and chronological age; Fins, fasting insulin; Ins 120 min, insulin at OGTT 120 minutes; FC-P, fasting C-peptide; C-P 120 min, C-peptide at OGTT 120 minutes; FPG, fasting plasma glucose; PG 120 min, plasma glucose at OGTT 120 minutes; HOMA-IR, homeostasis model assessment of insulin resistance; HOMA-β, homeostasis model assessment of β-cell function; LDL-C, low-density lipoprotein cholesterol; HDL-C, high-density lipoprotein cholesterol. |
Discussion
This study provides valuable insights into the clinical characteristics of uric acid metabolism in overweight and obese children and adolescents in South China. Our findings reveal a significant prevalence of hyperuricemia (36.30%) among the participants, with a notable association between SUA levels and various metabolic parameters, including BMI, insulin resistance, and lipid profiles. These results underscore the multifaceted relationship between uric acid metabolism and metabolic disorders in pediatric populations.
Currently, there is no unified diagnostic standard for hyperuricemia in children and adolescents either in China or internationally, with many studies extrapolating adult thresholds (eg, >420 μmol/L for males and >360 μmol/L for females) to pediatric populations. However, physiological variations in SUA levels during childhood—influenced by age, sex, and pubertal development—render adult-based cutoffs inappropriate for this demographic. To address this limitation, our study adopted age- and sex-specific reference values derived from a large-sample cohort of children aged 5–14 years in Eastern China,17 further stratified by prepubertal, pubertal, and post-pubertal stages. This approach aligns with the physiological characteristics of pediatric populations and provides a more accurate assessment of uric acid metabolism in overweight and obese children. By employing these tailored criteria, our findings better reflect the true burden of hyperuricemia in this vulnerable group, strengthening the clinical relevance of our results.
The positive correlation between SUA levels and BMI in our study aligns with existing literature, which has consistently identified obesity as a major contributor to hyperuricemia [9]. As obesity rates continue to rise globally, understanding the mechanisms linking excess body weight to elevated uric acid levels becomes increasingly critical. The pathophysiological mechanisms underlying this relationship may involve increased production of uric acid due to enhanced turnover of purine nucleotides in adipose tissue,18 as well as decreased renal clearance of uric acid associated with obesity-related renal impairment.19
Moreover, the significant association between hyperuricemia and insulin resistance, as indicated by HOMA-IR values, agrees with previous findings that elevated SUA may serve as a marker of metabolic dysfunction in this population.12,20 The role of uric acid in insulin resistance is particularly noteworthy; it has been proposed that hyperuricemia may impair endothelial function and promote inflammation, thereby exacerbating insulin resistance.21,22 This finding highlights the need for further investigation into the potential of SUA as a therapeutic target in preventing the progression of metabolic syndrome in children.
Our results also indicate a link between hyperuricemia and dyslipidemia, with lower levels of HDL-C observed in hyperuricemic individuals. This relationship is consistent with previous studies that have shown dyslipidemia to be prevalent in obese children and adolescents with hyperuricemia.11 The interplay between uric acid, lipid metabolism, and cardiovascular risk factors underscores the importance of a holistic approach in managing obesity-related health issues in pediatric patients.
Interestingly, our findings also suggest sex-specific differences in the relationship between SUA and metabolic parameters. Notably, boys exhibited a higher prevalence of hyperuricemia compared to girls, and significant correlations between SUA levels and hormonal parameters were observed only in boys. This raises important questions regarding the role of sex hormones in modulating uric acid metabolism and its associated risks, particularly during key developmental periods.
The hierarchical cluster analysis conducted in this study revealed two distinct clusters, elucidating the interrelationships among SUA, insulin resistance, and other metabolic indicators. The first cluster, which included SUA alongside fasting insulin, HOMA-IR, and lipid parameters, suggests a close association between hyperuricemia and metabolic dysfunction. This finding indicates that hyperuricemia may not only be a consequence of obesity but also a contributing factor to the development of insulin resistance and dyslipidemia. The second cluster, encompassing various obesity metrics, urinary microalbumin, and blood glucose parameters, further illustrates the interconnectedness of these health issues. By identifying these clusters, our study provides a framework for understanding the complex metabolic landscape in overweight and obese children and highlights the need for targeted interventions that address multiple facets of health simultaneously.
Given the high prevalence of hyperuricemia and its associations with metabolic abnormalities,23 early screening and intervention strategies are essential. Lifestyle modifications aimed at weight reduction should be prioritized, as studies have shown that weight loss can lead to significant reductions in SUA levels.19,24 Moreover, healthcare providers should consider the broader metabolic profile of overweight and obese children, emphasizing the prevention of comorbid conditions such as hypertension, insulin resistance, and dyslipidemia.
We are aware that the study has several limitations. The retrospective design may introduce biases related to data collection and reliance on existing medical records, potentially impacting the accuracy of the collected data. Additionally, the study was conducted at a single center, which may limit the generalizability of the results to broader populations. The sample size, while adequate for preliminary analysis, may not be sufficient to capture the full spectrum of metabolic variations across different demographics. Future research should consider larger, multicenter studies to validate these findings and explore the broader implications of hyperuricemia in diverse pediatric populations.
Conclusion
This study underscores the considerable prevalence of hyperuricemia among overweight and obese children and adolescents in South China, along with its associations with insulin resistance and dyslipidemia. These findings position hyperuricemia as a potential marker for metabolic dysfunction, highlighting the necessity for early screening and intervention in this demographic. It is essential for healthcare providers to acknowledge the significance of hyperuricemia in pediatric populations. By prioritizing timely diagnosis and effective interventions, we can improve the quality of life for affected children and reduce their future health risks.
Disclosure
The authors report no conflicts of interest in this work.
References
1. Afshin A, Forouzanfar MH, Reitsma MB, The GBD. 2015 Obesity Collaborators. Health effects of overweight and obesity in 195 countries over 25 years. N Engl J Med. 2017;377:13–27. doi:10.1056/NEJMoa1614362
2. Lobstein T, Jackson-Leach R, Moodie ML, et al. Child and adolescent obesity: part of a bigger picture. Lancet. 2015;385:2510–2520. doi:10.1016/S0140-6736(14)61746-3
3. Pan X-F, Wang L, Pan A. Epidemiology and determinants of obesity in China. Lancet Diabetes Endocrinol. 2021;9:373–392. doi:10.1016/S2213-8587(21)00045-0
4. Yang S, Guo B, Ao L, et al. Obesity and activity patterns before and during COVI-19 lockdown among youths in China. Clin Obes. 2020;10. doi:10.1111/cob.12416
5. Ghane Sharbaf F, Assadi F. Effect of allopurinol on the glomerular filtration rate of children with chronic kidney disease. Pediatr Nephrol. 2018;33:1405–1409. doi:10.1007/s00467-018-3943-1
6. Kubota M. Hyperuricemia in children and adolescents: present knowledge and future directions. J Nutr Metab. 2019;2019:1–8. doi:10.1155/2019/3480718
7. Clifford SM, Bunker AM, Jacobsen JR, et al. Age and gender specific pediatric reference intervals for aldolase, amylase, ceruloplasmin, creatine kinase, pancreatic amylase, prealbumin, and uric acid. Clin Chim Acta. 2011;412(9–10):788–790. doi:10.1016/j.cca.2011.01.011
8. Rao J, Ye P, Lu J, et al. Prevalence and related factors of hyperuricaemia in Chinese children and adolescents: a pooled analysis of 11 population-based studies. Ann Med. 2022;54(1):1608–1615. doi:10.1080/07853890.2022.2083670
9. Oyama C, Takahashi T, Oyamada M, et al. Serum uric acid as an obesity-related indicator in early adolescence. Tohoku J Exp Med. 2006;209:257–262. doi:10.1620/tjem.209.257
10. AlAteeq MA, Almaneea A, Althaqeb EK, et al. Uric acid levels in overweight and obese children, and their correlation with metabolic risk factors. Cureus. 2024. doi:10.7759/cureus.70160
11. Tang L, Kubota M, Nagai A, et al. Hyperuricemia in obese children and adolescents: the relationship with metabolic syndrome. Pediatr Rep. 2010;2(1):e12. doi:10.4081/pr.2010.e12
12. de Miranda JA, Almeida GG, Martins RIL, et al. The role of uric acid in the insulin resistance in children and adolescents with obesity. Rev Paulista Pediatria. 2015;33:431–436. doi:10.1016/j.rpped.2015.03.009
13. Kim JY, Seo C, Pak H, et al. Uric acid and risk of cardiovascular disease and mortality: a longitudinal cohort study. J Korean Med Sci. 2023;38. doi:10.3346/jkms.2023.38.e302
14. Subspecialty Group of Endocrinologic H and MD the S of PCMA, Subspecialty Group of Child Health Care the S of PCMA, Subspecialty Group of Clinical Nutrition the S of PCMA, et al. Expert consensus on diagnosis, assessment, and management of obesity in Chinese children. Zhonghua Er Ke Za Zhi. 2022;60:507–515. doi:10.3760/cma.j.cn112140-20220112-00043
15. Li H, Ji C-Y, Zong X-N, et al. Body mass index growth curves for Chinese children and adolescents aged 0 to 18 years. Zhonghua Er Ke Za Zhi. 2009;47:493–498.
16. National Health Commission of the PRC. Screening for overweight and obesity among school-age children and adolescents (WS/T 586-2018). 2018.
17. Dai C, Wang C, Xia F, et al. Age and gender-specific reference intervals for uric acid level in children aged 5–14 years in Southeast Zhejiang Province Of China: hyperuricemia in children may need redefinition. Front Pediatr. 2021;9. doi:10.3389/fped.2021.560720
18. Tsushima Y, Nishizawa H, Tochino Y, et al. Uric acid secretion from adipose tissue and its increase in obesity. J Biol Chem. 2013;288:27138–27149. doi:10.1074/jbc.M113.485094
19. Yamashita S, Matsuzawa Y, Tokunaga K, et al. Studies on the impaired metabolism of uric acid in obese subjects: marked reduction of renal urate excretion and its improvement by a low-calorie diet. Int J Obes. 1986;10:255–264.
20. Niu Y, Tang Q, Zhao X, et al. Obesity-induced insulin resistance is mediated by high uric acid in obese children and adolescents. Front Endocrinol. 2021:12. doi:10.3389/fendo.2021.773820
21. Bahadoran Z, Mirmiran P, Kashfi K, et al. Hyperuricemia-induced endothelial insulin resistance: the nitric oxide connection. Pflugers Arch. 2022;474(1):83–98. doi:10.1007/s00424-021-02606-2
22. Wardhana W, Rudijanto A. Effect of Uric Acid on Blood Glucose Levels. Acta Med Indones. 2018;50:253–256.
23. Su H, Liu T, Li Y, et al. Serum uric acid and its change with the risk of type 2 diabetes: a prospective study in China. Prim Care Diabetes. 2021;15:1002–1006. doi:10.1016/j.pcd.2021.06.010
24. Jørgensen RM, Bøttger B, Vestergaard ET, et al. Uric acid is elevated in children with obesity and decreases after weight loss. Front Pediatr. 2022;9. doi:10.3389/fped.2021.814166
 © 2025 The Author(s). This work is published and licensed by Dove Medical Press Limited. The
full terms of this license are available at https://www.dovepress.com/terms
and incorporate the Creative Commons Attribution
- Non Commercial (unported, 4.0) License.
By accessing the work you hereby accept the Terms. Non-commercial uses of the work are permitted
without any further permission from Dove Medical Press Limited, provided the work is properly
attributed. For permission for commercial use of this work, please see paragraphs 4.2 and 5 of our Terms.
© 2025 The Author(s). This work is published and licensed by Dove Medical Press Limited. The
full terms of this license are available at https://www.dovepress.com/terms
and incorporate the Creative Commons Attribution
- Non Commercial (unported, 4.0) License.
By accessing the work you hereby accept the Terms. Non-commercial uses of the work are permitted
without any further permission from Dove Medical Press Limited, provided the work is properly
attributed. For permission for commercial use of this work, please see paragraphs 4.2 and 5 of our Terms.
Recommended articles

Prevalence of Hyperuricemia and Associated Factors Among Type 2 Diabetic Patients in Jordan
Abujbara M, Al Hourani HM, Al-Raoush RI, Khader YS, Ajlouni K
International Journal of General Medicine 2022, 15:6611-6619
Published Date: 16 August 2022
Association Between Triglyceride-Glucose Index and Serum Uric Acid Levels: A Biochemical Study on Anthropometry in Non-Obese Type 2 Diabetes Mellitus Patients
Luo Y, Hao J, He X, Wang C, Zhao H, Zhang Z, Yang L, Ren L
Diabetes, Metabolic Syndrome and Obesity 2022, 15:3447-3458
Published Date: 3 November 2022
The Mechanism of Sodium-Glucose Cotransporter-2 Inhibitors in Reducing Uric Acid in Type 2 Diabetes Mellitus
Dong M, Chen H, Wen S, Yuan Y, Yang L, Xu D, Zhou L
Diabetes, Metabolic Syndrome and Obesity 2023, 16:437-445
Published Date: 14 February 2023
Uric Acid Metabolic Disorders in Pituitary-Target Gland Axis
Li R, Wu B, Han M, Li M, Yang X, Zhang J, Zhang Y, Liu Y
Diabetes, Metabolic Syndrome and Obesity 2024, 17:661-673
Published Date: 7 February 2024
Hyperuricemia Increases the Risk of Postoperative Recurrence in Chinese Patients with Chronic Rhinosinusitis
Jiang S, Xie S, Xie Z, Jiang W, Zhang H
Journal of Inflammation Research 2024, 17:2669-2679
Published Date: 1 May 2024