Back to Journals » Journal of Hepatocellular Carcinoma » Volume 11
Triglyceride-Glucose Index is an Independent Risk Factor for Hepatocellular Carcinoma Development in Patients with HBV-Related Liver Cirrhosis
Authors Yang SH ![]() , He YS
, He YS ![]() , Zheng SQ, Zhang XJ, Dai H, Xue Y
, Zheng SQ, Zhang XJ, Dai H, Xue Y
Received 8 December 2023
Accepted for publication 9 April 2024
Published 18 April 2024 Volume 2024:11 Pages 737—746
DOI https://doi.org/10.2147/JHC.S454037
Checked for plagiarism Yes
Review by Single anonymous peer review
Peer reviewer comments 2
Editor who approved publication: Dr David Gerber
Su-Hua Yang,1,* Yi-Shan He,2,* Shu-Qin Zheng,3 Xiu-Jun Zhang,3 Hong Dai,1,* Yuan Xue2,3,*
1Department of General Surgery, Changzhou Third People’s Hospital, Changzhou Medical Center, Nanjing Medical University, Changzhou, Jiangsu Province, People’s Republic of China; 2Department of Infectious Diseases, Changzhou Third People’s Hospital, Changzhou Medical Center, Nanjing Medical University, Changzhou, Jiangsu Province, People’s Republic of China; 3Institute of Hepatology, Changzhou Third People’s Hospital, Changzhou, Jiangsu Province, People’s Republic of China
*These authors contributed equally to this work
Correspondence: Hong Dai, Department of General Surgery, Changzhou Third People’s Hospital, Changzhou Medical Center, Nanjing Medical University, Changzhou, Jiangsu Province, People’s Republic of China, Email [email protected] Yuan Xue, Institute of Hepatology, Changzhou Third People’s Hospital, Changzhou Medical Center, Nanjing Medical University, No. 300 Lanling North Road, Changzhou, Jiangsu, 213000, People’s Republic of China, Tel +86 519 82009059, Email [email protected]
Aim: This study aimed to explore the effects of the triglyceride-glucose (TyG) index on hepatocellular carcinoma (HCC) development in patients with hepatitis B virus (HBV)-related liver cirrhosis (LC).
Methods: A total of 242 patients with HBV-related LC were enrolled and followed-up. Logistic regression analysis was performed to investigate risk factors for HCC.
Results: The median follow-up time was 37 months (range: 6– 123 months). At the end of the follow-up, 11 (11.3%) patients with compensated cirrhosis (CC) and 45 (31.0%) with decompensated cirrhosis (DC) developed HCC. The TyG index was higher in the HCC group than in the non-HCC group (P=0.05). Univariate analysis showed that age (P< 0.01), DC (P< 0.01), TyG index (P=0.08), albumin (ALB) level (P=0.05), platelet (PLT) count (P< 0.01), and HBV DNA positivity (P< 0.01) were associated with HCC development. Multivariate analysis revealed that age, DC, TyG index, PLT count, and HBV DNA positivity were independent risk factors for HCC development (P=0.01, 0.01, < 0.01, 0.05, and < 0.01, respectively). For patients with DC, multivariate logistic regression analysis revealed that age, TyG index, and HBV DNA positivity were independent risk factors for HCC development (all P< 0.05). A new model encompassing age, DC, TyG, PLT, and positive HBV DNA had optimal predictive accuracy in patients with DC or CC, with a cutoff value of 0.197. The areas under the receiver operating characteristic curves (AUROCs) of the model for predicting HCC development in patients with LC, DC, and CC were 0.778, 0.721, and 0.783, respectively.
Conclusion: TyG index was identified as an independent risk factor for HCC development in patients with LC.
Keywords: hepatocellular carcinoma, triglyceride-glucose index, insulin resistance, liver cirrhosis, decompensated cirrhosis
Introduction
In China, liver cancer is one of the most common malignant tumors and the second leading cause of cancer-related deaths.1 Hepatocellular carcinoma (HCC), which accounts for 75–85% of primary liver cancers, is a public health burden.2
Hepatitis B virus (HBV)- or hepatitis C virus (HCV)-related liver cirrhosis (LC) is a major risk factor for HCC in the Asia-Pacific region.1 LC is a pathological stage characterized by diffuse fibrosis, pseudolobule formation, and the proliferation of blood vessels inside and outside the liver. In contrast to compensated cirrhosis (CC), decompensated cirrhosis (DC) is characterized by obvious portal hypertension and complications such as ascites, gastrointestinal bleeding, hepatic encephalopathy, and hepatorenal syndrome. Owing to serious liver damage, patients with DC have a high Child-Pugh score and are ineligible to undergo partial hepatectomy. Approximately 31.8% of patients with HBV-related DC develop HCC during the 5-year follow-up.3 Patients with CC and DC have different physical status. In a previous study, we showed that the prediction accuracy of noninvasive models was not potent in patients with DC.4 Considering that the HCC incidence is high and the prognosis is poor in patients with DC, additional accuracy prediction models are essential.
Insulin resistance (IR) is a condition in which insulin is less effective in promoting glucose uptake and utilization. This results in the secretion of excessive insulin by the body, which causes hyperinsulinemia to maintain stable blood sugar levels. These conditions play crucial roles in chronic metabolic diseases.5 The euglycemic insulin clamp technique is the gold standard for diagnosing IR,6 it is expensive and cumbersome. Some studies have shown that the homeostasis model assessment of IR (HOMA2-IR) is a simple and indirect IR evaluation method that can predict the occurrence and recurrence of HCC.7,8 HOMA2-IR is calculated by fasting insulin and fasting blood glucose. However, it is not convenient to detect fasting insulin in clinical practice. The TyG index is a new surrogate marker for IR and has gained increasing attention in recent years. The calculation is based on fasting blood glucose and triglycerides, which are relatively easy to detect. Nonetheless, research on the TyG index mainly focuses on cardiovascular diseases,9 acute severe pancreatitis,10 and metabolic diseases such as nonalcoholic fatty liver disease (NAFLD).11 The TyG index is also associated with the occurrence of certain cancers.12–14 However, the correlation between the TyG index and HCC remains elusive.
The present study aimed to evaluate the accuracy of TyG index in predicting HCC development in patients with HBV-related LC.
Patients and Methods
Patients
The study was prospective and non-interventional, and written consents were obtained from all the patients. A total of 252 patients diagnosed with HBV-related LC who received antiviral therapy between September 2010 and June 2020 were enrolled in this prospective study and divided into CC and DC groups according to complications at the time of admission. According to the Chinese Guidelines for the Prevention and Treatment of Chronic Hepatitis B,15 patients with ascites, spontaneous bacterial peritonitis, hepatic encephalopathy, or upper gastrointestinal bleeding were diagnosed with DC. HCC was diagnosed based on pathological evidence, alpha-fetoprotein (AFP) levels, contrast-enhanced ultrasound or computed tomography (CT), or magnetic resonance imaging (MRI). The TyG index was calculated as follows: ln [fasting triglycerides (mg/dL) × fasting plasma glucose (FPG) (mg/dL)/2]. Patients with coexisting malignant tumors, other viral hepatitis, human immunodeficiency virus (HIV) infection, cardiopulmonary insufficiency, or hypolipidemic drug administration were excluded during follow-up.
All patients were followed-up every 3–6 months. Patients who developed HCC within 6 months of follow-up or were lost to follow-up were excluded. The endpoint of this study was HCC development or death.
Statistical Analysis
SPSS 26.0 software (IBM Corp., Armonk, NY, USA) was used for statistical analysis. Continuous variables are expressed as median (interquartile range [IQR]) and compared using the Mann–Whitney U-test. Categorical variables were expressed as frequencies and compared using the chi-squared test or Fisher’s exact test. Baseline variables with a significance level of P<0.1 in univariate analysis were included in the binary logistic model, through multivariate stepwise LR to identify the variables that were independent risk factors for HCC development. Then, according to the multivariate logistic regression analysis, a new prediction model was constructed. The receiver operating characteristic (ROC) curve was drawn using the MedCalc version 15.2.2 software (MedCalc Software, Mariakerke, Belgium). Statistical significance was set at P<0.05.
Results
Baseline Clinical Characteristics
Among the 252 patients, 7 with other malignant tumors and 3 who developed HCC within 6 months of follow-up were excluded. Data from 242 patients were analyzed (Figure 1).
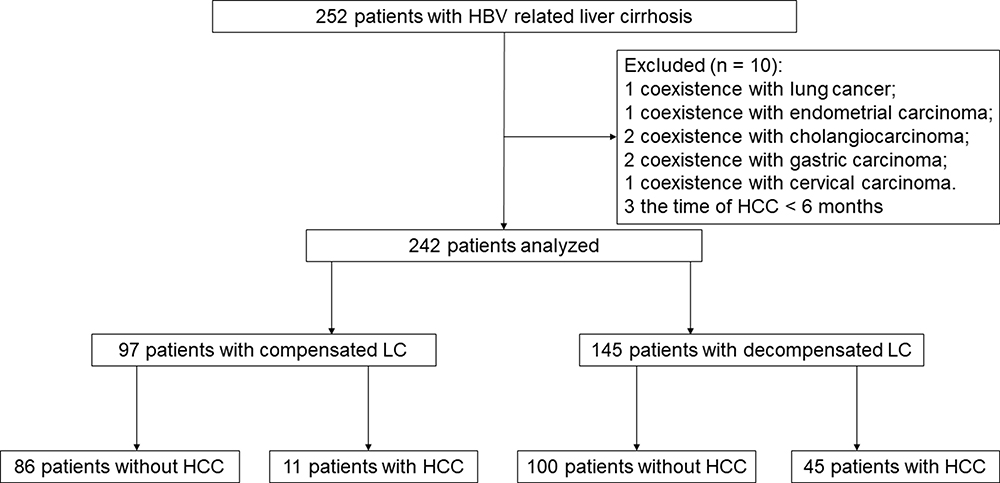 |
Figure 1 Screening of patients with HBV-related LC. Abbreviations: HBV, hepatitis B virus; LC, liver cirrhosis; HCC, hepatocellular carcinoma. |
At the last follow-up, 145/242 patients were diagnosed with DC, while the remaining 97 were diagnosed with CC. The median follow-up time was 37 months (range: 6–123 months). At the end of follow-up, 23.1% (56/242) of the patients with HBV-related LC developed HCC. Among them, 11.3% (11/97) of the patients with CC developed HCC, while 31.0% (45/145) of the patients with DC developed HCC (Figure 1). The incidence of HCC in patients with DC was higher than that in patients with CC (χ2=12.675, P<0.01) (Table 1). The median time from LC diagnosis to HCC development was 30 months (range: 6–97 months).
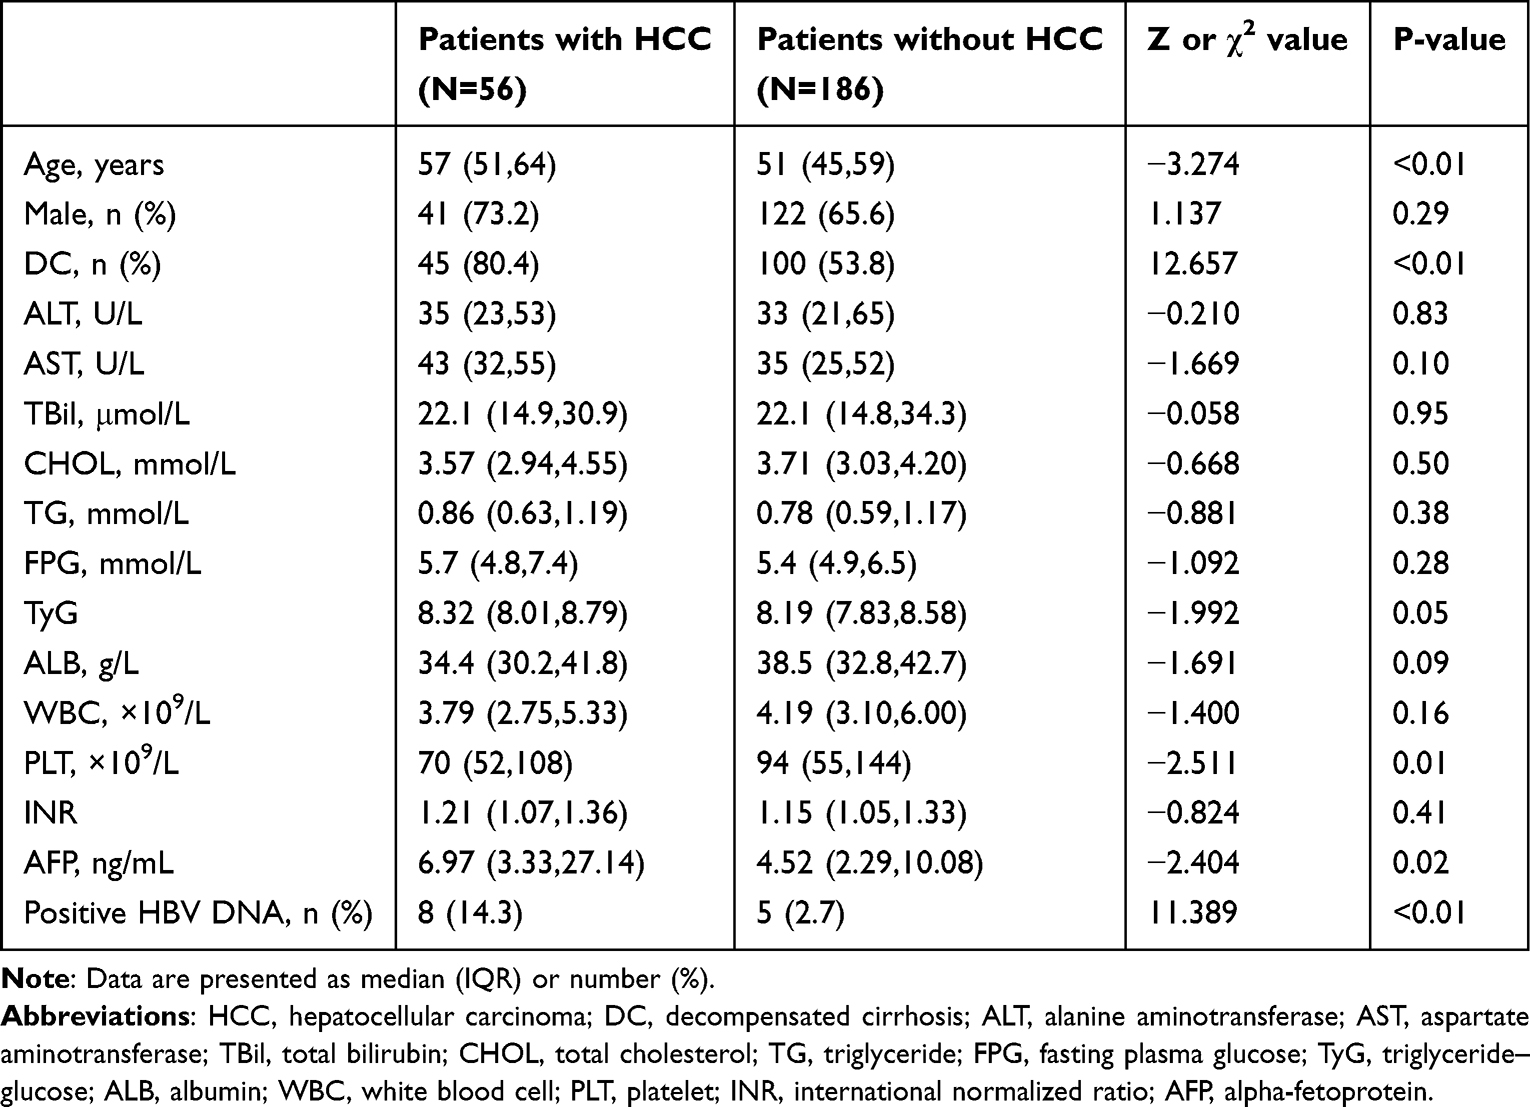 |
Table 1 Baseline Characteristics of Patients with HBV-Related LC |
Patients who developed HCC were older and had a lower platelet (PLT) count than those who did not (Z=−3.274 and −2.511, P<0.01, and P=0.01, respectively) (Table 1). No significant difference was observed in the development of HCC between male patients (41/163, 25.2%) and females (15/79, 19.0%) (χ2=1.137, P=0.29) (Table 1). The TyG index in the HCC group was higher than that in the non-HCC group (Z=−1.992, P=0.05). Notably, at the last follow-up, patients with positive HBV DNA (>100 IU/mL) were more common in the HCC group than in the non-HCC group(14.3% vs 2.7%, χ2=11.389, P<0.01) (Table 1).
Patients in the DC group were older in the HCC group than in the non-HCC group (Z=−2.155, P=0.03) (Table 2). Moreover, patients who developed HCC had a higher TyG index than those who did not (Z=−2.220, P=0.03) (Table 2). Additionally, at the last follow-up, HBV DNA positivity were more common in the HCC group than in the HCC group (13.3% vs 3.0%, χ2=4.210, P=0.04).
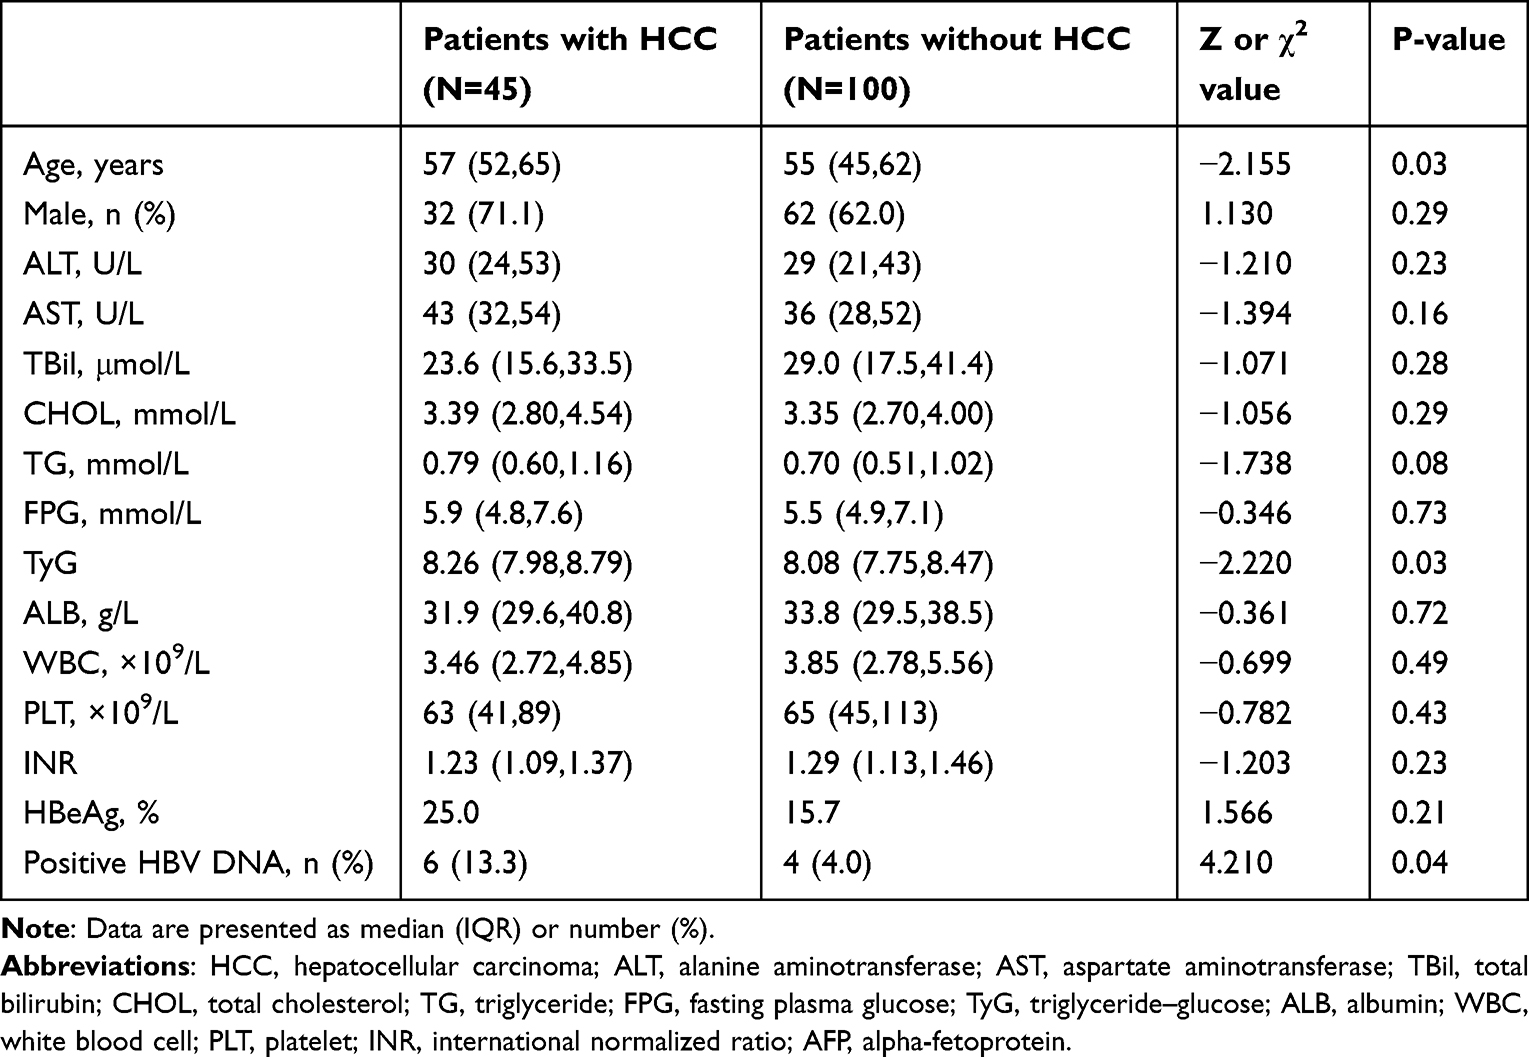 |
Table 2 Baseline Characteristics of Patients with HBV-Related DC |
For patients with CC, no significant differences were noted in age, ALT, WBC, PLT, and TyG index between the two groups (all P>0.05). HBV DNA positivity was more common in the HCC group than in the non-HCC group (18.2% vs 1.2%, P=0.03) (Table 3).
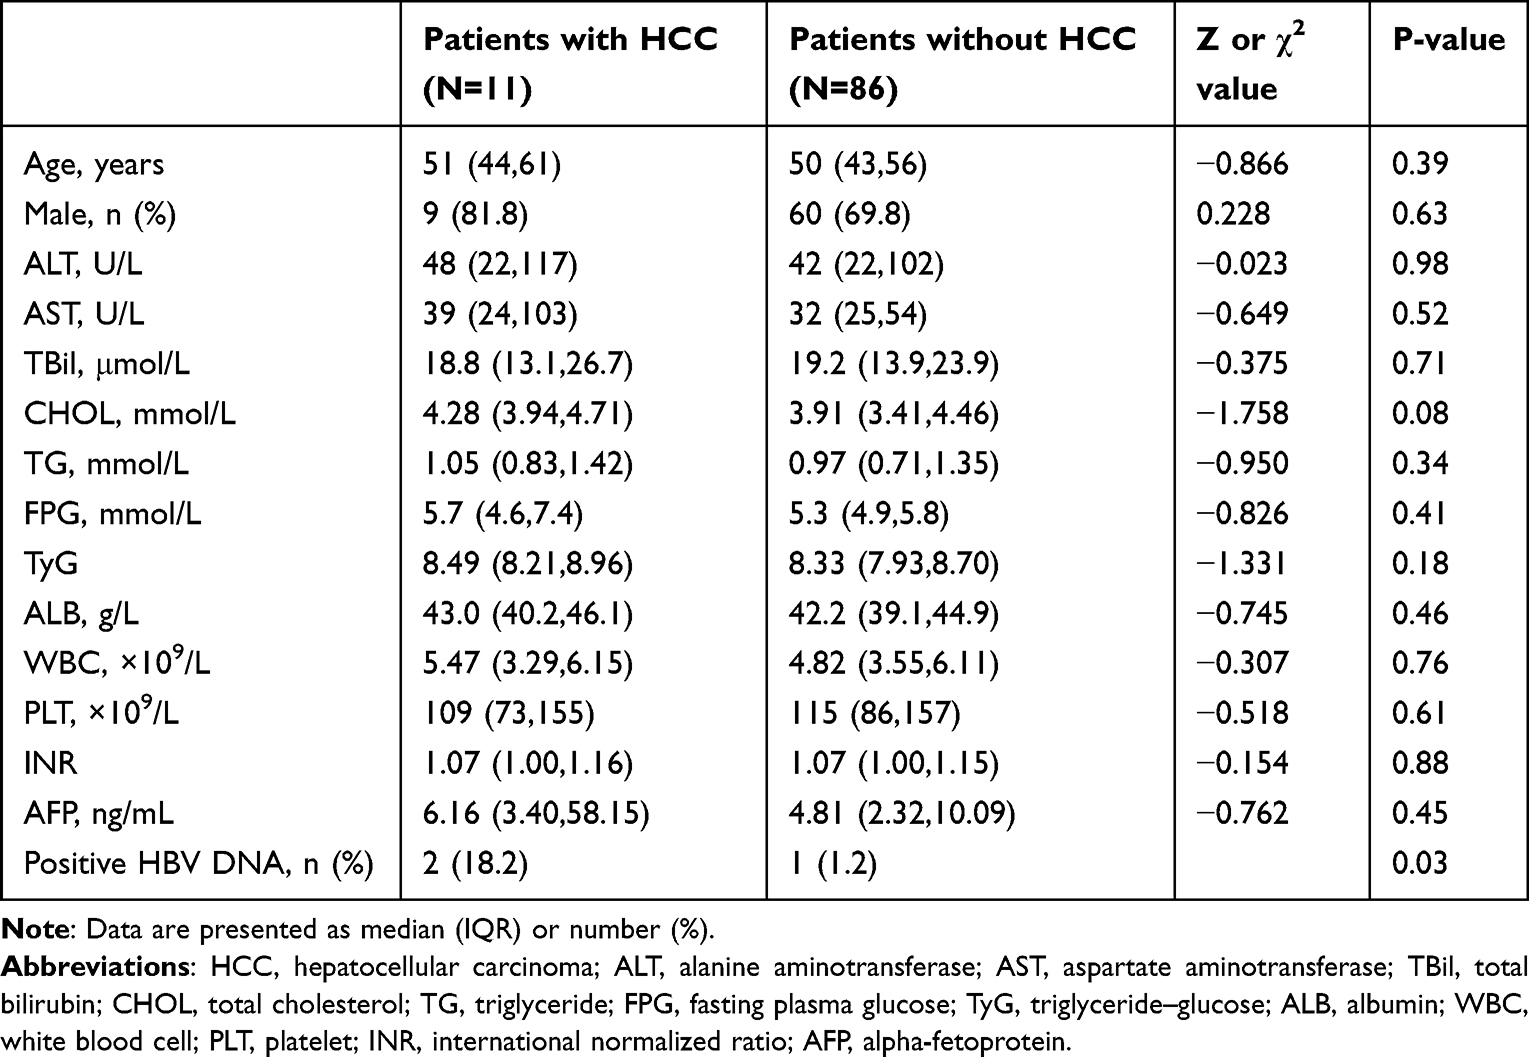 |
Table 3 Baseline Characteristics of Patients with HBV-Related CC |
Risk Factors for HCC Development in Patients with HBV-Related LC
Univariate analysis showed that age (P<0.01), DC (P<0.01), TyG index (P=0.08), albumin (ALB) (P=0.05), PLT count (P<0.01), and HBV DNA positivity (P<0.01) were associated with HCC development (Table 4). Multivariate logistic regression analysis revealed that age, DC, TyG, PLT count, and positive HBV DNA were independent risk factors for HCC development [odds ratio (OR)=1.043, 2.882, 2.602, 0.994, and 13.096; 95% confidence interval (CI):1.009–1.079, 1.253–6.353, 1.439–4.704, 0.988–1.000) and 3.108–55.180; P=0.01, 0.01, <0.01, 0.05, and <0.01, respectively]. In addition, a model incorporating age, DC, TyG, PLT, and HBV DNA positivity was developed. The areas under the receiver operating characteristic curves (AUROC) of the new model for predicting HCC development was 0.778 (Figure 2). No multicollinearity was detected among these variables (all variance inflation factors were <10, and all tolerances were >0.1).
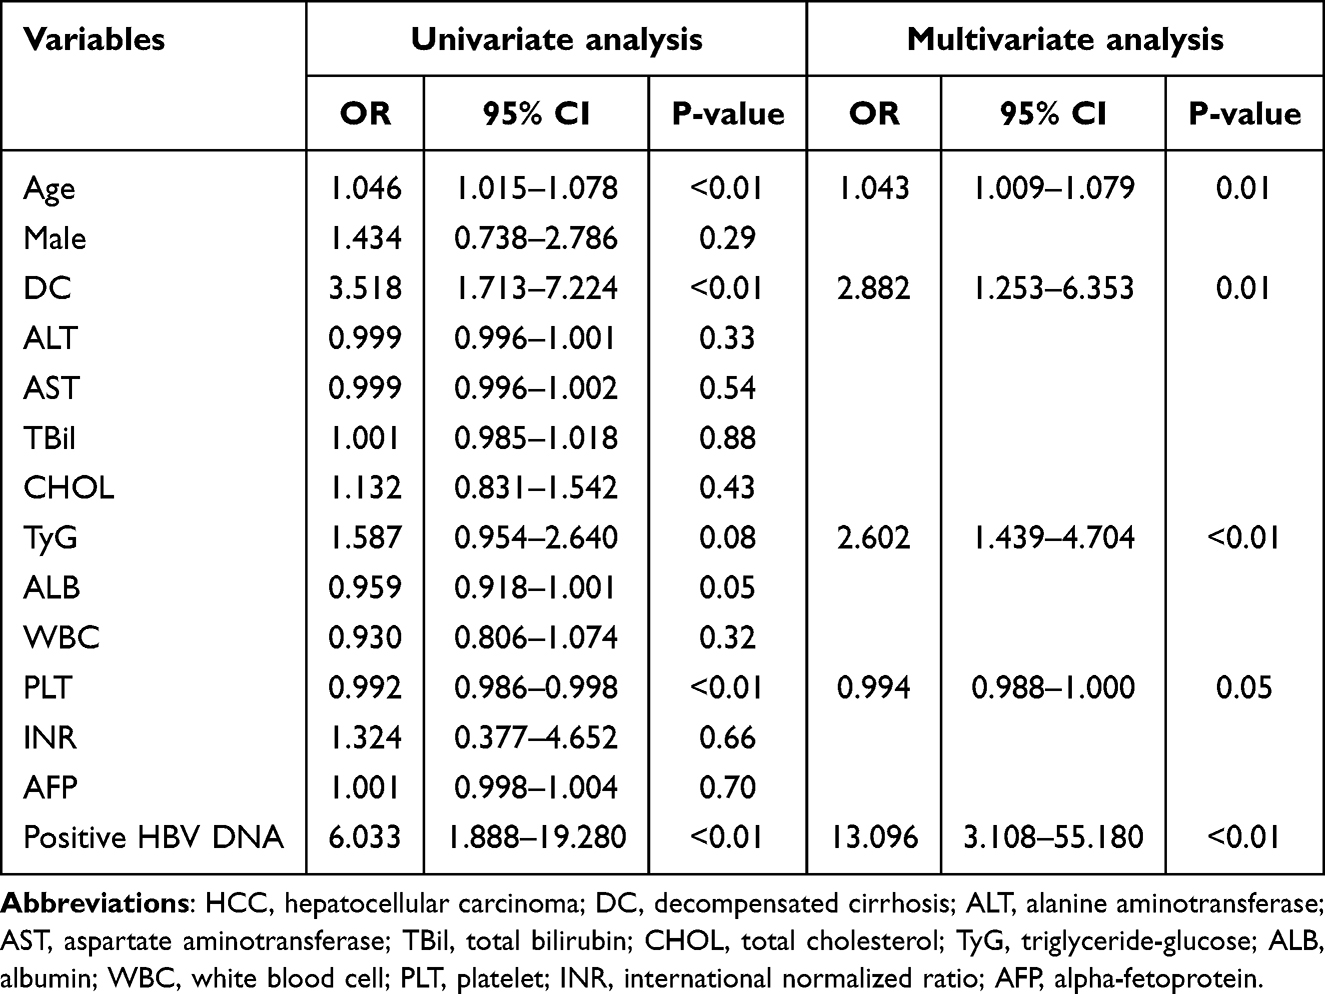 |
Table 4 Risk Factors for HCC Development in Patients with HBV-Related LC |
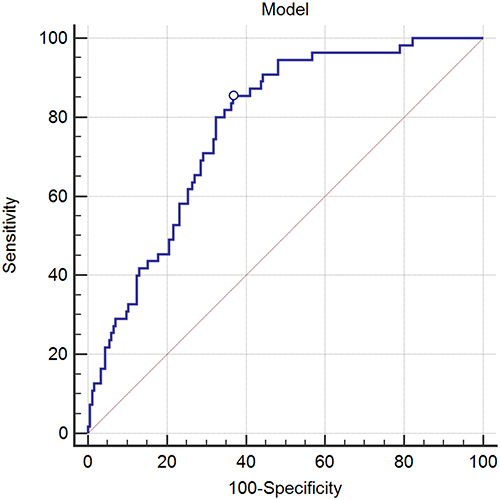 |
Figure 2 ROC curve of Model (Age_DC_TyG_PLT_positive HBV DNA). |
Multivariate logistic regression analysis showed that age, TyG index, and HBV DNA positivity were independent risk factors for HCC development (OR=1.045, 2.620, and 6.081; 95% CI:1.007–1.085, 1.320–5.200, and 1.438–25.720; P=0.02, <0.01, and 0.01, respectively) (Table 5).
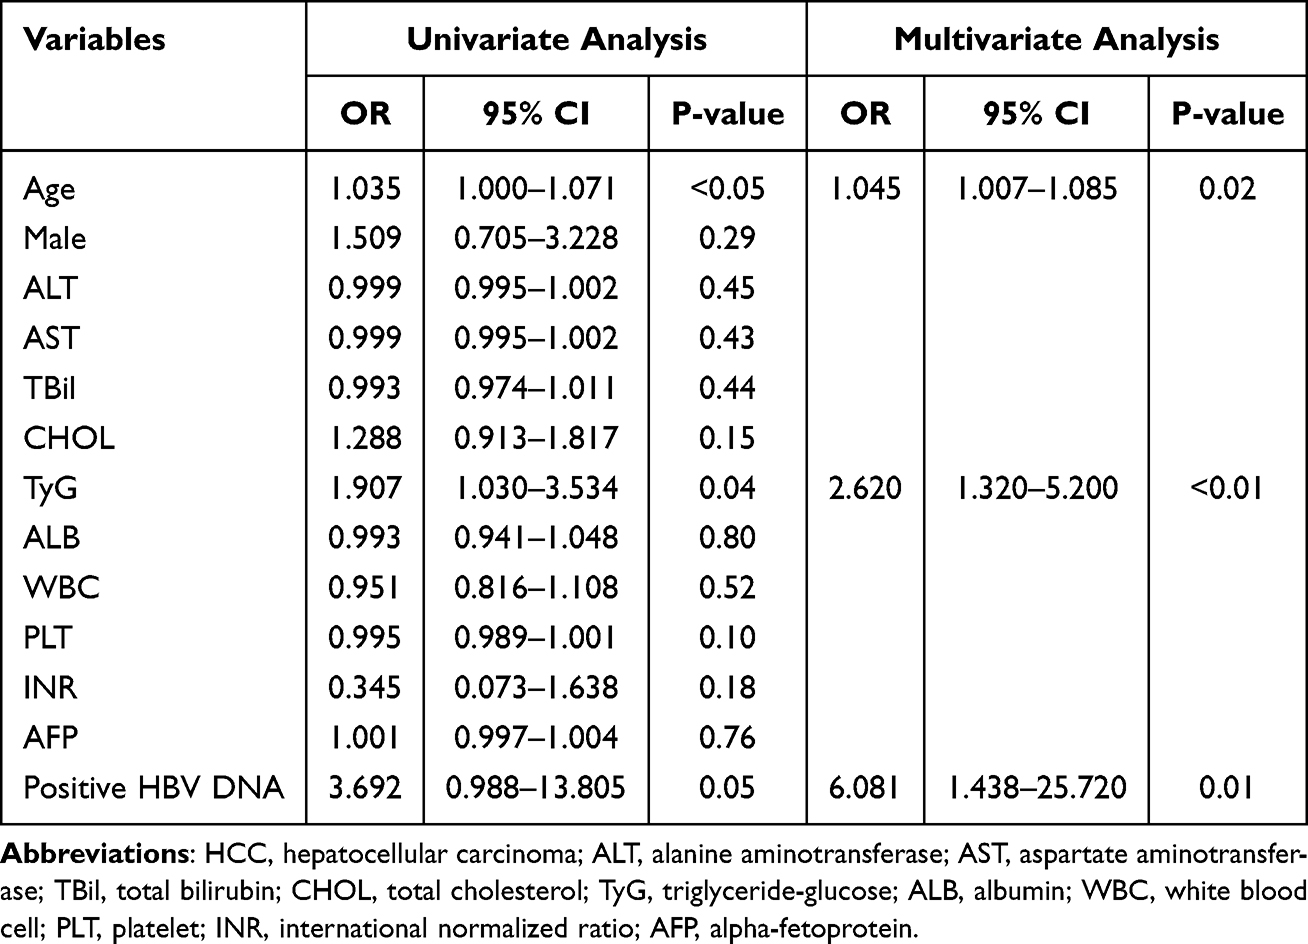 |
Table 5 Risk Factors for HCC Development in Patients with HBV-Related DC |
In patients with CC, positive HBV DNA was associated with HCC development in the univariate analysis (OR=18.889, 95% CI:1.555–229.388, P=0.02) (Table 6).
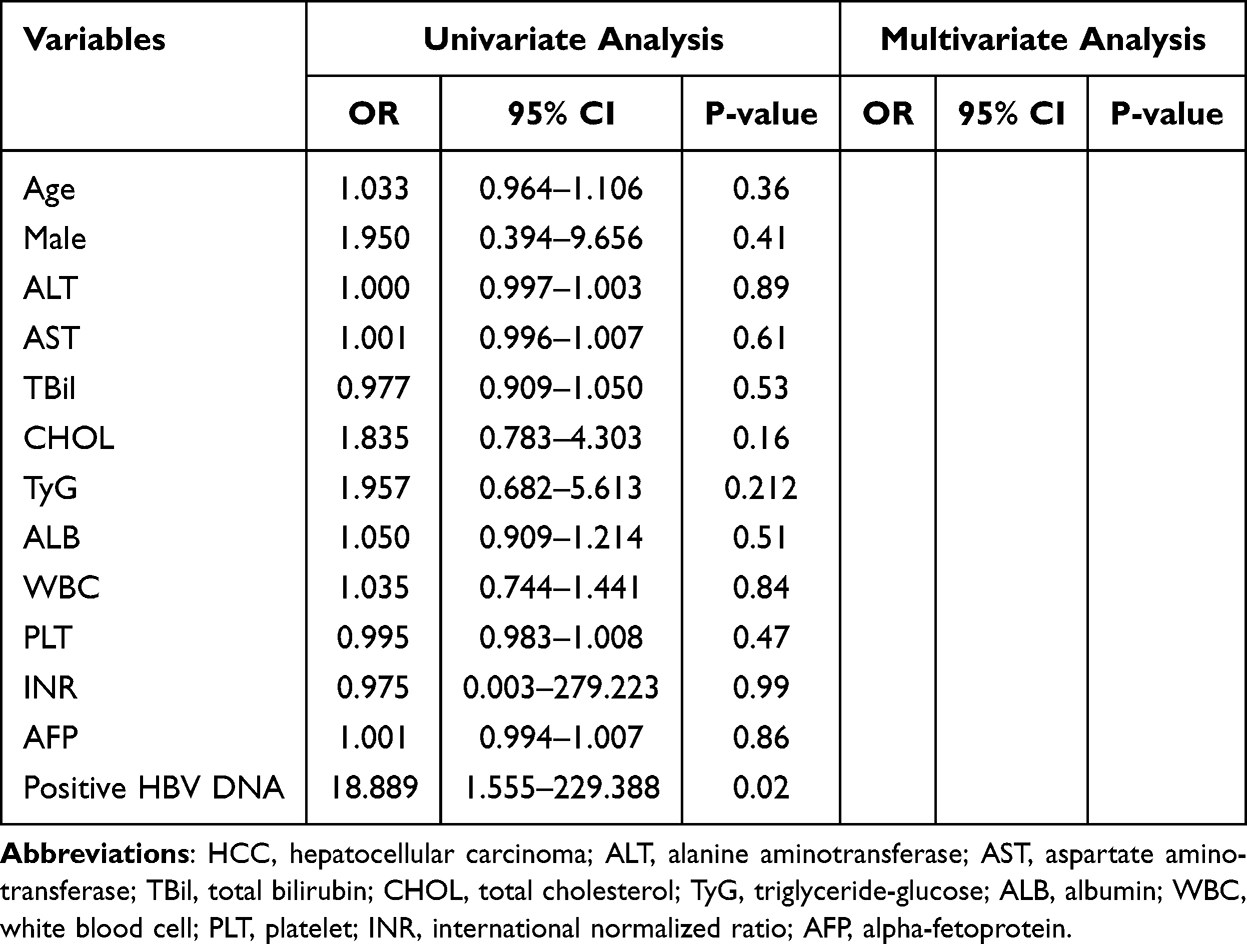 |
Table 6 Risk Factors for HCC Development in Patients with HBV-Related CC |
Stratification of Patients at a High Risk of HCC
According to the results of the multivariate logistic regression analysis, model (Age_DC_TyG_ PLT_positive HBV DNA)  . The AUROCs of the model for predicting HCC development in patients with DC and CC were 0.721 and 0.783, respectively. The cutoff value of the model was 0.197 according to the DeLong test.16 Based on the Kaplan–Meier curve, patients were stratified into high- and low-risk groups (all P<0.01), and the model showed optimal predictive accuracy in patients with DC or CC (Figure 3).
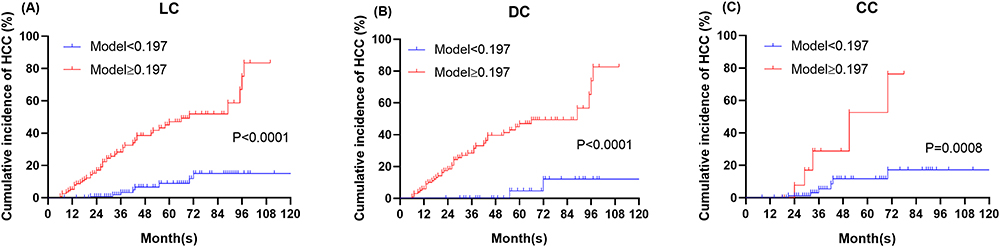 |
Figure 3 Incidence of HCC development in patients with LC (A), DC (B), or CC (C). Abbreviations: LC, liver cirrhosis; CC, compensated cirrhosis; DC, decompensated cirrhosis; HCC, hepatocellular carcinoma. |
Discussion
In the present study, we explored the correlation between the TyG index and HCC development in patients with LC. In addition, the TyG index is an independent risk factor for the development of HCC in patients with LC. Furthermore, a new model incorporating the TyG index was developed with high accuracy for predicting HCC development in patients with both DC and CC.
Typically, IR is one of the mechanisms underlying HCC development. IR increases the production of reactive oxygen species and oxidative stress in the liver. This may promote DNA damage and subsequent chromosomal instability, which can trigger liver cancer.17 In the immune microenvironment, HCC tumor cells also regulate the surrounding microenvironment by recruiting regulatory T cells and myeloid-derived suppressor cells and up-regulating immune checkpoints to induce immunosuppressive states.18 It is interesting to investigate the immune microenvironment in patients with and without IR. In previous studies, HOMA2-IR was found to be a reliable indicator of IR and was associated with the development and post-treatment recurrence of HCC.19 In the present study, the TyG index was a surrogate marker of IR and proved to be an independent risk factor for HCC in patients with LC. The TyG index is more convenient and easier to calculate than HOMA2-IR. Moreover, exercise is the major treatment for IR that reduces the occurrence of HCC.20 Whether exercise is an effective strategy to decrease HCC development in patients with DC remains a major concern.
The liver is a key organ for lipid metabolism and is involved in the synthesis of various lipoproteins, endogenous cholesterol, triglycerides, and apolipoproteins. Lipid and lipoprotein metabolism is impaired in patients with severe liver diseases such as DC and HCC.21 Changes in TG in HCC patients have been widely reported in patients with HCC. A recent study of HBV patients in a Korean population showed a negative association between HCC and elevated TG levels.22 In a large Korean study, TG was inversely associated with high HCC risk in patients with chronic viral hepatitis or LC,23 whereas another study reported that high TG levels were associated with high HCC risk in patients with HBV infection.24 Zhang et al reported that malic enzyme 2 (ME2) promoted HCC cell growth and migration by increasing TG levels.25 The role of TG levels in the HCC development remains controversial. We found no significant difference in TG levels between the HCC group and non-HCC group, suggesting that TG levels alone may not be a reliable indicator of HCC development in patients with LC. Our study demonstrated that the TyG index, which is a marker for insulin resistance, could well predict HCC development in patients with LC.
Accumulating evidence has shown that diabetes mellitus (DM) is a risk factor for hepatocellular carcinoma (HCC) development, recurrence, and death. Drugs for DM, such as metformin, can suppress carcinogenesis and improve HCC prognosis.26,27 Nonetheless, studies focusing on the interaction between DM and the different etiologies of HCC are warranted. Thus, based on the present study, the effects of hypoglycemic drugs on TyG index and HBV-related HCC should be explored further.
Nevertheless, this study had several limitations. First, this was a single-center study with a small sample size. Second, family history of HCC, baseline HBV DNA levels, and antiviral agents were not analyzed. Third, the TyG index is an independent risk factor for HCC development in patients with DC, but not in those with CC, indicating the importance of metabolic factors in patients at a high risk of HCC; however, the underlying mechanisms warrant further studies.
Conclusions
Patients with decompensated cirrhosis have a high risk of developing HCC, and the TyG index is an independent risk factor for HCC development.
Abbreviations
HCC, hepatocellular carcinoma; TyG, triglyceride-glucose; LC, liver cirrhosis; CC, compensated cirrhosis; DC, decompensated cirrhosis; LDL, low-density lipoprotein; HBV, hepatitis B virus; HCV, hepatitis C virus; IR, Insulin resistance; NAFLD, nonalcoholic fatty liver disease; HIV, human immunodeficiency virus; AFP, alpha-fetoprotein; CT, computed tomography; MRI, magnetic resonance imaging; FPG, fasting plasma glucose; ALT, alanine aminotransferase; AST, aspartate aminotransferase; TBil, total bilirubin; CHOL, total cholesterol; TG, triglyceride; ALB, albumin; WBC, white blood cell; PLT, platelet; INR, international normalized ratio; ROC, operating characteristics curve; Model (Age_DC_TyG_PLT_positive HBV DNA), a model consisting of age, decompensated cirrhosis, triglyceride-glucose, platelet, positive HBV DNA; DM, diabetes mellitus.
Data Sharing Statement
The datasets generated and/or analyzed during the current study are available from the corresponding author upon reasonable request.
Ethics Approval and Consent to Participate
This study was approved by the Ethics Committee of Changzhou Third People’s Hospital in accordance with the 2013 Declaration of Helsinki. All participants were informed about the purpose of the study.
Author Contributions
All authors made a significant contribution to the work reported, whether that is in the conception, study design, execution, acquisition of data, analysis and interpretation, or in all these areas; took part in drafting, revising or critically reviewing the article; gave final approval of the version to be published; have agreed on the journal to which the article has been submitted; and agree to be accountable for all aspects of the work. Su-hua Yang and Yi-shan He contributed equally to this study.
Funding
This study was supported by the 333 High-level Talents Project of Jiangsu Province (grant no. LGY2020032), and Science and Technology Project of Changzhou (Grant No. CE20225040), and Leading Talent of Changzhou “the 14th Five-Year Plan” High-Level Health Talents Training Project (2022CZLJ021).
Disclosure
All authors declare that there is no conflict of interest in this work.
References
1. Zhou M, Wang H, Zeng X, et al. Mortality, morbidity, and risk factors in China and its provinces, 1990–2017: a systematic analysis for the Global Burden of Disease Study 2017. Lancet. 2019;394(10204):1145–1158. doi:10.1016/S0140-6736(19)30427-1
2. Yang JD, Hainaut P, Gores GJ, et al. A global view of hepatocellular carcinoma: trends, risk, prevention and management. Nat Rev Gastroenterol Hepatol. 2019;16(10):589–604. doi:10.1038/s41575-019-0186-y
3. Zhu D-M, Xie J, Ye C-Y, et al. Risk of hepatocellular carcinoma remains high in patients with HBV-related decompensated cirrhosis and long-term antiviral therapy. Can J Gastroenterol Hepatol. 2020;2020:8871024. doi:10.1155/2020/8871024
4. Mao H-D, Zheng S-Q, Yang S-H, et al. A new model predicts hepatocellular carcinoma in patients with HBV-related decompensated liver cirrhosis and long-term antiviral therapy: a prospective study. PeerJ. 2023;11:e15014. doi:10.7717/peerj.15014
5. Zhao X, An X, Yang C, Sun W, Ji H, Lian F. The crucial role and mechanism of insulin resistance in metabolic disease. Front Endocrinol. 2023;14:1149239.
6. DeFronzo RA, Tobin JD, Andres R. Glucose clamp technique: a method for quantifying insulin secretion and resistance. Am J Physiol. 1979;237(3):E214–E223. doi:10.1152/ajpendo.1979.237.3.E214
7. Kim JH, Sinn DH, Gwak G-Y, et al. Insulin resistance and the risk of hepatocellular carcinoma in chronic hepatitis B patients. J Gastroenterol Hepatol. 2017;32(5):1100–1106. doi:10.1111/jgh.13647
8. Imai K, Takai K, Hanai T, et al. Homeostatic model assessment of insulin resistance for predicting the recurrence of hepatocellular carcinoma after curative treatment. Int J Mol Sci. 2019;20(3):605. doi:10.3390/ijms20030605
9. Ding X, Wang X, Wu J, et al. Triglyceride-glucose index and the incidence of atherosclerotic cardiovascular diseases: a meta-analysis of cohort studies. Cardiovasc Diabetol. 2021;20(1):76. doi:10.1186/s12933-021-01268-9
10. Wei Y, Guo J. High triglyceride-glucose index is associated with poor prognosis in patients with acute pancreatitis. Dig Dis Sci. 2023;68(3):978–987. doi:10.1007/s10620-022-07567-9
11. Xue Y, Xu J, Li M, et al. Potential screening indicators for early diagnosis of NAFLD/MAFLD and liver fibrosis: triglyceride glucose index-related parameters. Front Endocrinol. 2022;13:951689. doi:10.3389/fendo.2022.951689
12. Liu T, Zhang Q, Wang Y, et al. Association between the TyG index and TG/HDL-C ratio as insulin resistance markers and the risk of colorectal cancer. BMC Cancer. 2022;22(1):1007. doi:10.1186/s12885-022-10100-w
13. Shi H, Zhou L, Yang S, Zhou H. The relationship between Triglyceride and glycose (TyG) index and the risk of gynaecologic and breast cancers. Clin Nutr ESPEN. 2022;51:345–352.
14. Wang F, He T, Wang G, et al. Association of triglyceride glucose-body mass index with non-small cell lung cancer risk: a case-control study on Chinese adults. Front Nutr. 2022;9:1004179. doi:10.3389/fnut.2022.1004179
15. Chinese Society of Infectious Diseases, C.M.A. and C.M.A. Chinese Society of Hepatology. 中华医学会感染病学会分会, 中华医学会肝病学分会. 慢性乙型肝炎防治指南(2019年版) [The guidelines of prevention and treatment for chronic hepatitis B (2019 version)]. Zhonghua Gan Zang Bing Za Zhi. 2019;27(12):938–961. Chinese. doi:10.3760/cma.j.issn.1007-3418.2019.12.007
16. DeLong ER, DeLong DM, Clarke-Pearson DL. Comparing the areas under two or more correlated receiver operating characteristic curves: a nonparametric approach. Biometrics. 1988;44(3):837–845. doi:10.2307/2531595
17. Farrell G. Insulin resistance, obesity, and liver cancer. Clin Gastroenterol Hepatol. 2014;12(1):117–119. doi:10.1016/j.cgh.2013.07.040
18. Tu JF, Ding Y-H, Ying X-H, et al. Regulatory T cells, especially ICOS(+) FOXP3(+) regulatory T cells, are increased in the hepatocellular carcinoma microenvironment and predict reduced survival. Sci Rep. 2016;6(1):35056. doi:10.1038/srep35056
19. Wang J-H, Li W-F, Yong -C-C, et al. Liver stiffness and insulin resistance in predicting recurrence for early stage hepatoma patients after curative resection. Sci Rep. 2021;11(1):6041. doi:10.1038/s41598-021-85431-y
20. Baumeister SE, Schlesinger S, Aleksandrova K, et al. Association between physical activity and risk of hepatobiliary cancers: a multinational cohort study. J Hepatol. 2019;70(5):885–892. doi:10.1016/j.jhep.2018.12.014
21. Ni XC, Yi Y, Fu Y-P, et al. Role of lipids and apolipoproteins in predicting the prognosis of hepatocellular carcinoma after resection. Onco Targets Ther. 2020;13:12867–12880. doi:10.2147/OTT.S279997
22. Choe JW, Hyun JJ, Kim B, et al. Influence of metabolic syndrome on cancer risk in HBV carriers: a nationwide population based study using the national health insurance service database. J Clin Med. 2021;10(11):2401. doi:10.3390/jcm10112401
23. Cho Y, Cho EJ, Yoo -J-J, et al. Association between lipid profiles and the incidence of hepatocellular carcinoma: a nationwide population-based study. Cancers. 2021;13(7):1599. doi:10.3390/cancers13071599
24. Tan Y, Zhang X, Zhang W, et al. The influence of metabolic syndrome on the risk of hepatocellular carcinoma in patients with chronic hepatitis B infection in Mainland China. Cancer Epidemiol Biomarkers Prev. 2019;28(12):2038–2046. doi:10.1158/1055-9965.EPI-19-0303
25. Zhang S, Cheng Z-M, Yu J-L, et al. Malic enzyme 2 promotes the progression of hepatocellular carcinoma via increasing triglyceride production. Cancer Med. 2021;10(19):6795–6806. doi:10.1002/cam4.4209
26. Ono M, Fujita K, Kobayashi K, et al. Influence of diabetes mellitus and effectiveness of metformin on hepatocellular carcinoma. Hepatol Res. 2023;53(7):579–594. doi:10.1111/hepr.13912
27. Tsai PC, Kuo H-T, Hung C-H, et al. Metformin reduces hepatocellular carcinoma incidence after successful antiviral therapy in patients with diabetes and chronic hepatitis C in Taiwan. J Hepatol. 2023;78(2):281–292. doi:10.1016/j.jhep.2022.09.019
 © 2024 The Author(s). This work is published and licensed by Dove Medical Press Limited. The
full terms of this license are available at https://www.dovepress.com/terms
and incorporate the Creative Commons Attribution
- Non Commercial (unported, 3.0) License.
By accessing the work you hereby accept the Terms. Non-commercial uses of the work are permitted
without any further permission from Dove Medical Press Limited, provided the work is properly
attributed. For permission for commercial use of this work, please see paragraphs 4.2 and 5 of our Terms.
© 2024 The Author(s). This work is published and licensed by Dove Medical Press Limited. The
full terms of this license are available at https://www.dovepress.com/terms
and incorporate the Creative Commons Attribution
- Non Commercial (unported, 3.0) License.
By accessing the work you hereby accept the Terms. Non-commercial uses of the work are permitted
without any further permission from Dove Medical Press Limited, provided the work is properly
attributed. For permission for commercial use of this work, please see paragraphs 4.2 and 5 of our Terms.
Recommended articles
The Age, Gamma-Glutamyl Transpeptidase and Platelet Index: A Novel Noninvasive Model for Predicting Hepatocellular Carcinoma in Patients with Hepatitis B Virus-Related Liver Cirrhosis
Liu K, Huang Z, Yang S, Lin L, Zheng S, Zhang X, Xue Y, Xie W
Journal of Hepatocellular Carcinoma 2022, 9:1057-1063
Published Date: 8 October 2022
Neutrophil-to-Lymphocyte Ratio Can Distinguish Patients with Liver Cirrhosis from Healthy People but Cannot Distinguish Patients with Cirrhotic Hepatocellular Carcinoma from Patients with Liver Cirrhosis
Zhu X, Zhou H
Journal of Hepatocellular Carcinoma 2022, 9:1127-1136
Published Date: 29 October 2022
Prognosis of Primary Liver Cancer Based on LI-RADS Classification with Extracellular Agent-Enhanced MRI
Li Y, Ni X, Liu X, Yang C, Wang Y, Lu X, Zhou C
Journal of Hepatocellular Carcinoma 2023, 10:399-411
Published Date: 9 March 2023
TBX5 Variants are Associated with Susceptibility to and the Incidence of Liver Cirrhosis and Hepatocellular Carcinoma in the Chinese Population: A Multicenter and Follow-Up Study
Yao J, Mao X, Sun Q, Wu B, Yu W, Huang Y, Luo S, Zeng J, Lin J
Infection and Drug Resistance 2023, 16:2653-2665
Published Date: 2 May 2023
Triglyceride-Glucose Index is Significantly Associated with the Risk of Hyperuricemia in Patients with Nonalcoholic Fatty Liver Disease
Qi J, Ren X, Hou Y, Zhang Y, Zhang Y, Tan E, Wang L
Diabetes, Metabolic Syndrome and Obesity 2023, 16:1323-1334
Published Date: 8 May 2023