
Back to Journals » Degenerative Neurological and Neuromuscular Disease » Volume 15
TP73-AS1 Regulates MPP+-Induced Cell Inflammation and Apoptosis in SH-SY5Y Cells
Authors Zhang X  , Xue L, Li H, Yu X, Dou K, Xie A
Received 12 May 2025
Accepted for publication 29 August 2025
Published 5 September 2025 Volume 2025:15 Pages 81—94
DOI https://doi.org/10.2147/DNND.S539895
Checked for plagiarism Yes
Review by Single anonymous peer review
Peer reviewer comments 2
Editor who approved publication: Dr Thomas Müller
Xue Zhang,1,2 Li Xue,3 Haiyan Li,2 Xiaolong Yu,2 Kaixin Dou,1 Anmu Xie1
1Department of Neurology, Affiliated Hospital of Qingdao University, Qingdao, People’s Republic of China; 2Department of Neurology, Qingdao Central Hospital, University of Health and Rehabilitation Sciences, Qingdao, People’s Republic of China; 3Department of Internal Medicine, Affiliated Hospital of Qingdao University, Qingdao, People’s Republic of China
Correspondence: Anmu Xie, Department of Neurology, Affiliated Hospital of Qingdao University, No. 16 Jiangsu Road, Qingdao, Shandong, 266003, People’s Republic of China, Tel +86 532 82912336, Fax +8653282911999, Email [email protected]
Background: The aim was to investigate the potential role of TP73-AS1 in the pathogenesis of Parkinson’s disease.
Methods: Peripheral blood samples were obtained from three patients with early-onset Parkinson’s disease (PD), three patients with late-onset PD, and three healthy controls for the extraction of total RNA. Genomic long non-coding RNA (lncRNA) expression levels were analyzed using the Illumina HiSeq2500 sequencing platform. Quantitative real-time polymerase chain reaction (qRT-PCR) was used to study the expression of TP73-AS1. Flow cytometry and Western blot analyses were conducted to assess the functional role of TP73-AS1 in SH-SY5Y cells in vitro. Moreover, the expression of inflammatory cytokines, such as IL-16, IL-6, and α-synuclein (SYN), was examined using cellular immunofluorescence techniques.
Results: Among early-onset PD patients, 59 lncRNAs were significantly upregulated, and 57 lncRNAs were significantly downregulated compared to the control group. Similarly, late-onset PD patients showed 70 upregulated lncRNAs and 77 downregulated lncRNAs with statistical significance compared to the control group. In vitro studies indicated a significant increase in lncRNA TP73-AS1 expression in the MPP+-treated group in contrast with the control group (P < 0.001). Furthermore, the MPP+-treated group displayed elevated levels of Cleaved caspase-3, IL-16, as well as IL-6 (P < 0.001). Conversely, Bcl-2 expression decreased, Bax expression increased, and the Bax/Bcl-2 expression ratio demonstrated an increase (P < 0.001). Reducing lncRNA TP73-AS1 resulted in decreased apoptosis and inflammation, along with a decrease in α-SYN expression (P < 0.001). Notably, the absence of TP73-AS1 showed a protective effect against PD, suggesting it to be a potential target for the treatment of PD. These findings suggest that TP73-AS1 may serve as a potential molecular marker for the early diagnosis of PD, providing a new perspective for understanding the regulatory mechanisms of inflammation and apoptosis in PD.
Keywords: TP73-AS1, long non-coding RNA, apoptosis, inflammation, high-throughput sequencing
Introduction
Parkinson’s disease (PD) is characterized by the gradual degeneration of dopamine (DA) neurons in the substantia nigra (SN) and the accumulation of fibrillar α-synuclein (α-SYN) within Lewy bodies.1 This neurodegenerative disorder affects more than 1.2 million individuals in Europe and is primarily identified by the prominent symptom of tremor, although it can also manifest as motor retardation and various non-motor symptoms such as gastrointestinal dysfunction or sleep disorders.2 Despite extensive research efforts, the exact mechanisms responsible for the progressive loss of DA neurons in PD remain incompletely understood.
Attention has been drawn to non-coding RNAs as potential disease markers, owing to their presence and relative stability in blood. Non-coding RNA has been shown to be encapsulated within extracellular vesicles or exosomes, and they have been identified as pivotal regulators in diverse biological processes.2,3 Long non-coding RNAs (lncRNAs) are specifically characterized as RNA transcripts longer than 200 nucleotides. They do not encode proteins but instead intricately regulate gene expression through various mechanisms, primarily at the epigenetic level.4 High-throughput sequencing technologies have become crucial in genomics, epigenomics, and transcriptomics research. Leveraging the power of high-throughput sequencing technologies, our study focused on screening and identifying differentially expressed (DE) lncRNAs in blood samples from patients with PD. Through comprehensive bioinformatics analysis, our aim was to elucidate the interconnected signaling pathways and investigate the implications of lncRNA manipulation on inflammation, apoptosis, and α-SYN expression. This approach was aimed to provide novel insights into the possible involvement of lncRNAs in the pathological mechanisms underlying PD. Extensive research has been conducted on lncRNAs, attributing to their involvement in diverse human diseases and their regulatory functions in various biological events and cellular processes. Recently, the role of lncRNAs in the proper functioning of the central nervous system, including brain development, maturation, differentiation, neurogenesis, as well as nerve transmission, has been reported.5–7 Furthermore, a number of lncRNAs have been identified as pivotal regulatory molecules in the development of neurodegenerative diseases, including PD.3,8
TP73-AS1, located on human chromosome 1p36.32, functions as the antisense counterpart to the protein-coding gene TP73.9 TP73-AS1 covers a substantial segment of TP73, indicating its probable involvement in post-transcriptional regulation of TP73 gene expression. Elevated expression of TP73-AS1 has been observed in non-small cell lung cancer, esophageal squamous cell carcinoma, and gastric cancer, while its expression is decreased in bladder cancer.10–12 In lung cancer, TP73-AS1 has been shown to facilitate cancer progression by modulating the miR-27b-3p/LAPTM4B axis. Moreover, the suppressive impact of TP73-AS1 on cell proliferation and metastasis of lung cancer can be counteracted by depleting miR-27b-3p.11 Existing studies have demonstrated that lncRNAs can participate in the pathological processes of neurodegenerative diseases through interactions with key molecules in inflammatory pathways (such as NFκB and NLRP3) as well as apoptosis-related proteins (such as the Bcl-2 family).13 In combination with the fact that TP73-AS1 has been confirmed in tumor research to affect cell fate by regulating cytokine release and the expression of apoptosis-related genes, and that its neighboring gene TP73 (a member of the p53 family) plays an important role in neuronal survival and stress responses,14 it is suggested that TP73-AS1 may be involved in the regulation of neuroinflammation and apoptosis in PD through similar mechanisms. Furthermore, abnormalities in the lncRNA expression profiles in the peripheral blood of PD patients and cell models indicate the potential role of such molecules in PD pathology, providing a rational basis for the research on TP73-AS1.
This study was aimed to examine the influence of lncRNA TP73-AS1 on MPP+-induced neuronal injury in SH-SY5Y cells and its correlation with inflammatory and apoptotic proteins. The findings of the present study improved our understanding of the effect of TP73-AS1 on the progression of PD and establish a novel research framework. Moreover, this study might provide a promising therapeutic target for treating PD patients, potentially paving the way for innovative and effective therapeutic interventions in the management of PD.
Materials and Methods
Study Population
The rigorous protocol utilized in this study underwent a thorough review and approval by the Ethics Committee of the affiliated hospital of Qingdao University (QYFY WZLL27931). Written informed consent was obtained from each participant to ensure their voluntary and informed participation in the study, and was conducted in compliance with the principles outlined in the Helsinki Declaration. The recruitment process involved selecting a total of 6 patients with PD who met the diagnostic criteria established by the United Kingdom PD Society Brain Bank.15 These diagnostic criteria have been widely recognized and applied in clinical practice. Importantly, the PD patients selected for this study did not have a family history of PD, secondary PD, or any other neurological or psychiatric disorders. The recruitment of PD patients took place at the Neurology Department of the Affiliated Hospital of Qingdao University from January 2015 to November 2018. Exclusion criteria for study participation included a family history of known neurodegenerative disorders. By strictly adhering to these criteria and ensuring the confidentiality of participant information, the study aimed to obtain reliable data for subsequent analysis and interpretation.
RNA Sequencing
Total RNAs were extracted from the peripheral blood of both PD patients and the control group. The concentration of RNA in the samples was quantified using the Qubit® RNA Assay Kit (Thermo Fisher Scientific, Waltham, MA). After quantification, the RNA underwent reverse transcription to produce complementary DNAs (cDNAs). Subsequently, the RNA was fragmented and purified to construct libraries for sequencing. The quality of the RNA samples was evaluated using the RNA Nano 6000 Assay Kit on the Agilent Bioanalyzer 2100 system (Agilent Technologies, CA), which provides precise and reliable information on the integrity and size distribution of the RNA molecules. To perform transcriptome profiling, high-throughput sequencing was carried out using the HiSeq 2500 sequencing platform (Illumina), enabling efficient and precise sequencing of the RNA molecules. This comprehensive approach allowed for a comprehensive analysis of the transcriptome, aiding in the identification of differentially expressed genes (DEGs), further offering valuable insights into the molecular changes associated with the experimental conditions under investigation.
Kyoto Encyclopedia of Genes and Genomes (KEGG) Pathway Analysis
The KEGG is a valuable repository of biological knowledge that facilitates the analysis and interpretation of complex molecular functions and biological systems across various levels, including cellular, organismal, and ecological contexts.15 This resource integrates diverse data sources, such as genomic sequencing and other high-throughput experimental data, to provide comprehensive insights into the intricate interactions of genes and the genome. In this study, Fisher’s exact test was used to identify DEGs, with a p-value threshold of less than 0.05 considered the criterion for determining statistical significance in the context of KEGG pathway enrichment analysis.
Cell Culture and Transfection
The human neuroblastoma cell line SH-SY5Y was obtained from the Chinese Academy of Sciences Cell Bank (Shanghai, China). The cells were cultured in Dulbecco’s modified Eagle medium (DMEM) (Thermo Fisher Scientific, Waltham, MA, USA) supplemented with 10% fetal bovine serum, 100 U/mL penicillin, and streptomycin (Thermo Fisher Scientific). They were maintained in a humidified incubator with 5% CO2 at 37°C. To establish an in vitro model of PD, SH-SY5Y cells were treated with various concentrations of the MPP+ reagent (sigma-Aldrich) for 24 hours. MPP+ is commonly used as a toxin to induce PD-like pathology in cell culture models. In the gene knockdown experiments, siRNA specific to TP73-AS1 (si-TP73-AS1) and a siRNA negative control (si-NC) were synthesized by OBiO Technology (Shanghai) Corp., Ltd. Cell transfection was conducted utilizing Lipofectamine™ 2000 (Invitrogen) complying with the protocols provided by the manufacturer. When the cell confluence reached 50%-60%, lentivirus with a multiplicity of infection (MOI) of 40 was added, along with 5 μg/mL Polybrene to enhance infection efficiency. After 24 hours of culture, the medium was replaced with fresh medium. The cells were further cultured for 48–72 hours, and then qRT-PCR was used to verify the infection efficiency and gene silencing effect. The siRNA sequence designed to target TP73-AS1 was CCGAGGGAACATCCAGAAT, while the control sequence used was CCTAAGGTTAAGTCGCCCTCG. Transfection with si-TP73-AS1 aimed to reduce TP73-AS1 expression, while si-NC served as a control to address any non-specific effects of siRNA transfection.
CCK-8 Assay for Cell Proliferation Rate
SH-SY5Y cells were seeded in a 96-well plate at a density of 2.5×10⁴cells per well. After treatment according to group settings, 10 μL of CCK-8 solution was added to each well, and the plate was incubated in the incubator for 2 hours. The absorbance of each well was measured at a wavelength of 450 nm using a microplate reader. The cell proliferation rate was calculated using the following formula: Cell proliferation rate = [(Absorbance of experimental well - Absorbance of blank well) / (Absorbance of control well - Absorbance of blank well)] × 100%.
Quantitative Reverse Transcriptase Polymerase Chain Reaction (qRT-PCR)
The isolation of total RNA was performed using the Trizol reagent (Qiagen, Germany) complying with the protocols provided by the manufacturer. After RNA extraction, cDNA synthesis was achieved with a reverse transcription kit (Kangwei, China) to convert RNA into complementary DNA (cDNA). Subsequently, qPCR analysis was conducted using the TaqMan Fast Advanced Master Mix (Thermo, USA) as instructed. The PCR cycling conditions included an initial denaturation step at 95°C for 3 minutes, followed by 45 amplification cycles consisting of denaturation at 95°C for 15 seconds, annealing at 60°C for 20 seconds, extension at 72°C for 20 seconds, and a final extension at 78°C for 20 seconds. The specific primer sequences used for qPCR were as follows: TP73-AS1: Forward: 5’-GCGGGATCTCACAGGCTTTA-3’; Reverse: 5′-GGTGAAGGTGTCCAGGGC-′; GAPDH: Forward: 5′-GTCAACGGATTTGGTCTGTATT-3′; Reverse: 5′-AGTCTTCTGGGTGGCAGTGAT-3′. The qPCR analysis enabled the quantification of gene expression levels in the samples.
Flow Cytometry
To assess cell apoptosis, an APC Annexin V-PI Apoptosis Detection kit (Biolegend) was used. Cells from each experimental group were collected and treated gently with EDTA-free trypsin for detachment. Following centrifugation at 270 × g for 5 minutes, cells were washed twice with PBS. Subsequently, the cells were suspended in binding buffer and combined with 5 µL of APC Annexin V and 10 µL of propidium iodide (PI) staining solution. The cell suspension was then incubated at 2–8°C in the dark for 10 minutes for staining. The apoptotic rates of cells were assessed using a MOFLO XDP flow cytometer (Beckman). The flow cytometer detected the fluorescence emitted by the labeled Annexin V and PI, enabling the identification and quantification of apoptotic cells. The data obtained from the flow cytometry analysis were analyzed using FlowJo software version 10.0. The apoptotic rates were determined based on the proportion of Annexin V-positive and PI-positive cells, with each experiment independently replicated three times for each group.
Western Blotting (WB)
After the designated treatment, SH-SY5Y cells were harvested and sonicated in RIPA lysis buffer to extract cellular proteins. Subsequently, the protein lysates were separated on 14% sodium dodecyl sulfate-polyacrylamide gels using gel electrophoresis. Once separated, the proteins were transferred onto polyvinylidene fluoride membranes. To reduce non-specific binding, the membranes were blocked for 90 minutes with 5% skim milk. After blocking, each membrane underwent overnight incubation at 4°C with primary antibodies targeting specific proteins: Bax (dilution 1:1000, ab182734, Abcam), Bcl-2 (dilution 1:1000, #3498, CST), cleaved caspase-3 (dilution 1:1000, ab2302, Abcam), α-SYN (dilution 1:1000, ab212184, Abcam), and β-actin (dilution 1:10000, sc-58673, Santa Cruz Biotechnology). These primary antibodies bound specifically to their respective target proteins. Subsequently, the membranes were probed for 1 hour at 25°C with a horseradish peroxidase-conjugated secondary antibody (from Santa Cruz Biotechnology). The secondary antibody, conjugated with horseradish peroxidase, selectively bound to the primary antibodies attached to the target proteins, aiding in the detection process. Densitometry analysis was conducted using ImageJ software.
Immunofluorescence (IF) Double Staining
Cells were seeded in a 12-well dish at a density of 1×10⁶ cells/mL. Following the incubation period, the cells were fixed with 4% paraformaldehyde for a duration of 10 minutes at room temperature and permeabilized with 0.25% Triton X-100 for 10 minutes. Cold phosphate-buffered saline (PBS) rinses were performed between each step to eliminate residual solvents. Following one hour blocking step with Blocking Buffer (Solarbio, Beijing, China), cells were subjected to overnight incubation at 4°C with IL16 antibodies (1:500, ab180792, Abcam) and IL-6 antibodies (1:100, ab214429, Abcam). After incubated, the cells were washed and then exposed to Alexa Fluor® 488-conjugated goat anti-rabbit IgG (1:200, ab150077, Abcam) for 1 hour under light protection. Protein fluorescence density was observed using a confocal fluorescence microscope, and the relative fluorescence intensity was measured using Image J software. For each group, the relative fluorescence intensity of the 5 fields of view was averaged to obtain the final value, which was used for statistical analysis.
Statistical Analysis
The data analysis was conducted using Prism software (GraphPad Software, Inc., La Jolla, CA). Data are presented as mean ± standard deviation (SD) from 3 independent biological replicates. Group comparisons were carried out using Student’s t-test or one-way analysis of variance (ANOVA), followed by Tukey’s post hoc test for multiple comparisons. The significant differences in LncRNAs among early-onset and late-onset PD patients, as well as healthy control subjects were assessed using EdgeR software. Statistical significance was defined as p < 0.05 for all tests.
Results
Differential Expression Analysis of lncRNAs in Patients with Early-Onset PD, Late-Onset PD, and Healthy Controls
High-throughput sequencing techniques were adopted to identify the DE lncRNAs in individuals diagnosed with early-onset PD, late-onset PD, and control group of healthy individuals. The demographic data for both the PD patients and controls are presented in Table 1. There were no significant differences in age, gender or education level between Early-onset PD group and Late-onset PD group and Controls.
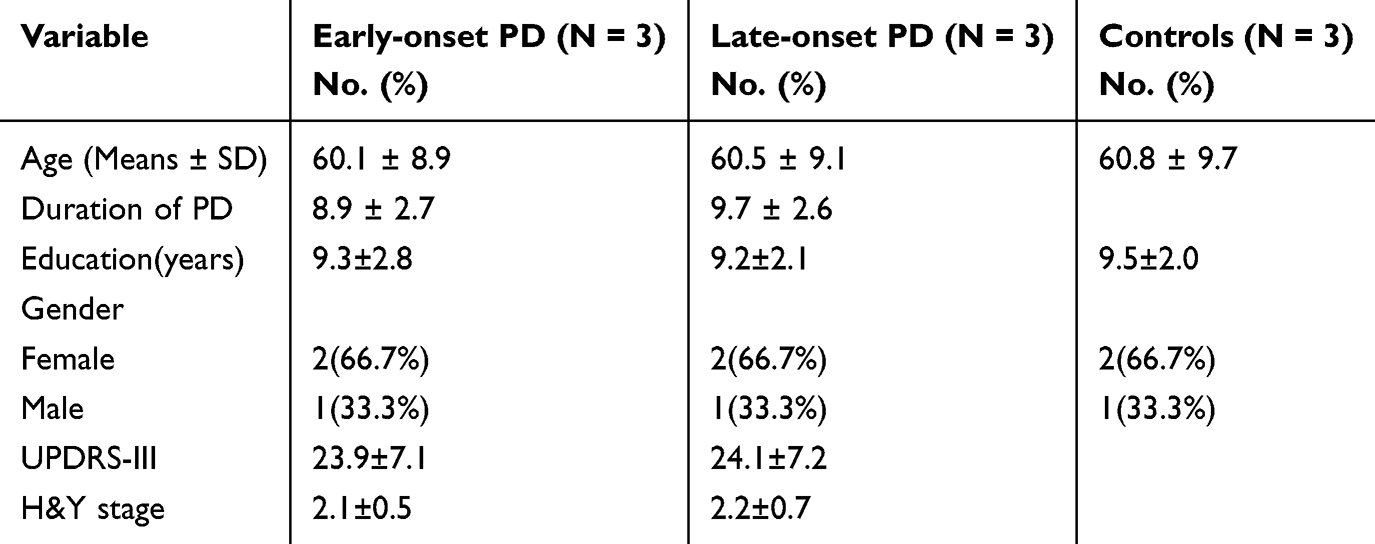 |
Table 1 Characteristics of the PD Patients and Health Control Subjects |
Our analysis revealed a total of 22,793 lncRNAs in early-onset PD patients compared to the controls (P < 0.05), consisting of 57 downregulated transcripts and 59 upregulated transcripts. For late-onset PD patients, 36,413 lncRNA transcripts were identified compared to the control group. Among these, 70 lncRNAs were significantly upregulated, and 77 lncRNAs were significantly downregulated in late-onset PD patients. Moreover, in the comparative analysis between late-onset PD patients and early-onset PD patients, a total of 36,252 lncRNA transcripts were identified. Among these, 55 lncRNAs showed significant upregulation, while 52 lncRNAs displayed significant downregulation in the late-onset PD group. The heatmap and volcano plot were used to illustrate the lncRNAs (Figure 1). These results demonstrated the distinct expression patterns of lncRNAs across various subsets of PD patients, providing insights into the potential roles of these transcripts in the pathogenesis and progression of PD.
 |
Figure 1 Analysis of differentially expressed lncRNAs in patients with Early-Onset PD, Late-Onset PD, and Healthy Controls. Notes: (A) Heatmap demonstrated distinct expression of lncRNAs among early-onset PD, late-onset PD, and healthy controls. (B) Volcano plot depicted the differentially expressed lncRNAs between early-onset PD and healthy controls. (C) Volcano plot illustrated the differentially expressed lncRNAs between late-onset PD and healthy controls. (D) Volcano plot showed the differentially expressed lncRNAs between late-onset PD and early-onset PD. The red and green points represented lncRNAs with statistical significance (fold change > 1.3, p < 0.05). |
KEGG Pathway Analysis
We conducted KEGG pathway analysis to examine the DE lncRNAs in patients with early-onset PD and late-onset PD compared to the control group. The KEGG pathway analysis indicated significant involvement of both early-onset and late-onset PD patients in the PI3K-Akt signaling pathway in contrast with the controls (Figure 2). These results provided valuable insights into the exploration of signaling pathways in early-onset and late-onset PD.
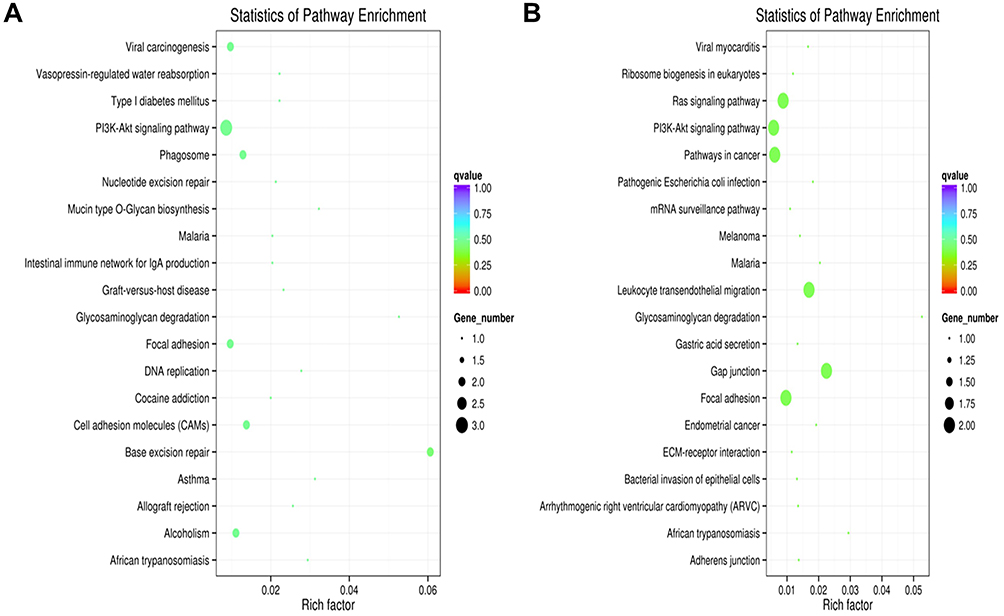 |
Figure 2 KEGG Pathway Analysis. Notes: (A) KEGG pathway analysis showed the pathways associated with differentially expressed LncRNAs between early-onset PD and the control group. (B) KEGG pathway analysis illustrated the pathways linked to differentially expressed LncRNAs in late-onset PD compared to the control group. |
Validation and Characterization of LncRNA TP73-AS1
qRT-PCR was conducted to validate the expression of the lncRNA TP73-AS1 in an in vitro PD model, and the results demonstrated the stability of the TP73-AS1 amplification system and the internal reference gene GAPDH. Specifically, in contrast with the control group, the lncRNA TP73-AS1 expression was increased in the MPP+ treatment group with statistical significance (P < 0.001). Notably, when the concentration of MPP+ was 1 mmol/L, the upregulation of TP73-AS1 expression showed a statistical difference (Figure 3A). To induce Parkinson’s disease (PD) in the in vitro model, SH-SY5Y cells were maintained under conditions of different concentrations of MPP+ (0, 0.25, 0.5, 0.75, 1.0, 1.25mmol/L) and different time durations to determine the moderately effective conditions. As shown in the Figure 3B, we observed that the cell viability of SH-SY5Y cells gradually decreased with the increase of MPP+concentration and the extension of culture time. Compared with the control group, after treatment with 1.0 mmol/L MPP+for 24 hours, the cell survival rate decreased, and the difference was statistically significant (***P < 0.001). However, after treatment with 1.25 mmol/L MPP+for 48 hours and 72 hours, the cell survival rate decreased to less than 50%. Based on these findings, the role of TP73-AS1 in the pathogenesis of PD was further validated, highlighting its potential as a regulatory target in PD patients.
 |
Figure 3 Changes in the expression of lncRNA TP73-AS1. Notes: (A) Expression of TP73-AS1 in SH-SY5Y cells treated with different concentrations of MPP+. (B) Cell viability was analyzed using the CCK-8 assay (n = 3). Data were presented as the mean ± SD, statistical significance: ***P<0.001. ^^^P<0.001. |
Knockdown of lncRNA TP73-AS1 Promoted Apoptosis in Patients with PD
To further explore the potential function of lncRNA TP73-AS1, we compared the expression levels of transfected lentiviral siRNA targeting lncRNA TP73-AS1 with those of the normal control group. It was observed that the knockdown efficiency of lncRNA TP73-AS1 reached 82% after transfection with the lentiviral vector. Additionally, to assess the impact of lncRNA TP73-AS1, we conducted flow cytometry to investigate apoptosis in SH-SY5Y cells. The results showed a significantly higher apoptosis rate in the si-NC+MPP+ group compared to the NC group ***P<0.001), indicating that MPP+ treatment induced apoptosis in SH-SY5Y cells. Furthermore, the apoptosis rate in the si-TP73-AS1+MPP+ group was higher than in the si-TP73-AS1 group with statistical significance ###P<0.001) (Figure 4). Notably, compared to the si-NC +MPP+ group, TP73-AS1 knockdown also significantly reduced the apoptosis of SH-SY5Y cells, suggesting a potential protective effect of TP73-AS1 depletion against MPP+-induced apoptosis.
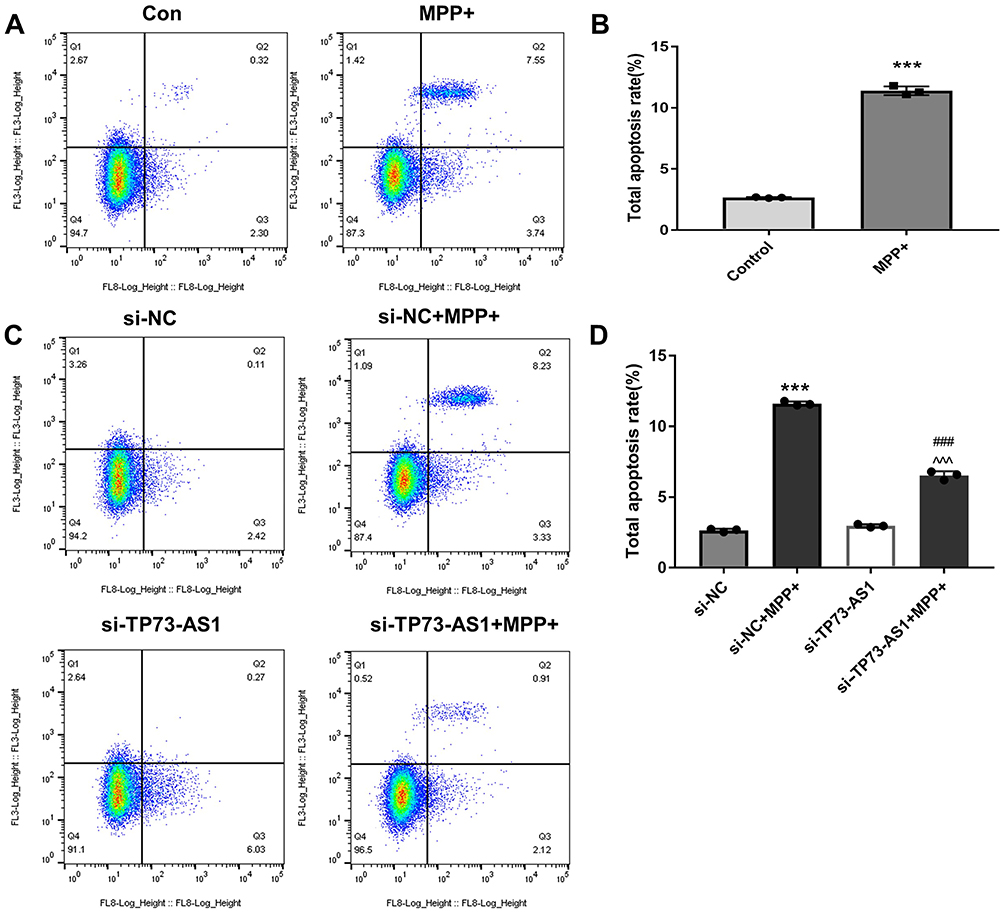 |
Figure 4 Cell apoptosis was assessed by Flow Cytometry. Notes: (A and C) Flow cytometry showed the percentages of live cells (Q4), early apoptotic cells (Q3), late apoptotic cells (Q2), and necrotic cells (Q1). (B and D) Comparison of apoptotic rates across different groups. The data are presented as mean ± SEM (n = 3). Compared with Con group, ***P<0.001; Compared with si-TP73-AS1 group, ###P<0.001; Compared with si-NC+MPP+ group, ^^^P<0.001. |
Knockdown of lncRNA TP73-AS1 Reduced the Level of α-SYN in Patients with PD
Both IF and WB analyses demonstrated the increased α-SYN expression within the PD group in contrast with the controls (t =38.97, 30.85, both P < 0.001). It indicated the successful establishment of the PD model and underscored the elevated α-SYN expression as a characteristic feature of PD. Moreover, after transfection with small interfering RNA, the results of IF and WB analyses showed that there were statistically significant differences in the expression of α-synuclein among the four groups (F = 536.1, 649.8, both P < 0.001). Compared to the si-NC group, the relative expression of α-SYN protein increased within the si-NC +MPP+ treatment group (***P < 0.001). Additionally, compared to the si-TP73-AS1 group, the α-SYN protein expression increased within the si-TP73-AS1 +MPP+ group (^^^P < 0.001). However, when comparing the si-TP73-AS1 +MPP+ group to the si-NC +MPP+ group, the α-SYN protein expression decreased (###P < 0.001) (Figure 5). These findings collectively suggest that lncRNA TP73-AS1 might be related with the regulation of α-SYN expression as well as the pathogenesis of PD.
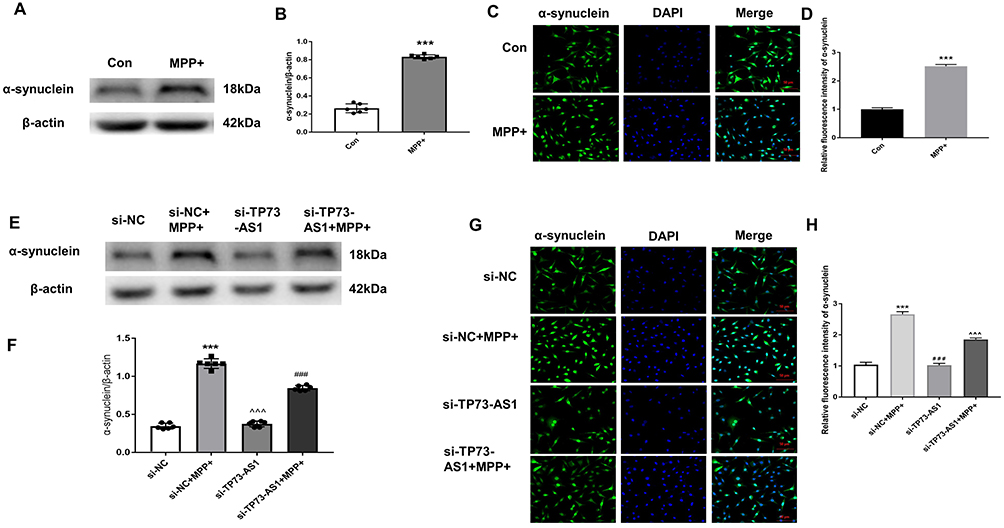 |
Figure 5 Expression of α-synuclein in different groups. Notes: A-synuclein expression analysis by immunofluorescence (C and G) and Western blot (A and E) Quantitative analysis of the level of α-synuclein in different groups (B, F, D, H) (n = 3). Immunofluorescence staining demonstrated the α-synuclein (green) expression, with DAPI indicating nuclei (blue) (Scale bar = 50 μm). Compared with Con group, ***P<0.001; Compared with si-NC +MPP+ group, ###P<0.001; Compared with si-TP73-AS1 group, ^^^P<0.001. Scale bar = 50 μm. |
Expression of Apoptosis-Related Proteins
In Figure 6, WB was used to analyze changes in apoptosis-related proteins, revealing a significant increase in the expression levels of the pro-apoptotic proteins Bax as well as Cleaved caspase-3 in the MPP+-treated cells in contrast with the control group (t =18.62, 17.54, both P < 0.001). Additionally, after transfection with small interfering RNA, the results of WB analyses showed that there were statistically significant differences in the Bax/Bcl-2 ratio and cleaved caspase-3 protein among the four groups (F = 202.3, 317.8, both P < 0.001). We observed that the Bax/Bcl-2 ratio in the si-NC+MPP+ group was significantly higher than that in the si-NC group (***P < 0.001). Similarly, the Bax/Bcl-2 ratio was significantly increased in the si-TP73-AS1+MPP+ group compared to the si-TP73-AS1 group (^^^P < 0.001). Moreover, in contrast with the si-NC+MPP+ group, the Bax/Bcl-2 ratio in the si-TP73-AS1+MPP+ treated group was significantly reduced (###P < 0.001). Additionally, the relative protein expression levels of cleaved caspase-3 were significantly higher in the si-NC+MPP+ group in contrast with the si-NC group (***P < 0.001). Similarly, the cleaved caspase-3 protein expression was significantly increased in the si-TP73-AS1+MPP+ group compared to the si-TP73-AS1 group (^^^P < 0.001). Notably, in contrast to the si-NC+MPP+ group, the cleaved caspase-3 protein expression level was significantly lower in the si-TP73-AS1+MPP+ group (###P < 0.001). In summary, these findings suggest that the genetic knockdown of TP73-AS1 might mitigate apoptosis among SH-SY5Y cells, potentially by regulating the Bax/Bcl-2 ratio and the expression of cleaved caspase-3. These results underscored the intricate interaction between pro-apoptotic and anti-apoptotic proteins, shedding light on the delicate balance crucial for cellular survival.
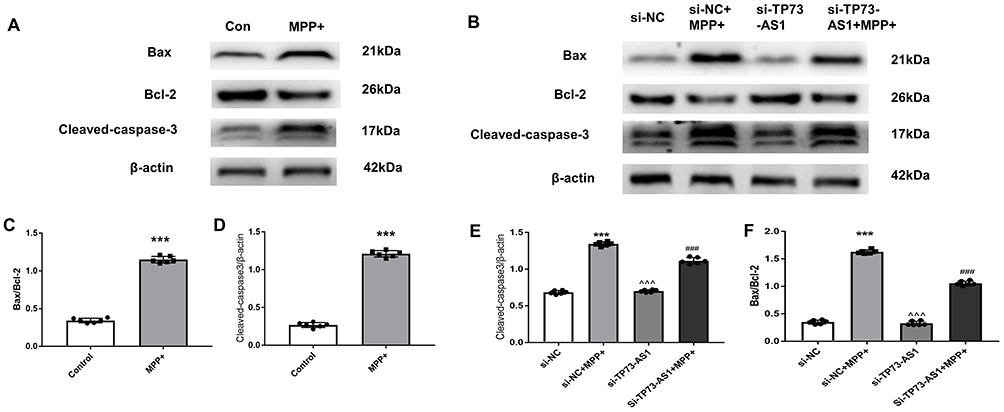 |
Figure 6 The expression of Bax/Bcl-2 and Cleaved caspase-3 protein in different groups. Notes: (A and B) Western blot analysis of Bax/Bcl-2 and Cleaved caspase-3 protein in different group. (C–F) Quantitative analysis of changes in the Bax/Bcl-2 ratio and cleaved caspase-3 expression. The data are presented as mean ± SEM (n = 3). Compared with Con group, ***P<0.001; Compared with si-NC +MPP+ group, ###P<0.001; Compared with si-TP73-AS1 group, ^^^P<0.001. |
Knockdown of lncRNA TP73-AS1 Reduced the Level of IL-16 and IL-6 in Patients with PD
In Figure 7, this study investigated the expression levels of inflammatory cytokines IL-16 and IL-6 in response to MPP+ treatment in SH-SY5Y cells. The results showed a increase in the expressions of IL-16 as well as IL-6 in the MPP+-treated group with statistical significance in contrast with the control group, indicating the initiation of an inflammatory response (***P < 0.001). IF analysis was used to investigate the influence of lncRNA TP73-AS1 on the expression of IL-16 and IL-6 in SH-SY5Y cells. Relative to the si-NC group, the expression of IL-16 and IL-6 proteins, as indicated by the relative fluorescence intensity, was higher in the si-NC +MPP+ group (***P < 0.001), suggesting an upregulation of inflammatory cytokines in response to MPP+ treatment. Similarly, when comparing with si-TP73-AS1 group, the relative fluorescence intensity of IL-16 and IL-6 proteins was increased in the si-TP73-AS1+MPP+ group (###P < 0.001). This suggests that lncRNA TP73-AS1 might influence the expression of inflammatory factors. Moreover, when comparing the si-NC+MPP+ group with the si-TP73-AS1+MPP+ group, the relative fluorescence intensity expression of IL-16 and IL-6 proteins was decreased in the si-TP73-AS1+MPP+ group (^^^P < 0.001). This indicates that the knockdown of TP73-AS1 might result in a decrease in the expression of inflammatory cytokines, potentially providing a protective effect against inflammation in PD.
 |
Figure 7 The expression of IL-16 and IL-6 in different groups. Notes: (A and D) Immunofluorescence images showed the expression of IL-16 (red) and IL-6 (yellow) fluorescent proteins, with DAPI indicating nuclei (blue)(Scale bar = 50 μm). (B and E) Statistical analysis of the relative fluorescence intensity of IL-16 protein across different groups (n = 3). (Compared with Con group, ***P<0.001; Compared with si-NC +MPP+ group, ###P<0.001; Compared with si-TP73-AS1 group, ^^^P<0.001.). (C and F) Statistical analysis of the relative fluorescence intensity of IL-6 protein between groups (n = 3). (Compared with Con group, ***P<0.001; Compared with si-NC+MPP+ group, ###P<0.001; Compared with si-TP73-AS1 group, ^^^P<0.001.). |
Discussion
PD is a complex and heterogeneous neurodegenerative disorder in which α-SYN plays a central role in the degeneration of neurons and functional impairments in both the central and peripheral nervous systems.16,17 It significantly affects a population of approximately 1 billion individuals aged 65 or older. Despite the identification of various risk factors and clinical indicators for the symptomatic motor phase of PD, reliable biomarkers are currently lacking for the early stages of PD that can accurately predict disease progression.2 Chronic neuritis, characterized by increased expression of pro-inflammatory cytokines such as IL-6, TNF-α, and IL-1β in the striatal region of the brain, has been recognized as a pathophysiological marker of PD.18 The activation of the immune system has emerged as a crucial element in the pathogenesis of PD.
In this study, KEGG pathway analysis revealed that both early-onset and late-onset PD patients are significantly involved in the PI3K-Akt signaling pathway, suggesting that this pathway may play a crucial role in the pathological process of PD. As an important intracellular signal transduction pathway, the PI3K-Akt signaling pathway is widely involved in regulating various biological processes such as cell survival, proliferation, metabolism, and apoptosis, and holds a central position particularly in the survival and functional maintenance of neurons.19 In the pathological mechanism of PD, abnormal activation or inhibition of this pathway is closely associated with the degeneration of dopaminergic neurons. Studies have shown that activation of the PI3K-Akt pathway can protect neurons from damage by inhibiting the release of pro-apoptotic factors and enhancing antioxidant stress capacity, while its downregulation may exacerbate mitochondrial dysfunction, promote α-SYN aggregation and neuroinflammatory responses, and accelerate the progression of PD.20
α-SYN, a key protein involved in PD, undergoes structural changes, adopting a β-lamellar structure, and then polymerizes to form toxic soluble oligomers and longer fibers. These aggregates accumulate in Lewy bodies, contributing to neurodegeneration. Moreover, α-SYN activates intracellular ERK and P38-MAPK signaling pathways, leading to NFκB-dependent gene transcription and activation of the NLRP3 inflammasome, resulting in the production of pro-inflammatory signals.21 Additionally, extracellular α-SYN prompts the release of pro-inflammatory cytokines and oxidative stress, leading to neurodegeneration. Interleukin 16 (IL-16), initially identified as a chemokine specific to CD4+ T lymphocytes, is involved in modulating the chemotactic activity and differentiation of macrophages, monocytes, and mast cells.22 Under pathological conditions, IL-16 may be related with the inflammatory response by increasing intracellular calcium levels, inositol triphosphate production, protein kinase C translocation, and the release of pro-inflammatory cytokines such as IL-1β, IL-6, alongside TNF-α, all of which are related with the pathogenesis of PD. In the present study, we confirmed the increased expression of the inflammatory factors IL-16 and IL-6 among MPP+-treated SH-SY5Y cells, providing further evidence of immune activation in the progression of PD.
Apoptosis, a crucial form of cell death in PD, is primarily characterized by the intricate regulation of bcl-2/bax expression, mitochondrial cytochrome c (cyt-c) release, and caspase-3 activation.23 The well-established canonical pathway of apoptosis, triggered by oxidative stress-induced mitochondrial dysfunction, has been extensively described in the literature. Bcl-2, a key member of the anti-apoptotic protein family, plays a significant role in maintaining mitochondrial membrane integrity. In contrast, Bax, the primary protein in the pro-apoptotic family, disrupts the integrity of mitochondrial membrane. This disruption results in the release of apoptotic factors like cytochrome c into the cytoplasm, activating caspase-3 and ultimately resulting in cell death.24 Studies have reported variations in the expression levels of Bcl-2 and Bax proteins, along with increased caspase-3 activity, in dopaminergic neurons of the substantia nigra in individuals with PD and animal models induced with 6-hydroxydopamine (6-OHDA).25 In our research, exposure to MPP+ resulted in an increase in the pro-apoptotic protein Bax and a decrease in the anti-apoptotic protein Bcl-2. Consequently, there was an increase in the Bax/Bcl-2 ratio, indicating a shift towards pro-apoptotic signaling. Additionally, a significant increase in the expression of cleaved caspase-3 was observed, suggesting heightened caspase-3 activity and the initiation of apoptotic processes. These findings were consistent with previous research and support the established knowledge in this field. Importantly, our findings demonstrated that the downregulation of TP73-AS1 significantly reduced the expression of Bax and cleaved caspase-3 while increasing the expression of Bcl-2 in in vitro PD models. Thus, the impact of TP73-AS1 on MPP+-induced apoptosis appears to be, at least partially, mediated through the regulation of the Bax/Bcl-2 ratio and caspase-3. Interactions between pro-apoptotic and anti-apoptotic members of the Bcl-2 family might determine cell fate by influencing mitochondrial membrane permeability and controlling the release of mitochondrial cytochrome C. Upon release into the cytoplasm, cytochrome C can associate with apoptotic effectors such as APAF-1 and Proaspase-9, initiating the activation of caspase-9 and subsequently caspase-3.
lncRNAs play regulatory roles in various cellular processes, including transcriptional and post-transcriptional gene expression. They also modulate the activity of nearby genes, representing a significant class of functional RNA molecules that contribute to both health and disease.26,27 Research has uncovered complex interactions where lncRNAs engage with DNA, RNA, and proteins, actively participating in processes such as histone modification and chromatin remodeling, thereby influencing various cellular biological processes. The aberrant expression of lncRNAs has been extensively documented across a range of diseases, particularly in neurodegenerative conditions like PD, Alzheimer’s disease, and Huntington’s disease. Situated on chromosome 1p36, the gene encoding TP73-AS1 overlaps approximately 200 base pairs with the 3’ untranslated region of its neighboring gene TP73, transcribed independently from its own promoter on the (+) chain.28 P73, a member of the p53 transcription factor family, plays a pivotal role in diverse biological processes, including brain development and tumorigenesis, notably in medulloblastoma.29 Studies have shown that TP73-AS1 is significantly upregulated in NPC tissues and cell lines compared to normal controls, mediating migration and invasion of NPC cell line (CNE-2) cells by upregulating junctional adhesion molecule A.30 Recent investigations have identified abnormal expression patterns of lncRNA in individuals with PD, implicating lncRNA in significant regulatory roles during the onset and progression of PD. High-throughput sequencing analysis in this study revealed that individuals with early-onset PD displayed 59 significantly upregulated LncRNAs and 57 significantly downregulated LncRNAs compared to the control group. Late-onset PD patients exhibited 70 significantly upregulated LncRNAs and 77 significantly downregulated LncRNAs compared to the control group. Additionally, a notable increase in TP73-AS1 expression was observed when the MPP+ concentration reached 1mmol/l. Silencing TP73-AS1 resulted in a significant reduction in α-SYN protein expression, suggesting a potential protective effect against PD. Furthermore, the knockdown of TP73-AS1 significantly decreased the expression of IL-16 and IL-6 proteins, resulting in reduced inflammation levels in vitro.
However, it is important to acknowledge some limitations in this study. Firstly, the recruitment of participants from a single center may limit the generalizability of the findings to a more diverse population of PD patients across various geographic regions. Moreover, current results remain based on cellular models. Future work will validate in vivo functionality using PD animal models (eg, MPTP-induced mouse models) and expand clinical cohorts to confirm clinical relevance, laying a foundation for translational medical research. In summary, this study used high-throughput sequencing to comprehensively analyze the expression profiles of lncRNAs in the peripheral blood of PD patients from the northern Han region, comparing them with healthy controls. The results shed light on the dysregulation of LncRNAs and their potential involvement in various biological and pathological processes associated with PD development. Exploring the potential functional connections in PD revealed that the dysregulation of LncRNA expression is intricately intertwined with a spectrum of multifaceted biological and pathological processes. The biological insights and functional implications derived from this study may have significantly enhanced our understanding of PD development.
In summary, the abnormal expression of TP73-AS1 in MPP+-induced SH-SY5Y cells underscored its pivotal role in the early detection of PD. Furthermore, the findings of this study indicated that inhibiting TP73-AS1 expression could mitigate inflammatory and apoptotic responses, providing potential insights into the onset and progression of PD. The patterns identified lay a theoretical foundation for the early diagnosis and management of PD. Nevertheless, further research was warranted to delve into the intricate mechanisms underlying these observed effects.
Data Sharing Statement
The datasets generated during and/or analyzed during the current study are available from the corresponding author on reasonable request.
Ethical Approval
The rigorous protocol employed in the present study was reviewed and approved by the Ethics Committee of the affiliated hospital of Qingdao University (QYFY WZLL27931). Written informed consent was obtained from each participant, ensuring their voluntary and informed participation in the study.
Acknowledgment
We would like to appreciate the funds from Natural Science Foundation of China (81971192) and Natural Science Foundation of Qingdao Municipality (23-2-1-130-zyyd-jch).
Author Contributions
Study design: XZ, HYL; experiment implementation and data acquisition: LX, KXD; data analysis: XZ, XLY; manuscript draft: XZ; manuscript review: AMX. All the authors read and approved the final version of manuscript.
Disclosure
The authors declare that they have no conflicts of interest in this work.
References
1. Bezard E, Dehay B. Aggregation and spread of synuclein in Parkinson’s disease. Med Sci. 2022;38(1):45–51. doi:10.1051/medsci/2021241
2. Bloem BR, Okun MS, Klein C. Parkinson’s disease. Lancet. 2021;397(10291):2284–2303. doi:10.1016/S0140-6736(21)00218-X
3. Wu YY, Kuo HC. Functional roles and networks of non-coding RNAs in the pathogenesis of neurodegenerative diseases. J Biomed Sci. 2020;27(1):49. doi:10.1186/s12929-020-00636-z
4. Yang S, Yang H, Luo Y, Deng X, Zhou Y, Hu B. Long non-coding RNAs in neurodegenerative diseases. Neurochem Int. 2021;148:105096. doi:10.1016/j.neuint.2021.105096
5. Riva P, Ratti A, Venturin M. The long non-coding RNAs in neurodegenerative diseases: novel mechanisms of pathogenesis. Curr Alzheimer Res. 2016;13(11):1219–1231. doi:10.2174/1567205013666160622112234
6. Na C, Wen-Wen C, Li W, Ao-Jia Z, Ting W. Significant role of long non-coding RNAs in Parkinson’s disease. Curr Pharm Des. 2022;28(37):3085–3094. doi:10.2174/1381612828666220922110551
7. Ruffo P, De Amicis F, Giardina E, Conforti FL. Long-noncoding RNAs as epigenetic regulators in neurodegenerative diseases. Neural Regen Res. 2023;18(6):1243–1248. doi:10.4103/1673-5374.358615
8. Taghizadeh E, Gheibihayat SM, Taheri F, Afshani SM, Farahani N, Saberi A. LncRNAs as putative biomarkers and therapeutic targets for Parkinson’s disease. Neurol Sci. 2021;42(10):4007–4015. doi:10.1007/s10072-021-05408-7
9. Chen C, Shu L, Zou W. Role of long non-coding RNA TP73-AS1 in cancer. Biosci Rep. 2019;39(10):BSR20192274. doi:10.1042/BSR20192274
10. Zang W, Wang T, Wang Y, et al. Knockdown of long non-coding RNA TP73-AS1 inhibits cell proliferation and induces apoptosis in esophageal squamous cell carcinoma. Oncotarget. 2016;7(15):19960–19974. doi:10.18632/oncotarget.6963
11. Jiang Q, Xing W, Cheng J, Yu Y. Long non-coding RNA TP73-AS1 promotes the development of lung cancer by targeting the miR-27b-3p/LAPTM4B axis. Onco Targets Ther. 2020;13:7019–7031. doi:10.2147/OTT.S234443
12. Yuan Z, Li L, Zheng M, Xu J, Wang W. lncRNA TP73-AS1 Regulates miR-21/PTEN axis to affect cell proliferation in acute myeloid leukemia. Cancer Biother Radiopharm. 2021;36(3):268–272. doi:10.1089/cbr.2019.3142
13. Feng F, Jiao P, Wang J, et al. Role of long noncoding RNAs in the regulation of cellular immune response and inflammatory diseases. Cells. 2022;11(22):3642. doi:10.3390/cells11223642
14. Ozaki T, Hosoda M, Miyazaki K, et al. Functional implication of p73 protein stability in neuronal cell survival and death. Cancer Lett. 2005;228(1–2):29–35. doi:10.1016/j.canlet.2004.12.050
15. Tolosa E, Garrido A, Scholz SW, Poewe W. Challenges in the diagnosis of Parkinson’s disease. Lancet Neurol. 2021;20(5):385–397. doi:10.1016/S1474-4422(21)00030-2
16. Tolosa E, Wenning G, Poewe W. The diagnosis of Parkinson’s disease. Lancet Neurol. 2006;5(1):75–86. doi:10.1016/S1474-4422(05)70285-4
17. Armstrong MJ, Okun MS. Diagnosis and treatment of Parkinson disease: a review. JAMA. 2020;323(6):548–560. doi:10.1001/jama.2019.22360
18. Harms AS, Ferreira SA, Romero-Ramos M. Periphery and brain, innate and adaptive immunity in Parkinson’s disease. Acta Neuropathol. 2021;141(4):527–545. doi:10.1007/s00401-021-02268-5
19. Yang W, Li Y, Tang Y, et al. Mesenchymal stem cells overexpressing neuropeptide S promote the recovery of rats with spinal cord injury by activating the PI3K/AKT/GSK3β signaling pathway. Stem Cell Res Ther. 2025;16(1):100. doi:10.1186/s13287-025-04250-4
20. Cai B, Wang Q, Zhong L, Liu F, Wang X, Chen T. Integrating network pharmacology, transcriptomics to reveal neuroprotective of curcumin activate PI3K / AKT pathway in Parkinson’s disease. Drug Des Devel Ther. 2024;18:2869–2881. doi:10.2147/DDDT.S462333
21. Clough RL, Stefanis L. A novel pathway for transcriptional regulation of alpha-synuclein. FASEB J. 2007;21(2):596–607. doi:10.1096/fj.06-7111com
22. Cruikshank WW, Kornfeld H, Center DM. Interleukin-16. J Leukoc Biol. 2000;67(6):757–766. doi:10.1002/jlb.67.6.757
23. Lv J, Liang Y, Tu Y, Chen J, Xie Y. Hypoxic preconditioning reduces propofol-induced neuroapoptosis via regulation of Bcl-2 and Bax and downregulation of activated caspase-3 in the hippocampus of neonatal rats. Neurol Res. 2018;40(9):767–773. doi:10.1080/01616412.2018.1477545
24. Mei JM, Niu CS. Effects of CDNF on 6-OHDA-induced apoptosis in PC12 cells via modulation of Bcl-2/Bax and caspase-3 activation. Neurol Sci. 2014;35(8):1275–1280. doi:10.1007/s10072-014-1700-1
25. Patel JR, Brewer GJ. Age-related differences in NFkappaB translocation and Bcl-2/Bax ratio caused by TNFalpha and Abeta42 promote survival in middle-age neurons and death in old neurons. Exp Neurol. 2008;213(1):93–100. doi:10.1016/j.expneurol.2008.05.007
26. Salta E, De Strooper B. Non-coding RNAs with essential roles in neurodegenerative disorders. Lancet Neurol. 2012;11(2):189–200. doi:10.1016/S1474-4422(11)70286-1
27. Zhong L, Liu P, Fan J, Luo Y. Long non-coding RNA H19: physiological functions and involvements in central nervous system disorders. Neurochem Int. 2021;148:105072. doi:10.1016/j.neuint.2021.105072
28. Gong CY, Tang R, Liu KX, Xiang G, Zhang HH. Long non-coding RNA TP73-AS1 in cancers. Clin Chim Acta. 2020;503:151–156. doi:10.1016/j.cca.2019.12.025
29. Levrero M, De Laurenzi V, Costanzo A, Gong J, Wang JY, Melino G. The p53/p63/p73 family of transcription factors: overlapping and distinct functions. J Cell Sci. 2000;113(Pt 10):1661–1670. doi:10.1242/jcs.113.10.1661
30. Dai BQ, Jiang X, Feng LC. LncRNA TP73-AS1 regulates miR-495 expression to promote migration and invasion of nasopharyngeal carcinoma cells through junctional adhesion molecule A. Kaohsiung J Med Sci. 2021;37(5):361–370. doi:10.1002/kjm2.12338
 © 2025 The Author(s). This work is published and licensed by Dove Medical Press Limited. The
full terms of this license are available at https://www.dovepress.com/terms
and incorporate the Creative Commons Attribution
- Non Commercial (unported, 4.0) License.
By accessing the work you hereby accept the Terms. Non-commercial uses of the work are permitted
without any further permission from Dove Medical Press Limited, provided the work is properly
attributed. For permission for commercial use of this work, please see paragraphs 4.2 and 5 of our Terms.
© 2025 The Author(s). This work is published and licensed by Dove Medical Press Limited. The
full terms of this license are available at https://www.dovepress.com/terms
and incorporate the Creative Commons Attribution
- Non Commercial (unported, 4.0) License.
By accessing the work you hereby accept the Terms. Non-commercial uses of the work are permitted
without any further permission from Dove Medical Press Limited, provided the work is properly
attributed. For permission for commercial use of this work, please see paragraphs 4.2 and 5 of our Terms.
Recommended articles

Vitamin D Ameliorates Apoptosis and Inflammation by Targeting the Mitochondrial and MEK1/2-ERK1/2 Pathways in Hyperoxia-Induced Bronchopulmonary Dysplasia
Hu J, Wu Z, Wang H, Geng H, Huo J, Zhu X, Zhu X
Journal of Inflammation Research 2022, 15:4891-4906
Published Date: 25 August 2022
Eriochloa villosa Alleviates Progression of Benign Prostatic Hyperplasia in vitro and in vivo
Baek EB, Hwang YH, Park S, Hong EJ, Won YS, Kwun HJ
Research and Reports in Urology 2022, 14:313-326
Published Date: 24 September 2022
Mitochondrial Toxicant-Induced Neuronal Apoptosis in Parkinson’s Disease: What We Know so Far
Sivagurunathan N, Gnanasekaran Priyadharshini, Calivarathan L
Degenerative Neurological and Neuromuscular Disease 2023, 13:1-13
Published Date: 26 January 2023
PANoptosis: A Cell Death Characterized by Pyroptosis, Apoptosis, and Necroptosis
Shi C, Cao P, Wang Y, Zhang Q, Zhang D, Wang Y, Wang L, Gong Z
Journal of Inflammation Research 2023, 16:1523-1532
Published Date: 12 April 2023
Knockdown of Long Noncoding RNA IPCRL1 Mitigates Myocardial Ischemia/Reperfusion Injury via miR-185-3p/JIP3 Axis and JNK Pathway
Chen J, Zhang Y, Zhang Z, Yu Z, Zhang H, Zhao Q
Journal of Inflammation Research 2025, 18:10695-10709
Published Date: 8 August 2025