Back to Journals » Nature and Science of Sleep » Volume 14
Time Under 90% Oxygen Saturation and Systemic Hypertension in Patients with Obstructive Sleep Apnea Syndrome
Authors Wang L, Wei DH, Zhang J ![]() , Cao J
, Cao J ![]()
Received 31 August 2022
Accepted for publication 19 November 2022
Published 30 November 2022 Volume 2022:14 Pages 2123—2132
DOI https://doi.org/10.2147/NSS.S388238
Checked for plagiarism Yes
Review by Single anonymous peer review
Peer reviewer comments 2
Editor who approved publication: Prof. Dr. Ahmed BaHammam
Le Wang, Dong-hui Wei, Jing Zhang, Jie Cao
Department of Respiratory and Critical Care, Tianjin Medical University General Hospital, Tianjin, People’s Republic of China
Correspondence: Jing Zhang; Jie Cao, Department of Respiratory and Critical Care, Tianjin Medical University General Hospital, Tianjin, 300052, People’s Republic of China, Tel +86 22-60361612 ; +86 22-60362567, Fax +86 22-60261612, Email [email protected]; [email protected]
Purpose: The diagnosis and severity of obstructive sleep apnea (OSA) are commonly based on the apnea hypopnea index (AHI). However, patients with similar severity AHIs may show widely varying comorbidities and risks for cardiovascular disease, which may be associated with different severities of nocturnal hypoxia. The percentage of cumulative time with oxygen saturation below 90% in total sleep time (T90) is receiving increasing attention in OSA research because it describes the duration and degree of hypoxia during the whole sleep. This study aimed to explore the distribution of T90 in OSA patients with similar severity and to evaluate the relationship between T90 and hypertension.
Patients and Methods: A total of 775 patients with OSA were enrolled in this study, all participants were divided into groups according to the T90 value: light hypoxia (T90≤ 5%), mild hypoxia (T90 accounted for 5– 10%), moderate hypoxia (T90 accounted for 10– 25%), and severe hypoxia (T90> 25%). Multivariate logistic regression analysis was performed to assess the association between T90 and hypertension.
Results: Of the patients with mild OSA, 94.33% had light hypoxia, and 88.64% of moderate OSA patients had light hypoxia. The proportions of light, mild, moderate, and severe hypoxia among patients with severe OSA were 28.60%, 17.69%, 21.40%, and 32.31%, respectively. After adjustment for potential confounders, the risk of hypertension in patients with severe OSA increased according to the severity categories of T90. The odds ratio for T90 accounting for 10– 25% relative to T90≤ 5% was 2.544 (95%confidence interval, 1.254– 5.164; P=0.010) and as high as 2.692 (95%confidence interval, 1.403– 5.166; P=0.003) in patients with T90> 25%.
Conclusion: OSA patients with similar degree of AHI may have different T90 values, especially in severe OSA. A higher T90 was independently associated with the risk of hypertension after adjustment for traditional risk factors in patients with severe OSA. Our findings highlight the potential role for T90 in predicting hypertension in patients severe OSA.
Keywords: apnea hypopnea index, hypertension, obstructive sleep apnea, T90
Introduction
Obstructive sleep apnea(OSA) is a breathing disorder characterized by the disappearance or significant attenuation of oronasal airflow during sleep. It has been estimated that 936 million adults aged 30–69 years have OSA, and nearly half of them suffer from moderate to severe OSA globally.1
The current diagnostic and severity grading criteria for OSA are based on the apnea hypopnea index (AHI),which represents the number of apnea and/or hypopnea events per hour during sleep, regardless of the duration and morphology of apnea and/or hypopnea episodes and related oxygen desaturation. However, substantial evidence has shown that the AHI does not fully reflect the clinical symptoms and prognosis of patients with OSA. Mediano et al reported that patients with similar AHIs could exhibit different daytime sleepiness, sleep latency, sleep efficiency, and nocturnal oxygenation.2 Asano et al also found that although some patients share a similar mean AHI and 3% oxygen desaturation index, the degree of hypoxia and incidence of cardiovascular events were significantly different.3 A cluster analysis identified two phenotypes of severe OSA with different risks of nocturnal hypoxemia, daytime sleepiness, and comorbidity.4 Kulkas et al reported that patients with similar AHIs showed highly different values of obstruction severity, and the mortality was significantly different during a median follow-up period of 183 months.5
The percentage of cumulative time with oxygen saturation below 90% in total sleep time (T90) is an objective parameter that can easily be obtained using polysomnography(PSG). T90 has received increasing attention in OSA research because it visually describes the duration and degree of hypoxia during the whole night sleep.Many scholars have proposed T90 as an important parameter for accurately and objectively assessing the severity of OSA and predicting future risks.6–12 Additionally, previous studies have demonstrated that T90 has a stronger association with the clinical symptoms and prognosis of OSA than the AHI.13,14 Hypertension is a common complication related with OSA.15 In the current study, we aimed to explore the distribution of T90 in OSA patients with similar severity, and to analyze the PSG characteristics and risk of hypertension.
Materials and Methods
Study Subjects
The study protocol was approved by the Ethical Committee of Tianjin Medical University General Hospital(No.IRB2021-WZ-072), and the procedures followed were in accordance with the principles of the 1964 Helsinki declaration and its later amendments or comparable ethical standards. The requirement for informed consent was waived because of the retrospective nature of the study, and the patients’ identities were maintained anonymously.
A total of 755 consecutive PSG recordings conducted at the Sleep Disorders Unit, Tianjin Medical University General Hospital during 2016–2019 were included in this study. Patients were excluded if they had central/mixed sleep apnea syndrome, previous treatment for OSA(continuous positive airway pressure, surgery, and/or oral device), severe chronic obstructive pulmonary disease, serious pulmonary fibrosis, terminal heart failure, total sleep time less than 4 hours, incomplete data, or age<18 years. The flow of participants in this study is shown in Figure 1.
 |
Figure 1 Flow chart of the identification of the study population. Based on the exclusion criteria, 775 patients with OSA were included in the final analysis. Abbreviations:PSG, polysomnography; AHI, apnea hypopnea index; OSA, obstructive sleep apnea; T90, proportion of cumulative sleep time with oxygen saturation below 90% in total sleep time. Notes: Light hypoxia was defined as T90≤5%, mild hypoxia was defined as T90 accounting for 5%-10%, moderate hypoxia was defined as T90 accounting for 10%-25%, severe hypoxia was defined as T90>25%. |
Covariates
Demographic and anthropometric data, including sex, age, height, weight, smoking habit, alcohol consumption, medical history, and family medical history, were obtained from the patients’medical records. The body mass index (BMI) was calculated as weight divided by the square of height.
Polysomnography
Daytime sleepiness was assessed based on the Epworth sleepiness scale (ESS) score.
Standard PSG (Alice 5 Diagnostic Sleep System; Philips Respironics, Bend, OR, USA) was performed at the sleep center of our hospital. Electroencephalograms, electromyograms, electrooculograms, electrocardiographs, oronasal airflow, thoracic and abdominal respiratory efforts, pulse oximetry with blood oxygen saturation, and body position parameters were recorded throughout the night. PSG data were automatically analyzed using the Alice 5 Diagnostic Sleep System and assessed by a professional polysomnographic technologist.
Definitions
Apnea was defined as the cessation of airflow for at least 10 seconds with continued effort (obstructive) or lack of effort (central) to breathe. Hypopnea was defined as a reduction in airflow accompanied by electroencephalogram arousal and/or a≥3% decrease in oxygen desaturation from the pre-event baseline. The AHI was calculated as the mean hourly rate of apnea and hypopnea events during the estimated sleep time. An AHI <5 was considered as normal or simple snoring, 5 to 15 as mild OSA, 15 to 30 as moderate OSA, and>30 as severe OSA.16 T90 was defined as the proportion of cumulative sleep time with oxygen saturation below 90% in total sleep time. T90≤5% of the total sleep time was classified as light hypoxia, T90 of 5–10% as mild hypoxia,10–25% as moderate hypoxia,>25% as severe hypoxia.9 Hypertension was defined as systolic blood pressure ≥140 mmHg, and/or diastolic blood pressure ≥90 mmHg, or self-reported history of hypertension, or use of antihypertensive drugs.17
Statistical Analysis
Descriptive data were presented as mean ± standard deviation (SD), median with interquartile range (IQR), or number (percentage), as appropriate. Continuous data were compared using One-way ANOVA or the Kruskal–Wallis test. Categorical variables were compared using the chi-square test. Data set correlations were investigated by calculating the Spearman correlation coefficient(r). Univariate and multivariate binary stepwise logistic regression analyses were performed to identify the independent risk factors for hypertension in patients with severe OSA. An analysis of the receiver operating characteristic (ROC) curve and area under the curve (AUC) was performed to evaluate independent risk factors in the distinction between patients with and without hypertension. The best cut-off in terms of ROC analysis was identified using the Youden method. Binary logistic regression analysis was performed to assess the role of T90 in hypertension after adjusting for covariates. The results are shown as odds ratios (ORs) and 95% confidence intervals (CIs). A two-tailed P-value <0.05 was considered statistically significant. SPSS 25.0 (SPSS Inc., Chicago, IL, USA) was used to perform the statistical analysis, and GraphPad Prism 8.0 (GraphPad, San Diego, CA, USA) was used to construct the figures.
Results
Correlations Between T90 and the Other Collected Variables
The correlations between T90 and the collected variables were calculated (Table 1). The results showed that T90 was strongly and negatively correlated with the mean percutaneous oxygen saturation (meanSpO2, r=−0.852, P<0.001) and minimum percutaneous oxygen saturation (minSpO2, r=−0.902, P<0.001), and positively correlated with the oxygen desaturation index (ODI, r=0.807, P<0.001). A moderately positive correlation was found between T90 and the AHI (r=0.771, P<0.001), apnea index (AI, r=0.692, P <0.001), longest apnea time (LAT, r=0.631, P<0.001), and mean apnea time (MAT, r=0.533, P <0.001). However, we found that the association between T90 and the parameters related to hypopnea was weak; the correlation coefficients of the hypopnea index (HI), longest hypopnea time (LHT), and mean hypopnea time (MHT) were 0.252, 0.139, and 0.090, respectively (all P <0.05).
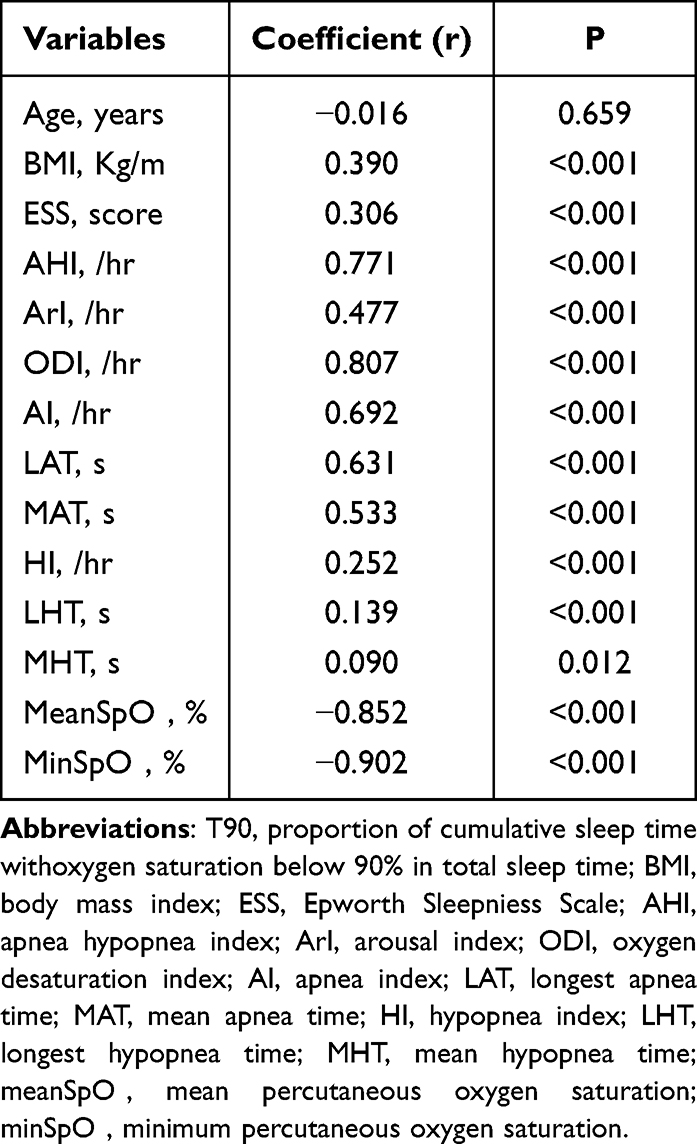 |
Table 1 Spearman Correlation Between T90 and Collected Variables in All Participants |
Clinical and Polysomnographic Characteristics of the Study Population
There were 141 patients with mild OSA with a mean AHI of 10.10, 176 with moderate OSA with a mean AHI of 21.6, and 458 with severe OSA with a mean AHI of 59.25. The ESS, arousal index (ArI), ODI, AI, LAT, MAT, HI, LHT, MHT, T90, and prevalence of hypertension increased with OSA severity, while the meanSpO2 and minSpO2 decreased (all P <0.05, Table 2). Additionally, most patients with mild OSA had light hypoxia, accounting for 94.33%, whereas this proportion accounted for 88.64% among those with moderate OSA. The proportions of light, mild, moderate hypoxia, and severe hypoxia among patients with severe OSA were 28.60%, 17.69%, 21.40%, and 32.31%, respectively (Table 3, Figure 1). Similarly, a large variation in T90 values was observed, especially within the severe OSA group (Figure 2).
 |
Table 2 Clinical and Polysomnographic Characteristic of the Study Population |
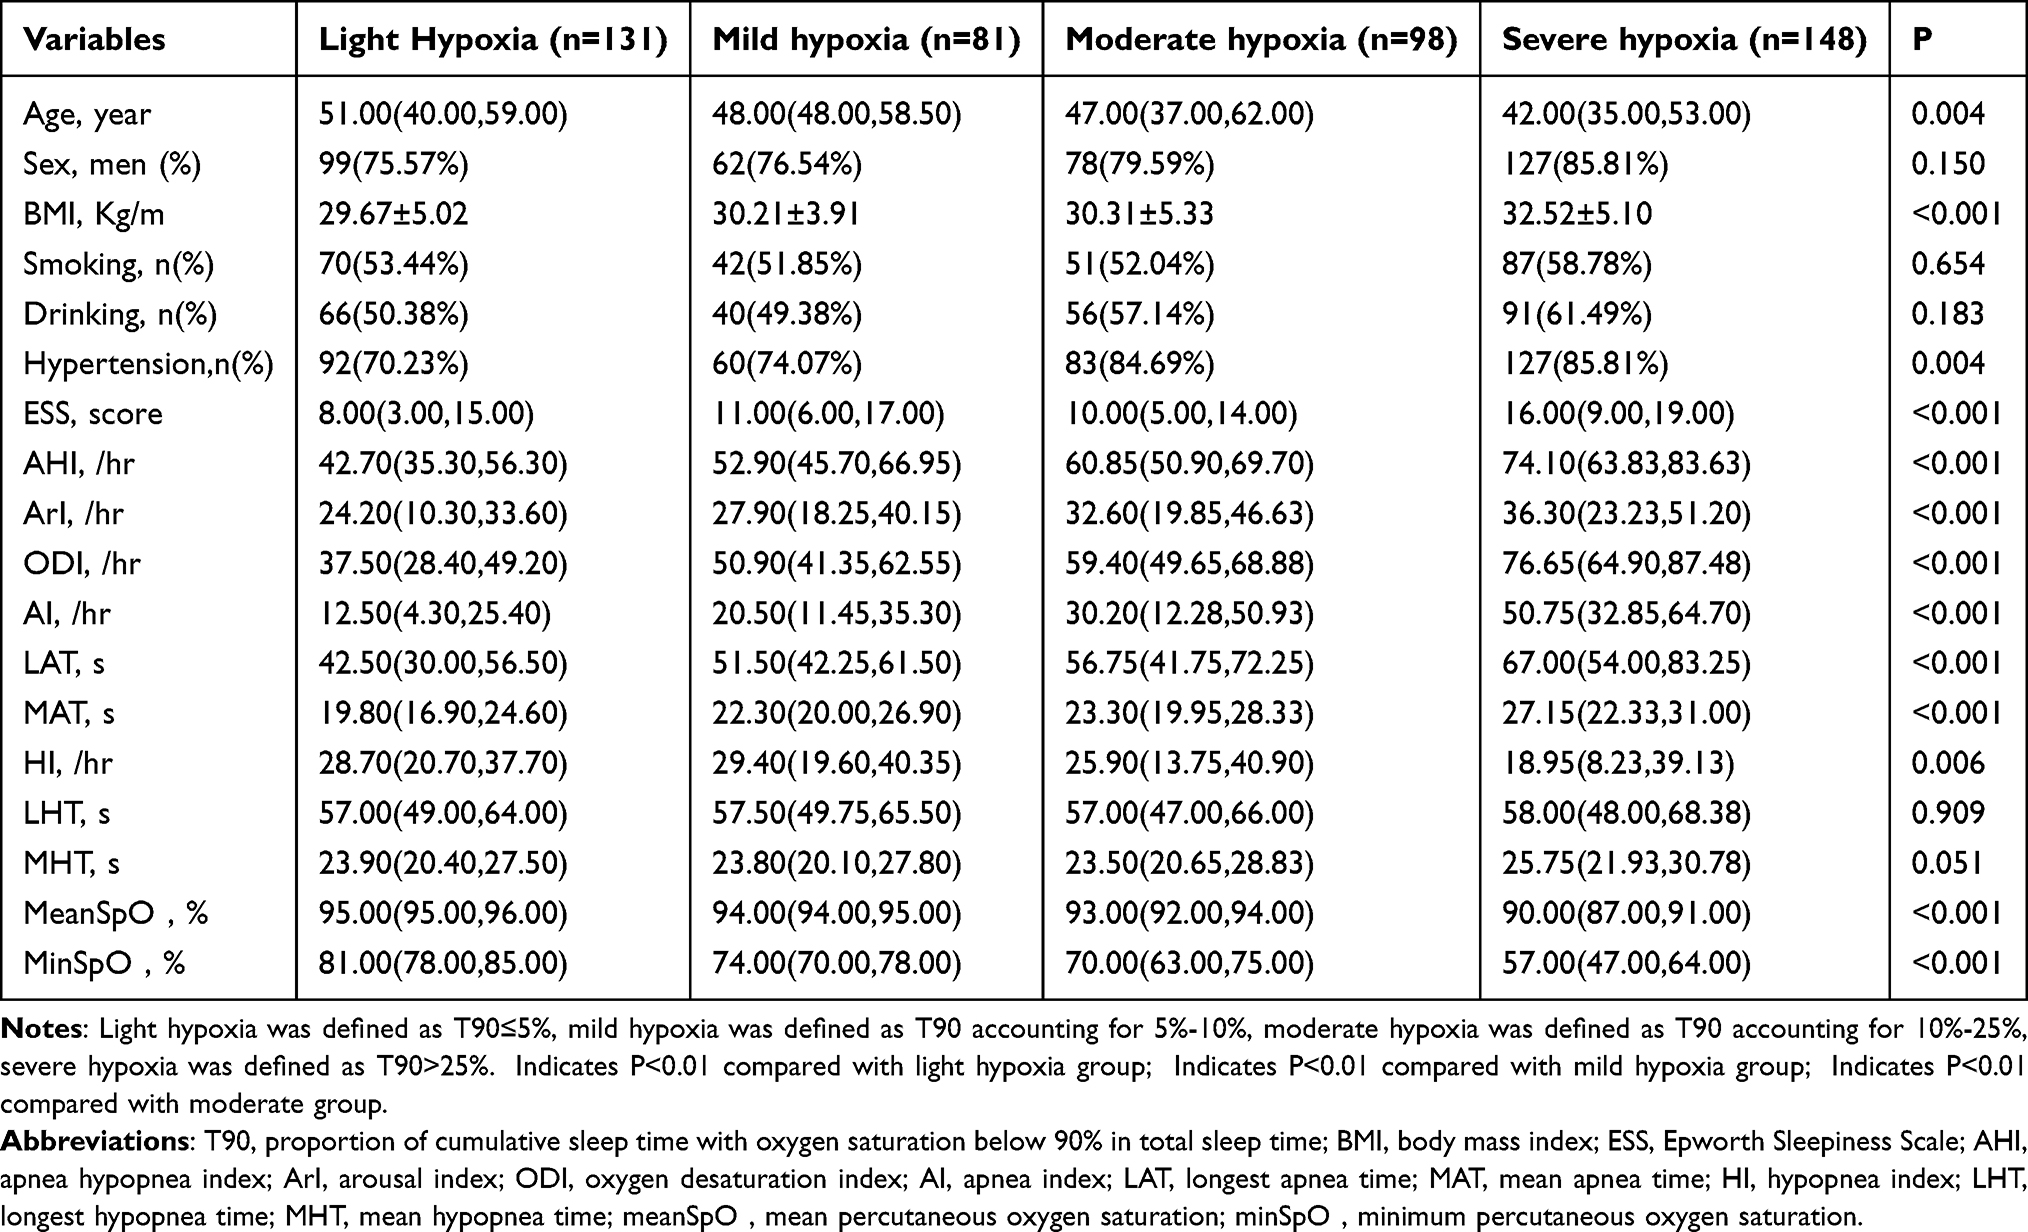 |
Table 3 Clinical Characteristic of Severe OSA Patients with Different T90 Values |
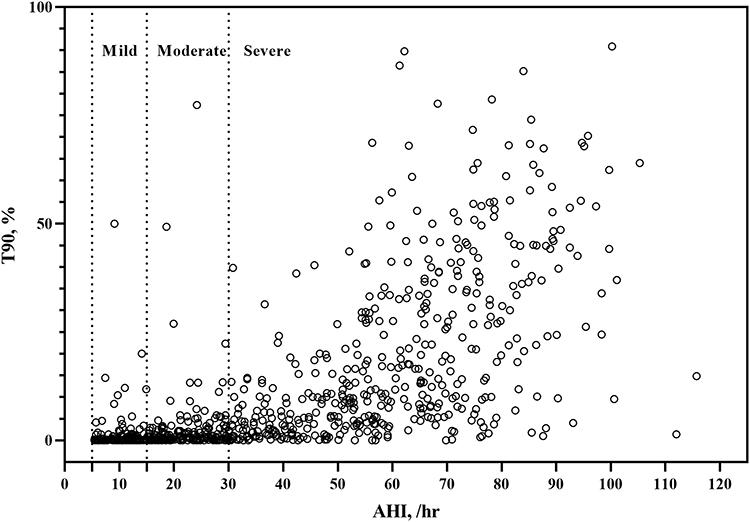 |
Figure 2 Distributions of T90 within different AHI severity categories. Abbreviations: T90, proportion of cumulative sleep time with oxygen saturation below 90% in total sleep time; AHI, apnea hypopnea index. |
Clinical and Polysomnographic Characteristic of Severe OSA Patients with Different T90 Values
We divided the patients with severe OSA into light, mild, moderate and severe hypoxia groups based on the T90 value.9 The BMI, ESS, AHI, ArI, ODI, AI, LAT, and MAT showed an upward trend, whereas age, HI, meanSpO2, and minSpO2 showed a downward trend with an increase in the T90 value (all P<0.001). However, there were no significant differences in the sex ratio, smoking habit, alcohol consumption, LHT, and MHT between the groups (Table 3).
Risk Factors for Hypertension in Patients with Severe OSA
Simple regression analysis indicated that age, BMI, family history of hypertension, ESS, meanSpO2, minSpO2, and T90 were associated with hypertension (all P<0.05). After adjustment for confounders (age, BMI, family history of hypertension, ESS, meanSpO2 and minSpO2) in multiple analysis, T90 remained a risk factor (OR=1.023, 95% CI: 1.008–1.039, P=0.003) for hypertension independently of age (OR=1.051, 95% CI: 1.029–1.073, P<0.001), BMI (OR=1.080, 95% CI: 1.019–1.144, P<0.001), and family history of hypertension (OR=2.854, 95% CI: 1.755–4.640, P<0.001) (Table 4). Furthermore, T90 combined with age, BMI, and family history of hypertension exhibited a higher AUC value (0.742, 95% CI: 0.687–0.797, P<0.0001) in relation to hypertension than the combination of age, BMI, family history of hypertension, and AHI (Figure 3). The optimal cutoff value allowing for the best trade-off between sensitivity and specificity was 10.85% for T90, and the sensitivity and specificity were 56.40% and 67.70%, respectively.
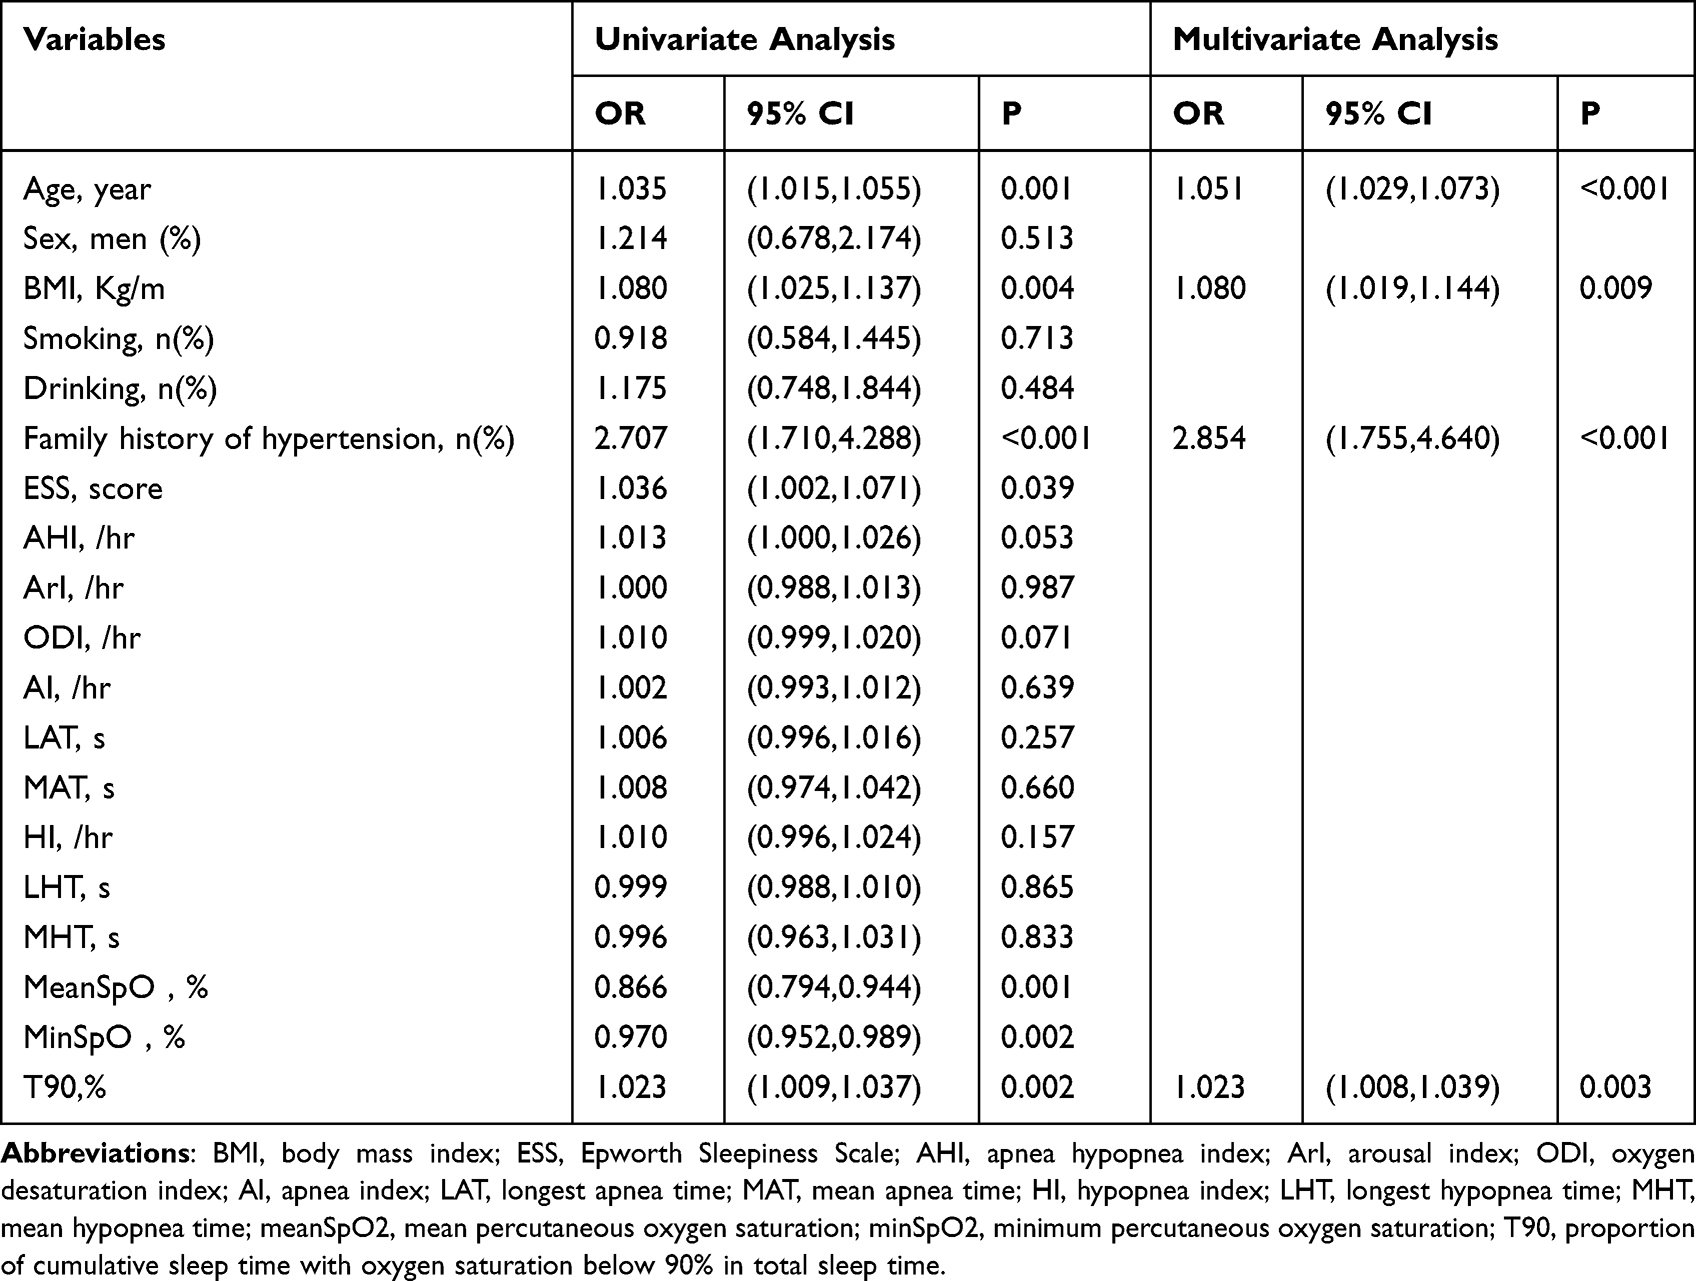 |
Table 4 Univariate and Multivariate Logistic Regression Analysis for Hypertension in Patients with Severe OSA |
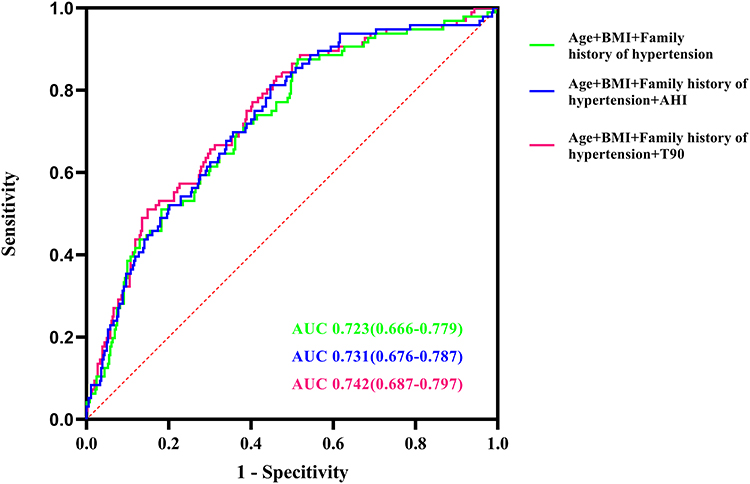 |
Figure 3 Receiver operating characteristic (ROC) curve analysis of T90, family history of hypertension, BMI and age to recognize hypertension in patients with severe OSA. Abbreviations: T90, proportion of cumulative sleep time with oxygen saturation below 90% in total sleep time; BMI, body mass index; OSA, obstructive sleep apnea. |
Association of T90 with the Risk of Hypertension in Patients with Severe OSA
Figure 4 summarizes the results of binary logistic regression models estimating the risk of prevalent hypertension in patients with severe OSA based on T90 categories after adjustment for potential confounders including age, BMI, and family history of hypertension. When selecting T90≥10.85% as a surrogate biomarker of hypertension in patients with severe OSA, a higher T90 category was significantly associated with a higher risk of prevalent hypertension (OR=2.951 for T90≥10.58% vs T90<10.58%; 95% CI 1.764–4.935; P<0.001)(Figure 4A). Similarly, compared with the light hypoxia group, the mild to severe hypoxia groups showed an increasing risk of hypertension (mild hypoxia: OR=1.245, 95% CI0.590–2.223; moderate hypoxia: OR=2.544, 95% CI 1.254–5.164; severe hypoxia: OR=2.692, 95% CI 1.403–5.166; P=0.005) (Figure 4B).
 |
Figure 4 Odds ratios and 95% confidence intervals (CI) for T90 severity categories and prevalent hypertension. Binary logistic regression models were fitted to examine the association between T90 categories and prevalent hypertension in patients with severe OSA. (A) T90 categories were associated with increased risk of hypertension in severe OSA patients. (B) The risk of hypertension increased across light hypoxia group to severe hypoxia group in severe OSA patients. Abbreviation: T90, proportion of cumulative sleep time with oxygen saturation below 90% in total sleep time. Notes: Adjusted for age, BMI, and family history of hypertension. Light hypoxia was defined as T90≤5%, mild hypoxia was defined as T90 accounting for 5–10%, moderate hypoxia was defined as T90 accounting for 10–25%, severe hypoxia was defined as T90>25%. |
Prevalence of Hypertension by Classification of T90 in Patients with Severe OSA
The prevalence of hypertension according to the T90 category is shown in Figure 5. The percentage of hypertension significantly increased in accordance with increasing categories of T90 (70.85% in T90<10.85%, and 86.81% in T90≥10.85%, P<0.001) (Figure 5A). The prevalence of hypertension showed an increasing trend across the light hypoxia group to the severe hypoxia group, and prevalence was 70.23% under light hypoxia, 74.07% under mild hypoxia, 84.69% under moderate hypoxia, and 85.81% under severe hypoxia (P=0.005) (Figure 5B).
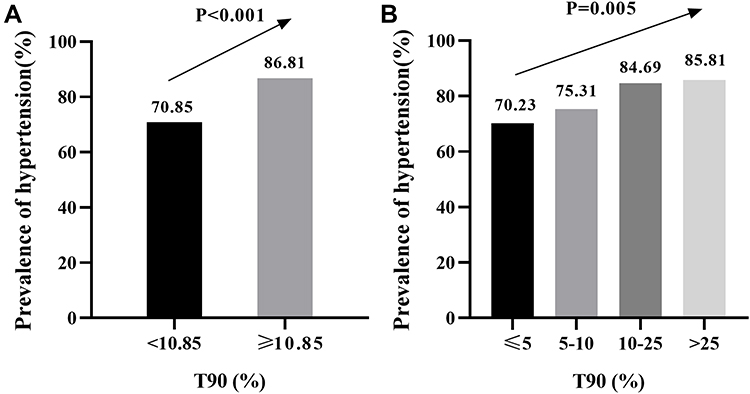 |
Figure 5 Prevalence of hypertension by categories of T90 in patients with severe OSA. (A) Higher T90 categories were associated with increased prevalence of hypertension in severe OSA patients.(B) The prevalence of hypertension increased across light hypoxia group to severe hypoxia group in severe OSA patients. Abbreviation: T90, proportion of cumulative sleep time with oxygen saturation below 90% in total sleep time. Notes: Light hypoxia was defined as T90≤5%, mild hypoxia was defined as T90 accounting for 5–10%, moderate hypoxia was defined as T90 accounting for 10–25%, severe hypoxia was defined as T90>25%. |
Discussion
OSA is associated with an elevated risk of hypertension, with intermittent hypoxia being the main mechanism.15,18 In this study, we found a significant difference in the severity of hypoxia in OSA patients with similar severity AHIs, especially in patients with severe OSA. Moreover, T90 was significantly and positively associated with hypertension in patients with severe OSA, after adjusting for potential confounding factors. In addition, T90 had a better correlation with apnea parameters than with hypopnea parameters.
To date, overnight PSG is considered the “gold standard” for diagnosing OSA. And the severity of OSA is stratified by the AHI. However, as aforementioned, the AHI only represents the frequency of apnea and hypopnea per hour and cannot reflect the actual duration and severity of nocturnal hypoxia.T90 is superior to the AHI in reflecting nocturnal hypoxia.12 We found that although there was a strong correlation between the AHI and T90, great variation in T90 values was observed, especially within the severe OSA group, which was corroborated by Bostanci andTurhan.19
In our hospital-based cross-sectional study, the results showed that T90 was associated with the prevalence of hypertension in patients with severe OSA,which increased with the severity of T90. Similarly, in a large community-based study, Nieto et al reported that the adjusted OR for hypertension, when comparing T90≥12% with that<0.05%, was 1.46 (95% CI, 1.12–1.88;P<0.001).20 Labarca et al also reported that T90>20% was associated with an increased risk of hypertension among patients with both moderate and severe OSA (OR=2.95, 95% CI 1.87–4.76, P< 0.001).21 An analysis of data from by Xu et al’s study demonstrated that nocturnal and awake blood pressure levels were associated more with T90 than with the AHI.14 High-sensitivity C-reactive protein (hsCRP), a biomarker of low-grade systemic inflammation, is strongly associated with cardiovascular disease.22 Zhang et al divided men patients with severe OSA matched by the BMI and AHI into two groups according to the hsCRP level, and found that T90 in the high hsCRP group (hsCRP level ≥3.0 mg/L) was significantly higher than that in the low hsCRP group. T90 was the strongest predictor contributing to 27.7% of hsCRP variability.12 Consistent with this, Yilmaz Avci et al demonstrated that there were significant differences in inflammation levels in OSA patients with similar AHIs, and the hsCRP level and mean platelet volume were significantly higher in the T90≥10% group than in the T90<10% group.23 These results suggest that the adverse cardiovascular effects of OSA are primarily dependent on the severity of intermittent hypoxia.
Additionally, we demonstrated that T90 had a stronger association with apnea parameters than with hypopnea parameters. Moderate positive correlations were found between T90 and AI, and MAT. However, the relationship between T90 and hypopnea parameters was weak, the correlation coefficients between T90 and HI, LHT, and MHT were 0.252, 0.139 and 0.090, respectively. Our results were consistent with those of a previous study. Li and Jin noted that T90 was strongly correlated with the total apnea duration (r=0.776, P<0.01).10
This study has several limitations. Firstly, it was a retrospective analysis, with inherent problems of selection bias. Secondly, other potential confounding factors, such as dietary habits, labor intensity, economic status, and psychological conditions, were not included in our analysis because the data were extracted from the medical system, which might have limited the multivariate analyses. Finally, this was a single-center study based on patients with OSA in China; therefore, it was restricted and could not be expanded to other groups. In particular, the BMI of people in the western countries is likely much higher than that of people in China, and the AHI in those countries may be adequate in determining risk.
Conclusions
In conclusion, OSA patients with similar severity of AHIs may have different T90 values, and thereby nocturnal hypoxia, especially in severe OSA. T90 was significantly and positively associated with hypertension in patients with severe OSA, suggesting a potential role for T90 in predicting hypertension in patients with severe OSA.
Data Sharing Statement
The data that support the findings of this study are available from the corresponding authors upon reasonable request.
Ethics Statement
The study protocol was approved by the Medical Ethics Committee of Tianjin Medical University General Hospital (No.IRB2021-WZ-072), and the procedures followed were in accordance with theHelsinki Declaration in 1995, as revised in 2013. The requirement for informed consent was waived because the patients’ information was extracted from electronic medical records at the sleep center, and the patients’ identities were kept anonymous.
Acknowledgments
This work was supported by grant from the Natural Science Foundation of China (No. 81970084). We thank all patients who participated in this study. We would like to thank Editage (www.editage.cn) for English language editing.
Author Contributions
All authors made a significant contribution to the work reported, whether that is in the conception, study design, execution, acquisition of data, analysis and interpretation, or in all these areas; took part in drafting, revising or critically reviewing the article; gave final approval of the version to be published; have agreed on the journal to which the article has been submitted; and agree to be accountable for all aspects of the work. Jing Zhang and Jie Cao are co-correspondents.
Disclosure
The authors have no conflicts of interest in relation to this work to declare.
References
1. Benjafield AV, Ayas NT, Eastwood PR., et al. Estimation of the global prevalence and burden of obstructive sleep apnoea: a literature-based analysis. Lancet Respir Med. 2019;7(8):687–698. doi:10.1016/S2213-2600(19)30198-5
2. Mediano O, Barceló A, de la Peña M, Gozal D, Agustí A, Barbé F. Daytime sleepiness and polysomnographic variables in sleep apnoea patients. Eur Respir J. 2007;30(1):110–113. doi:10.1183/09031936.00009506
3. Asano K, Takata Y, Usui Y, et al. New index for analysis of polysomnography, ‘integrated area of desaturation’, is associated with high cardiovascular risk in patients with mild to moderate obstructive sleep apnea. Respiration. 2009;78(3):278–284. doi:10.1159/000202980
4. Lacedonia D, Carpagnano GE, Sabato R, et al. Characterization of obstructive sleep apnea-hypopnea syndrome (OSA) population by means of cluster analysis. J Sleep Res. 2016;25(6):724–730. doi:10.1111/jsr.12429
5. Kulkas A, Tiihonen P, Julkunen P, Mervaala E, Töyräs J. Novel parameters indicate significant differences in severity of obstructive sleep apnea with patients having similar apnea-hypopnea index. Med Biol EngComput. 2013;51(6):697–708. doi:10.1007/s11517-013-1039-4
6. Chesson AL, Anderson WM, Walls RC, Bairnsfather LE. Assessment of hypoxemia in patients with sleep disorders using saturation impairment time. Am Rev Respir Dis. 1993;148(6 Pt 1):1592–1598. doi:10.1164/ajrccm/148.6_Pt_1.1592
7. Chaudhary B, Dasti S, Park Y, Brown T, Davis H, Akhtar B. Hour-to-hour variability of oxygen saturation in sleep apnea. Chest. 1998;113(3):719–722. doi:10.1378/chest.113.3.719
8. Chesson AL, McDowell Anderson W, Walls RC, Bairnsfather LE. Comparison of two methods of quantitative assessment of hypoxemia in patients with sleep disorders. Sleep Med. 2001;2(1):37–45. doi:10.1016/s1389-9457(00)00041-1
9. Li JR, Sun JJ, Zhang R, Li CF, Hu Y, Sun YM. Clinical value of TS90% in evaluation of hypoxemia in patients with obstructive sleep apnea/hypoventilation syndrome. Natl Med J China. 2005;85(44):3115–3117. doi:10.3760/j:issn:0376-2491.2005.44.008
10. Li Q, Jin XJ. Correlations between the duration and frequency of sleep apnea episode and hypoxemia in patients with obstructive sleep apnea syndrome. Chin J Otorhinolaryngol Head Neck Sur. 2009;44(10):825–830. doi:10.3760/cma.j.issn.1673-0860.2009.10.011
11. Zhang J, Li Y, Cao X, et al. The combination of anatomy and physiology in predicting the outcomes of velopharyngeal surgery. Laryngoscope. 2014;124(7):1718–1723. doi:10.1002/lary.24510
12. Zhang XB, Zen HQ, Lin QC, Chen GP, Chen LD, Chen H. TST, as a polysomnographic variable, is superior to the apnea hypopnea index for evaluating intermittent hypoxia in severe obstructive sleep apnea. Eur Arch Otorhinolaryngol. 2014;271(10):2745–2750. doi:10.1007/s00405-014-3044-0
13. Kainulainen S, Töyräs J, Oksenberg A, et al. Severity of desaturations reflects OSA-related daytime sleepiness better than AHI. J Clin Sleep Med. 2019;15(8):1135–1142. doi:10.5664/jcsm.7806
14. Xu J, Ding N, Zhang X, et al. Nocturnal blood pressure fluctuation and associated influential factors in severe obstructive sleep apnea patients with hypertension. Sleep Breath. 2018;22(4):1045–1052. doi:10.1007/s11325-018-1634-6
15. Salman LA, Shulman R, Cohen JB. Obstructive sleep apnea, hypertension, and cardiovascular risk: epidemiology, pathophysiology, and management. Curr Cardiol Rep. 2020;22(2):6. doi:10.1007/s11886-020-1257-y
16. Berry RB, Budhiraja R, Gottlieb DJ, et al. Rules for scoring respiratory events in sleep: update of the 2007 AASM manual for the scoring of sleep and associated events. deliberations of the sleep apnea definitions task force of the American academy of sleep medicine. J Clin Sleep Med. 2012;8(5):597–619. doi:10.5664/jcsm.2172
17. Guide TJCoCHP. Guidelines on prevention and treatment of hypertension in China (2018 edition). Chin J Cardiovasc. 2019;24(1):24–56.
18. Hou H, Zhao Y, Yu W, et al. Association of obstructive sleep apnea with hypertension: a systematic review and meta-analysis. J Glob Health. 2018;8(1):010405. doi:10.7189/jogh.08.010405
19. Bostanci A, Turhan M, Bozkurt S. Factors influencing sleep time with oxygen saturation below 90% in sleep-disordered breathing. Laryngoscope. 2015;125(4):1008–1012. doi:10.1002/lary.24942
20. Nieto FJ, Young TB, Lind BK, et al. Association of sleep-disordered breathing, sleep apnea, and hypertension in a large community-based study. Sleep Heart Health Study. JAMA. 2000;283(14):1829–1836. doi:10.1001/jama.283.14.1829
21. Labarca G, Campos J, Thibaut K, Dreyse J, Jorquera J. Do T90 and SaO(2) nadir identify a different phenotype in obstructive sleep apnea? Sleep Breath. 2019;23(3):1007–1010. doi:10.1007/s11325-019-01860-0
22. Fu Y, Wu Y, Liu E. C-reactive protein and cardiovascular disease: from animal studies to the clinic (Review). Exp Ther Med. 2020;20(2):1211–1219. doi:10.3892/etm.2020.8840
23. Yilmaz Avci A, Avci S, Lakadamyali H, Can U. Hypoxia and inflammation indicate significant differences in the severity of obstructive sleep apnea within similar apnea-hypopnea index groups. Sleep Breath. 2017;21(3):703–711. doi:10.1007/s11325-017-1486-5
 © 2022 The Author(s). This work is published and licensed by Dove Medical Press Limited. The
full terms of this license are available at https://www.dovepress.com/terms
and incorporate the Creative Commons Attribution
- Non Commercial (unported, 3.0) License.
By accessing the work you hereby accept the Terms. Non-commercial uses of the work are permitted
without any further permission from Dove Medical Press Limited, provided the work is properly
attributed. For permission for commercial use of this work, please see paragraphs 4.2 and 5 of our Terms.
© 2022 The Author(s). This work is published and licensed by Dove Medical Press Limited. The
full terms of this license are available at https://www.dovepress.com/terms
and incorporate the Creative Commons Attribution
- Non Commercial (unported, 3.0) License.
By accessing the work you hereby accept the Terms. Non-commercial uses of the work are permitted
without any further permission from Dove Medical Press Limited, provided the work is properly
attributed. For permission for commercial use of this work, please see paragraphs 4.2 and 5 of our Terms.
Recommended articles
The Elevated Central Chemosensitivity in Obstructive Sleep Apnea Patients with Hypertension
Wang X, Luo J, Huang R, Xiao Y
Nature and Science of Sleep 2022, 14:855-865
Published Date: 3 May 2022
Association Between Sleep Efficiency and Hypertension in Chinese Obstructive Sleep Apnea Patients
Xia N, Wang H, Chen Y, Fan XJ, Nie XH
Nature and Science of Sleep 2023, 15:79-88
Published Date: 10 March 2023
A Case of Young Obese Heart Failure Patient Using Multidisciplinary Treatment Centered on the Fantastic Four Improved Cardio Ankle Vascular Index and Cardiac Function
Ikeda Y, Iwakawa M, Kiyokawa H, Nakagami T, Kanzaki S, Ogawa A, Tabata T, Takahashi M, Kinoshita T, Shimizu K
International Medical Case Reports Journal 2023, 16:545-549
Published Date: 14 September 2023
Uncontrolled Hypertension from Inappropriate Ventilator Settings in Obstructive Sleep Apnea: A Case Report
Tian SR, Thomas RJ, Ni YN
Nature and Science of Sleep 2026, 18:601053
Published Date: 30 May 2026