
Back to Journals » International Journal of Chronic Obstructive Pulmonary Disease » Volume 20
The Significance of Relative Fat Mass in Chronic Obstructive Pulmonary Disease Prevalence and Severity: Evidences From Two Cohorts
Authors Tu T, Yu Y, Fan Y, Li X, Ye Z, Xu R, Bu Y, Zhao X, Chen X, Liu C, Yu B, Xu Y, Zhang X  , Huang Y
Received 2 June 2025
Accepted for publication 11 October 2025
Published 29 October 2025 Volume 2025:20 Pages 3501—3512
DOI https://doi.org/10.2147/COPD.S540092
Checked for plagiarism Yes
Review by Single anonymous peer review
Peer reviewer comments 3
Editor who approved publication: Prof. Dr. Richard Russell
Tingting Tu,1,* Yiting Yu,2,* Yichuan Fan,3,* Xinran Li,4 Zihan Ye,4 Ruizi Xu,2 Yiran Bu,5 Xiuxiu Zhao,1 Xianjing Chen,1 Chunyan Liu,1 Beibei Yu,1 Yage Xu,1 Xiaodiao Zhang,1 Yiben Huang1
1Department of Respiratory and Critical Medicine, The Third Affiliated Hospital of Wenzhou Medical University, Wenzhou, Zhejiang, People’s Republic of China; 2Renji College, Wenzhou Medical University, Wenzhou, Zhejiang, People’s Republic of China; 3Alberta Institute, Wenzhou Medical University, Wenzhou, Zhejiang, People’s Republic of China; 4The Second School of Medicine, Wenzhou Medical University, Wenzhou, Zhejiang, People’s Republic of China; 5The First School of Medicine, School of Information and Engineering, Wenzhou Medical University, Wenzhou, Zhejiang, People’s Republic of China
*These authors contributed equally to this work
Correspondence: Xiaodiao Zhang, Department of Respiratory Medicine, The Third Affiliated Hospital of Wenzhou Medical University, No. 108 Wansong Road, Wenzhou, Zhejiang, 325000, People’s Republic of China, Email [email protected] Yiben Huang, Department of Respiratory and Critical Medicine, The Third Affiliated Hospital of Wenzhou Medical University, Wenzhou, People’s Republic of China, Email [email protected]
Background: Chronic obstructive pulmonary disease (COPD) poses a major global health burden with high morbidity. Relative fat mass (RFM), as a novel body fat measurement indicator, can reflect the distribution of body fat. This study aims to elucidate its associations with COPD prevalence and severity in two cohorts to enhance prevention and treatment strategies.
Methods: We retrospectively investigated the medical records of 166 patients with COPD and the data of 2654 subjects from two cohorts. To explore the relative importance of factors in COPD prevalence and severity, we built an extreme gradient boosting (XGBoost) machine-learning model. Logistic regression models were used to assess the relationship between COPD and RFM, with subgroup analysis to clarify the difference across diverse subgroups. Furthermore, restricted cubic spline (RCS) curves were used to explore the exposure-response relationship.
Results: Multivariate logistic regression analysis revealed a significant positive association between RFM and COPD prevalence (OR = 1.043, 95% CI: 1.004– 1.083, p = 0.030) and a negative association with COPD severity (OR = 0.892, 95% CI: 0.813– 0.978, p = 0.015). According to the RCS curves, there was no nonlinear association between RFM and COPD prevalence or severity (p for nonlinear = 0.703, p for nonlinear = 0.348).
Conclusion: RFM was positively associated with the prevalence of COPD but inversely associated with its severity. Specifically, RFM predicted COPD prevalence more accurately in individuals aged 40– 60 and smokers, while it predicted COPD severity more effectively in those aged ≥ 60.
Keywords: relative fat mass, chronic obstructive pulmonary disease, obesity, body mass index, body fat distribution
Introduction
Chronic obstructive pulmonary disease (COPD) is a global health concern, defined as a condition in which the ratio of forced expiratory volume in one second to forced vital capacity (FEV1/FVC) measured by spirometry after bronchodilation is less than 0.7.1 It is a heterogeneous lung condition characterized by chronic respiratory symptoms due to abnormalities of the airways and/or alveoli that cause persistent, often progressive, airflow obstruction, which significantly impact patients’ health and quality of life.2 Therefore, it is of utmost importance to promote the standardization of COPD diagnosis, treatment, and prevention.3
In the contemporary general population, obesity is closely linked to an elevated risk of respiratory diseases.4 Regarding COPD, evidence indicates that obese patients often face a worse prognosis and a higher prevalence of comorbidities.5 Paradoxically, the “obesity paradox” phenomenon suggests that overweight or obese COPD patients tend to have a lower mortality risk.6 Despite the existing exploration of the correlation between obesity and COPD, the traditional body mass index (BMI) fails to comprehensively elucidate the intricate relationship between COPD and body composition. This is primarily because BMI has limitations in differentiating among various body fat distributions.7
To better understand the health impact of body fat status, the relative fat mass (RFM) was introduced. As an emerging measurement for assessing body fat, RFM offers several advantages over BMI.8 RFM is more accurate as its calculation incorporates height and waist circumference (WC), providing a more comprehensive view of overall body fat composition.9 This allows it to better represent body fat distribution, particularly central obesity, and identify individuals with significant abdominal fat accumulation who might be misclassified by BMI.10 Moreover, existing studies have indicated that it is associated with multiple health conditions such as asthma, depression, stroke, diabetes and hypertension.11–14 For instance, research shows a positive correlation between higher RFM levels and an increased prevalence of asthma.11 In the case of diabetes, RFM can potentially help identify individuals at a higher risk.14 Since COPD is also influenced by body composition and systemic health factors, insights from how RFM affects physiological processes in other conditions can be referenced to understand its role in COPD.
In light of the limitations of existing body indices in studying the connection between body fat and COPD, this study aims to examine the associations between RFM and the prevalence of COPD, as well as the severity of the disease. By incorporating data from the large-scale, nationally representative National Health and Nutrition Examination Survey (NHANES) and clinical records from the Third Affiliated Hospital of Wenzhou Medical University, we can identify trends at both local and national levels, enhancing the thoroughness of our research.
Materials and Methods
Study Population
The subjects of this retrospective study were sourced from two distinct cohorts: 2654 from the 2017–2020 NHANES database and 166 from the cohort at the Third Affiliated Hospital of Wenzhou Medical University from February 1, 2018, to July 5, 2022.
The first cohort, which originated from the 2017–2020 NHANES database with 15560 initial individuals, had the following inclusion criteria: 1) age ≥ 40 years; 2) availability of data on BMI, WC, and height; 3) clear self-reported COPD status; 4) no history of asthma. Individuals with severe hepatic insufficiency, severe renal insufficiency, cancer, pregnancy, and missing crucial covariates were excluded. After screening, 2654 subjects were retained. The study follows ethical guidelines approved by relevant review boards, with data access and dissemination in line with the Declaration of Helsinki.
The second cohort, which consisted of 296 patients from the Third Affiliated Hospital of Wenzhou Medical University from February 1, 2018, to July 5, 2022, had the following inclusion requirements: 1) age ≥ 40 years; 2) diagnosis of COPD by a professional pulmonologist; 3) FEV1/FVC < 0.7; 4) availability of data on WC, weight, and height; 5) availability of BODE (body mass index, airflow obstruction, dyspnoea, exercise capacity) data within 7 days of admission. We excluded patients with severe hepatic insufficiency, severe renal insufficiency, cancer, pregnancy, and missing covariates. Eventually, 166 patients were included. The study protocol was approved by the Ethics Committee of the Third Affiliated Hospital of Wenzhou Medical University, ensuring compliance with ethical and research standards.
Data Collection and Definitions
The NHANES database, managed by the National Center for Health Statistics (NCHS), is a cross-sectional study. It uses a complex, multi-stage stratified sampling method to accurately represent the health of non-institutionalized Americans. Through home interviews and standardized physical exams at mobile sites, NHANES collects rich data on demographics, diet, physical conditions, questionnaires, and health biomarkers. We extracted diverse data from the subjects from the NHANES database. This included demographic characteristics, anthropometric information, clinical data, and clinical examination data. Details of their measurement methods are available on the CDC’s NHANES website (https://www.cdc.gov/nchs/nhanes/index.htm).
Regarding the cohort from the Third Affiliated Hospital of Wenzhou Medical University, we obtained demographic information and patient baseline data from the patients’ electronic medical records. Blood biochemical parameters were collected within 24 hours of patient admission. Additionally, pulmonary function tests were conducted by experienced clinicians utilizing spirometry.
RFM, defined by Woolcott OO and Bergman RN,8 served as the main exposure variable, and its calculation method varied according to sex. Specifically, distinct formulas were applied to calculate RFM for men and women respectively: 64 - (20 × height/WC) + (12 × sex), where sex = 0 for men and 1 for women.
Outcomes
For the NHANES cohort, participants who answered “yes” to the question “Have you been told by a doctor or other health professional that you have emphysema, COPD, or chronic bronchitis?” were classified as having COPD. For the cohort from the Third Affiliated Hospital of Wenzhou Medical University, the BODE scale for COPD patients was utilized as the outcome measure. A BODE score of ≥ 5 denoted a more severe prognosis for COPD.15
Covariates
To enhance the precision and comprehensiveness of the analysis, the covariates selected for consideration in the two cohorts were determined based on clinical expertise and previous research. In the NHANES cohort, covariates included age, sex, race (Mexican American, non-Hispanic white, non-Hispanic black, non-Hispanic Asian, other Hispanic, other/multiracial), educational level (below high school, high school, and above high school), ratio of family income to poverty (PIR) (< 1, 1–2, ≥ 2), smoking, alcohol history, prior medical history (hypertension and diabetes), and clinical testing data (total cholesterol). The diagnosis of cardiovascular disease (CVD) depended on whether the participant had any of the diseases in the questionnaire: “Has a doctor or other health professional ever told you that you had congestive heart failure?”, “Has a doctor or other health professional ever told you that you had coronary heart disease?”, “Has a doctor or other health professional ever told you that you had angina, also called angina pectoris?”, “Has a doctor or other health professional ever told you that you had a heart attack (also called myocardial infarction)?”, “Has a doctor or other health professional ever told you that you had a stroke?”. Smoking history was determined through the following questions: “Have you smoked at least 100 cigarettes in your entire life?”. In the Wenzhou cohort, age, sex, smoking, drinking, history of hypertension, diabetes, heart disease and total cholesterol (TC) were extracted as covariates.
Statistical Analysis
Data normality was assessed via the Kolmogorov–Smirnov test. Categorical variables were analyzed with the chi-square test, while continuous variables were examined using the independent sample t-test for normal distributions and the Mann–Whitney U-test for non-normal distributions. Based on the data distribution, continuous baseline variables were described as mean±standard deviation for normally distributed data and median (interquartile range, IQR) for non-normally distributed data, while categorical variables were expressed as frequencies (n) and percentages (%). The extreme gradient boosting (XGBoost) model was employed to analyze the contribution (gain) of each variable to COPD prevalence and severity. To avoid potential multicollinearity arising from the risk that using the BODE index as an outcome measure for COPD severity in the Wenzhou cohort might introduce circular reasoning or over-adjustment, we also conducted collinearity analysis.
Multivariate logistic regression was used to explore the associations between the indicators and the prevalence and severity of COPD. For the NHANES cohort, Model 1 included demographic factors like age, sex, race and smoking. Model 2 adjusted for age, sex, race, smoking, diabetes mellitus and hypertension. To further account for potential confounding factors, Model 3 incorporated additional adjustments for PIR and TC. For the Wenzhou cohort, Model 1 adjusted for age, sex and smoking. Model 2 expanded upon Model 1 by including comorbidity variables such as heart disease, diabetes mellitus and hypertension. Model 3 further adjusted for drinking and TC. The results were reported as odds ratios (OR), 95% confidence intervals (CI), and p-values.
To investigate the stability of the connection between RFM and COPD across different groups, we conducted subgroup analysis and interaction tests. Furthermore, Overlap weighting (OW) was employed to address potential confounding and balance baseline covariates between COPD groups in the NHANES cohort. After OW adjustment, multivariable logistic regression analyses were conducted to verify the robustness of the conclusions regarding the association between RFM and COPD.
Additionally, restricted cubic spline (RCS) curves were used to explore the exposure-response relationship. To evaluate the linear regression model, the Ramsey regression equation specification error test (Ramsey’s RESET test) and the F-test were performed. Statistical significance was set at p < 0.05. All data were analyzed using SPSS Statistics 27.0 software and R version 4.4.2.
Results
Baseline Characteristics of Two Distinct Cohorts in COPD
As shown in Table 1, there were 2654 participants in our first study, including 2510 participants without COPD and 144 COPD patients from the NHANES cohort. Participants with COPD were older [57.39 ± 10.99 vs 57.00 (48.00–65.00), p < 0.001], had greater WC [103.05 (92.20–120.98) vs 100.50 (91.50–111.10), p = 0.013] and higher rates of smoking, alcohol use and diabetes (p < 0.001, p = 0.016, p < 0.001). Moreover, those with COPD were more likely to be non-Hispanic whites, had less education, were unmarried, and had a lower PIR value. All these aspects showed significant differences between the two groups (all p < 0.001).
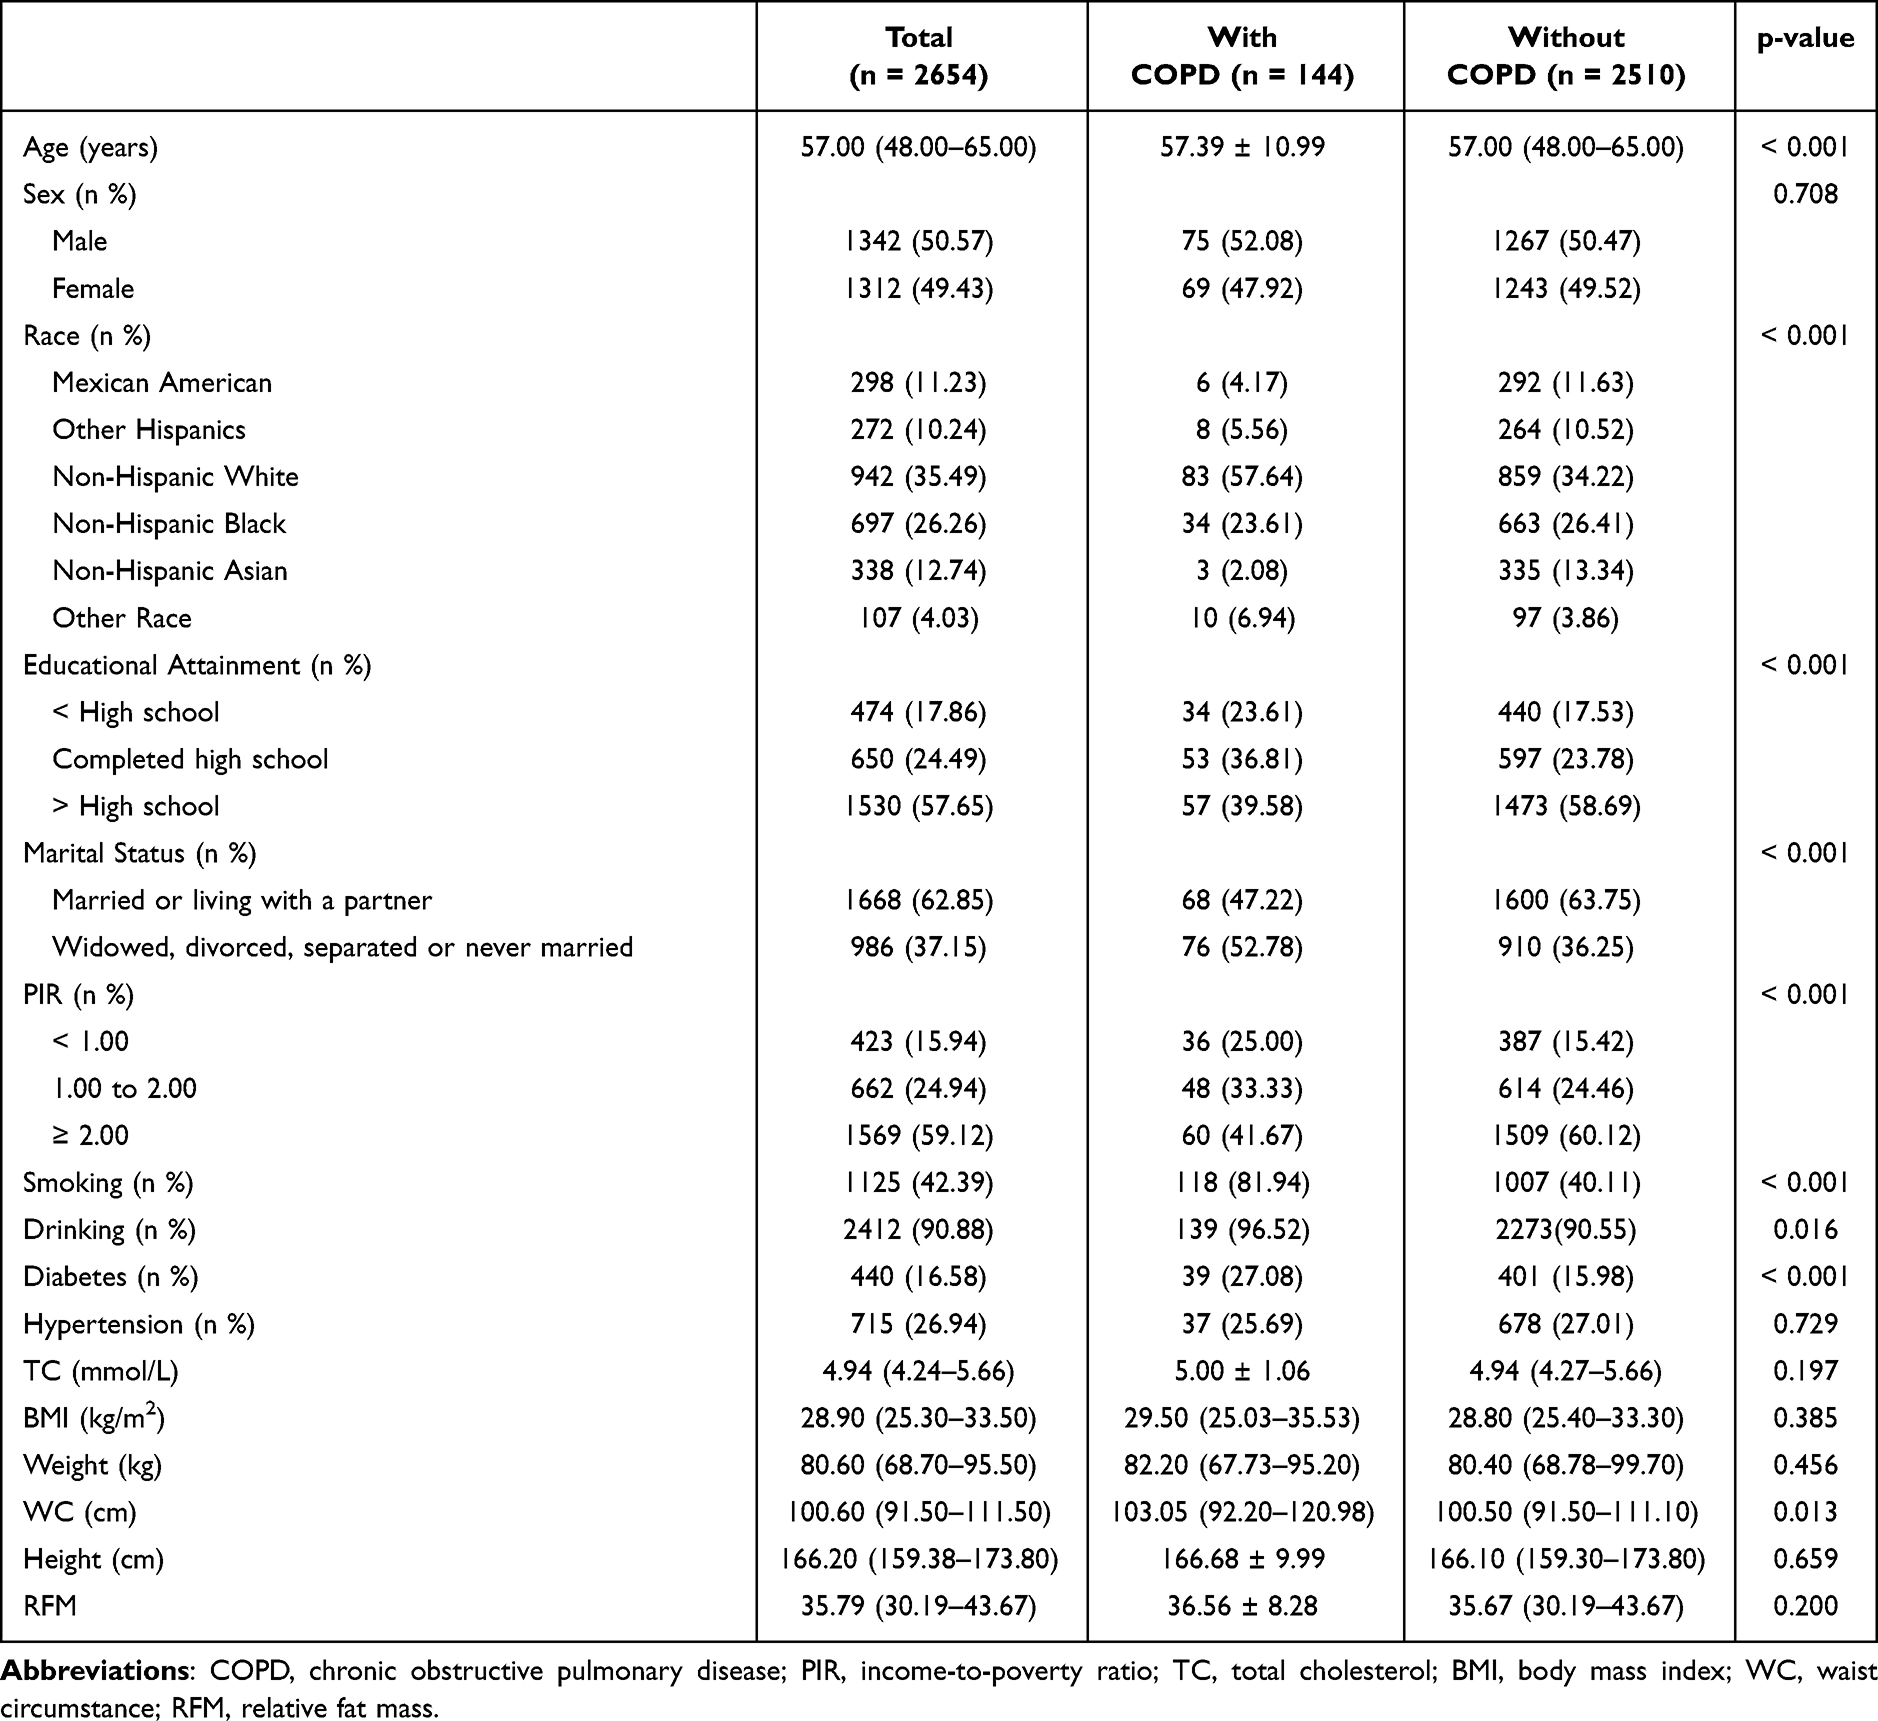 |
Table 1 Characteristics of the Participants According to COPD |
Table 2 presents the baseline demographic and clinical characteristics of the Wenzhou cohort. In this cohort, COPD patients were classified into two groups based on their BODE scores within seven days of admission: BODE < 5 and BODE ≥ 5. Notably, COPD patients with BODE ≥ 5 had lower weight, WC, BMI, and RFM values (all p < 0.05); among these associations, the lower BMI in the BODE ≥ 5 group specifically indicates that higher BMI was associated with a lower BODE score.
 |
Table 2 Characteristics of the COPD Grouped According to BODE |
The Correlation of RFM with COPD Prevalence and Severity
Figure 1 presents an XGBoost machine-learning algorithm model constructed to explore the relative importance of various factors on COPD prevalence and severity. For COPD prevalence, smoking and height emerged as the most influential factors, followed by TC, age, race, WC, weight, and BMI. In terms of COPD severity, weight had the greatest influence contributing to the model, with age, WC, RFM, TC, and BMI following in order of importance. Based on these results, we incorporated relevant variables into the logistic regression model. However, to avoid potential multicollinearity, covariates involved in RFM and BMI calculations, including height, weight, and waist circumference, were excluded.
 |
Figure 1 XGBoost model revealed the relative importance of features on COPD and BODE ≥ 5. Abbreviations: TC, total cholesterol; WC, waist circumference; BMI, body mass index; PIR, income-to-poverty ratio; RFM, relative fat mass. Note: (A): Feature importance for predicting COPD prevalence in NHANES cohort; (B): Feature importance for predicting COPD severity in Wenzhou cohort. |
Supplementary Table 1 presents the collinearity analysis between the covariate RFM and other indicators. The results show that the VIF values of RFM with BMI, height, weight, and WC are all less than 5, indicating no significant multicollinearity among the variables.
Subsequently, in the multivariate regression models for the NHANES and Wenzhou cohorts, we gradually adjusted for different covariates to analyze the association between RFM, BMI and COPD or BODE ≥ 5 (Table 3).
 |
Table 3 Association of RFM with COPD and BODE ≥ 5 |
For the NHANES cohort related to COPD prevalence, the results showed that the underlying variables were adjusted in Model 1, and the RFM and BMI both showed a good correlation with the prevalence of COPD (RFM: OR = 1.045, 95% CI: 1.006–1.084, p = 0.022; BMI: OR = 1.026, 95% CI: 1.001–1.051, p = 0.038). In Model 3, inspired by machine-learning results indicating that factors like education, PIR, and TC have relatively large contributions to model prediction, we further adjusted for more covariates. After this adjustment, both BMI (OR = 1.027, 95% CI: 1.002–1.053, p = 0.035) and RFM (OR = 1.043, 95% CI: 1.004–1.083, p = 0.030) still had significant positive associations with COPD.
For the Wenzhou cohort related to BODE ≥ 5, in Model 1, after adjusting for age, gender, and smoking, both BMI (OR = 0.720, 95% CI: 0.631–0.821, p < 0.001) and RFM (OR = 0.891, 95% CI: 0.817–0.973, p = 0.010) were significantly associated with BODE ≥ 5. In Model 3, based on machine-learning analysis which revealed that alcohol history and total cholesterol made relatively large contributions to the model prediction, we further adjusted for drinking and TC on top of the factors in Model 2. As a result, BMI (OR = 0.723, 95% CI: 0.630–0.829, p < 0.001) and RFM (OR = 0.892, 95% CI: 0.813–0.978, p = 0.015) still had significant associations with BODE ≥ 5, where the associations were negative, indicating a lower risk with higher values of BMI and RFM.
Subgroup Analysis
To better understand how RFM relates to the prevalence and severity of COPD across different subgroups, we performed subgroup analyses for both cohorts. The results are presented in Figure 2. For COPD prevalence, significant interaction effects were observed between RFM and age, sex, smoking history, as well as diabetes (all p for interaction < 0.05), and the positive association between RFM and the prevalence of COPD was more pronounced in smokers and those aged 40–60 (all p < 0.05). As for COPD severity, a significant association was found in the subgroup of individuals over 60 years old (p for interaction = 0.038, p = 0.008). However, other subgroups exhibited no significant interaction effects.
 |
Figure 2 The association between RFM and COPD in subgroups of two cohorts. Note: (A): The NHANES cohort model is adjusted to: age, sex, race, smoking; (B): The Wenzhou cohort model is adjusted to: age, sex, smoking. |
Sensitivity Analysis After Overlap Weighting
Overlap weighting (OW) effectively balanced baseline covariates in the NHANES cohort, as evidenced by standardized mean differences for most covariates being reduced to below 0.2 (Supplementary Figure 2). Supplementary Table 2 presents the association between RFM and COPD prevalence in the NHANES cohort after overlap weighting (OW), analyzed using multivariate logistic regression. We constructed the same three models as those before OW. In all models, RFM was significantly associated with COPD prevalence: Model 1 (OR = 1.036, 95% CI: 1.002–1.071, p = 0.035); Model 2 (OR = 1.045, 95% CI: 1.010–1.081, p = 0.011); and Model 3 (OR = 1.043, 95% CI: 1.008–1.078, p = 0.015). These results confirm a robust positive association between RFM and COPD prevalence after OW, consistent across the three adjusted models.
Visualized Associations Between RFM and COPD
In Supplementary Figure 1, linear regression models and ridge plots were used to visualize the link between adjusted RFM (model-fitted residuals) and COPD prevalence. After adjusting for age, sex, and smoking history, the results showed that RFM was independently associated with both the incidence of COPD and its severity. Figure 3 further explored the relationship between RFM and both the prevalence and severity of COPD. By employing RCS plots, it was found that an increase in RFM corresponded to a higher probability of COPD prevalence (p for overall < 0.01). Additionally, lower RFM values were linked to a greater risk of COPD worsening, which decreased and stabilized as RFM increased (p for overall = 0.05). Notably, there was no nonlinear association between RFM and COPD prevalence or severity (p for nonlinear = 0.703, p for nonlinear = 0.348).
 |
Figure 3 Restricted cubic spline (RCS) relationship between the RFM and COPD. Abbreviation: RFM, relative fat mass. Note: (A): The RCS plot shows the relationship between RFM and COPD adjusted for age, sex, and smoking; (B): The RCS plot shows the relationship between RFM and BODE adjusted for age, sex, and smoking. |
Discussion
To our knowledge, this is the first study to evaluate the correlation between RFM and the risk of COPD. It draws on data from the NHANES spanning 2017 to 2020, along with hospital medical records. Previous research mainly relied on earlier NHANES data to explore the relationship between other common metrics and COPD.16
In this study, we explored the relationship between RFM and COPD based on data from the NHANES database and the cohort of the Third Affiliated Hospital of Wenzhou Medical University. Our findings indicated a positive correlation between RFM and the prevalence of COPD. Conversely, RFM was negatively correlated with the severity of COPD, indicating that a high RFM level might protect against severe COPD. This potential protective effect should be interpreted in the context of COPD’s multifactorial progression, as higher RFM may be associated with better nutritional reserve or metabolic homeostasis, which could mitigate the deterioration of respiratory function in patients with established COPD, distinct from its correlation with COPD prevalence.6 While the effect sizes of RFM and BMI on COPD—with a 4.5% increase linked to RFM and a 2.6% increase linked to BMI—are modest, their relevance should be viewed through a public health lens. Given COPD’s high prevalence and the broad distribution of RFM and BMI in the general population, even small effects may impact a substantial number of people. Additionally, these modest effects align with COPD’s multifactorial pathogenesis: alongside the baseline risk factors noted above, RFM and BMI serve as incremental yet meaningful correlates in COPD risk. Furthermore, high BMI was found to be associated with a lower BODE score, which is consistent with our expectations.
According to the subgroup analysis, RFM was more accurate in predicting the onset of COPD in people aged 40–60 and smokers. Regarding the prediction of COPD severity, RFM performed better in the population aged 60 and above. We further performed a sensitive analysis by applying overlap weighting to the first cohort and obtained statistically similar results via multivariable logistic regression, which further validated the robustness of our conclusions. These results offer a novel perspective for COPD risk assessment and progression management, suggesting that RFM could serve as a convenient and practical predictive marker.
Although the precise mechanism of the relationship between RFM and COPD is yet to be fully elucidated, existing research suggests that the impact of obesity on the respiratory system may be a potential link. Obesity affects lung function through chemical and physical mechanisms.17 Chemically, excessive fat promotes the secretion of inflammatory factors like leptin, visfatin, tumor necrosis factor-α, and IL-6, which were related to COPD exacerbations.18 In patients with recurrent COPD exacerbations, the airway cytokine levels are already elevated in the stable state and increase even more during exacerbations, especially for IL-6, and since COPD is characterized by a progressive decline in FEV1 due to chronic airway inflammation, these frequent exacerbations may enhance airway inflammation and contribute to the deterioration of lung function.19 Physically, the accumulation of fat in the chest wall and abdomen restricts the movement of the diaphragm, and reduces thoracic compliance and chest wall volume, ultimately affecting lung function.20 Given that RFM reflects body fat distribution to some extent, a high RFM may influence lung function through these mechanisms, increasing the risk of COPD.
Additionally, smoking is recognized as the primary mechanism underlying abnormal lipid accumulation in patients with COPD.21 In smokers, smoking disrupts normal fat metabolism, leading to changes in fat distribution and accumulation.22 Previous research found that cigarette smoke exposure in mice led to significantly higher serum levels of total cholesterol, triglycerides, and low-density lipoprotein cholesterol, and decreased the expression of low-density lipoprotein receptors in hepatocytes, thus impairing lipid metabolism.23 This, combined with the pulmonary inflammation caused by smoking, promotes the development of COPD. RFM can capture these smoking-related fat metabolism disruptions and their connection to the risk of COPD. For instance, the redistribution of body fat caused by smoking, such as abdominal obesity, can lead to a decline in lung function, and RFM can quantify these fat-related changes based on its combination of WC and height, facilitating better prediction of COPD risk.24
Given the relationship between RFM and COPD demonstrated by the results of subgroup analysis, it is worth noting that the impact of RFM on COPD varies across different age groups. During the 40–60 years age group, as bodily functions decline, fat mass changes directly influence the respiratory system.25 A substantial proportion of individuals in this age group with COPD are in the disease’s early stages, mainly affected by smoking and fat metabolism disorders with fewer comorbidities.25,26 Higher RFM may result in increased lung fat infiltration and weakened respiratory muscles, directly affecting lung function and raising COPD risk. In individuals aged 60 and above, the situation is more complex. This group typically has multiple underlying conditions and reduced physical function, and senescence is significantly associated with COPD and decreased lung function.27 With aging, the lungs degenerate, and the adipose-lung interaction becomes more intricate, which contributes to COPD development.28 Concurrently, a higher RFM exerts additional strain on the musculoskeletal system. This strain may lead to the onset of conditions such as osteoarthritis and muscle fatigue, further impairing mobility and perpetuating a cycle of declining quality of life.29 Additionally, RFM can reflect the body’s nutritional and reserve capacity by mirroring fat distribution changes in response to interventions.30 Lower RFM often signals insufficient reserves and adequate reserves are crucial for elderly COPD patients to manage their condition. Maintaining RFM within a reasonable range may contribute to the prevention of COPD and the management of its progression.
In clinical settings, BMI remains the most frequently used anthropometric marker of adiposity because it is simple, non-invasive and requires no special equipment. However, its obvious limitation is that it can not distinguish fat from fat mass and reflect the characteristics of fat distribution.31,32 These shortcomings are particularly pronounced in chronic wasting disorders such as COPD, where BMI often underestimates metabolic risk. WC provides a crude index of central adiposity, but its interpretation is confounded by height, skeletal frame size and low measurement standardisation, resulting in substantial inter-observer variability. RFM, calculated from height and WC with sex-specific equations, yields an estimate of total body-fat percentage while retaining the advantages of a rapid, non-invasive assessment. Across multiple ethnic groups, RFM has demonstrated superior agreement with reference body-composition methods compared with either BMI or WC.8 In population-based cohorts, increasing RFM shows a dose-response relationship with all cause mortality, whereas BMI exhibits a flat or even inverse association after adjustment for muscle mass.33 The present study is the first to demonstrate that, in patients with COPD, RFM is significantly and independently associated with the BODE score. These data suggest that RFM could serve as an easily obtainable bedside indicator of systemic metabolic risk. Prospective evaluation is warranted to determine whether incorporation of RFM into routine COPD follow-up improves early identification of individuals at high risk for systemic inflammation and acute exacerbations, and whether this translates into more effective, personalised nutritional and pulmonary rehabilitation strategies.
This study presents certain advantages. In terms of data sources, we integrated data from two different origins. This integration enables the research to better capture the characteristics of different populations. Additionally, the XGBoost machine-learning was employed for covariate screening, which enhanced the quality of statistical models and improved prediction accuracy. Despite these strengths, our study is not without limitations. Firstly, the research design is retrospective, which makes it difficult to clarify the causal relationship between RFM and COPD. Secondly, we used self-reported COPD data from the NHANES database, which has inherent limitations: self-reported diagnoses may be affected by factors like differing access to medical care, varied physician diagnostic criteria, and potential recall bias. Thirdly, the sample size of the Wenzhou cohort is relatively small, which may introduce bias and limit the extrapolation to the research results. Fourthly, although multiple confounding factors were considered during the research process, there may still be residual confounding. Fifthly, there is heterogeneity among the two cohort populations. Differences between the populations may interfere with the final results to a certain extent. Moreover, while the current inclusion criteria reflect the overall association between RFM and COPD at the public health level, they may introduce bias in etiological inference and effect size estimation. Future studies could prioritize high-risk populations to further reduce confounding and improve causal interpretation.
In summary, RFM offers unique predictive features in relation to COPD, although further research is needed to fully understand its superiority and how it can be integrated with other indices in clinical practice for better COPD prediction. COPD development is influenced by a variety of factors, presenting a complex nature.34
Conclusion
RFM exhibited a strong positive correlation with the prevalence of COPD and an inverse correlation with its severity, especially in middle-aged, elderly, and smoking populations. Clinically, RFM could be a key predictor for COPD onset and a valuable factor in assessing disease progression. However, additional research is required to validate these findings and elucidate the underlying mechanisms.
Ethical Statement
For NHANES cohort, our study utilized publicly accessible data from NHANES database, which is conducted by the US Centers for Disease Control and Prevention (CDC). Data collection for NHANES during the 2017–2020 cycle was approved by the Ethics Review Board (ERB) of the National Center for Health Statistics (NCHS) under protocol #2018-01. All participant information was anonymized prior to public release.
For Wenzhou cohort, the study protocol was approved by the Ethics Committee of the Third Affiliated Hospital of Wenzhou Medical University. Since our study exclusively relies on data analysis and does not involve direct contact with participants, no additional ethical review or informed consent was necessary.
Acknowledgments
The authors would like to express their gratitude to The Third Affiliated Hospital of Wenzhou Medical University for data collection and provision. We also appreciate the valuable feedback from colleagues during the preparation of this manuscript.
Funding
No funding was received for this study.
Disclosure
The authors declare that they have no competing interests. This study was conducted independently, and there were no financial, personal, or professional relationships that could have influenced the design, execution, analysis, or interpretation of the research presented in this manuscript. All data collection, analysis, and the writing process were carried out without any external pressures or incentives that might lead to a conflict of interest. We confirm that this work represents our original research and that no conflicts of interest, either real or potential, exist among the authors.
References
1. (GOLD) GIfCOLD. Global strategy for prevention, diagnosis and management of COPD 2023 report; 2023.
2. Agustí A, Celli BR, Criner GJ, et al. Global initiative for chronic obstructive lung disease 2023 report: GOLD executive summary. Eur Respir J. 2023;61:20230401. doi:10.1183/13993003.00239-2023
3. Recio Iglesias J, Díez-Manglano J, López García F, et al. Management of the COPD patient with comorbidities: an experts recommendation document. Int J Chron Obstruct Pulmon Dis. 2020;15:1015–1037. doi:10.2147/copd.S242009
4. Chen XX, Lu FY, Wang Y, et al. Causal effect of life-course adiposity on the risk of respiratory diseases: a Mendelian randomization study. Nutr Metab. 2025;22:25. doi:10.1186/s12986-025-00915-2
5. Verberne LDM, Leemrijse CJ, Swinkels ICS, et al. Overweight in patients with chronic obstructive pulmonary disease needs more attention: a cross-sectional study in general practice. NPJ Prim Care Respir Med. 2017;27:63. doi:10.1038/s41533-017-0065-3
6. Cao C, Wang R, Wang J, et al. Body mass index and mortality in chronic obstructive pulmonary disease: a meta-analysis. PLoS One. 2012;7:e43892. doi:10.1371/journal.pone.0043892
7. Bray GA. Beyond BMI. Nutrients. 2023;15:2254. doi:10.3390/nu15102254
8. Woolcott OO, Bergman RN. Relative fat mass (RFM) as a new estimator of whole-body fat percentage ─ A cross-sectional study in American adult individuals. Sci Rep. 2018;8:10980. doi:10.1038/s41598-018-29362-1
9. Palumbo AM, Jacob CM, Khademioore S, et al. Validity of non-traditional measures of obesity compared to total body fat across the life course: a systematic review and meta-analysis. Obes Rev. 2025;26:e13894. doi:10.1111/obr.13894
10. Guzmán-León AE, Velarde AG, Vidal-Salas M, et al. External validation of the relative fat mass (RFM) index in adults from north-west Mexico using different reference methods. PLoS One. 2019;14:e0226767. doi:10.1371/journal.pone.0226767
11. Zhou M, Zhang T, Zeng Z, et al. Association of relative fat mass with asthma: inflammatory markers as potential mediators. Lipids Health Dis. 2025;24:13. doi:10.1186/s12944-024-02428-y
12. Zhu X, Yue Y, Li L, et al. The relationship between depression and relative fat mass (RFM): a population-based study. J Affect Disord. 2024;356:323–328. doi:10.1016/j.jad.2024.04.031
13. Zheng Y, Huang C, Jin J, et al. Association between stroke and relative fat mass: a cross-sectional study based on NHANES. Lipids Health Dis. 2024;23:354. doi:10.1186/s12944-024-02351-2
14. Woolcott OO, Samarasundera E, Heath AK. Association of relative fat mass (RFM) index with diabetes-related mortality and heart disease mortality. Sci Rep. 2024;14:30823. doi:10.1038/s41598-024-81497-6
15. Marin JM, Carrizo SJ, Casanova C, et al. Prediction of risk of COPD exacerbations by the BODE index. Respir Med. 2009;103:373–378. doi:10.1016/j.rmed.2008.10.004
16. Zheng Y, Liu W, Zhu X, et al. Associations of dietary inflammation index and composite dietary antioxidant index with preserved ratio impaired spirometry in US adults and the mediating roles of triglyceride-glucose index: NHANES 2007–2012. Redox Biol. 2024;76:103334. doi:10.1016/j.redox.2024.103334
17. Dixon AE, Peters U. The effect of obesity on lung function. Expert Rev Respir Med. 2018;12:755–767. doi:10.1080/17476348.2018.1506331
18. Kythreotis P, Kokkini A, Avgeropoulou S, et al. Plasma leptin and insulin-like growth factor I levels during acute exacerbations of chronic obstructive pulmonary disease. BMC Pulm Med. 2009;9:11. doi:10.1186/1471-2466-9-11
19. Bhowmik A, Seemungal TA, Sapsford RJ, et al. Relation of sputum inflammatory markers to symptoms and lung function changes in COPD exacerbations. Thorax. 2000;55:114–120. doi:10.1136/thorax.55.2.114
20. Sonpeayung R, Tantisuwat A, Janwantanakul P, et al. Total and compartmental chest wall volumes, lung function, and respiratory muscle strength in individuals with abdominal obesity: effects of body positions. J Obes. 2019;2019:9539846. doi:10.1155/2019/9539846
21. Jubinville É, Talbot M, Bérubé JC, et al. Interplay between cigarette smoking and pulmonary reverse lipid transport. Eur Respir J. 2017;50:20170909. doi:10.1183/13993003.00681-2017
22. Graff-Iversen S, Hewitt S, Forsén L, et al. Associations of tobacco smoking with body mass distribution; a population-based study of 65,875 men and women in midlife. BMC Public Health. 2019;19:
23. Ma B, Chen Y, Wang X, et al. Cigarette smoke exposure impairs lipid metabolism by decreasing low-density lipoprotein receptor expression in hepatocytes. Lipids Health Dis. 2020;19:88. doi:10.1186/s12944-020-01276-w
24. Sorlí-Aguilar M, Martín-Luján F, Flores-Mateo G, et al. Adiposity markers and lung function in smokers: a cross-sectional study in a Mediterranean population. BMC Pulm Med. 2016;16:178. doi:10.1186/s12890-016-0341-y
25. Lim HS, Kim DK, Gil HI, et al. Association of pulmonary function with osteosarcopenic obesity in older adults aged over 50 years. Nutrients. 2023;15:20230628. doi:10.3390/nu15132933
26. Tilert T, Paulose-Ram R, Howard D, et al. Prevalence and factors associated with self-reported chronic obstructive pulmonary disease among adults aged 40–79: the National Health and Nutrition Examination Survey (NHANES) 2007–2012. EC Pulmonol Respir Med. 2018;7:650–662.
27. Wang T, Duan W, Jia X, et al. Associations of combined phenotypic ageing and genetic risk with prevalence of chronic respiratory diseases in the UK Biobank: a prospective cohort study. Eur Respir J. 2024;63:2301720. doi:10.1183/13993003.01720-2023
28. Brandsma CA, de Vries M, Costa R, et al. Lung ageing and COPD: is there a role for ageing in abnormal tissue repair? Eur Respir Rev. 2017;26:170073. doi:10.1183/16000617.0073-2017
29. Deng L, Wang S, Wan D, et al. Relative fat mass and physical indices as predictors of gallstone formation: insights from machine learning and logistic regression. Int J Gen Med. 2025;18:509–527. doi:10.2147/ijgm.S507013
30. Senkus KE, Crowe-White KM, Locher JL, et al. Relative fat mass assessment estimates changes in adiposity among female older adults with obesity after a 12-month exercise and diet intervention. Ann Med. 2022;54:1160–1166. doi:10.1080/07853890.2022.2067352
31. Humphreys S. The unethical use of BMI in contemporary general practice. Br J Gen Pract. 2010;60(578):696–697. doi:10.3399/bjgp10X515548
32. Sweatt K, Garvey WT, Martins C. Strengths and limitations of BMI in the diagnosis of obesity: what is the path forward? Curr Obes Rep. 2024;13(3):584–595. doi:10.1007/s13679-024-00580-1
33. Suthahar N, Zwartkruis V, Geelhoed B, et al. Associations of relative fat mass and BMI with all-cause mortality: confounding effect of muscle mass. Obesity. 2024;32(3):603–611. doi:10.1002/oby.23953
34. Agustí A, Melén E, DeMeo DL, et al. Pathogenesis of chronic obstructive pulmonary disease: understanding the contributions of gene-environment interactions across the lifespan. Lancet Respir Med. 2022;10:512–524. doi:10.1016/s2213
 © 2025 The Author(s). This work is published and licensed by Dove Medical Press Limited. The
full terms of this license are available at https://www.dovepress.com/terms
and incorporate the Creative Commons Attribution
- Non Commercial (unported, 4.0) License.
By accessing the work you hereby accept the Terms. Non-commercial uses of the work are permitted
without any further permission from Dove Medical Press Limited, provided the work is properly
attributed. For permission for commercial use of this work, please see paragraphs 4.2 and 5 of our Terms.
© 2025 The Author(s). This work is published and licensed by Dove Medical Press Limited. The
full terms of this license are available at https://www.dovepress.com/terms
and incorporate the Creative Commons Attribution
- Non Commercial (unported, 4.0) License.
By accessing the work you hereby accept the Terms. Non-commercial uses of the work are permitted
without any further permission from Dove Medical Press Limited, provided the work is properly
attributed. For permission for commercial use of this work, please see paragraphs 4.2 and 5 of our Terms.
Recommended articles

Correlation of Body Mass Index with Clinicopathologic Parameters in Patients with Idiopathic Membranous Nephropathy
Chen X, Chen S, Li Z, Pan X, Jia Y, Hu Z, Niu K, Liu B, Ren Q
Diabetes, Metabolic Syndrome and Obesity 2022, 15:1897-1909
Published Date: 20 June 2022
All Types Obesity and Physical Inactivity Associated with the Risk of Activity of Daily Living Limitations Among People with Asthma
Alhammad SA, Alwadeai KS
Journal of Multidisciplinary Healthcare 2022, 15:1573-1583
Published Date: 22 July 2022
Association Between Nutritional Knowledge, Dietary Regimen, and Excess Body Weight in Primary School Teachers
Saintila J, Calizaya-Milla YE, Calizaya-Milla SE, Elejabo-Pacheco AA, Sandoval-Valentin GA, Rodriguez-Panta SG
Journal of Multidisciplinary Healthcare 2022, 15:2331-2339
Published Date: 14 October 2022
Correlation of Body Mass Index and Oxygen Saturation in Chronic Obstructive Pulmonary Disease Patients at a Tertiary Care Center in Nepal: A Cross-Sectional Study
Sangroula P, Ghimire S, Srivastava B, Adhikari D, Dhonju K, Shrestha A, Ghimire S
International Journal of Chronic Obstructive Pulmonary Disease 2023, 18:1413-1418
Published Date: 11 July 2023
The Burden of Obesity in Saudi Arabia: A Real-World Cost-of-Illness Study
Nagi MA, Almalki ZS, Thavorncharoensap M, Sangroongruangsri S, Turongkaravee S, Chaikledkaew U, Alqahtani AM, AlSharif LS, Alsubaihi IA, Alzarea AI, Alsultan MM
ClinicoEconomics and Outcomes Research 2025, 17:233-246
Published Date: 21 March 2025