Back to Journals » Diabetes, Metabolic Syndrome and Obesity » Volume 15
Correlation of Body Mass Index with Clinicopathologic Parameters in Patients with Idiopathic Membranous Nephropathy
Authors Chen X ![]() , Chen S, Li Z, Pan X
, Chen S, Li Z, Pan X ![]() , Jia Y, Hu Z, Niu K
, Jia Y, Hu Z, Niu K ![]() , Liu B, Ren Q
, Liu B, Ren Q
Received 16 March 2022
Accepted for publication 12 June 2022
Published 20 June 2022 Volume 2022:15 Pages 1897—1909
DOI https://doi.org/10.2147/DMSO.S366100
Checked for plagiarism Yes
Review by Single anonymous peer review
Peer reviewer comments 2
Editor who approved publication: Prof. Dr. Muthuswamy Balasubramanyam
Xing Chen,1 Shuchun Chen,1,2 Zelin Li,1 Xiaoyu Pan,1 Yujiao Jia,1 Zhijuan Hu,3 Kai Niu,3 Bing Liu,3 Qingjuan Ren1
1Department of Internal Medicine, Hebei Medical University, Shijiazhuang, People’s Republic of China; 2Department of Endocrinology, Hebei General Hospital, Shijiazhuang, People’s Republic of China; 3Department of Nephrology, Hebei General Hospital, Shijiazhuang, People’s Republic of China
Correspondence: Shuchun Chen, Department of Endocrinology, Hebei General Hospital, 348 Heping West Road, Shijiazhuang, Hebei, 050051, People’s Republic of China, Tel/Fax +86 311 85988406, Email [email protected]
Objective: To investigate the association between body mass index (BMI) and clinicopathologic parameters in patients with idiopathic membranous nephropathy (IMN).
Methods: This study was retrospective and included patients with biopsy-proven IMN from 2018 to 2021 in Hebei General Hospital. Patients were categorized into two groups based on BMI. Clinical and histopathologic data were analyzed at the time of renal biopsy. Pathological data included immunofluorescence staining, glomerulosclerosis (GS, 0– 2), mesangial cell proliferation (MCP, 0– 1), tubular atrophy (TA, 0– 1), interstitial fibrosis (IF, 0– 1), vascular wall thickness (VWT, 0– 1) and a combination score (GMTIV) graded from 0 to 5.
Results: Our study revealed that the obese group had a higher prevalence of hypertension and diabetes than the overweight/normal weight group (P=0.001, P=0.002). Systolic blood pressure (P=0.005), diastolic blood pressure (P< 0.001), haemoglobin (P=0.006), triglycerides (P< 0.001), serum uric acid (P=0.05), 24 h urine proteinuria concentration (UP) (P=0.012), MCP (P=0.042), IF (P=0.033), and GMITV (P=0.033) score were higher in obese group compared to the other group, while the high-density lipoprotein-cholesterol (P=0.034) and immunoglobulin A deposition score (P=0.005) were lower. Factors significantly associated with UP were the ratio of lymphocyte count to white blood cell count, serum pre-albumin, immunoglobulin G, microscopic hematuria, anti-phospholipase A2 receptor (anti-PLA2R), C3 deposit on multivariable analysis (adjusted R2=0.343). Binary logistic regression analysis illustrated that MCP was correlated to BMI (OR=2.528, P=0.036). Ordinal logistic regression analysis demonstrated that GMTIV was associated with BMI (OR=1.114, P=0.010) and C3 deposit (OR=1.655, P=0.001).
Conclusion: High BMI was associated with MCP and GMTIV score in IMN patients. Obesity may play an essential role in mesangial lesions of IMN. This study emphasized the relation between BMI and histological parameters under the universal usage of anti-PLA2R antibodies for diagnosis and prognosis in IMN.
Keywords: obesity, body mass index, idiopathic membranous nephropathy
Corrigendum for this paper has been published.
Introduction
The increasing prevalence of obesity has been described as a pandemic in recent years, which is a growing global healthcare issue.1,2 Body mass index (BMI) is a convenient and critical indicator for assessing obesity.3 Recent epidemiologic studies noted that high BMI was a risk factor for chronic comorbidities, including hypertension, type 2 diabetes mellitus, dyslipidemia, cardiovascular disease, chronic kidney disease (CKD), and cancer.2,4 CKD was shown to be the second common cause of obesity-related mortality only next to cardiovascular disease. Obesity has drawn more attention as a prognostic factor for CKD.2,5 The renal effects of obesity include both structural and functional abnormalities. Clinical and experimental researches have also demonstrated obesity-related glomerulopathy, which is characterized by glomerulomegaly, thickening of glomerular basement membrane (GBM), mesangial matrix expansion, and focal segmental glomerulosclerosis.4,6
CKD is defined as the structural or functional alterations of the kidney that persists for three or more months. Immunoglobulin A nephropathy (IgAN) is the most common primary glomerular disease worldwide, which results in CKD. Recently, the incidence of idiopathic membranous nephropathy (IMN) has surged rapidly and is only second to IgAN.4,6 Membranous nephropathy (MN) is characterized by the deposit of immune complexes in the epithelial cells of the GBM. IMN refers to the unexplained MN, which accounts for approximately 80% of MN patients, and is one of the most common pathological types of nephrotic syndrome in adults.7 The exact pathophysiology of IMN has remained uncertain. The pathological manifestation of IMN is characterized by diffuse thickness of GBM due to the presence of subepithelial immune complexes by light microscopy.8 Recent studies have shown that the clinical characteristics and prognosis of IMN vary considerably. About 20% of the patients with IMN progress to end-stage renal disease (ESRD) gradually within 5–15 years.9
M-type phospholipase A2 receptor (m-PLA2R) has been considered to be the major autoantigen of IMN. The Anti-PLA2R antibody has been defined as a suitable biomarker in clinical practice because of its close association with clinical parameters. Persistent elevation of anti-PLA2R antibody levels after effective treatment is a significant predictor of poor prognosis.8,9 However, whether anti-PLA2R has a relationship with histopathological parameters or BMI has not been proved so far.
IMN coexisted with obesity are increasing sharply in the past decades. Several studies demonstrated that obesity could increase the risk for CKD and its progression to ESRD.2 The impact of obesity on primary glomerular disease remains puzzled. To date, most studies have demonstrated that excessive BMI can serve as a predictor for IgAN progression.2,4,10 On the other hand, Ouyang et al found that being underweight instead of obesity was an independent risk factor for IgAN progression.11 Moreover, other opposite studies showed that waist-to-hip ratio, rather than BMI, is associated with CKD.3 During recent years, the histopathology changes of kidney diseases, which were defined as factors of prognostic evaluation of IMN, have attracted more attention. Glomerulosclerosis in IMN is closely associated with the patient’s prognosis.9 A retrospective analysis of a large cohort revealed that focal segmental glomerulosclerosis superimposed on MN has been defined as an indicator of poor prognosis.8 In addition, several studies have reported that chronic tubulointerstitial injuries are independent predictors of progressive renal diseases. Thus, the pathological parameters of MN were associated with prognosis.6,8 However, there is a lack of evidence on the relationship between BMI and clinicopathological parameters of IMN.
To date, few studies have revealed the impact of obesity on histopathological changes in CKD, especially in IMN. Therefore, we conducted a retrospective study to systematically elucidate the correlation between BMI and clinicopathologic parameters of patients with IMN, which provided clinical guidance to improve the prognosis for patients with IMN.
Materials and Methods
Study Design
A total of 230 patients with kidney biopsy-proven IMN, who were followed up in Hebei General Hospital from 2018 to 2021, were reviewed retrospectively in this research. The study followed the principles in the Declaration of Helsinki. The protocol was approved by the Ethics Committee of Hebei General Hospital (The number of ethics committee: No.202027). All participants signed informed consent prior to enrollment. The inclusion criteria were adult IMN patients with renal biopsy-proven, and the data were available. The clinical parameters and detailed information on renal biopsy were included. Exclusion criteria involved patients with secondary causes of glomerulonephritis, such as hepatitis B/C virus infection, systemic lupus erythematosus, medications, malignancy, and so on. BMI was categorized according to the World Health Organization (WHO) Asian guideline and the BMI ranges established by the Working Group on Obesity in China (WGOC): normal weight (18.5–23.9kg/m2), overweight (24–27.9kg/m2), and obesity (≥28 kg/m2). The BMI cut-off in the WHO classification has categorized BMI≥30 kg/m2 as obesity. As WGOC defined obesity as a lower cut-off of BMI≥28 kg/m2 according to the Asia-Pacific obesity classification, we used a cut-off point for BMI of 28 kg/m2 as obesity in the present study.13,14
Data Collection and Definitions
The study took clinical records when reviewing the kidney biopsies. Baseline demographics and clinical data included gender, age, presence of hypertension, presence of diabetes mellitus (DM), presence of cardiovascular disease, systolic blood pressure (SBP), diastolic blood pressure (DBP), BMI, erythrocyte sedimentation rate (ESR), white blood cell count (WBC), lymphocyte count (LYMP), haemoglobin (HGB), serum albumin (ALB), serum globulin (GLB), serum pre-albumin (pALB), fasting plasma glucose (FPG), blood urea nitrogen (BUN), serum creatinine (Scr), serum uric acid (UA), total cholesterol (TC), triglycerides (TG), low-density lipoprotein-cholesterol (LDL-C), high-density lipoprotein-cholesterol (HDL-C), fibrinogen (FIB), D-Dimer (DDi), anti-PLA2R, 24 h urine proteinuria concentration (UP), microscopic hematuria (urine red blood cell count/high power field, URB/HPF), serum complement 3 (C3), serum complement 4 (C4), serum immunoglobulin G (IgG), serum immunoglobulin M (IgM), and serum immunoglobulin A (IgA) levels. BMI was calculated as (weight in kilograms)/(height in meters).2 The estimated glomerular filtration rate (eGFR) was calculated according to the equation from the Chronic Kidney Disease Epidemiology Collaboration (CKD-EPI).12 The degree of urinary red blood cell sediment was divided into four phases: <3 RBCs/HPF, 0; 3–9 RBCs/HPF, 1; 10–19 RBCs/HPF, 2; >19 RBCs/HPF, 3. The degree of anti-PLA2R antibody was divided into four phases: 0, <20; 1, 20–50; 2, 50–150; 3, >150, labeled as PLA2R.
Histopathologic Parameters
All kidney tissue specimens were obtained through percutaneous needle biopsy. Three renal pathologists of the pathology department reviewed all the pathologic slides. On immunofluorescence microscopy, the severity of mesangial deposition of IgG, IgM, IgA, C3, C4, and C1q was graded as 0 to 3: 0=negative; 1=weak staining; 2=moderate staining; 3=strong staining. Glomerular injuries were categorized into four stages according to Ehrenreich and Churg’s classification criteria. On light microscopy, the percentage of glomerulosclerosis (GS) was assessed quantitatively. The proportion of glomerulosclerosis refers to the ratio of the number of glomeruli characterized with glomerulosclerosis and/or glomerular segmental sclerosis to the total number of glomeruli. The tubulointerstitial lesion was defined as tubular atrophy (TA) and interstitial fibrosis (IF). Renal pathological findings were scored according to the histologic grading system from our hospital. GS was graded from 0 to 2 as follows: 0=absent; 1=mild (<10%); 2=severe (≥10%). The severities of mesangial cell proliferation (MCP), TA, IF, and vascular wall thickness (VWT))were graded from 0 to 1 as follows: 0=absent; 1=present. Combining the five histological parameters, including GS (0–2), MCP (0–1), TA (0–1), IF (0–1), and VWT (0–1), we set a GMTIV score, graded in scale from 0 to 5. The pathological parameters were considered as dichotomous (0 or 1 for absent or present, respectively). Thus, GS graded as stage 0 were considered as absent, and stages 1 or 2 were considered as present. The presence and degree of five histological indicators, GS, MCP, TA, IF, and VWT, were assessed separately or in combination.15–18
Statistical Analysis
This study adopted SPSS statistical software package (version 13.0) to perform statistical analysis. Normally distributed variables were expressed as the mean±SD, and non-normally distributed variables acquired interquartile range (IQR). Qualitative variables were expressed as percentages. For the comparison between the means of the two groups, we used Student t-test for normally distributed data and non-parametric Wilcoxon rank-sum test when samples were not normally distributed. Chi-square, Fisher's exact test, or Pearson Chi-square test were performed appropriately for categorical variables. Pearson or Spearman correlation coefficients were assessed for correlations between BMI and laboratory data. We adopted linear regression analysis to evaluate the association between UP and clinicopathological parameters and performed logistic regression analysis to estimate the odds ratios (ORs) and 95% confidence intervals (CIs) for MCP, TA, IF, and VWT. The ranked data were evaluated by ordinal logistic regression analysis. All statistical analyses were 2-tailed, and the level of significance was set at 0.05.
Results
Characteristics of Participants Stratified by BMI
The mean age of participants was 50.28±12.47 years, and the mean BMI was 26.62±3.38kg/m2. Among the 230 patients, 137 (59.6%) were with normal weight or overweight, and 93 (40.4%) were obese. We compared the clinical characteristics between the two groups based on BMI classification (Table 1). The obese group (group 2) had a higher prevalence of hypertension and diabetes than the overweight and normal-weight group (group 1) (P=0.001, P=0.002). SBP (P=0.005), DBP (P<0.001), HGB (P=0.006), TG (P<0.001), UA (P=0.05), and UP (P=0.012) were higher in the obese group compared to group 1, while the HDL-C (P=0.034) was lower.
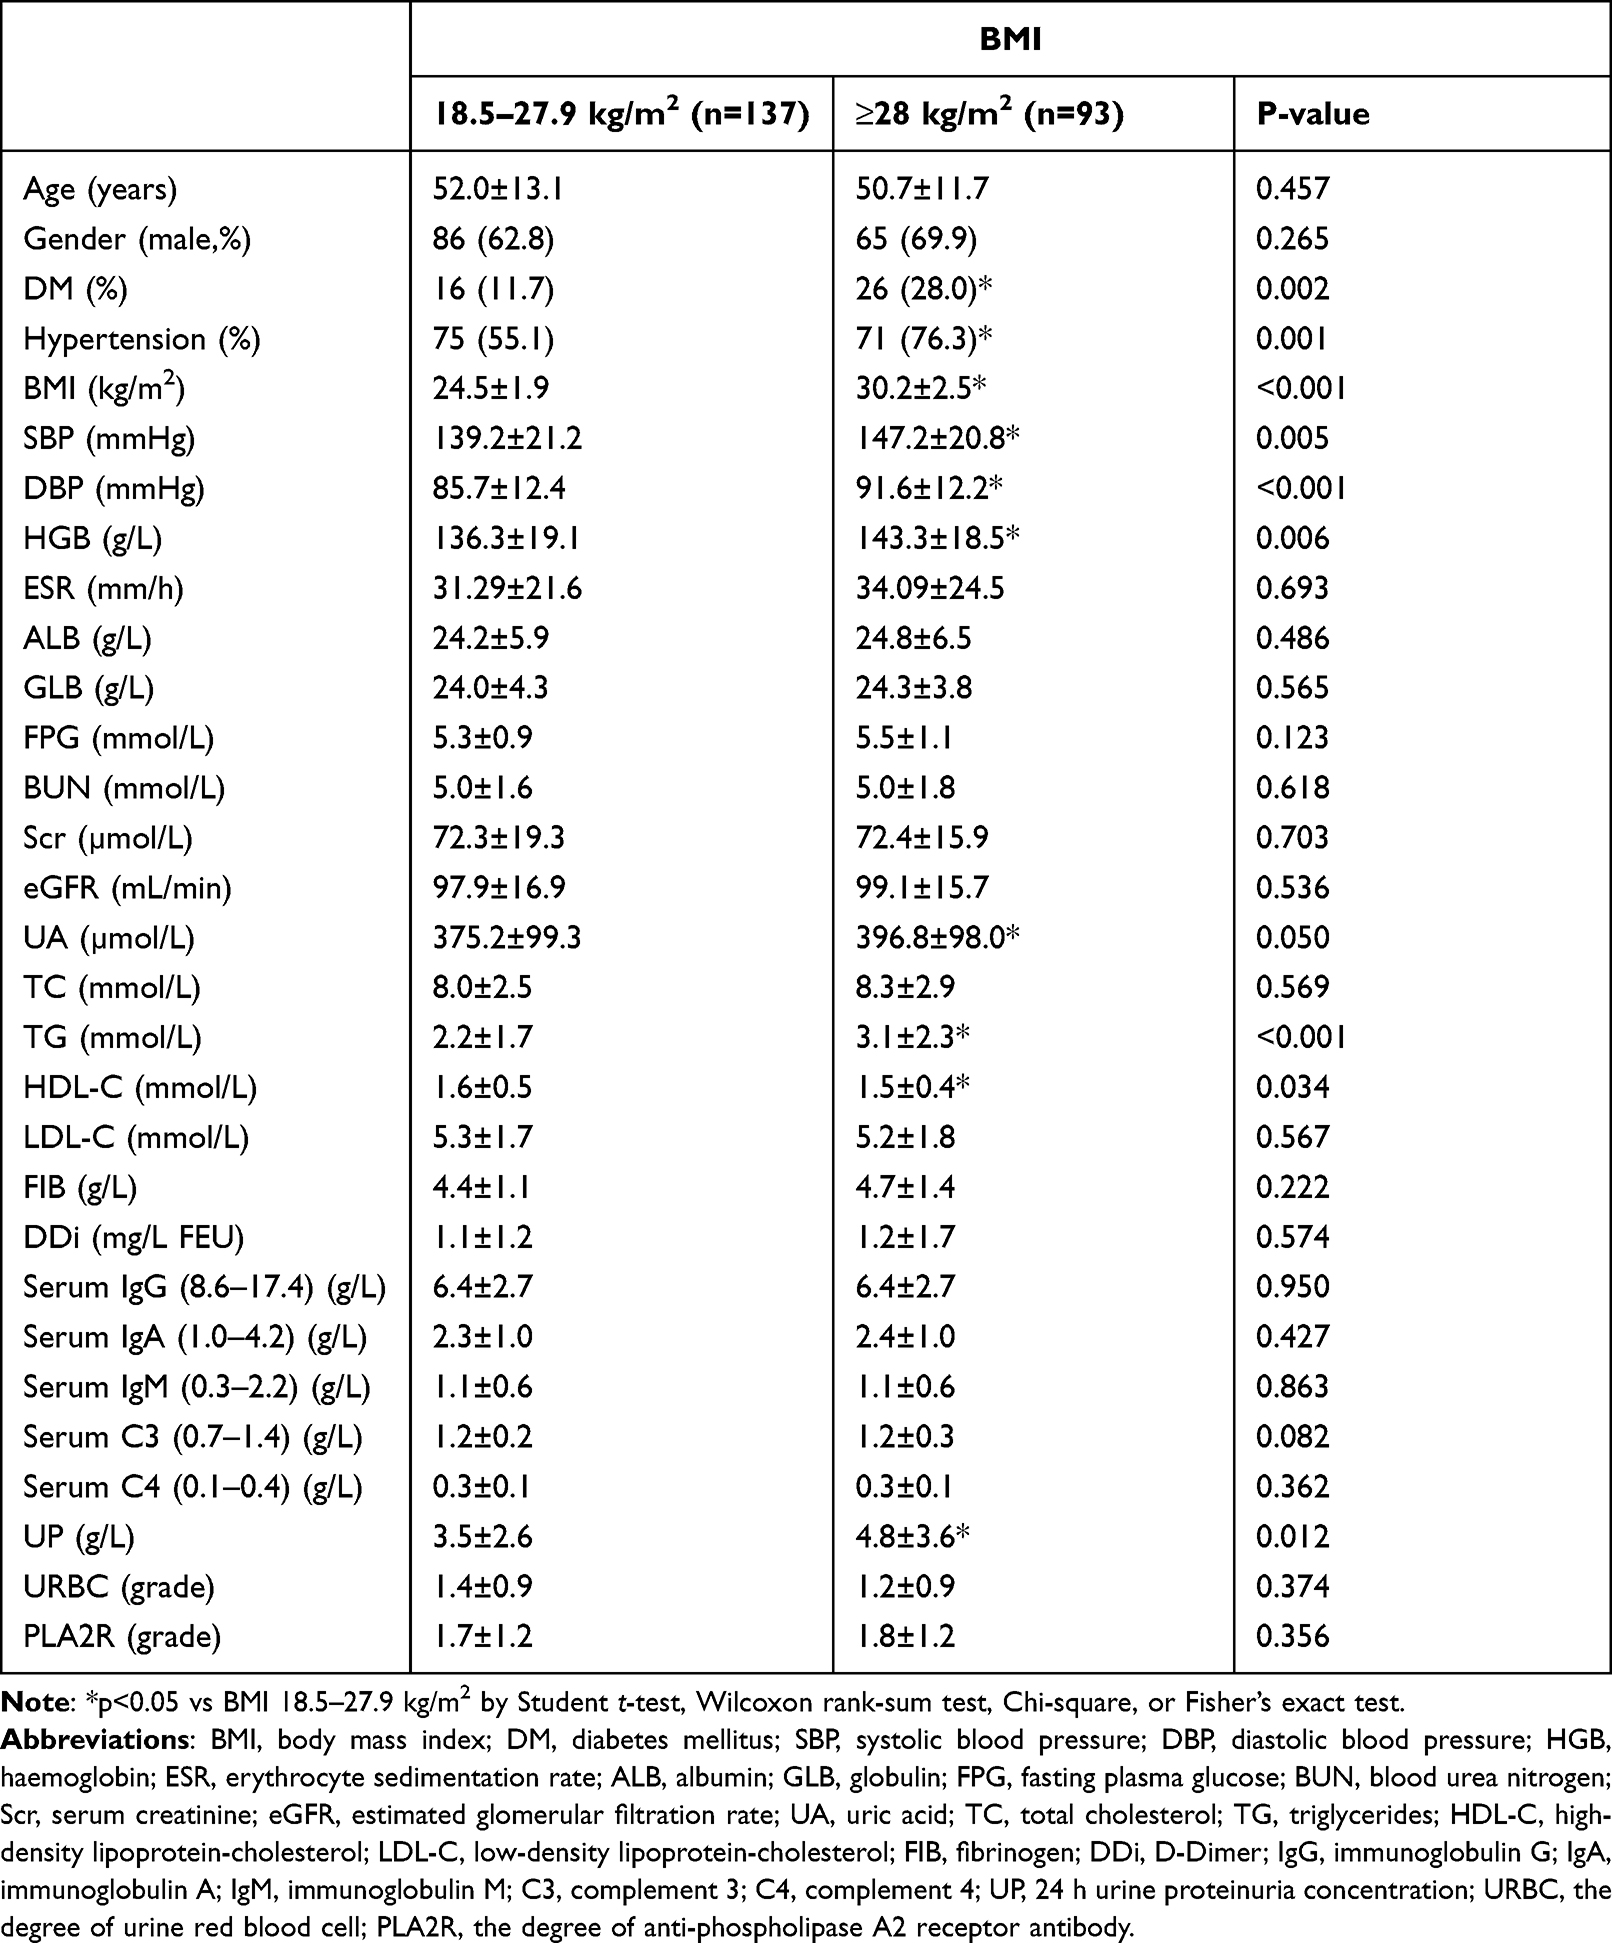 |
Table 1 Clinical Variables of the Two BMI Groups at the Time of Renal Biopsy |
Histopathologic Results of Participants Stratified by BMI
We compared histopathologic features between the two BMI groups in Table 2 and Figure 1. The IgA deposition score was lower (P=0.005), and the MCP (P=0.011), IF (P=0.029), and GMITV (P=0.020) score were higher in the obese group compared to group 1 (Table 2). The IgG, IgM deposition, C3 deposit, C4 deposit, C1q deposit, GS, TA, and VWT score had no significant difference between the two groups (Table 2).
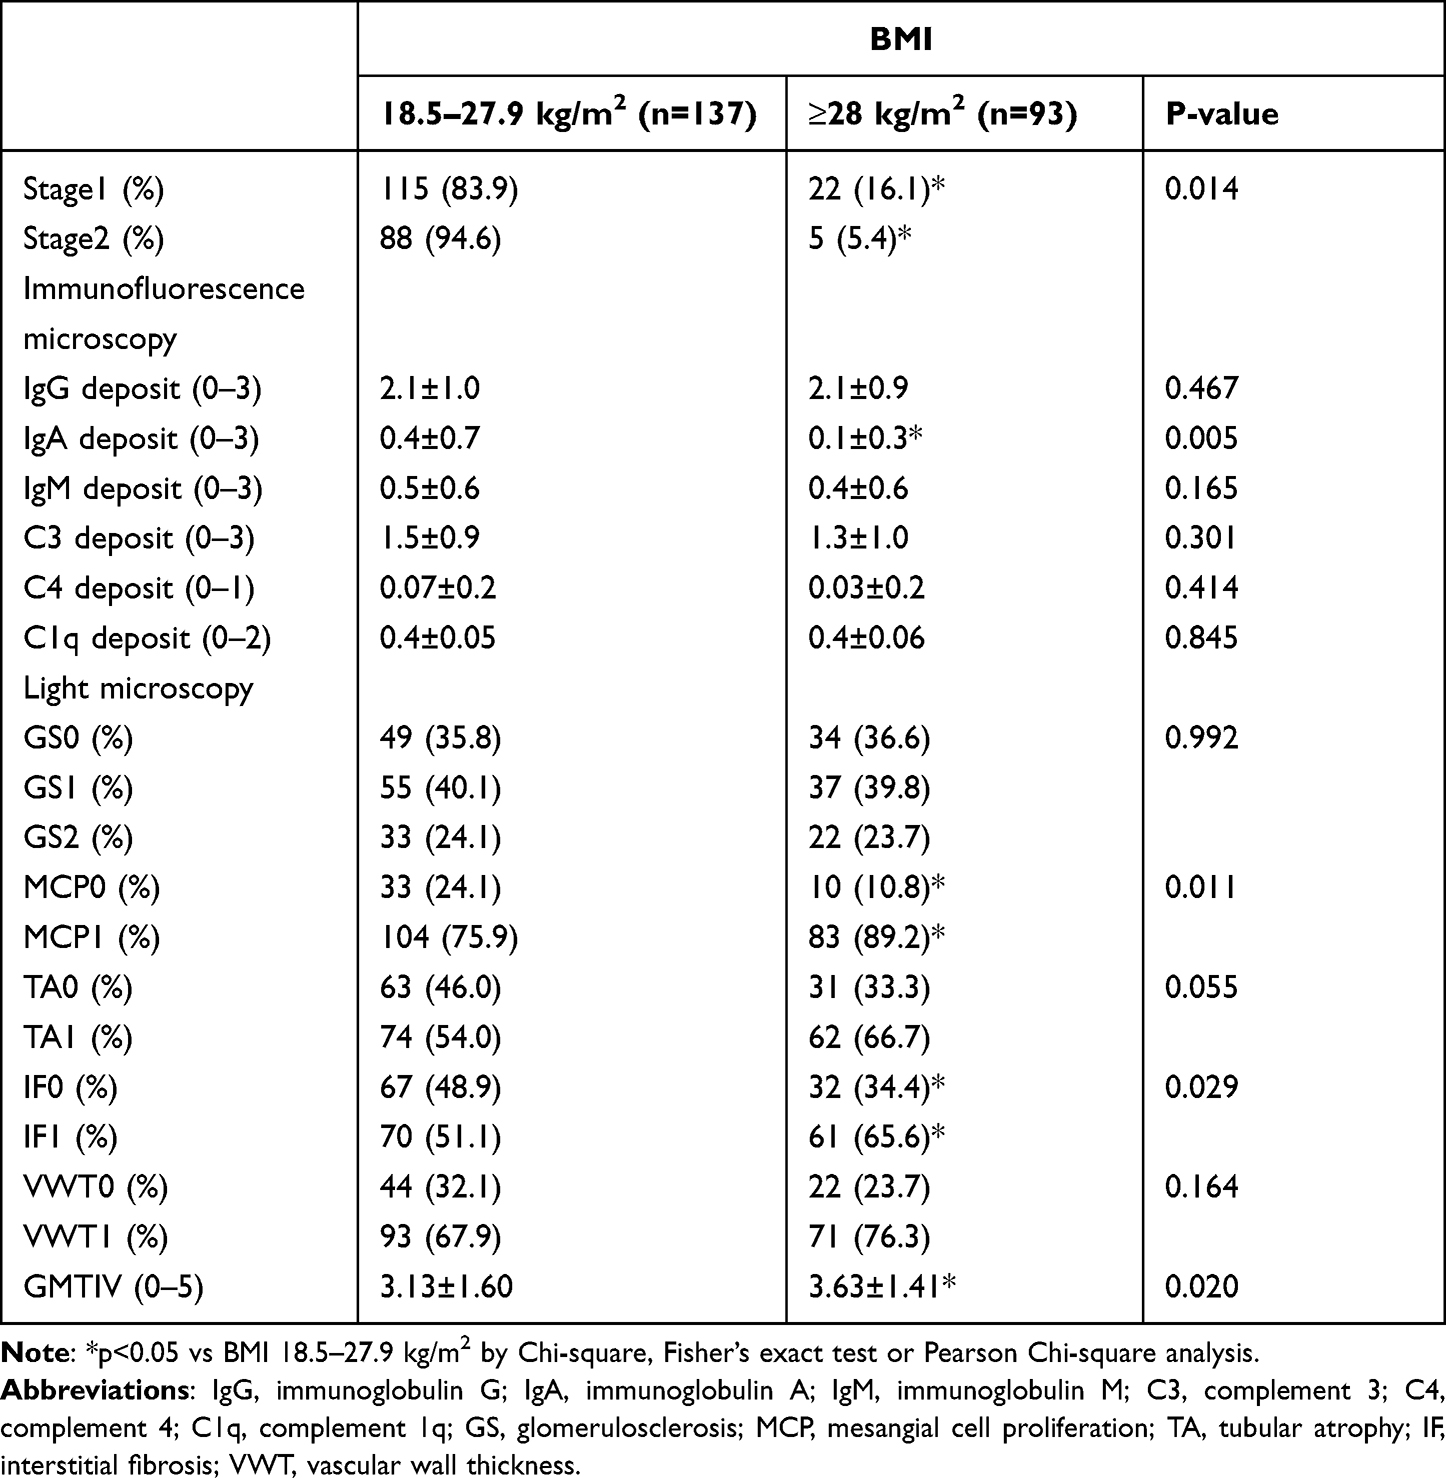 |
Table 2 The Feature and Distribution of Histological Classifications Based on BMI |
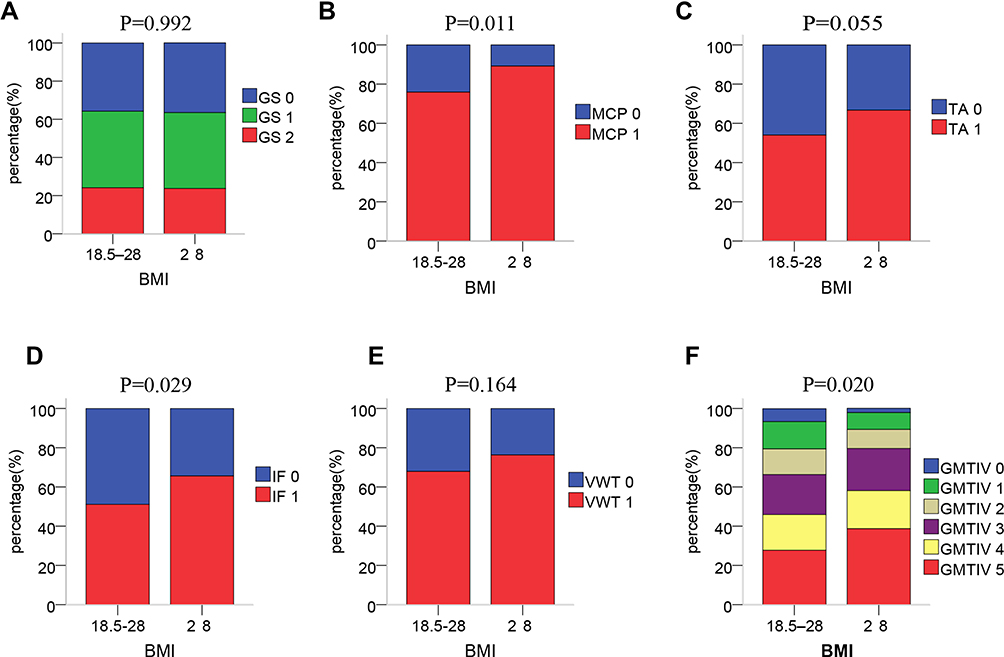 |
Figure 1 The distribution of histopathologic scores according to the two BMI groups. (A) Glomerulosclerosis (GS). The GS score had no statistical difference between the two groups (P=0.992). (B) Mesangial cell proliferation (MCP). The difference in MCP distribution was statistically significant between the two groups (P=0.011). (C) Tubular atrophy (TA). The TA score had no statistical difference between the two groups (P=0.055). (D) Interstitial fibrosis (IF). The difference in IF distribution was statistically significant between the two groups (P=0.029). (E) Vascular wall thickness (VWT). The VWT score had no statistical difference between the two groups (P=0.164). (F) GMTIV score. The difference in GMITV distribution was statistically significant between the two groups (P=0.020). |
Correlation Between BMI and Clinicopathological Parameters
The correlation between BMI and clinicopathological indicators was assessed using Pearson or Spearman correlation analysis. The research revealed that there was a positive relationship between BMI and SBP (r=0.250, P<0.001), DBP (r=0.297, P<0.001), HGB (r=0.136, P=0.040), UP (r=0.211, P=0.001), TG (r=0.304, P<0.001), UA (r=0.131, P=0.047), and serum C3 levels (r=0.166, P=0.014), and a negative relationship between BMI and pALB (r=−0.155, P=0.038), HDL (r=−0.143, P=0.034) (Figure 2). BMI was closely associated with the incidence of hypertension (r=−0.295, P<0.001) and diabetes (r=−0.246, P<0.001). BMI was positively correlated with MCP (r=0.154, P=0.019), TA (r=0.138, P=0.036), IF (r=0.160, P=0.015), GMTIV (r=0.175, P=0.008) and negatively associated with IgA deposition (r=−0.189, P=0.004).
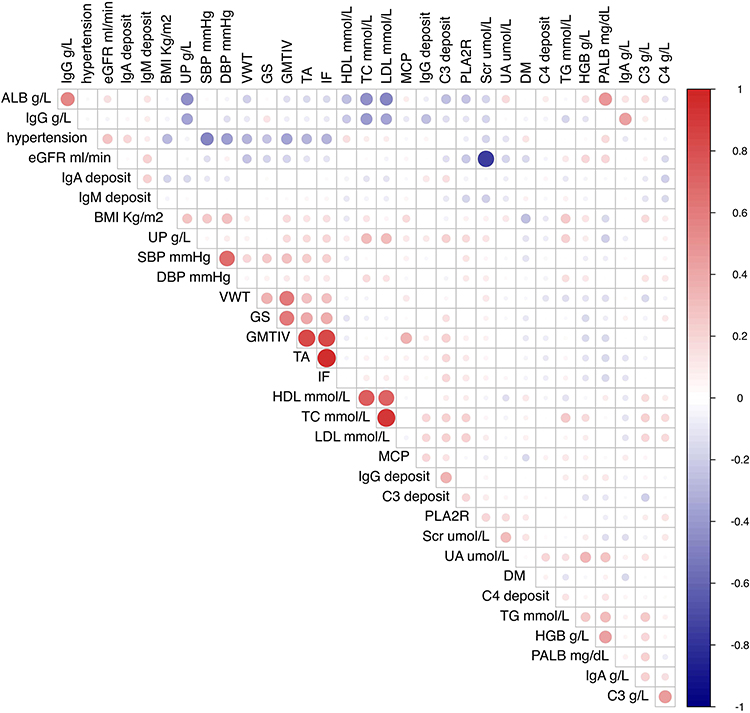 |
Figure 2 The correlation between BMI and clinicopathological parameters. Abbreviations: BMI, body mass index; DM, diabetes mellitus; SBP, systolic blood pressure; DBP, diastolic blood pressure; HGB, haemoglobin; ALB, albumin; PALB, pre-albumin; Scr, serum creatinine; eGFR, estimated glomerular filtration rate; UA, uric acid; TC, total cholesterol; TG, triglycerides; HDL-C, high-density lipoprotein-cholesterol; LDL-C, low-density lipoprotein-cholesterol; immunoglobulin G; IgA, immunoglobulin A; IgM, immunoglobulin M; C3, complement 3; C4, complement 4; UP, 24 h urine proteinuria concentration; PLA2R, the degree of anti-phospholipase A2 receptor antibody; GS, glomerulosclerosis; MCP, mesangial cell proliferation; TA, tubular atrophy; IF, interstitial fibrosis; VWT, vascular wall thickness. Note: The color and size of the circles in the matrix represent the level of correlation: red represents a positive correlation and blue represents a negative correlation. |
Independent Correlation Between BMI and UP/Anti-PLA2R
The relationship between BMI and UP was evaluated by adjusting for confounding variables in linear regression analysis (Table 3). BMI showed a positive and linear relationship with UP in univariable analysis, while this relationship was not significant in multivariable analysis when gender, L, URBC, pALB, HDL, FIB, DDi, IgG, anti-PLA2R, C3 deposit were adjusted. Factors significantly associated with UP were L, pALB, IgG, URBC, anti-PLA2R, and C3 deposit using multivariable analysis (adjusted R2=0.343).
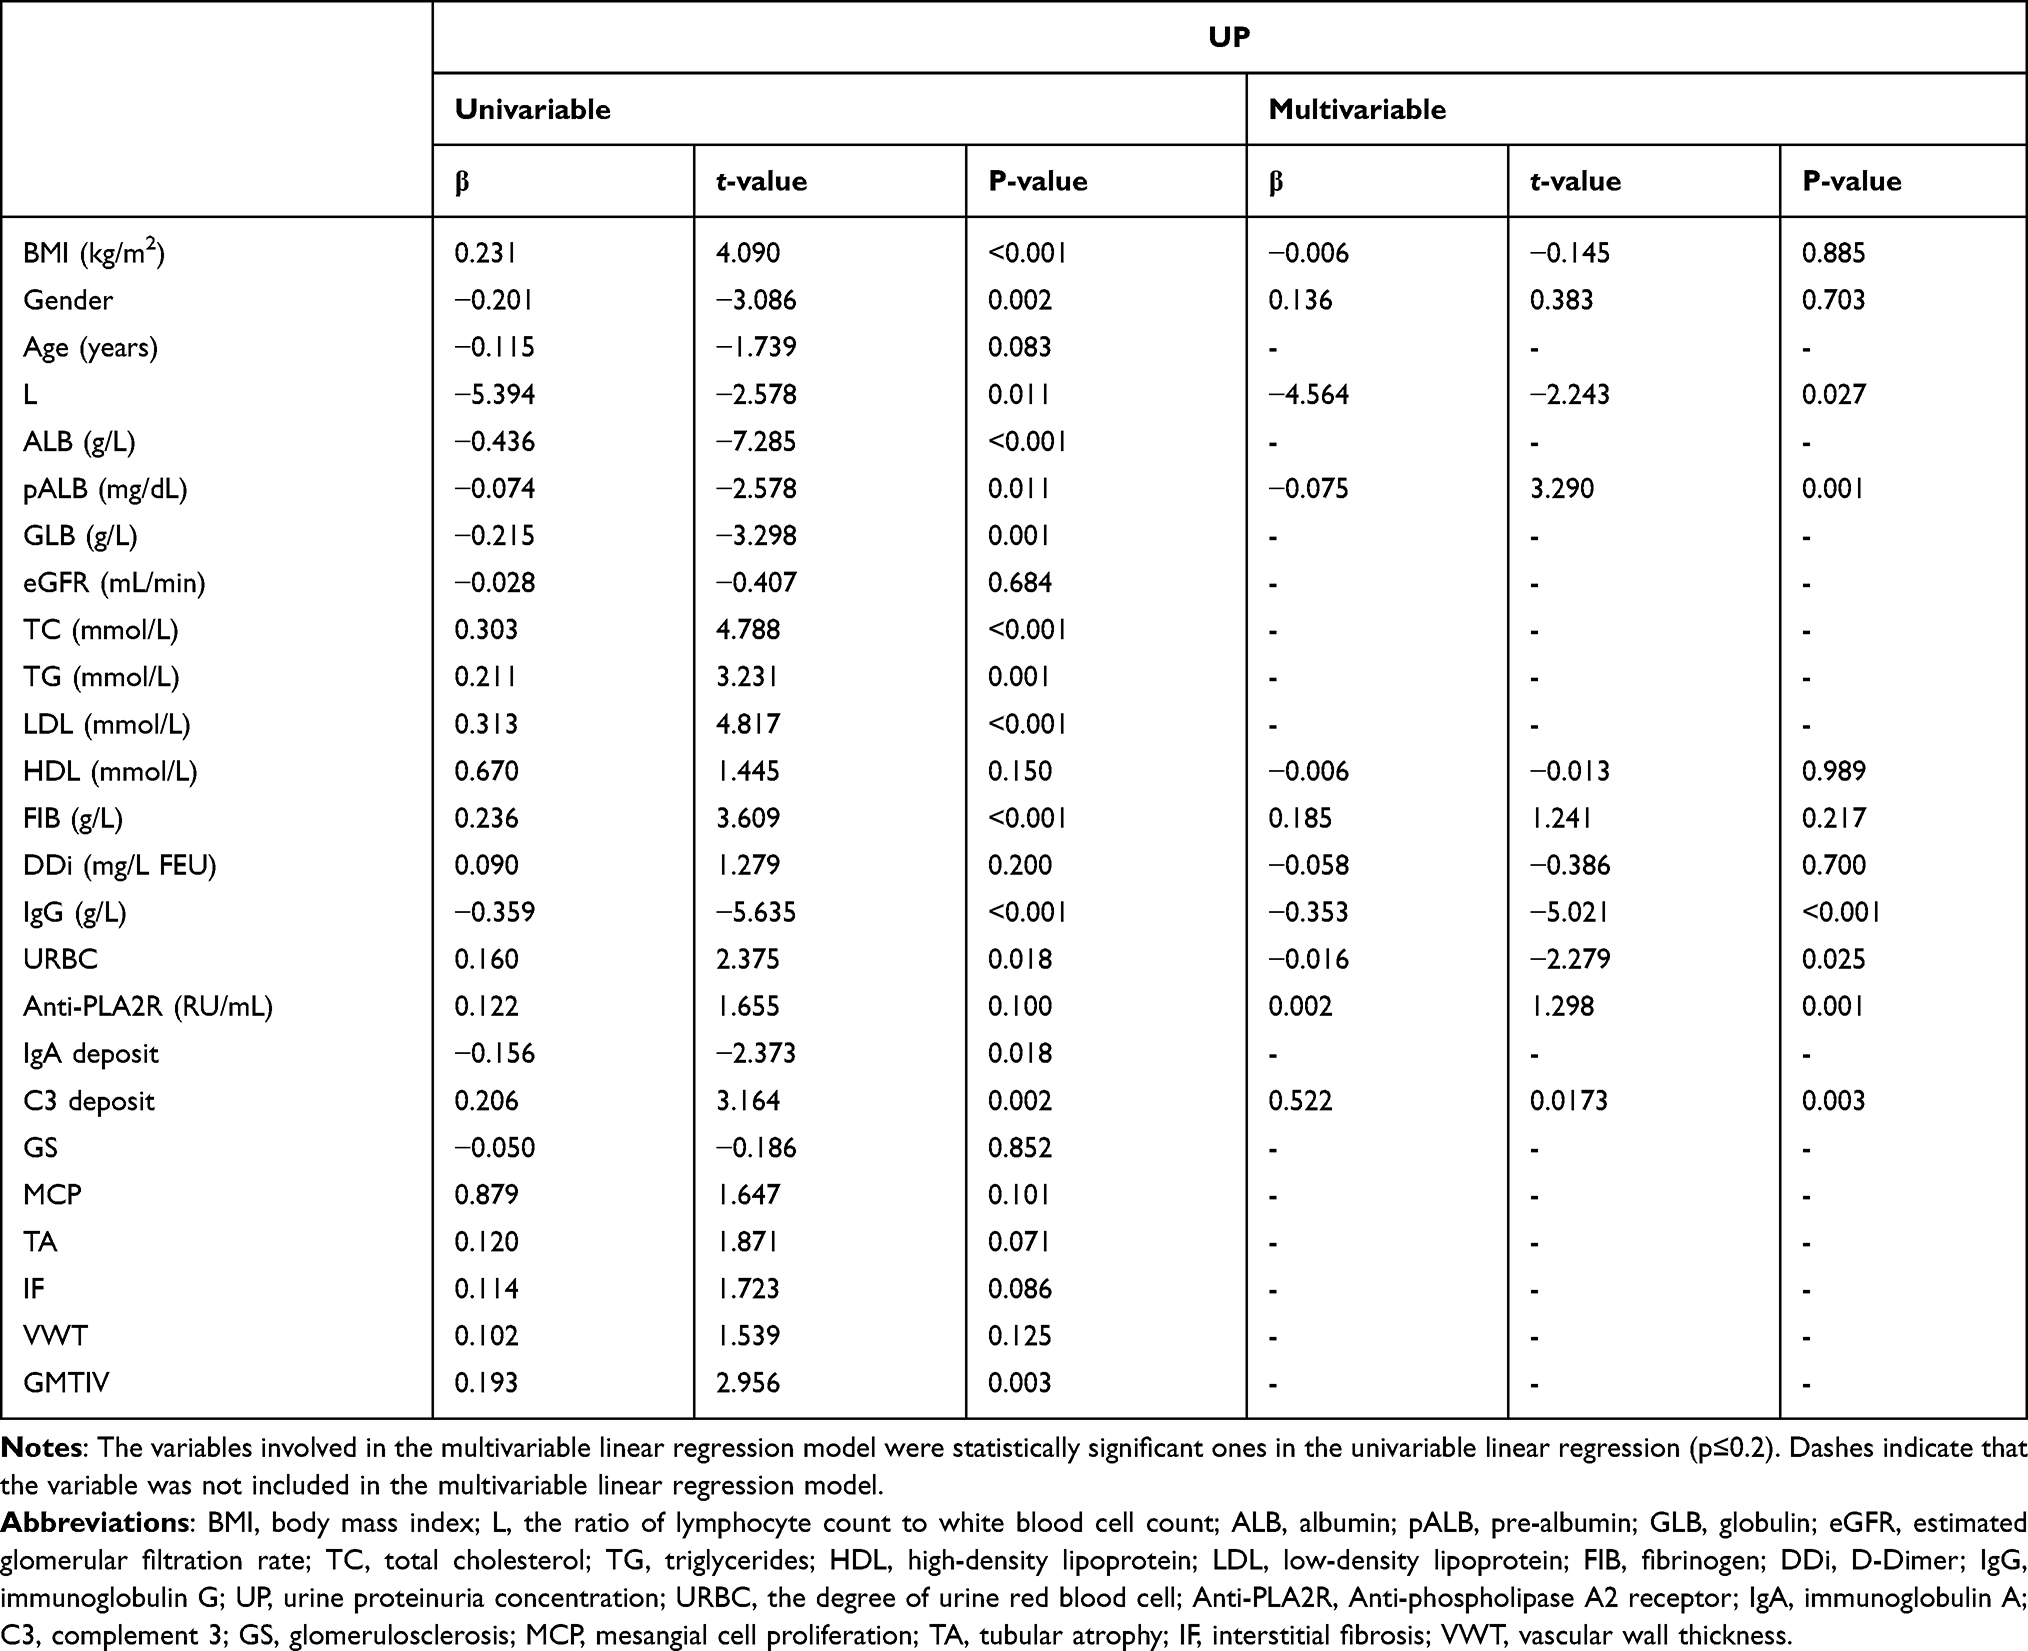 |
Table 3 Linear Regression Analysis for Clinicopathological Parameters and UP |
Table 4 shows how clinicopathological parameters made impacts on PLA2R. PLA2R was only associated with age (OR=1.036, P=0.012) when unadjusted. Model 1 illustrated that PLA2R was correlated with age (OR=1.031, P=0.015) and UA (OR=1.004, P=0.011) after adjusting for DDi and gender. Model 2 demonstrated that PLA2R was associated with age (OR=1.030, P=0.010), UP (OR=1.100, P=0.047), UA (OR=1.003, P=0.021) after adjusting for ALB, URB, IgM deposit, L, DDi, and gender.
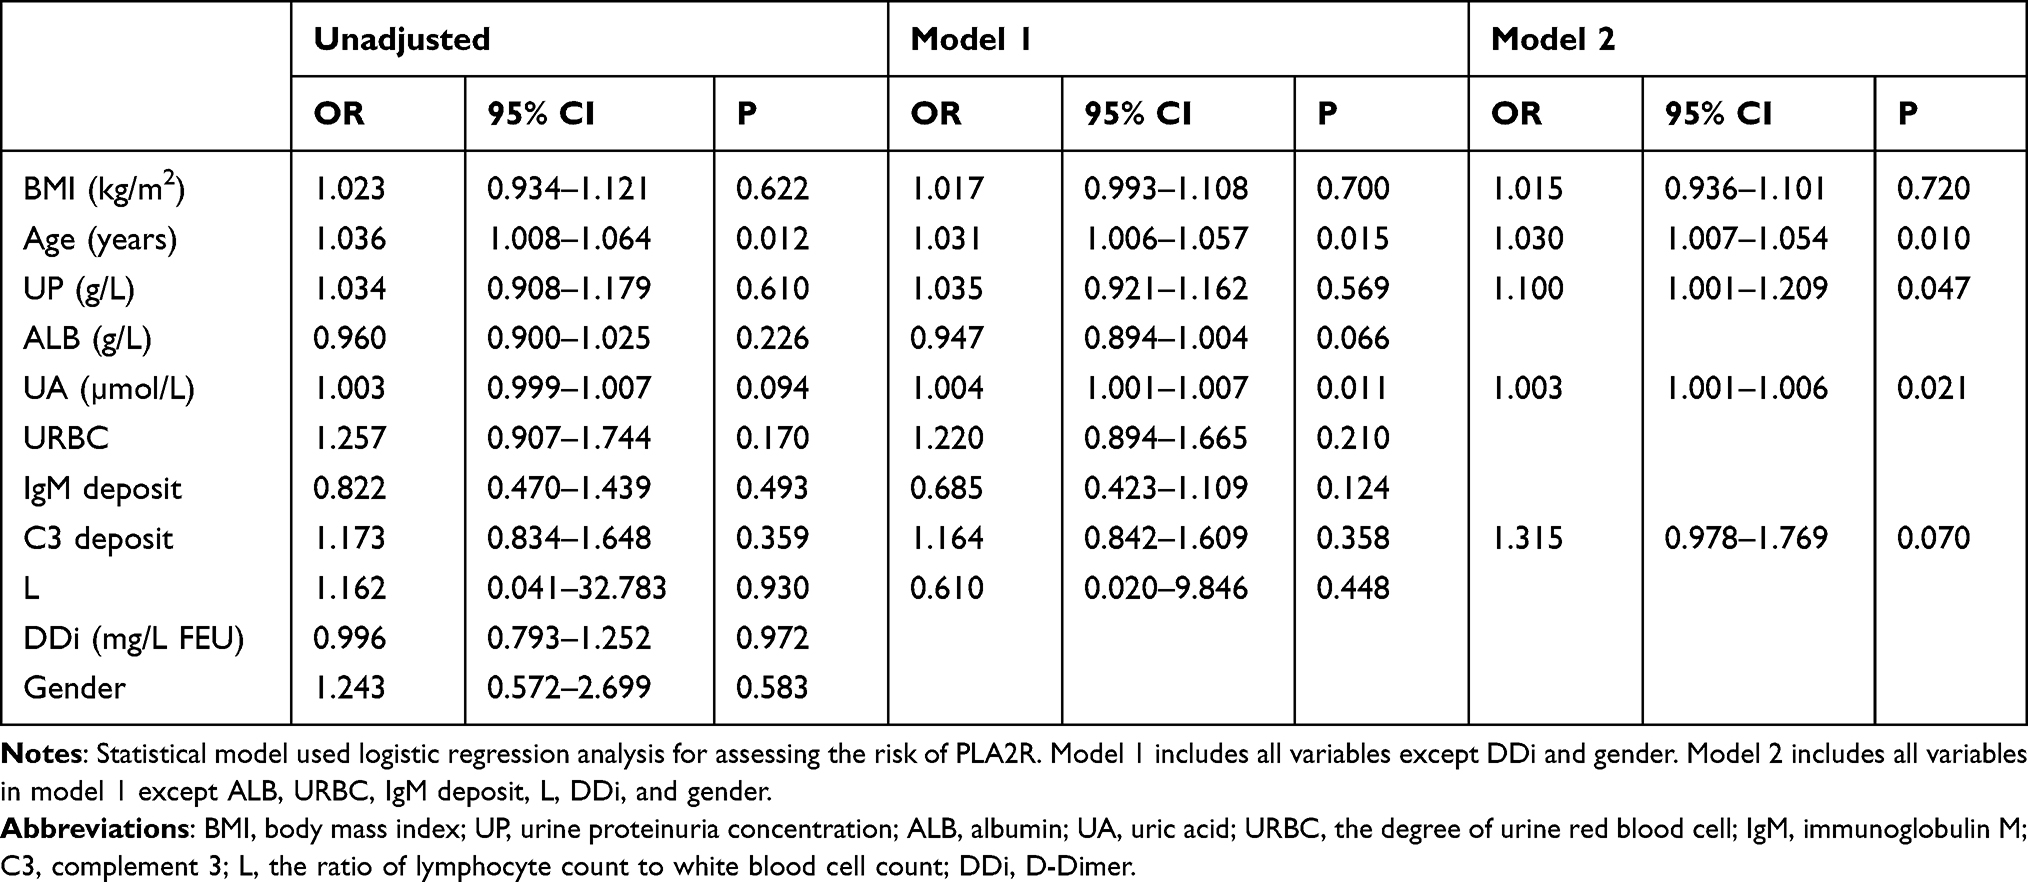 |
Table 4 Ordinal Logistic Regression Analysis for Clinicopathological Parameters and PLA2R |
Independent Correlation Between BMI and Histopathologic Parameters
Table 5 shows that scores for MCP were positively correlated with BMI after adjusting for confounding factors. Ordinal logistic regression analysis demonstrated that GS was correlated with age (OR=1.036, P=0.017) and C3 deposit (OR=1.384, P=0.024). We adopted binary logistic regression analysis to illustrate the association between BMI and histopathologic parameters. MCP was relevant to BMI (OR=2.528, P=0.036), IgG deposit (OR=1.471, P=0.043). TA was associated with hypertension (OR=0.304, P=0.008) and C3 deposit (OR=1.477, P=0.044). IF was related to hypertension (OR=0.341, P=0.005) and C3 deposit (OR=1.461, P=0.038) as well. VWT was correlated to age (OR=1.052, P=0.001) and C3 (OR=0.281, P=0.049).
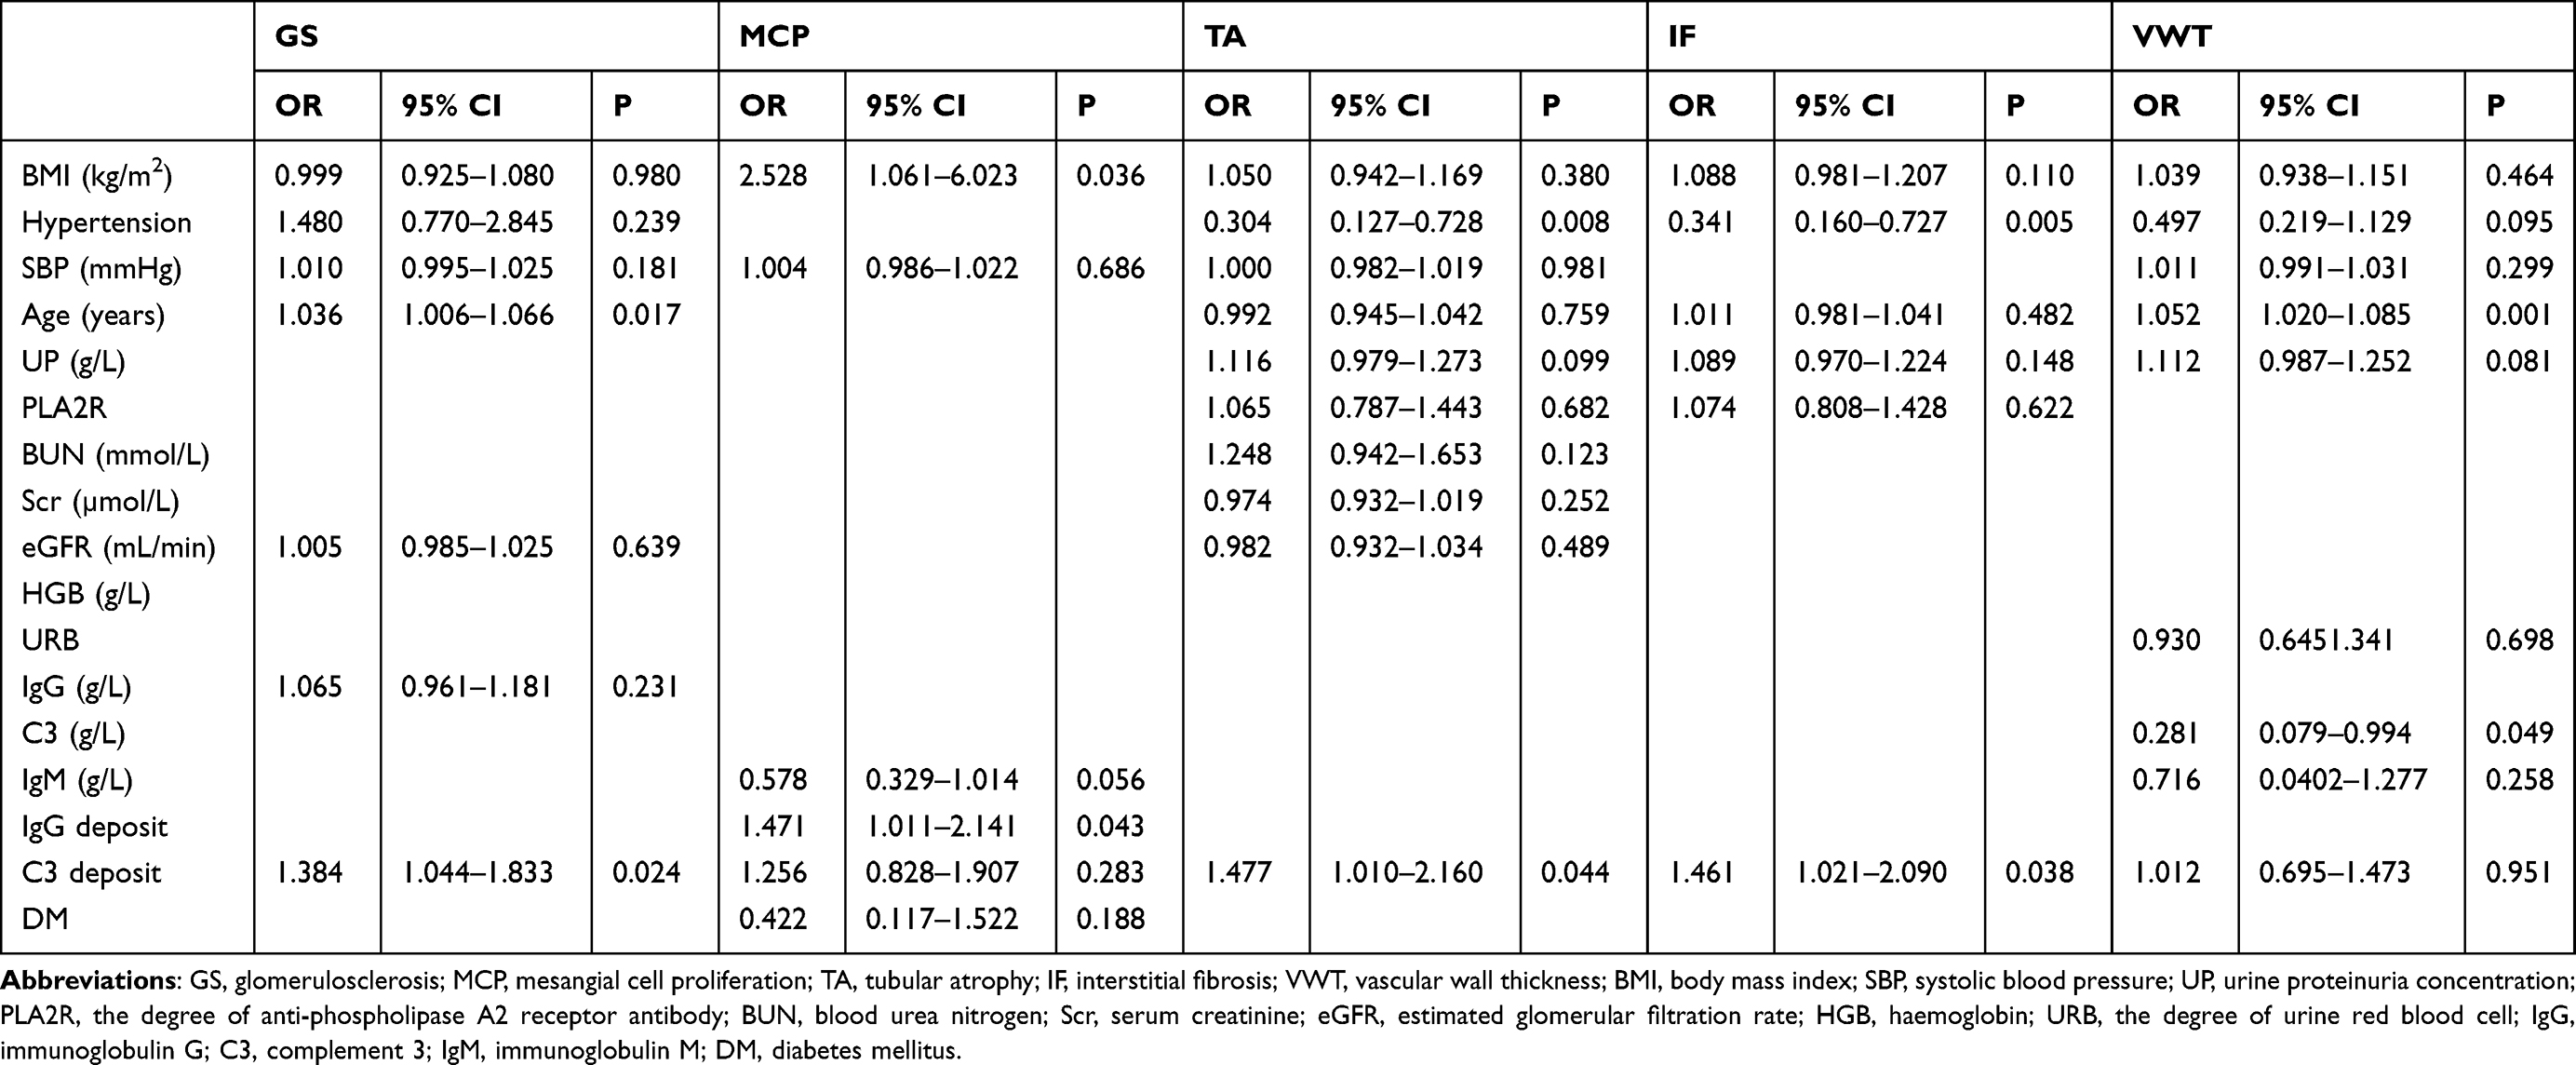 |
Table 5 Logistic Regression Analysis for Pathological Parameters and Laboratory Indexes |
Clinical factors associated with GMTIV were evaluated through ordinal logistic regression analysis, and the results are shown in Table 6. GMTIV was associated with the age (OR=1.027, P=0.087), hypertension (OR=2.311, P=0.020), IgM (OR=1.445, P=0.005), C3 deposit (OR=1.439, P=0.020) when unadjusted. After adjusting for ESR and HGB (Model 1), GMTIV was correlated to age (OR=1.031, P=0.028), UP (OR=1.109, P=0.026), SBP (OR=1.014, P=0.048), hypertension (OR=2.017, P=0.029), and C3 deposit (OR=1.655, P=0.001). In Model 2, when UP, SBP, eGFR, and IgM were adjusted, GMTIV was associated with BMI (OR=1.114, P=0.010), hypertension (OR=2.986, P=0.001), and C3 deposit (OR=1.655, P=0.001).
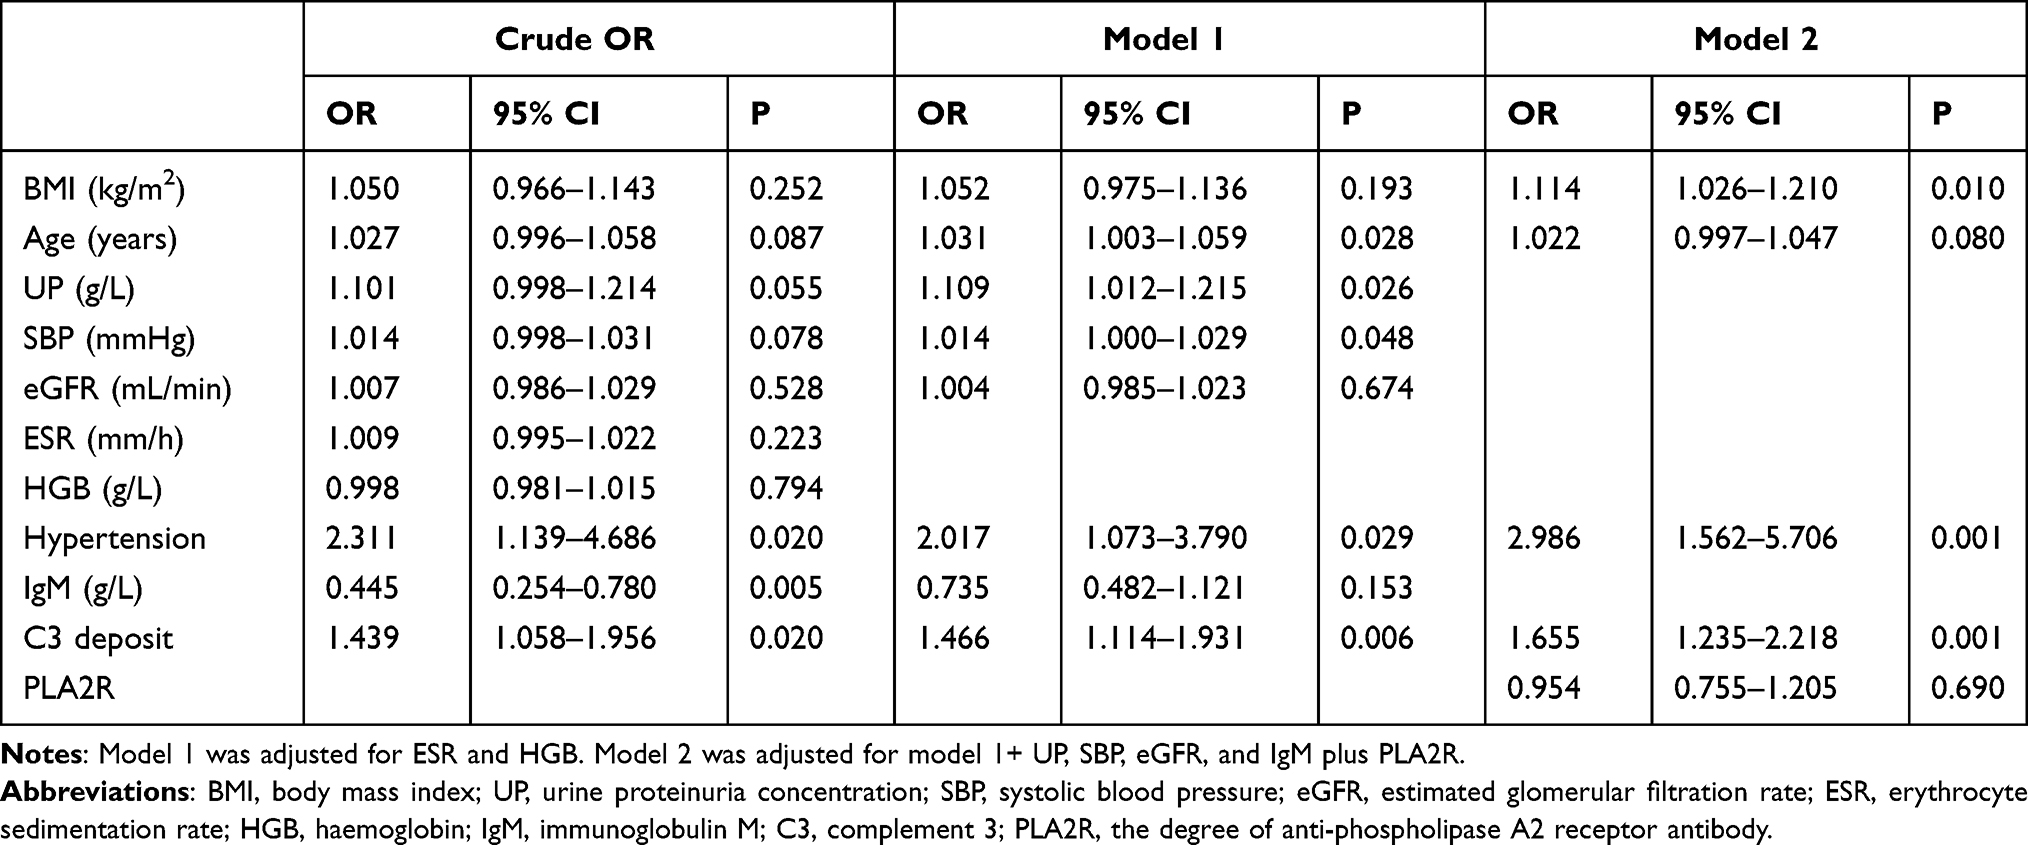 |
Table 6 Ordinal Logistic Regression Analysis for Clinicopathological Variables and GMTIV |
Discussion
CKD is a public health issue with lots of risk factors, and it is increasing in prevalence and incidence worldwide. The outcome ranges from a self-limited status to ESRD.7,19 In recent years, epidemiological studies have witnessed an increasing prevalence of primary glomerulonephritis or primary nephrotic syndrome, which was a common presentation of CKD.20 MN is one of the most common presentations of primary glomerular diseases, of which IMN accounts for approximately 80%.15,21 IMN is an autoimmune-mediated glomerulonephritis, which is characterized by diffuse thickening of GBM and subepithelial deposits of immunocomplex. Although one-third of IMN patients have achieved spontaneous remission, about 30% of the patients progress to renal failure or even ESRD.19,21,22
IMN has polymorphic characteristics based on its clinicopathological features. Recent studies have confirmed some pathological lesions as independent predictors of renal function deterioration.23 Hence, clinical outcomes should not solely depend on the clinical indicators available. The histopathological features of IMN also play an indispensable role in the assessment of the disease progression.17,20,24 Glomerulosclerosis is the result and one of the major pathological bases of CKD. Mesangial proliferation is a hallmark of many glomerulonephrites, which may ultimately cause glomerulosclerosis. Moreover, tubulointerstitial injuries are widely accepted as the common outcome of disease progression. Recent studies demonstrated that vascular hyalinization should be regarded as histological parameters independently in the progress of renal function. Stangou et al found that the four parameters, including GS, TA, IF and VWT, had significant association with renal function outcome and prognosis.4,17 Therefore, this study intended to search for a simplified grading of histological parameters in IMN for further assessment, namely: 1) the presence of GS, 2) MCP, 3) degree of TA, 4) severity of IF, 5) VWT, and a combination of above histological parameters (the GMTIV score). The simplified GMTIV score is similar to the MEST score used in the estimation of IgAN severity, according to the presence of mesangial (M), endocapillary (E), glomerular sclerosis (S), and tubular atrophy (T).16,17
The prevalence of obesity has increased dramatically. This worldwide obesity epidemic has produced more medical attention.25 Also, obesity has become a significant predictor for ESRD in CKD patients.26,27 Overweight and obesity are closely relevant to CKD. The links between them are complex and numerous. Several mechanisms included in the relationship between obesity and CKD have been proposed.10,22 BMI is a convenient and critical index for assessing overweight and obesity. Several studies have indicated a U-shaped association between BMI and mortality in the 20–25 kg/m2 of weight range.2,24,28 A few studies have focused on the correlation between BMI and prognosis in IgAN. Most of them demonstrated that high BMI was a risk factor for progression in IgAN.4,5 However, Berthoux et al revealed that elevated BMI had no direct influence on IgAN progression, which appeared to accelerate hypertension and proteinuria.29 It was possible that excessive BMI indirectly accelerated IgAN progression by leading to metabolic syndrome for patients. Thus, current researches have shown inconsistent conclusions on the associations between BMI and progression of IgAN,30 and the correlation between obesity and MN remains unknown.
In this study, we performed a comprehensive investigation based on the histopathological and clinical parameters of IMN to explore their clinical applications. The obese group had a higher prevalence of hypertension and diabetes than the overweight/normal weight group. SBP, DBP, HGB, TG, UA, UP, MCP, IF, and GMITV were higher in the obese group compared to the other group, while the HDL-C and IgA deposition score were lower. BMI and UP showed a positive and linear relationship in univariable analysis. However, this relationship was not significant in multivariable analysis when gender, L, URBC, pALB, HDL, FIB, DDi, IgG, anti-PLA2R, and C3 deposit were adjusted. Factors significantly associated with UP were L, pALB, IgG, URBC, anti-PLA2R, and C3 deposit in multivariable analysis. This result revealed that PLA2R was associated with age, UP, and UA after ALB, URB, IgM deposit, L, DDi, and gender were adjusted. MCP were positively correlated to BMI independently, after adjusting for confounding factors. Logistic regression analysis demonstrated that GS, TA, IF, and GMTIV were correlated to C3 deposit respectively. After adjusting for ESR, HGB, UP, SBP, eGFR, and IgM, GMTIV is associated with the BMI independently. Our study was the first one to show an independent association between BMI and MCP in IMN.
MN is primarily mediated by autoreactive antibodies. Evidence suggests that M-PLA2R is a predominant target antigen in IMN during the last decades, and anti-PLA2R antibody has been defined as a significant biomarker for MN diagnosis. The natural course of IMN varies considerably. Thus, factors that affect the prognosis of IMN are crucial. Several risk factors, such as male gender, advanced age, decreased eGFR, and persistent severe proteinuria, have been identified.15,18 Recent studies have shown that a persistent high concentration of anti-PLA2R antibodies is an important indicator for poor prognosis of IMN. Our results confirmed that PLA2R was associated with age and UP.
Another interesting result was that obesity was not independently correlated to proteinuria in IMN. In this study, obese patients had an increased 24 h proteinuria concentration compared to the other group, but there was no significant association in multivariable analysis. Obesity had no significant impact on serum creatinine or eGFR, which all suggested that obesity may not be independently correlated to increased proteinuria and decreased renal function in MN. This study also revealed that obese patients with IMN had more prevalence of hypertension, diabetes, and dyslipidemia. Multiple unhealthy lifestyle behaviors, such as increased energy intake, low physical activity, smoking, and drinking, will lead to metabolic syndrome and renal disease progression for obese patients.31
No study has investigated the impact of obesity on clinicopathological parameters in MN up to now. Hong et al reported that obesity was independently associated with mesangial matrix expansion or patients with IgAN. It was found that increased mesangial matrix and mesangial cell proliferation were more common in obese patients compared to normal weight people.4 Therefore, in mesangial lesions of glomerular disease, although the exact mechanism remains unclear, obesity may play an important pathogenetic role. It was suggested that obesity could stimulate the expression of transforming growth factor-β1 (TGF-β1) by a rise of leptin concentration due to obesity. TGF-β1 is recognized as a multifunctional cytokine that regulates extracellular matrix accumulation, mesangial cell proliferation, and glomerulosclerosis.32 This paper supports the fact that obesity could independently increase MCP after adjustment for confounding factors in IMN, where BMI was an independent risk factor for MCP and GMTIV.
Our research proved that C3 deposition was independently correlated to UP, GS, TA, IF, and GMTIV. Previous studies demonstrated that local complement activation played an important role in the pathogenesis of IgAN. Mesangial C3 deposit, which was defined as an independent risk factor for IgAN progression, was related to active inflammation in IgAN.33 C3 deposits were first detected from IMN in 1984.16,17 Patients with glomerular C3 deposits have proteinuria with a more severe symptom, which supports the relationship between complement activation and severity of IMN.17 The greater deposition of C3 predicts a poor prognosis of glomerular disease.19 Moreover, Oto OA et al suggested a strong association between complement deposits and MN progression.18 In conclusion, patients with extensive glomerular C3 deposition have a worse clinical presentation and poor prognosis than those with mild C3 deposition. Patients of IMN with extensive glomerular C3 deposition tend to receive more immunosuppressants in treatment. With increasing incidence of immunosuppressive treatment for IMN, infections associated with immunosuppressive therapy have been surging. Financial burden experienced by patients undergoing infection treatment will also be affected. Sarier et al reported that patients with immunosuppressive treatments suffered not only from common uropathogens but also from unusual uropathogens that cannot be detected with conventional urine culture method. More effective treatments were needed with the help of real-time multiplex polymerase chain reaction assay.34 So the glomerular C3 deposition may provide a pathological argument for the prescription option with avoidance of immunosuppressive agent overuse.
This study had two major advantages. First, all the comprehensive pathological parameters were involved, which made the results more reliable. Second, the anti-PLA2R antibody was enrolled as a prognostic factor. The severity of IMN was related to positivity and high level of anti-PLA2R antibody. Even though the clinical diagnosis value was based on positive anti-PLA2R antibodies for IMN, these arguments highlighted the necessity of kidney biopsy pathology. Therefore, we believe that the histological severity can affect the long-term renal outcome.
There were a few limitations. First, our study was limited by its retrospective cross-sectional design with uncertain causality and possible confounding factors. Second, there was no longitudinal multicenter prospective study to define the clinicopathological impact of BMI in IMN. Third, only Chinese patients were involved, so the results could not be generalized to other ethnicities. Finally, this study did not measure skinfold thickness, waist circumference, and waist-to-hip ratio to assess obesity with higher accuracy.
Conclusions
Obesity may play an important pathogenetic role in mesangial lesions in IMN patients. The structural and pathological changes in kidney resulting from obesity might affect followed renal outcome in IMN. In conclusion, the combination of histological parameters, which is a novel, comprehensive and simplified score, may help in the assessment of IMN severity and option of treatment strategies. Treatment to lose weight may be an effective method to prevent the deterioration of renal function.
Disclosure
The authors report no conflicts of interest in this work.
References
1. Xie L, Wang B, Jiang C, et al. BMI is associated with the development of chronic kidney diseases in hypertensive patients with normal renal function. J Hypertens. 2018;36(10):2085–2091. doi:10.1097/HJH.0000000000001817
2. Wu C, Wang AY, Li G, Wang L. Association of high body mass index with development of interstitial fibrosis in patients with IgA nephropathy. BMC Nephrol. 2018;19(1). doi:10.1186/s12882-018-1164-2
3. Cai H, Zhan Y, Lu J, et al. Body mass index combined with waist circumference can predict moderate chronic kidney disease: a retrospective study. Medicine. 2021;100(12):e25017. doi:10.1097/MD.0000000000025017
4. Hong YA, Min JW, Ha MA, et al. The impact of obesity on the severity of clinicopathologic parameters in patients with IgA nephropathy. J Clin Med. 2020;9(9):2824. doi:10.3390/jcm9092824
5. Kataoka H, Ono K, Mochizuki T, et al. A body mass index-based cross-classification approach for the assessment of prognostic factors in chronic kidney disease progression. Kidney Blood Press Res. 2019;44(3):362–383. doi:10.1159/000501021
6. Juszczak F, Vlassembrouck M, Botton O, et al. Delayed exercise training improves obesity-induced chronic kidney disease by activating AMPK pathway in high-fat diet-fed mice. Int J Mol Sci. 2020;22(1):350. doi:10.3390/ijms22010350
7. Wei C, Li T, Xuan X, Hu H, Xiao X, Li J. Serum albumin predicts hyperuricemia in patients with idiopathic membranous nephropathy. Clin Nephrol. 2021;96(4):191–198. doi:10.5414/CN110524
8. Zhang XD, Cui Z, Zhang MF, et al. Clinical implications of pathological features of primary membranous nephropathy. BMC Nephrol. 2018;19(1):215. doi:10.1186/s12882-018-1011-5
9. Wei C, He Y, Li T, et al. Glomerulosclerosis predicts poor renal outcome in patients with idiopathic membranous nephropathy. Int Urol Nephrol. 2021;53(3):505–514. doi:10.1007/s11255-020-02641-5
10. Nagaraju SP, Rangaswamy D, Mareddy AS, et al. Impact of body mass index on progression of primary immunoglobulin a nephropathy. Saudi J Kidney Dis Transplant. 2018;29(2):318–325. doi:10.4103/1319-2442.229261
11. Ouyang Y, Xie J, Yang M, et al. Underweight is an independent risk factor for renal function deterioration in patients with IgA nephropathy. PLoS One. 2016;11(9):e0162044. doi:10.1371/journal.pone.0162044
12. Levey AS, Stevens LA, Schmid CH, et al. A new equation to estimate glomerular filtration rate. Ann Intern Med. 2009;150(9):604–612. doi:10.7326/0003-4819-150-9-200905050-00006
13. WHO Expert Consultation. Appropriate body-mass index for Asian populations and its implications for policy and intervention strategies. Lancet. 2004;363(9403):157–163. DOI:10.1016/S0140-6736(03)15268-3
14. Chinese Society of Endocrinology. Multidisciplinary clinical consensus on diagnosis and treatment of obesity (2021 edition). Chin J Endocrinol Metab. 2021;37(11):959–972. DOI:10.3760/cma.j.cn311282-20210807-00503
15. Wu D, Yu Z, Zhao S, Qu Z, Sun W, Jiang Y. Lipid metabolism participates in human membranous nephropathy identified by whole-genome gene expression profiling. Clin Sci. 2019;133(11):1255–1269. doi:10.1042/CS20181110
16. Choi WJ, Hong YA, Min JW, et al. Hypertriglyceridemia is associated with more severe histological glomerulosclerosis in IgA nephropathy. J Clin Med. 2021;10(18):4236. doi:10.3390/jcm10184236
17. Stangou MJ, Marinaki S, Papachristou E, et al. Histological grading in primary membranous nephropathy is essential for clinical management and predicts outcome of patients. Histopathology. 2019;75(5):660–671. doi:10.1111/his.13955
18. Oto OA, Demir E, Mirioglu S, et al. Clinical significance of glomerular C3 deposition in primary membranous nephropathy. J Nephrol. 2021;34(2):581–587. doi:10.1007/s40620-020-00915-w
19. Tsai SF, Wu MJ, Chen CH. Low serum C3 level, high neutrophil-lymphocyte-ratio, and high platelet-lymphocyte-ratio all predicted poor long-term renal survivals in biopsy-confirmed idiopathic membranous nephropathy. Sci Rep. 2019;9(1):6209. doi:10.1038/s41598-019-42689-7
20. Chen Y, Tang L, Feng Z, et al. Pathological predictors of renal outcomes in nephrotic idiopathic membranous nephropathy with decreased renal function. J Nephrol. 2014;27(3):307–316. doi:10.1007/s40620-014-0057-0
21. Li W, Zhao Y. Prognostic value of phospholipase A2 receptor in primary membranous nephropathy: a systematic review and meta-analysis. Int Urol Nephrol. 2019;51(9):1581–1596. doi:10.1007/s11255-019-02147-9
22. Yun HR, Kim H, Park JT, et al. Obesity, metabolic abnormality, and progression of CKD. Am J Kidney Dis. 2018;72(3):400–410. doi:10.1053/j.ajkd.2018.02.362
23. Dai P, Xie W, Yu X, Sun J, Wang S, Kawuki J. Efficacy and cost of different treatment in patients with idiopathic membranous nephropathy: a network meta-analysis and cost-effectiveness analysis. Int Immunopharmacol. 2021;94:107376. doi:10.1016/j.intimp.2021.107376
24. Zhang BO, Cheng M, Yang M, et al. Analysis of the prognostic risk factors of idiopathic membranous nephropathy using a new surrogate end-point. Biomed Rep. 2016;4(2):147–152. doi:10.3892/br.2015.555
25. Liu F, Chen S, Zhao W, et al. Urine uric acid excretion levels are positively associated with obesity and abdominal obesity in type 2 diabetes patients without chronic kidney disease. Diabetes Metab Syndr Obes. 2021;14:4691–4703. doi:10.2147/DMSO.S335558
26. Xu T, Sheng Z, Yao L. Obesity-related glomerulopathy: pathogenesis, pathologic, clinical characteristics and treatment. Front Med. 2017;11(3):340–348. doi:10.1007/s11684-017-0570-3
27. Díaz-Méndez C, Adams J. The combined used of quantitative and qualitative longitudinal methods in the study of obesity. Gac Sanit. 2021;35(6):569–579. doi:10.1016/j.gaceta.2020.05.008
28. Zhao Y, Qie R, Han M, et al. Association of BMI with cardiovascular disease incidence and mortality in patients with type 2 diabetes mellitus: a systematic review and dose-response meta-analysis of cohort studies. NMCD. 2021;31(7):1976–1984. doi:10.1016/j.numecd.2021.03.003
29. Berthoux F, Mariat C, Maillard N. Overweight/obesity revisited as a predictive risk factor in primary IgA nephropathy. Nephrol Dial Transplant. 2013;28(Suppl 4):iv160–iv166. doi:10.1093/ndt/gft286
30. Panwar B, Hanks LJ, Tanner RM, et al. Obesity, metabolic health, and the risk of end-stage renal disease. Kidney Int. 2015;87(6):1216–1222. doi:10.1038/ki.2014.384
31. Park S, Lee S, Kim Y, et al. Reduced risk for chronic kidney disease after recovery from metabolic syndrome: a nationwide population-based study. Kidney Res Clin Pract. 2020;39(2):180–191. doi:10.23876/j.krcp.20.016
32. D’Agati VD, Chagnac A, de Vries AP, et al. Obesity-related glomerulopathy: clinical and pathologic characteristics and pathogenesis. Nat Rev Nephrol. 2016;12(8):453–471. doi:10.1038/nrneph.2016.75
33. Kim SJ, Koo HM, Lim BJ, et al. Decreased circulating C3 levels and mesangial C3 deposition predict renal outcome in patients with IgA nephropathy. PLoS One. 2012;7(7):e40495. doi:10.1371/journal.pone.0040495
34. Sarier M, Demir M, Goktas S, et al. Results of real-time multiplex polymerase Chain reaction assay in renal transplant recipients with sterile pyuria. Transplant Proc. 2017;49(6):1307–1311. doi:10.1016/j.transproceed.2017.02.051
 © 2022 The Author(s). This work is published and licensed by Dove Medical Press Limited. The
full terms of this license are available at https://www.dovepress.com/terms
and incorporate the Creative Commons Attribution
- Non Commercial (unported, 3.0) License.
By accessing the work you hereby accept the Terms. Non-commercial uses of the work are permitted
without any further permission from Dove Medical Press Limited, provided the work is properly
attributed. For permission for commercial use of this work, please see paragraphs 4.2 and 5 of our Terms.
© 2022 The Author(s). This work is published and licensed by Dove Medical Press Limited. The
full terms of this license are available at https://www.dovepress.com/terms
and incorporate the Creative Commons Attribution
- Non Commercial (unported, 3.0) License.
By accessing the work you hereby accept the Terms. Non-commercial uses of the work are permitted
without any further permission from Dove Medical Press Limited, provided the work is properly
attributed. For permission for commercial use of this work, please see paragraphs 4.2 and 5 of our Terms.
Recommended articles
Body Mass Index and New-Onset Atrial Fibrillation in Patients with Acute Myocardial Infarction
Liu L, Liu X, Ding X, Chen H, Li H
International Journal of General Medicine 2022, 15:5717-5728
Published Date: 21 June 2022
All Types Obesity and Physical Inactivity Associated with the Risk of Activity of Daily Living Limitations Among People with Asthma
Alhammad SA, Alwadeai KS
Journal of Multidisciplinary Healthcare 2022, 15:1573-1583
Published Date: 22 July 2022
Association Between Nutritional Knowledge, Dietary Regimen, and Excess Body Weight in Primary School Teachers
Saintila J, Calizaya-Milla YE, Calizaya-Milla SE, Elejabo-Pacheco AA, Sandoval-Valentin GA, Rodriguez-Panta SG
Journal of Multidisciplinary Healthcare 2022, 15:2331-2339
Published Date: 14 October 2022
Association of Patient Anthropometric Measurements and Dental Implant Treatment
Al-Radha ASD
Clinical, Cosmetic and Investigational Dentistry 2023, 15:51-61
Published Date: 6 April 2023
The Burden of Obesity in Saudi Arabia: A Real-World Cost-of-Illness Study
Nagi MA, Almalki ZS, Thavorncharoensap M, Sangroongruangsri S, Turongkaravee S, Chaikledkaew U, Alqahtani AM, AlSharif LS, Alsubaihi IA, Alzarea AI, Alsultan MM
ClinicoEconomics and Outcomes Research 2025, 17:233-246
Published Date: 21 March 2025