
Back to Journals » Infection and Drug Resistance » Volume 19
The Red Cell Distribution Width to Albumin Ratio as a Novel Prognostic Predictor in Patients with Severe Fever with Thrombocytopenia Syndrome: A Multicenter Study in China
Authors Wang J, Ma R, Xue X, Wang R, Wu H  , Lin L, Duan J, Chen Z
Received 1 November 2025
Accepted for publication 27 February 2026
Published 9 March 2026 Volume 2026:19 578433
DOI https://doi.org/10.2147/IDR.S578433
Checked for plagiarism Yes
Review by Single anonymous peer review
Peer reviewer comments 2
Editor who approved publication: Dr Oliver Planz
Jingxia Wang,1,* Ruize Ma,1,* Xiaoyu Xue,2,* Ranran Wang,1 Hongxiao Wu,1 Ling Lin,3 Jianping Duan,4 Zhihai Chen1
1National Key Laboratory of Intelligent Tracking and Forecasting for Infectious Diseases, Beijing Ditan Hospital, Capital Medical University, Beijing, People’s Republic of China; 2Department of Infectious Disease, Peking University Ditan Teaching Hospital, Beijing, People’s Republic of China; 3Department of Infectious Diseases, Yantai City Hospital for Infectious Disease, Yantai, People’s Republic of China; 4Department of Infectious Disease, Qingdao No 6 People’s Hospital, Qingdao, People’s Republic of China
*These authors contributed equally to this work
Correspondence: Zhihai Chen, National Key Laboratory of Intelligent Tracking and Forecasting for Infectious Diseases, Beijing Ditan Hospital, Capital Medical University, Beijing, People’s Republic of China, Email [email protected] Jianping Duan, Department of Infectious Disease, Qingdao No 6 People’s Hospital, Qingdao, People’s Republic of China, Email [email protected]
Purpose: Severe Fever with Thrombocytopenia Syndrome (SFTS) is an emerging infectious disease characterized by high mortality rate. This study aimed to explore the predictive ability of the red blood cell distribution width to albumin ratio (RAR) for mortality risk in SFTS.
Patients and Methods: A total of 650 hospitalized SFTS patients from two centers were randomly assigned to a training (N = 455) and validation (N = 195) cohort at a 7:3 ratio. Independent risk factors were identified by constructing the LASSO regression model and Cox regression model. The predictive power and clinical benefit of risk factors were assessed using receiver operating characteristic (ROC) and decision curve analysis (DCA), respectively, with the nomogram visualizing the model. Kaplan–Meier curve and the Log rank test were employed to compare survival probabilities.
Results: The 650 patients had a median age of 66 years. Deceased exhibited a significantly higher RAR value than survivors (4.61 vs 3.77, P < 0.001). The RAR, neurological manifestations, and viral load were identified as independent risk factors for death in SFTS patients by multivariate Cox regression analysis, and the model was subsequently visualized using a nomogram. RAR demonstrated the strongest predictive performance (AUC: 0.845, P < 0.001), outperforming neurological manifestations (AUC: 0.636, P < 0.001) and viral load (AUC: 0.805, P < 0.001). In the validation cohort, RAR achieved an AUC of 0.824. Kaplan–Meier survival analysis demonstrated that SFTS patients who have RAR > 4.19 (Log rank test; χ2 = 67.43, P < 0.001) experienced significantly lower survival rates. DCA demonstrated that the RAR had clinical net benefit for predicting mortality in SFTS patients.
Conclusion: Baseline higher RAR levels were associated with an increased risk of death in SFTS patients. RAR may serve as a valuable predictor of mortality in SFTS patients during the early stage of disease.
Keywords: severe fever with thrombocytopenia syndrome, mortality, red blood cell distribution width, albumin, prognosis
Introduction
Severe fever with thrombocytopenia syndrome (SFTS) is a recently identified infectious disease caused by Bandavirus Dabieense (also known as the SFTS virus), which was first reported in China in 2009.1–3 The WHO classified SFTS as a serious global threat in 2017.4 The early stage of the disease is characterized by non-specific clinical manifestations, whereas severe cases may progress to hemorrhage, encephalopathy, and multi-organ failure.3,5,6 Cases of SFTS have been reported in multiple countries, such as Japan, South Korea and USA.7,8 The SFTS mortality rate in China was 5.11%, but this rate could rise to 44.7% in critical cases.9 Moreover, given the lack of specific antivirals and vaccines, early detection of severe cases is vital to prevent fatal outcomes. Previous studies have identified several clinical mortality factors, such as advanced age, elevated blood urea nitrogen (BUN), high viral load, and neurological symptoms.10–13 In addition, to enhance predictive accuracy, increasing attention has been given to composite indicators.14,15 Yang et al reported that the inflammatory burden index (IBI), which included neutrophils, lymphocytes, and CRP, had superior predictive value compared to neutrophil to lymphocyte ratio (NLR) and the C-reactive protein-to-albumin ratio (CAR) with an AUC of 0.878.16 However, there are currently no standardized predictive indicators in clinical practice, and critical risk factors causing fatal outcomes in SFTS patients remain to be comprehensively defined.
RDW and albumin have been identified as biomarkers of physiological dysfunction related to inflammation, oxidative stress, and nutritional status.17 Recent studies have shown that elevated RAR, the ratio of RDW to albumin, was closely linked to the progression and prognosis of diseases, especially those involving inflammation and immunity in their pathogenesis.18–20 Shan et al found that RAR could serve as a separate determinant of mortality and septic shock.21 Yin et al revealed that elevated RAR was associated with all-cause mortality among critically ill patients with rheumatic diseases.20 The underlying mechanisms likely involve oxidative stress and inflammatory cytokines: oxidative stress impairs red blood cell (RBC) stability and shortens RBC lifespan, while inflammatory cytokines inhibit erythroid maturation in the bone marrow, collectively promoting the release of immature erythrocytes, increasing erythrocyte heterogeneity, and elevating RDW.22,23 In addition, malnutrition and inflammatory mediators suppress hepatic albumin synthesis, resulting in decreased serum albumin levels.24,25 Together, these alterations elevate RAR, which may both reflect and exacerbate disease severity. Moreover, severe inflammation and cytokine storms are key mechanisms underlying poor prognosis in SFTS patients.26,27 However, the relationship between RAR and poor prognosis remained to be elucidated. This study aimed to explore the association between RAR and mortality in SFTS patients, identifying reliable prognostic indicators.
Material and Methods
Study Design and Study Population
This retrospective study comprised 787 patients diagnosed with SFTS between January 2022 and December 2024 at Yantai Qishan Hospital and Qingdao No. 6 People’s Hospital. The criteria for inclusion require the fulfilment of the following conditions: (1) Epidemiological history, including activities in mountainous areas, tick bites, or contact with infected animals or cases within two weeks prior to disease onset. (2) The clinical manifestations include fever, leukopenia, thrombocytopenia, and multiple organ dysfunction. (3) Detection of viral RNA in serum with a positive result and/or virus specific IgM antibody for SFTSV. However, 137 patients were not included based on the following exclusion criteria: (1) missing clinical data (n = 113); (2) missing baseline RDW or serum albumin (n = 24). Based on the inclusion and exclusion criteria outlined above, a total of 650 patients with SFTS were ultimately included in this study (Figure 1).
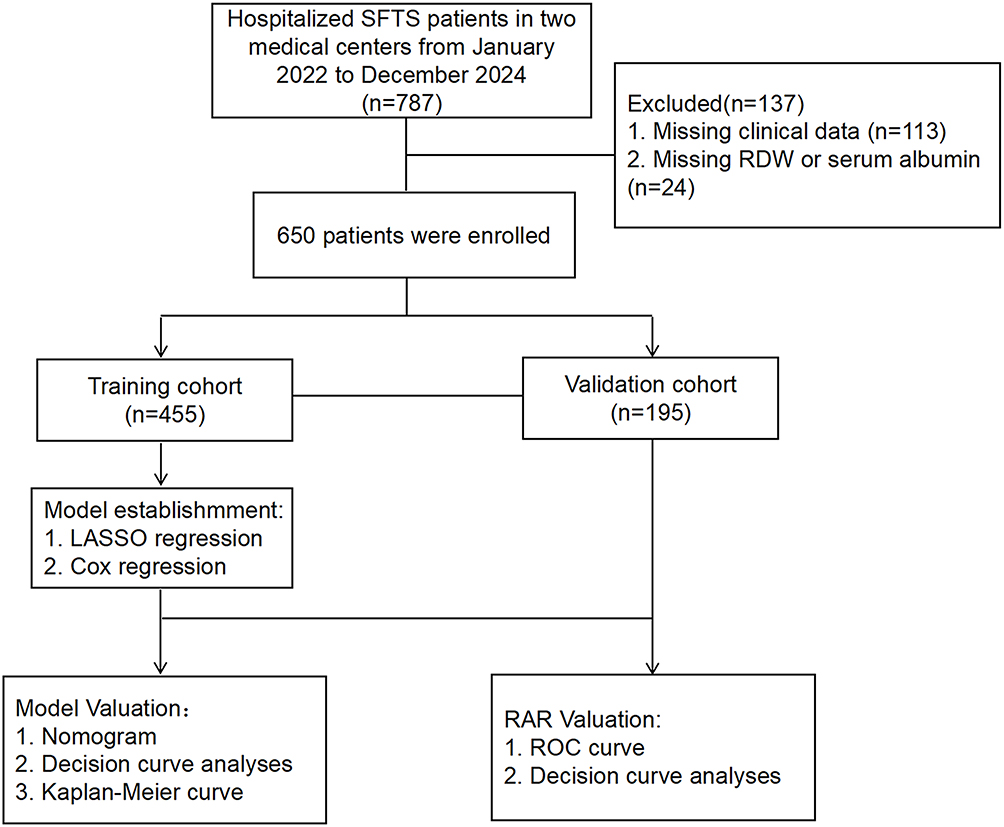 |
Figure 1 Schematic illustration of the study design. |
Data Collection and Clinical Definitions
Patient data were collected retrospectively and included demographic information (gender, age, medical history, duration of hospitalization, and clinical outcomes), symptoms, vital signs, and laboratory test results. The laboratory assessments conducted within 24 hours of admission encompassed routine blood tests, liver and kidney function tests, coagulation profiles, viral load and evaluations of tissue damage and inflammatory biomarkers. The combined inflammatory indices were calculated with blood parameters at admission based on the following equations: RAR = red blood cell distribution width (RDW)/Albumin; NLR = Neutrophil/Lymphocyte counts; PWR = Platelet/White blood cell counts; CLR = C-reactive protein (CRP)/Lymphocyte counts; CAR = CRP/Albumin. For survival cases, the follow-up duration was determined from the time of admission to discharge. For fatal cases, follow-up spanned from the period of admission to death.
Neurological manifestations were identified based on the occurrence of at least one of the following clinical manifestations: impaired consciousness, agitation, convulsions, syncope, unresponsiveness, oral or mandibular tremor, limb shaking, or altered muscle tone and strength. Hemorrhage was defined as the presence of one or more of the following symptoms: petechiae, purpura, ecchymosis, hemoptysis, hematuria, hematemesis or melena (dark stools). All data were carefully reviewed by experienced clinicians.
Statistical Analysis
Sample size estimation, based on a mortality rate of 10.5% from previous studies,28 was conducted using PASS software. The calculated sample size was 164, while our study includes 650 patients, ensuring the robustness and reliability of the findings. Data with a normal distribution were expressed as mean ± standard deviation ( ) and analyzed using independent t-tests or one-way analysis of variance (ANOVA) for group comparisons. For non-normally distributed data, the median (M) with interquartile range (IQR) was used, and comparison of two groups was conducted with the Mann–Whitney U-test, while the Kruskal–Wallis test was employed for multiple group comparisons. Categorical variables, which are presented as counts and percentages (n, %), are analyzed using the chi-square test, continuity correction or Fisher’s exact test, depending on the specific conditions.
The 650 SFTS cases were randomly divided into a training cohort and a validation cohort at a 7:3 ratio using the caret package in R Studio, resulting in 455 cases in the training cohort and 195 cases in the validation cohort. Based on the training cohort, we performed univariate Cox regression analysis on 79 variables, which included baseline patient demographic characteristics as well as laboratory indicators. Guided by the results of univariate Cox regression (P < 0.01), prior literature, and clinical expertise, and after excluding multicollinearity among variables, the following variables were ultimately included in the LASSO regression analysis: age, time from onset to admission, fatigue, muscular soreness, inappetence, neurological manifestations, hemorrhage, breath roughness, basophil (BASO), NLR, PWR, CAR, CLR, RAR, lactate dehydrogenase (LDH), creatine phosphokinase (CK), alanine aminotransaminase (ALT), aspartate aminotransferase (AST), total bilirubin (TBIL), creatinine (CREA), procalcitonin (PCT), C-reactive protein (CRP), activated partial thromboplastin time (APTT) and Viral load, which was achieved utilizing glmnet in the R package. Finally, a multivariate Cox regression model using the forward stepwise method was conducted on the identified predictors from the LASSO regression analysis to determine the independent risk factors for SFTS mortality. The predictive power and clinical benefit of risk factors and model were assessed using ROC analysis and DCA analysis, respectively, with the nomogram visualizing model in the training cohort. In the validation cohort, we also performed ROC analysis and DCA analysis to evaluate the predictive ability and clinical benefit of RAR. Optimal cut-off value for RAR (4.19) was determined by Youden’s index, categorizing parameter into low- and high-value groups, and Kaplan–Meier curve and the Log rank test assessed and compared survival probability. Statistical analysis was carried out with SPSS version 26.0 (IBM, Armonk, NY, USA), R Studio version 4.4.2 and GraphPad Prism 9.0. A two-sided P-value of less than 0.05 was deemed statistically significant.
Results
Demographic and Clinical Characteristics of Patients with SFTS
This study included 650 hospitalized SFTS patients, of whom 78 died and 572 survived, resulting in a mortality rate of 12%. The patients demographics and clinical characteristics were examined and were shown in Table 1. In the fatal group, the median age was 71 years (IQR: 63.75–77.00 years), which was older than that of the survival group (P < 0.001). The duration of hospitalization was significantly shorter in the fatal group, with a median of 4 days (IQR: 3–7 days), in contrast to 10 days (IQR: 7–13 days) in the survival group. No significant differences were observed between the two groups in terms of gender, time from onset to admission, hypertension, diabetes or coronary heart disease, or other comorbidities. Fever, malaise and inappetence were the most common symptoms, accounting for 93.7%, 84.5% and 80.6%, respectively. The higher rate of inappetence in the survival group (82.5% vs 66.7%) may be associated with the older age and impairment of consciousness in the deceased group, potentially limiting the expression or recognition of related symptoms. The proportion of patients presenting with hemorrhage, breath rough and neurologic manifestations was markedly higher in the mortality group compared to the survival group (P < 0.001). In terms of laboratory indicators, compared to the survival group, the death group exhibited higher levels of neutrophil percentage (NEU%), NLR, CAR, CLR, RDW, RAR, CK, LDH, creatine kinase myocardial band (CK-MB), ALT, AST, TBIL, direct bilirubin (DBIL), γ-glutamyl transferase (GGT), alkaline phosphatase (ALP), potassium ions, PCT, CRP, BUN, CREA, D-Dimer, thrombin time (TT), prothrombin time (PT), APTT, and viral load. Conversely, the death group showed lower levels of lymphocyte count, lymphocyte percentage (LYM%), platelet-to-white blood cell ratio (PWR), monocyte percentage (MON%), BASO, basophil percentage (BASO%), platelets (PLT), albumin (ALB), calcium ions, and fibrinogen. The remaining indices showed no significant differences (Table 1).
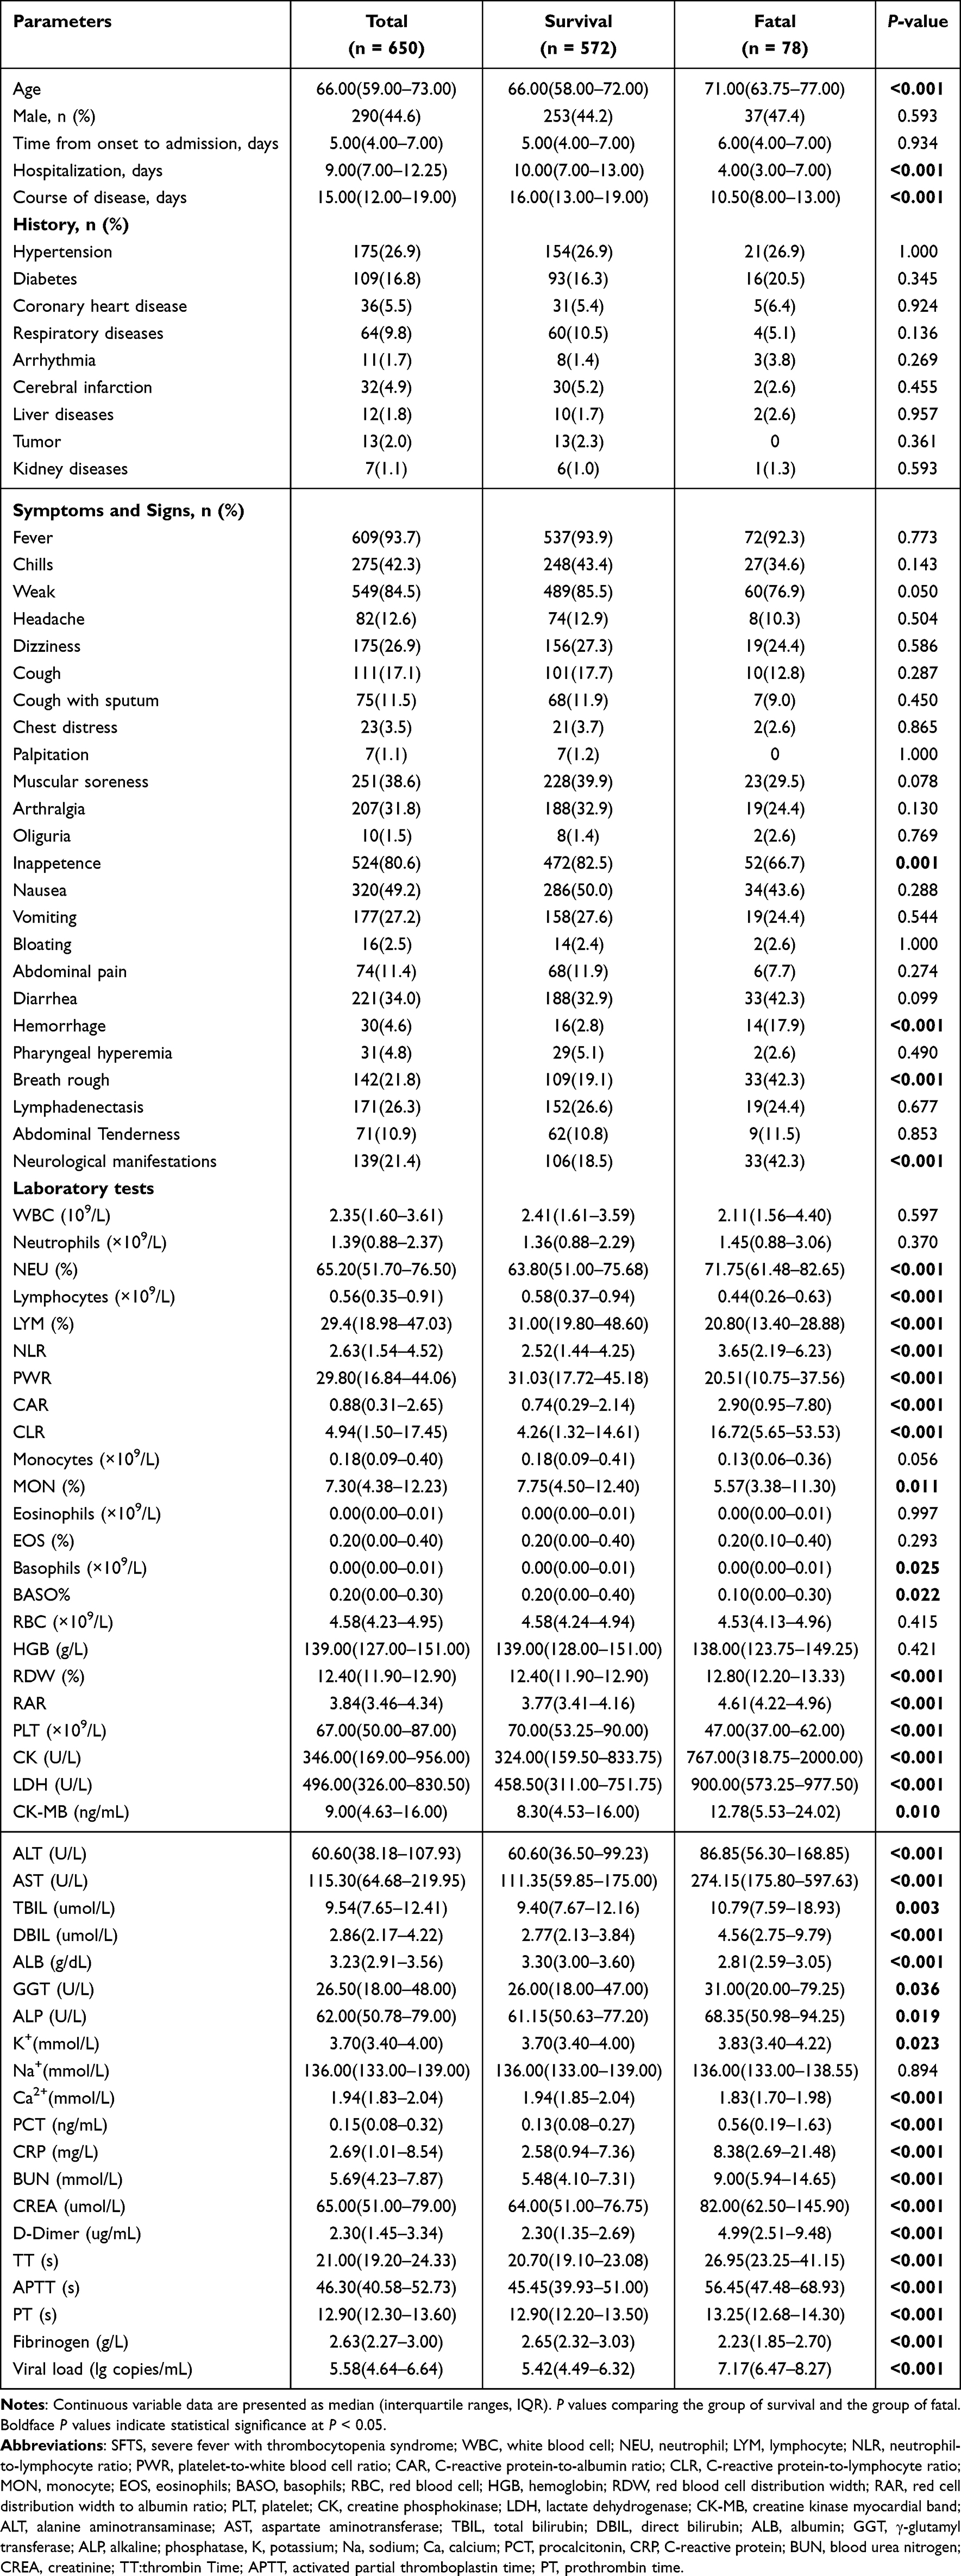 |
Table 1 Baseline Demographic and Clinical Characteristics of the Survival and the Fatal Patients with SFTS |
In total, 650 patients were randomly assigned to the training cohort or the validation cohort at a ratio of 7:3, with 450 patients in the training cohort and 195 patients in the validation cohort. Most baseline clinical data did not exhibit significant differences between the two cohorts, except patients in the training cohort had higher Na+ and CREA than those in the validation cohort (P = 0.011; P = 0.023) (Supplementary Table 1).
Independent Risk Factors for Mortality in SFTS Patients in the Training Cohort
Based on the baseline demographics, clinical characteristics, and laboratory parameters of patients in the training cohort. Seventy-nine variables were initially incorporated into the univariate Cox regression analysis (Supplementary Table 2). Based on the univariate Cox regression results (P < 0.1), clinical expertise, and relevant literature, while also accounting for multicollinearity, twenty-four variables were subsequently selected for further evaluation using LASSO regression. The LASSO analysis revealed five parameters significantly associated with SFTS, identified by non-zero coefficients at log(λ) = lambda 1 - standard error (1-SE) above the minimum error (Figure 2A and B) (Supplementary Table 3). These parameters included RAR, neurological manifestations, viral load, APTT, and AST, which were further analyzed multivariate Cox regression analysis. The results revealed that three variables: Neurological manifestations (HR: 2.494, 95% CI: 1.460–4.261, P = 0.001), RAR (HR: 2.095, 95% CI: 1.698–2.584, P < 0.001) and Viral load (HR: 1.672, 95% CI: 1.383–2.021, P < 0.001) (Table 2).
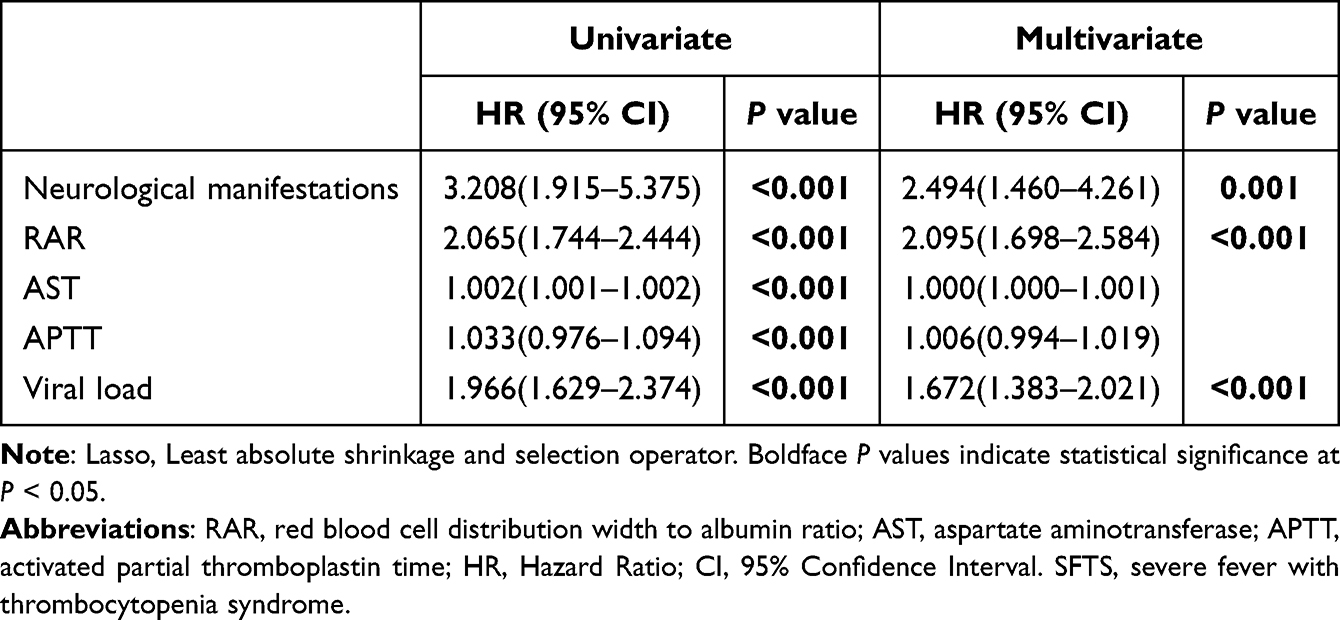 |
Table 2 Risk Factors Associated with Disease Mortality of Patients with SFTS by Cox Regression Analysis Based on the Results of Lasso Regression |
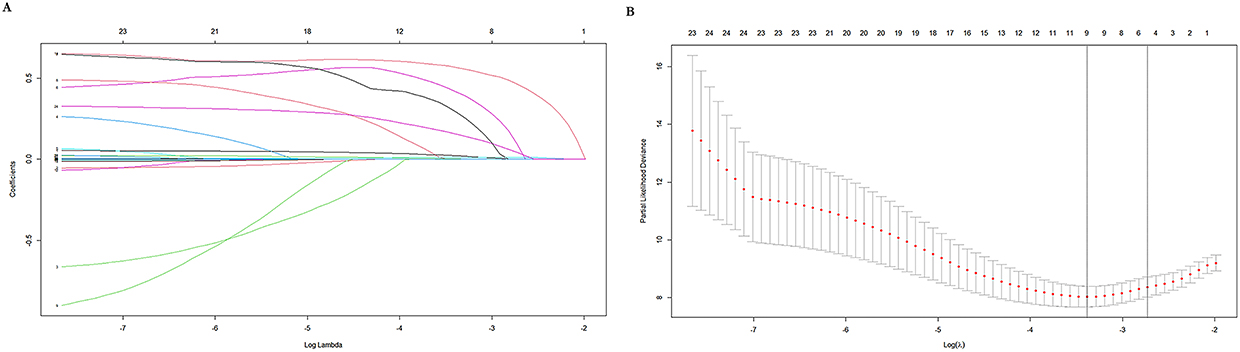 |
Figure 2 Possible predictors selected by Lasso regression on the basis of univariate Cox regression results. (A) Five predictors with nonzero coefficients were screened among 24 variables by deriving the optimal lambda. (B) Optimal lambda selection in the LASSO model used 10-fold cross‐validation via minimum criteria. The dotted vertical lines at the optimal values were drawn according to the minimum criteria and the 1 standard error (1‐SE) of the minimum criteria. LASSO, least absolute shrinkage and selection operator. |
Validation and Clinical Benefit Assessment of the Model in the Training Cohort
Nomogram were employed to illustrate the individual relationships between the risk factors—RAR, neurological manifestations, and viral load—and to integrate these factors on a single plane. Scores were assigned to each value level of the predictors based on their contribution to the outcome event, as indicated by the magnitude of the regression coefficient. Specifically, 0 points were assigned for Neurological manifestations, RAR = 9, and viral load = 11, while 100 points were assigned for RAR = 1.5. Functional conversion was then performed by summing the individual scores to obtain a total score, which was used to calculate the probability of the survival. A higher total score corresponded to an increased survival rate (Figure 3).
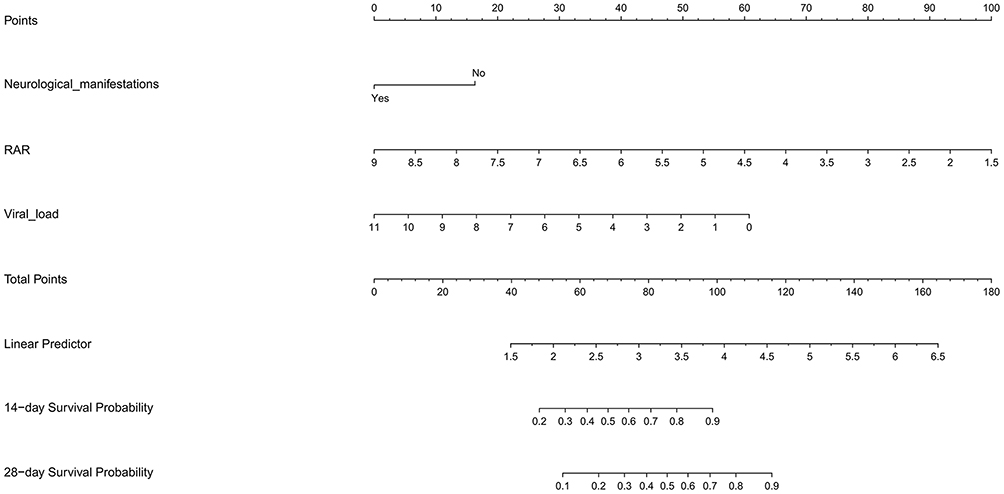 |
Figure 3 The nomogram predicted the mortality of patients based on multivariate Cox regression analysis in the training cohort. |
DCA revealed that the net benefit curves of model surpass those of other benchmark strategies (eg, all treatments or no treatments) within specific threshold ranges (Figure 4A). This suggests that model can offer meaningful clinical benefits to patients, thereby facilitating more informed and rational decision-making.
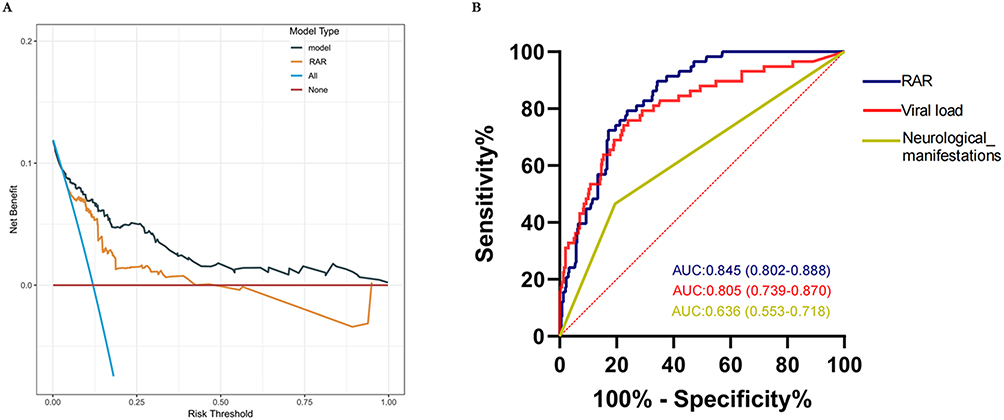 |
Figure 4 Assessment of the model in the training cohort. (A) DCA for model in the training cohort. Solid yellow lines indicate the net benefits of the RAR across a range of threshold probabilities. Solid grey lines indicate the net benefits of the Model across a range of threshold probabilities. The horizontal solid red line represents the assumption that no patient will experience the event, and the blue line indicates the assumption that all patients will experience the event. (B) ROC for evaluating the predictive ability of the independent risk factors in the training cohort. Abbreviations: RAR, red cell distribution width to albumin ratio; DCA, decision curve analysis; ROC, receiver operating characteristic. |
Predictive Performance of RAR for Mortality of SFTS Patients
The predictive performance of the RAR for SFTS mortality was evaluated using the ROC curve analysis. The result demonstrated that the RAR achieved an AUC of 0.845 (95% CI: 0.802–0.888, P < 0.001), which was significantly higher than that of viral load (AUC = 0.805, 95% CI: 0.739–0.870, P < 0.001) and neurological manifestations (AUC = 0.636, 95% CI: 0.553–0.718, P < 0.001) (Figure 4B). This indicates that the RAR is a more robust predictor of SFTS mortality compared to other independent factors. Furthermore, the validation cohort analysis also confirmed the excellent predictive performance of the RAR, with an AUC of 0.824 (95% CI: 0.747–0.901, P < 0.001) (Figure 5A). Additionally, DCA revealed that the RAR has substantial clinical benefits within a certain range for both the training and validation cohorts (Figures 4A and 5B).
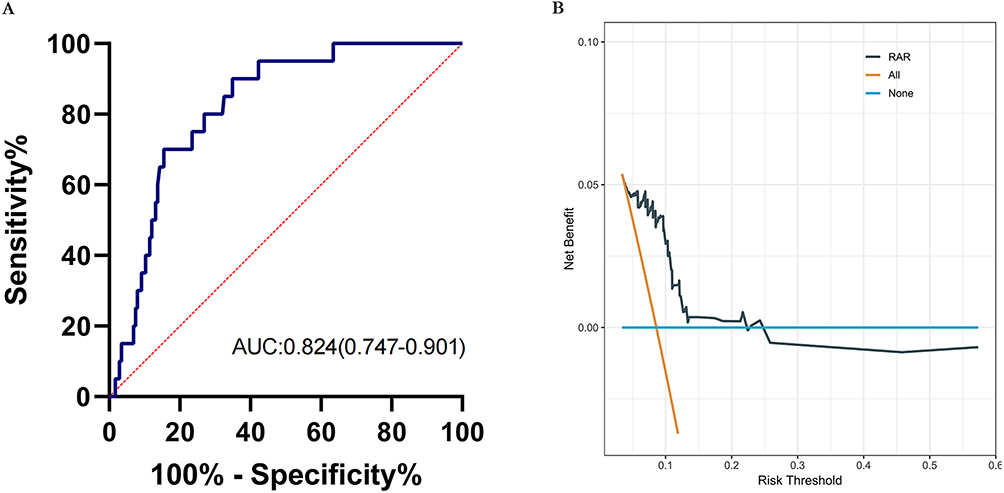 |
Figure 5 Predictive performance of RAR for mortality in the validation cohort. (A) ROC for evaluating the predictive ability of the RAR in the validation cohort. (B) DCA for RAR in the validation cohort. Solid grey lines indicate the net benefits of the RAR across a range of threshold probabilities. The horizontal blue line represents the assumption that no patient will experience the event, and the yellow line indicates the assumption that all patients will experience the event. Abbreviations: RAR, red cell distribution width to albumin ratio; DCA, decision curve analysis; ROC, receiver operating characteristic. |
Patients were stratified into two groups, namely RARlow and RARhigh, utilizing the optimal cut-off value of RAR (cut-off value = 4.19). Kaplan–Meier survival analysis demonstrated that Patients with RAR > 4.19 (Log rank test; χ2 = 67.43, P < 0.001) exhibited significantly lower survival rates during hospitalization (Figure 6).
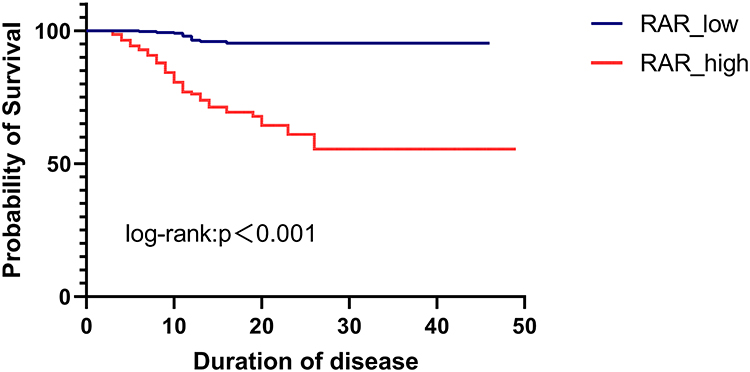 |
Figure 6 Kaplan–Meier survival curves according to the cut-off value of RAR (cut-off = 4.19). Abbreviations: RAR, red cell distribution width to albumin ratio. |
Discussion
In this multi-center study, we examined the relationship between the RAR and the clinical outcomes of hospitalized SFTS patients. The results demonstrated that RAR exhibited excellent predictive performance and clinical benefit, suggesting that RAR may serve as an important prognostic indicator for early-stage mortality in patients with SFTS.
The RAR, derived from the ratio of RDW to albumin, was an emerging inflammation-related indicator, with numerous studies demonstrating its predictive significance for disease poor prognosis, and combined indicators generally offered greater predictive value than individual indicators. End-stage kidney disease (ESKD) is strongly associated with chronic inflammation, as increasing evidence suggests that elevated levels of inflammatory biomarkers, including tumor necrosis factor-alpha (TNF-α), along with oxidative stress markers, are significantly correlated with accelerated eGFR decline and disease progression.29 Moreover, in a retrospective cohort study involving 997 patients with chronic kidney disease, Kimura et al found that elevated RAR values were significantly associated with poorer renal prognosis.29 In addition, aneurysm development is linked to a chronic aortic wall inflammation, which may be assessed by increasing interleukin-6 (IL-6) and CRP22 levels.30–32 Long et al identified RAR as a potential and reliable risk factor for aneurysm.33 Acute pancreatitis (AP) is characterized by oxidative stress and inflammatory activation, and Chen et al found that RAR may also serve as a prognostic marker for short-term all-cause mortality in AP patients.34 In this study, we evaluated the prognostic value of RAR for mortality in patients with SFTS and found that RAR demonstrated superior predictive performance, which is consistent with its established role in other inflammation-related diseases. However, the mechanism by which SFTS causes elevated RAR was not well defined, and we speculated that it may be closely related to elevated RDW and reduced albumin due to intense inflammation and immune response in patients. Previous studies indicated that the release of inflammatory cytokines such as interleukin-1, IL-6, and TNF-α during the inflammatory response inhibited erythropoietin-mediated erythropoiesis, thereby promoting reticulocyte release into the bloodstream, amplifying erythrocyte heterogeneity, and ultimately elevating RDW levels.35–37 In addition, albumin, an acute phase reactant synthesised by the liver, was notably influenced by inflammatory state and protein intake.38 Our study revealed that classical inflammation-related markers, including CRP and PCT, were significantly higher in the death group than in the survival group, suggesting a more tense inflammatory response among non-survivors. This heightened inflammatory state may partially account for the elevated RAR observed in the death group.
Neurological manifestations have been recognized as an independent risk factor for mortality, consistent with our findings.39,40 Animal models in mice have demonstrated that the SFTS virus can induce fatal neuroinflammation in critical areas of the brain, such as those responsible for respiratory function and motor control, ultimately leading to death.41 Additionally, Xu Xiang et al found high viral load showed the highest diagnostic performance (AUC = 0.815) compared with the other three independent risk factors of advanced age (AUC = 0.700), impaired consciousness (AUC = 0.647), and elevated urea nitrogen (AUC = 0.758).42 A systematic review and meta-analysis conducted by Yao Wang et al also found that high viral loads can increase the risk of death in patients.13 Previous studies have shown that high viral loads can excessively activate the immune system, leading to uncontrolled cytokine storms and increased mortality.43,44 Our study confirmed that the predictive performance of the RAR (AUC = 0.845) is comparable to that of viral load (AUC = 0.805) and superior to that of neurological manifestations (AUC = 0.636) in the training cohort. Additionally, RAR is simpler and more economical to be obtained than viral load, especially in areas with relatively poor healthcare resources. RAR could assist clinicians to identify patients with poor outcome early and intervene as soon as possible.
Furthermore, our constructed multivariate Cox regression models identified RAR as an independent risk factor. DCA confirmed the significant clinical benefit of RAR and models, further supporting its potential utility in risk stratification. The nomogram visualized the model, making them easier for clinicians to integrate the results into practice for better decision-making. Finally, the excellent predictive power and clinical benefit of the RAR were validated in the validation cohort. This consistency between the training and validation cohorts suggests that the RAR was reliable and generalizable across different patient cohorts. Our study had several advantages: Firstly, based on current research, our study was the first to establish a link between RAR and the mortality in SFTS patients. Secondly, this study was a multi-center study, which enhanced the generalization of the results. Thirdly, incorporating a comprehensive range of variables enhances the robustness and reliability of identifying RAR as an independent predictor of mortality. However, there were several limitations to our study. Firstly, the retrospective nature of this study introduces inherent limitations, including the potential for selection bias and unmeasured or residual confounding, which may affect the robustness and generalizability of our findings. Future prospective investigations are therefore needed to confirm the observed associations. Secondly, our study only assessed RAR at the time of admission, without evaluating their dynamic changes over the course of hospitalization, which may not provide further insights into the mechanism of disease progression. Thirdly, the lack of additional inflammatory markers, such as cytokines, in our study highlights the need for further investigation into the immunity mechanism underlying RAR in SFTS.
Conclusion
We reported that the RAR was an independent prognostic indicator in patients with SFTS and was strongly associated with poor clinical outcomes. Higher RAR values were correlated with increased mortality, suggesting it was as a significant determinant for identifying high-risk SFTS patients. Future prospective studies are warranted to further validate the clinical predictive value of the RAR in SFTS.
Abbreviations
SFTS, severe fever with thrombocytopenia syndrome; WBC, white blood cell; NEU, neutrophil; LYM, lymphocyte; NLR, neutrophil-to-lymphocyte ratio; PWR, platelet-to-white blood cell ratio; CAR, C-reactive protein-to-albumin ratio; CLR, C-reactive protein-to-lymphocyte ratio; MON, monocyte; EOS, eosinophils; BASO, basophils; RBC, red blood cell; HGB, hemoglobin; RDW, red blood cell distribution width; RAR, red cell distribution width to albumin ratio; PLT, platelet; CK, creatine phosphokinase; LDH, lactate dehydrogenase; CK-MB, creatine kinase myocardial band; ALT, alanine aminotransaminase; AST, aspartate aminotransferase; TBIL, total bilirubin; DBIL, direct bilirubin; ALB, albumin; GGT, γ-glutamyl transferase; ALP, alkaline; phosphatase, K, potassium; Na, sodium; Ca, calcium; PCT, procalcitonin; CRP, C-reactive protein; BUN; blood urea nitrogen; CREA, creatinine; TT, thrombin Time; APTT, activated partial thromboplastin time; PT, prothrombin time; Lasso; Least absolute shrinkage and selection operator. DCA, decision curve analysis; ROC, receiver operating characteristic.
Data Sharing Statement
All relevant data are within the manuscript.
Ethical Approval
This study was approved by the Ethics Committee of Beijing Ditan Hospital, Capital Medical University (NO. DTEC-KY2022-022-01), and conducted in accordance with the principles of the Helsinki Declaration. All participants provided written informed consent.
Acknowledgments
We thank all participants and their families for their invaluable contribution to this study and to express our gratitude to all the healthcare workers who helped with this study.
Funding
This work was supported by the National Key R&D Program of China (grant number 2022YFF1203201 to Z.C.). The funder had no role in study design, data collection and analysis, decision to publish, or preparation of the manuscript.
Disclosure
The authors report no conflicts of interest in this work.
References
1. Yu X-J, Liang M-F, Zhang S-Y, et al. Fever with thrombocytopenia associated with a novel bunyavirus in China. N Engl J Med. 2011;364(16):1523–13. doi:10.1056/NEJMoa1010095
2. Xu B, Liu L, Huang X, et al. Metagenomic analysis of fever, thrombocytopenia and leukopenia syndrome (FTLS) in Henan Province, China: discovery of a new bunyavirus. PLoS Pathog. 2011;7(11):e1002369. doi:10.1371/journal.ppat.1002369
3. Zhang Y-Z, Zhou D-J, Xiong Y, et al. Hemorrhagic fever caused by a novel tick-borne Bunyavirus in Huaiyangshan, China. Zhonghua Liu Xing Bing Xue Za Zhi. 2011;32(3):209–220.
4. Mehand MS, Millett P, Al-Shorbaji F, et al. World health organization methodology to prioritize emerging infectious diseases in need of research and development. Emerg Infect Dis. 2018;24(9):e171427. doi:10.3201/eid2409.171427
5. Liu -M-M, Lei X-Y, Yu X-J. Meta-analysis of the clinical and laboratory parameters of SFTS patients in China. Virol J. 2016;13(1):198. doi:10.1186/s12985-016-0661-9
6. Seo J-W, Kim D, Yun N, et al. Clinical update of severe fever with thrombocytopenia syndrome. Viruses. 2021;13(7):1213. doi:10.3390/v13071213
7. Qi S, Qin Y, Xing J, et al. Research progress on the epidemiological characteristics and prevention and control of severe fever with thrombocytopenia syndrome. Zhonghua Liu Xing Bing Xue Za Zhi. 2025;46(2):352–358. doi:10.3760/cma.j.cn112338-20240719-00438
8. McMullan LK, Folk SM, Kelly AJ, et al. A new phlebovirus associated with severe febrile illness in Missouri. N Engl J Med. 2012;367(9):834–841. doi:10.1056/NEJMoa1203378
9. Liu Y, Fan L, Wang W, et al. A machine learning model for mortality prediction in patients with severe fever with thrombocytopenia syndrome: a prospective, multicenter cohort study. Emerg Microbes Infect. 2025;14:2498572. doi:10.1080/22221751.2025.2498572
10. Hou H, Zou S, Wei W, et al. Kinetics and prognostic significance of laboratory markers in patients with severe fever with thrombocytopenia syndrome: insight from a comprehensive analysis. J Infect Dis. 2024;229(6):1845–1855. doi:10.1093/infdis/jiad426
11. Gong L, Zhang L, Wu J, et al. Clinical progress and risk factors for death from severe fever with thrombocytopenia syndrome: a multihospital retrospective investigation in Anhui, China. Am J Trop Med Hyg. 2021;104(4):1425–1431. doi:10.4269/ajtmh.20-0270
12. Wang W, Wang Z, Chen Z, et al. Construction of an early differentiation diagnosis model for patients with severe fever with thrombocytopenia syndrome and hemorrhagic fever with renal syndrome. J Med Virol. 2024;96(5):e29626. doi:10.1002/jmv.29626
13. Wang Y, Song Z, Wei X, et al. Clinical laboratory parameters and fatality of Severe fever with thrombocytopenia syndrome patients: a systematic review and meta-analysis. PLoS Negl Trop Dis. 2022;16(6):e0010489. doi:10.1371/journal.pntd.0010489
14. Wang Y, Qin L-H, Zhang K, et al. Blood urea nitrogen to albumin ratio is a novel predictor of fatal outcome for patients with severe fever with thrombocytopenia syndrome. J Med Virol. 2024;96(6):e29731. doi:10.1002/jmv.29731
15. Zhang F, Liu X-Y, Qiao J-P, et al. Fibrinogen-to-prealbumin and C-reactive protein-to-prealbumin ratios as prognostic indicators in severe fever with thrombocytopenia syndrome. Front Cell Infect Microbiol. 2024;14:1397789. doi:10.3389/fcimb.2024.1397789
16. Yang Z, Wang L, Hong B, et al. Inflammatory burden index as a predictor of in-hospital mortality in patients with severe fever with thrombocytopenia syndrome. J Med Virol. 2025;97(2):e70225. doi:10.1002/jmv.70225
17. Hao M, Jiang S, Tang J, et al. Ratio of red blood cell distribution width to albumin level and risk of mortality. JAMA Netw Open. 2024;7(5):e2413213. doi:10.1001/jamanetworkopen.2024.13213
18. Fu W, Hu F, Xu C. Association between red blood cell distribution width/albumin ratio and all-cause mortality or cardiovascular diseases mortality in patients with diabetic retinopathy: a cohort study. PLoS One. 2023;18(12):e0296019. doi:10.1371/journal.pone.0296019
19. Guaní-Guerra E, Torres-Murillo B, Muñoz-Corona C, et al. Diagnostic accuracy of the RDW for predicting death in COVID-19. Medicina. 2022;58(5):613. doi:10.3390/medicina58050613
20. Yin L, Min J, Zhong L, et al. The correlation between red cell distribution width to albumin ratio and all-cause mortality in critically ill patients with rheumatic diseases: a population-based retrospective study. Front Med Lausanne. 2023;10:1199861. doi:10.3389/fmed.2023.1199861
21. Shan X, Jiang J, Li W, et al. Red blood cell distribution width to albumin ratio as a predictor of mortality in ICU patients with community acquired bacteremia. Sci Rep. 2024;14(1):28596. doi:10.1038/s41598-024-80017-w
22. Friedman JS, Lopez MF, Fleming MD, et al. SOD2-deficiency anemia: protein oxidation and altered protein expression reveal targets of damage, stress response, and antioxidant responsiveness. Blood. 2004;104(8):2565–2573. doi:10.1182/blood-2003-11-3858
23. Paulson RF, Ruan B, Hao S, et al. Stress erythropoiesis is a key inflammatory response. Cells. 2020;9(3):634. doi:10.3390/cells9030634
24. Hausman DB, Fischer JG, Johnson MA. Protein, lipid, and hematological biomarkers in centenarians: definitions, interpretation and relationships with health. Maturitas. 2012;71(3):205–212. doi:10.1016/j.maturitas.2011.12.002
25. Eckart A, Struja T, Kutz A, et al. Relationship of nutritional status, inflammation, and serum albumin levels during acute illness: a prospective study. Am J Med. 2020;133(6):713–722.e7. doi:10.1016/j.amjmed.2019.10.031
26. Liu Z, Ge Z, Pan W, et al. Development and validation of the PLNA score to predict cytokine storm in acute-phase SFTS patients: a single-center cohort study. Int Immunopharmacol. 2024;136:112288. doi:10.1016/j.intimp.2024.112288
27. Kang SY, Yoo JR, Park Y, et al. Fatal outcome of severe fever with thrombocytopenia syndrome (SFTS) and severe and critical COVID-19 is associated with the hyperproduction of IL-10 and IL-6 and the low production of TGF-β. J Med Virol. 2023;95(7):e28894. doi:10.1002/jmv.28894
28. Miao D, Liu M-J, Wang Y-X, et al. Epidemiology and ecology of severe fever with thrombocytopenia syndrome in China, 2010‒2018. Clin Infect Dis. 2021;73(11):e3851–e3858. doi:10.1093/cid/ciaa1561
29. Kimura H, Tanaka K, Saito H, et al. Impact of red blood cell distribution width-albumin ratio on prognosis of patients with CKD. Sci Rep. 2023;13(1):15774. doi:10.1038/s41598-023-42986-2
30. Artemiou P, Charokopos N, Rouska E, et al. C-reactive protein/interleukin-6 ratio as marker of the size of the uncomplicated thoracic aortic aneurysms. Interact Cardiovasc Thorac Surg. 2012;15(5):871–877. doi:10.1093/icvts/ivs331
31. Domanovits H, Schillinger M, Müllner M, et al. Acute phase reactants in patients with abdominal aortic aneurysm. Atherosclerosis. 2002;163(2):297–302. doi:10.1016/S0021-9150(02)00006-0
32. Rehm JP, Grange JJ, Baxter BT. The formation of aneurysms. Semin Vasc Surg. 1998;11(3):193–202.
33. Long J, Xie X, Xu D, et al. Association between red blood cell distribution width-to-albumin ratio and prognosis of patients with aortic aneurysms. Int J Gen Med. 2021;14:6287–6294. doi:10.2147/IJGM.S328035
34. Chen X, Luo Y, Liu S. Association between red cell distribution width to albumin ratio and all-cause mortality in patients with acute pancreatitis admitted to the intensive care unit: a retrospective study based on the MIMIC-IV database. Front Med Lausanne. 2025;12:1503378. doi:10.3389/fmed.2025.1503378
35. Pierce CN, Larson DF. Inflammatory cytokine inhibition of erythropoiesis in patients implanted with a mechanical circulatory assist device. Perfusion. 2005;20(2):83–90. doi:10.1191/0267659105pf793oa
36. Rogers S, Doctor A. Red blood cell dysfunction in critical illness. Crit Care Clin. 2020;36(2):267–292. doi:10.1016/j.ccc.2019.12.008
37. Morceau F, Dicato M, Diederich M. Pro-inflammatory cytokine-mediated anemia: regarding molecular mechanisms of erythropoiesis. Mediators Inflamm. 2009;2009:405016. doi:10.1155/2009/405016
38. Wiedermann CJ. Hypoalbuminemia as Surrogate and Culprit of Infections. Int J Mol Sci. 2021;22(9):4496. doi:10.3390/ijms22094496
39. Tong H, Wang J, Zhu N, et al. A nomogram and heat map based on LASSO-Cox regression for predicting the risk of early-stage severe fever with thrombocytopenia syndrome patients developing into critical illness at 7-day and 14-day. J Med Virol. 2024;96(9):e29921. doi:10.1002/jmv.29921
40. Wang X, Ren X, Ge Z, et al. Clinical manifestations of death with severe fever and thrombocytopenia syndrome: a meta-analysis and systematic review. J Med Virol. 2021;93(6):3960–3968. doi:10.1002/jmv.26518
41. Kim S-H, Choi HN, Jo MG, et al. Activation of neurotoxic A1-reactive astrocytes by SFTS virus infection accelerates fatal brain damage in IFNAR1-/- mice. J Med Virol. 2024;96(8):e29854. doi:10.1002/jmv.29854
42. Xiang X, Dai Y, Li S, et al. Developing a prognostic model for predicting the risk of outcome in patients with novel bunyavirus infection: a retrospective study. J Med Virol. 2025;97(2):e70208. doi:10.1002/jmv.70208
43. He Z, Wang B, Li Y, et al. Changes in peripheral blood cytokines in patients with severe fever with thrombocytopenia syndrome. J Med Virol. 2021;93(8):4704–4713. doi:10.1002/jmv.26877
44. Wang L, Zou Z, Ding K, et al. Predictive risk score model for severe fever with thrombocytopenia syndrome mortality based on qSOFA and SIRS scoring system. BMC Infect Dis. 2020;20(1):595. doi:10.1186/s12879-020-05299-7
 © 2026 The Author(s). This work is published and licensed by Dove Medical Press Limited. The
full terms of this license are available at https://www.dovepress.com/terms
and incorporate the Creative Commons Attribution
- Non Commercial (unported, 4.0) License.
By accessing the work you hereby accept the Terms. Non-commercial uses of the work are permitted
without any further permission from Dove Medical Press Limited, provided the work is properly
attributed. For permission for commercial use of this work, please see paragraphs 4.2 and 5 of our Terms.
© 2026 The Author(s). This work is published and licensed by Dove Medical Press Limited. The
full terms of this license are available at https://www.dovepress.com/terms
and incorporate the Creative Commons Attribution
- Non Commercial (unported, 4.0) License.
By accessing the work you hereby accept the Terms. Non-commercial uses of the work are permitted
without any further permission from Dove Medical Press Limited, provided the work is properly
attributed. For permission for commercial use of this work, please see paragraphs 4.2 and 5 of our Terms.
Recommended articles

Red Blood Cell Distribution Width as Novel Biomarker in Cardiovascular Diseases: A Literature Review
Arkew M, Gemechu K, Haile K, Asmerom H
Journal of Blood Medicine 2022, 13:413-424
Published Date: 2 August 2022
Albumin Level is Associated with Short-Term and Long-Term Outcomes in Sepsis Patients Admitted in the ICU: A Large Public Database Retrospective Research
Cao Y, Su Y, Guo C, He L, Ding N
Clinical Epidemiology 2023, 15:263-273
Published Date: 3 March 2023
Red Blood Cell Distribution Width/Hematocrit Ratio: A New Predictor of 28 Days All-Cause Mortality of AECOPD Patients in ICU
Long Z, Zeng Q, Ou Y, Liu Y, Hu J, Wang Y, Wang Y
International Journal of Chronic Obstructive Pulmonary Disease 2024, 19:2497-2516
Published Date: 22 November 2024
Diagnostic Value of RDW-Albumin Ratio for the Prediction of Mortality in Sepsis Associated Nonthyroidal Illness Syndrome Patients: A Retrospective Cohort Study
Zhang J, Xu P, Huang Y, Li J, Ma C, Liu G, Ye J, Guo Y, Feng Z, Jiang B, Pan S, Gao C
Journal of Inflammation Research 2024, 17:11305-11318
Published Date: 20 December 2024
RAR-Based Prognostic Model for Predicting Overall Survival in Hepatitis B Virus-Related Hepatocellular Carcinoma: A Multicenter Study
Tan M, Liu Y, Dai W, Chen Y, Cai D, Chen B, Wang J, You R, Li D, Huang H
Journal of Inflammation Research 2025, 18:9159-9170
Published Date: 11 July 2025