")
Back to Journals » Diabetes, Metabolic Syndrome and Obesity » Volume 16
Risk Factors and Prediction Nomogram of Cognitive Frailty with Diabetes in the Elderly
Authors Deng Y, Li N, Wang Y, Xiong C, Zou X
Received 17 June 2023
Accepted for publication 2 October 2023
Published 16 October 2023 Volume 2023:16 Pages 3175—3185
DOI https://doi.org/10.2147/DMSO.S426315
Checked for plagiarism Yes
Review by Single anonymous peer review
Peer reviewer comments 3
Editor who approved publication: Prof. Dr. Muthuswamy Balasubramanyam
Yinhui Deng,1 Na Li,2 Yaru Wang,2 Chen Xiong,2 Xiaofang Zou1
1Department of Nursing, The Third Affiliated Hospital of Guangzhou Medical University, Guangzhou, Guangdong, People’s Republic of China; 2School of Nursing, Guangzhou Medical University, Guangzhou, Guangdong, People’s Republic of China
Correspondence: Xiaofang Zou, Department of Nursing, The Third Affiliated Hospital of Guangzhou Medical University, Guangzhou, Guangdong, People’s Republic of China, Tel +8618998321627, Fax +86-20-81292949, Email [email protected]
Purpose: Diabetes is a well-recognized risk factor for cognitive frailty. This study aimed to investigate the influencing factors of cognitive frailty in elderly patients with diabetes and develop a nomogram for its assessment.
Methods: We collected the clinical data of diabetic patients aged 60 years or older and the patients were divided into training and validation cohorts at a ratio of 7:3. In the training cohort, logistic regression was used to screen out the influencing factors of cognitive frailty in elderly diabetic patients, and a risk prediction model and nomogram were constructed and verified in the validation cohort. The performance of the model was evaluated using various measures, including the area under the receiver operating characteristic curve, calibration curve, Hosmer-Lemeshow test and decision curve analysis.
Results: A total of 315 elderly diabetic patients were included, of which 87 (27.6%) patients had cognitive frailty. Age, albumin levels, calf circumference, duration of diabetes, intellectual activity, and depressive state were identified as independent risk factors for cognitive frailty in older patients with diabetes (P < 0.05). The training cohort and validation cohort demonstrated area under curve (AUC) values of 0.866 and 0.821, respectively.
Conclusion: Older patients with diabetes have a higher prevalence of cognitive frailty. The nomogram model exhibited satisfactory calibration and identification, providing a reliable tool for assessing the risk of cognitive frailty in individuals with diabetes.
Keywords: cognitive frailty, diabetes, nomogram, prediction, risk factors
Two Letters to the Editor have been received and published for this article
Introduction
The rapid increase in the elderly population has led to aging becoming a significant global social issue, with frailty among the elderly emerging as a major challenge.1 Frailty is a medical syndrome characterized by diminished strength, endurance, and physiological function, making individuals more vulnerable to increased dependency and mortality.2 It is a prevalent health concern in the aging process, involving the loss of physiological reserves, decline in muscle quantity and quality, impaired physiological function, reduced resistance to stressors, and physiological and pathological changes across multiple systems such as muscle, metabolism, and immunity.3,4 Frailty represents a critical stage and an intermediate state of age-related decline, with chronic diseases exacerbating the decline of physiological reserve function in multiple systems, thereby increasing the risk of falls, disability, dementia, hospitalization, and mortality.5–7 Among the subtypes of frailty, cognitive frailty has gained significant attention as an important concept in modern medicine.
Cognitive frailty is a heterogeneous clinical manifestation characterized by the coexistence of physical frailty and cognitive impairment.8 The prevalence of cognitive frailty was 1.0%-22%, and the prevalence of cognitive frailty in the elderly in the clinical environment was higher than that in the community.9 Diabetes, one of the most prevalent chronic diseases worldwide, has been identified as a risk factor for cognitive frailty.10,11 The underlying mechanism linking cognitive frailty and diabetes remains unclear, although potential common mechanisms and associations with insulin resistance or metabolic syndrome have been suggested.8,12 Co-occurring cognitive frailty in individuals with diabetes further increases the risk of adverse outcomes in the elderly population.13 Cognitive frailty represents a form of pathological brain aging and a precursor to neurodegenerative processes, with potential for reversibility. However, once cognitive frailty has manifested, complete reversal becomes challenging. Consequently, there is an urgent need to develop convenient and efficient early warning tools.
Nomograms, as practical and user-friendly prediction tools, have gained popularity due to their ability to quantify the probability of clinical events. The nomogram integrates the influence of each influencing factor on the outcome variable through multi-factor regression, assigns points to each value level of each influencing factor, and then quickly scores each risk factor and summarizes the scores.14 The prediction probability corresponding to the final total score is the probability of occurrence of outcome events. The nomogram helps medical staff to make clinical decisions quickly, formulate intervention strategies to delay the process of cognitive frailty in the elderly, and even reverse the development of cognitive frailty. Therefore, the objective of this study is to analyze the influencing factors of cognitive frailty in elderly patients with diabetes and construct a nomogram.
Methods
Study Design and Population
This is a cross-sectional study. Convenience sampling method was used to select inpatients from the Third Affiliated Hospital of Guangzhou Medical University. Inclusion criteria are as follows: (1) Age was 60 years old or older; (2) T2DM, using the World Health Organization (WHO) established diabetes diagnostic criteria;15 (3) Clear consciousness, no communication barriers; (4) Informed consent, voluntary participation in this study. Exclusion criteria: (1) Patients who have been clearly diagnosed with dementia or mental illness; (2) Patients with severe physical diseases (involving heart, liver, kidney) who could not cooperate with the completion of the survey; (3) Those with any known severe vision and auditory problems or unable to complete the questionnaire. The Events Per Variable criterion (EPV) method was used to calculate the sample size. The sample size satisfies the rule of thumb of at least 10 people for each candidate predictor variable.16 Before the interview, we explained the purpose and content of the study to the participants and obtained their informed consent. All patients signed informed consent.
Diagnosis of Cognitive Frailty
Cognitive frailty operant was defined as patients with both physical frailty and cognitive impairment, but no clinical diagnosis of Alzheimer’s disease or other types of dementia.17 We used Fried’s phenotype (PF) and Montreal Cognitive Assessment (MoCA) to assess cognitive frailty.
The PF was adopted to assess physical function. It included five evaluation indicators:18 (1) Unintentional weight loss: In the past year, unexpected weight loss > 4.5kg or > 5% (excluding diet and exercise); (2) Slowness: It was assessed by recording the time required to walk at 4.6m; (3) Weakness: It was assessed by the mean of three consecutive measures the same hand-muscle developer, and the cut-of points adjusted for gender and BMI; (4) Low physical activity: Men exercise less than 383kcal per week (about 2.5 hours / week) or women exercise less than 270kcal per week (about 2 hours / week) using Minda Leisure Activity Questionnaire (MLTA); (5) Fatigue: It was assessed with two questions from the Center for Epidemiological Studies–Depression (CES-D). Ask the elderly how many days a week will feel “I feel I need to work hard to do everything” and “I feel I cannot continue my life”, and any question for more than 3 days a week will get 1 point. With a total score ranges from 0 to 5 and scores ≥ 3 were assessed as frailty. Cognitive function was evaluated with the MoCA.19 The main evaluation contents included visual space and executive function, naming, memory, attention, language, abstraction, delayed recall and orientation, with a total score of 30 points. After the final evaluation, the score ≤ 26 was divided into cognitive dysfunction (the total score of those with less than 12 years of education plus 1 point), and the high score indicated good cognitive function. If PF is assessed as frailty and MOCA is assessed as cognitive impairment and is not diagnosed with dementia, the patient has cognitive frailty.
Measures
The data were collected through face-to-face interviews conducted by trained researchers using structured questionnaires. The questionnaires covered various aspects, including social demographic characteristics, anthropometry, lifestyle factors, disease conditions, psychological status, functional status, laboratory test indicators, and other clinical data. Social demographic characteristics encompassed age, gender, educational level, and other data. Anthropometric measurements, including height, weight, grip strength, and calf circumference, were recorded, and the body mass index (BMI, kg/m2) was calculated. Calf circumference was measured with participants in an upright position and their legs slightly apart, and a tape measure was placed around the maximum circumference of the calf. Disease conditions included the duration of diabetes and other relevant factors. Lifestyle factors encompassed daily intellectual activities (such as reading newspapers, engaging in brain games for more than 30 minutes every day.), smoking, and drinking habits. Laboratory indicators comprised fasting blood glucose, glycated hemoglobin, albumin, hemoglobin, creatinine, uric acid, total cholesterol, and other relevant parameters.
The Geriatric Depression Scale (GDS-5) was utilized to assess the depression status of the elderly participants.20 Scores ranging from 0 to 5 were assigned, with a score of ≥ 2 indicating the presence of depressive symptoms. The Basic Activities of Daily Living scale (BADL) was employed to evaluate the participants’ basic self-care abilities.21 The evaluation included 10 items, such as dressing, eating, grooming, toileting, and transfer. Scores ranged from 0 to 100, with scores below 95 indicating impaired self-care abilities and a score of 100 representing intact self-care abilities.
The collected data were reviewed and validated by three independent researchers to ensure data integrity and reliability.
Statistical Analysis
The statistical analysis and plotting were conducted using SPSS 26.0, R 4.2. Normal distribution was expressed by the mean ± standard deviation (SD), and non-normal distribution was expressed by the median (interquartile range) [M (P25, P75)]. Independent- sample t tests and Spearman analysis were employed to compare continuous variables between groups. Categorical variables were assessed using the Pearson’s Chi squared test or Fisher’s exact probability test. The R language was utilized to randomly assign study subjects to the training cohort and validation cohort at a ratio of 7:3.22,23 The prediction model was developed using the training cohort and tested in the validation cohort. We used univariate logistic regression and least absolute shrinkage and selection operator (LASSO) regression to screen predictors. For cross-validation results, we selected lambda = min to determine the final candidate variables.24 Then, multivariate analyses were performed to identify independent predictors of cognitive frailty in elderly patients with diabetes. The independent variables selected by binary logistic regression analysis were imported into R software, and the nomogram prediction model was constructed using the “rms” package. The discrimination of the model was evaluated using the area under the receiver operating characteristic (ROC) curve (AUC). To validate the model, a bootstrap method was employed with 1000 resamples, and a calibration curve was generated. The clinical utility of the model was assessed using decision curve analysis (DCA) to evaluate its practical applicability and actual benefits. P < 0.05 was considered statistically significant.
Results
Study Population Characteristics
A total of 317 elderly diabetic patients were interviewed, and two were excluded due to incomplete clinical data. Finally, 315 elderly diabetic patients were included. All participants were randomly divided into a training cohort (n = 221) and a validation cohort (n = 94) using R language, with a ratio of 7:3. Table 1 presents the characteristics of the training cohort and the validation cohort, showing similar attributes. Among the 315 elderly individuals, 87 (27.6%) exhibited cognitive frailty, with 61 (27.6%) in the training cohort and 26 (27.7%) in the validation cohort.
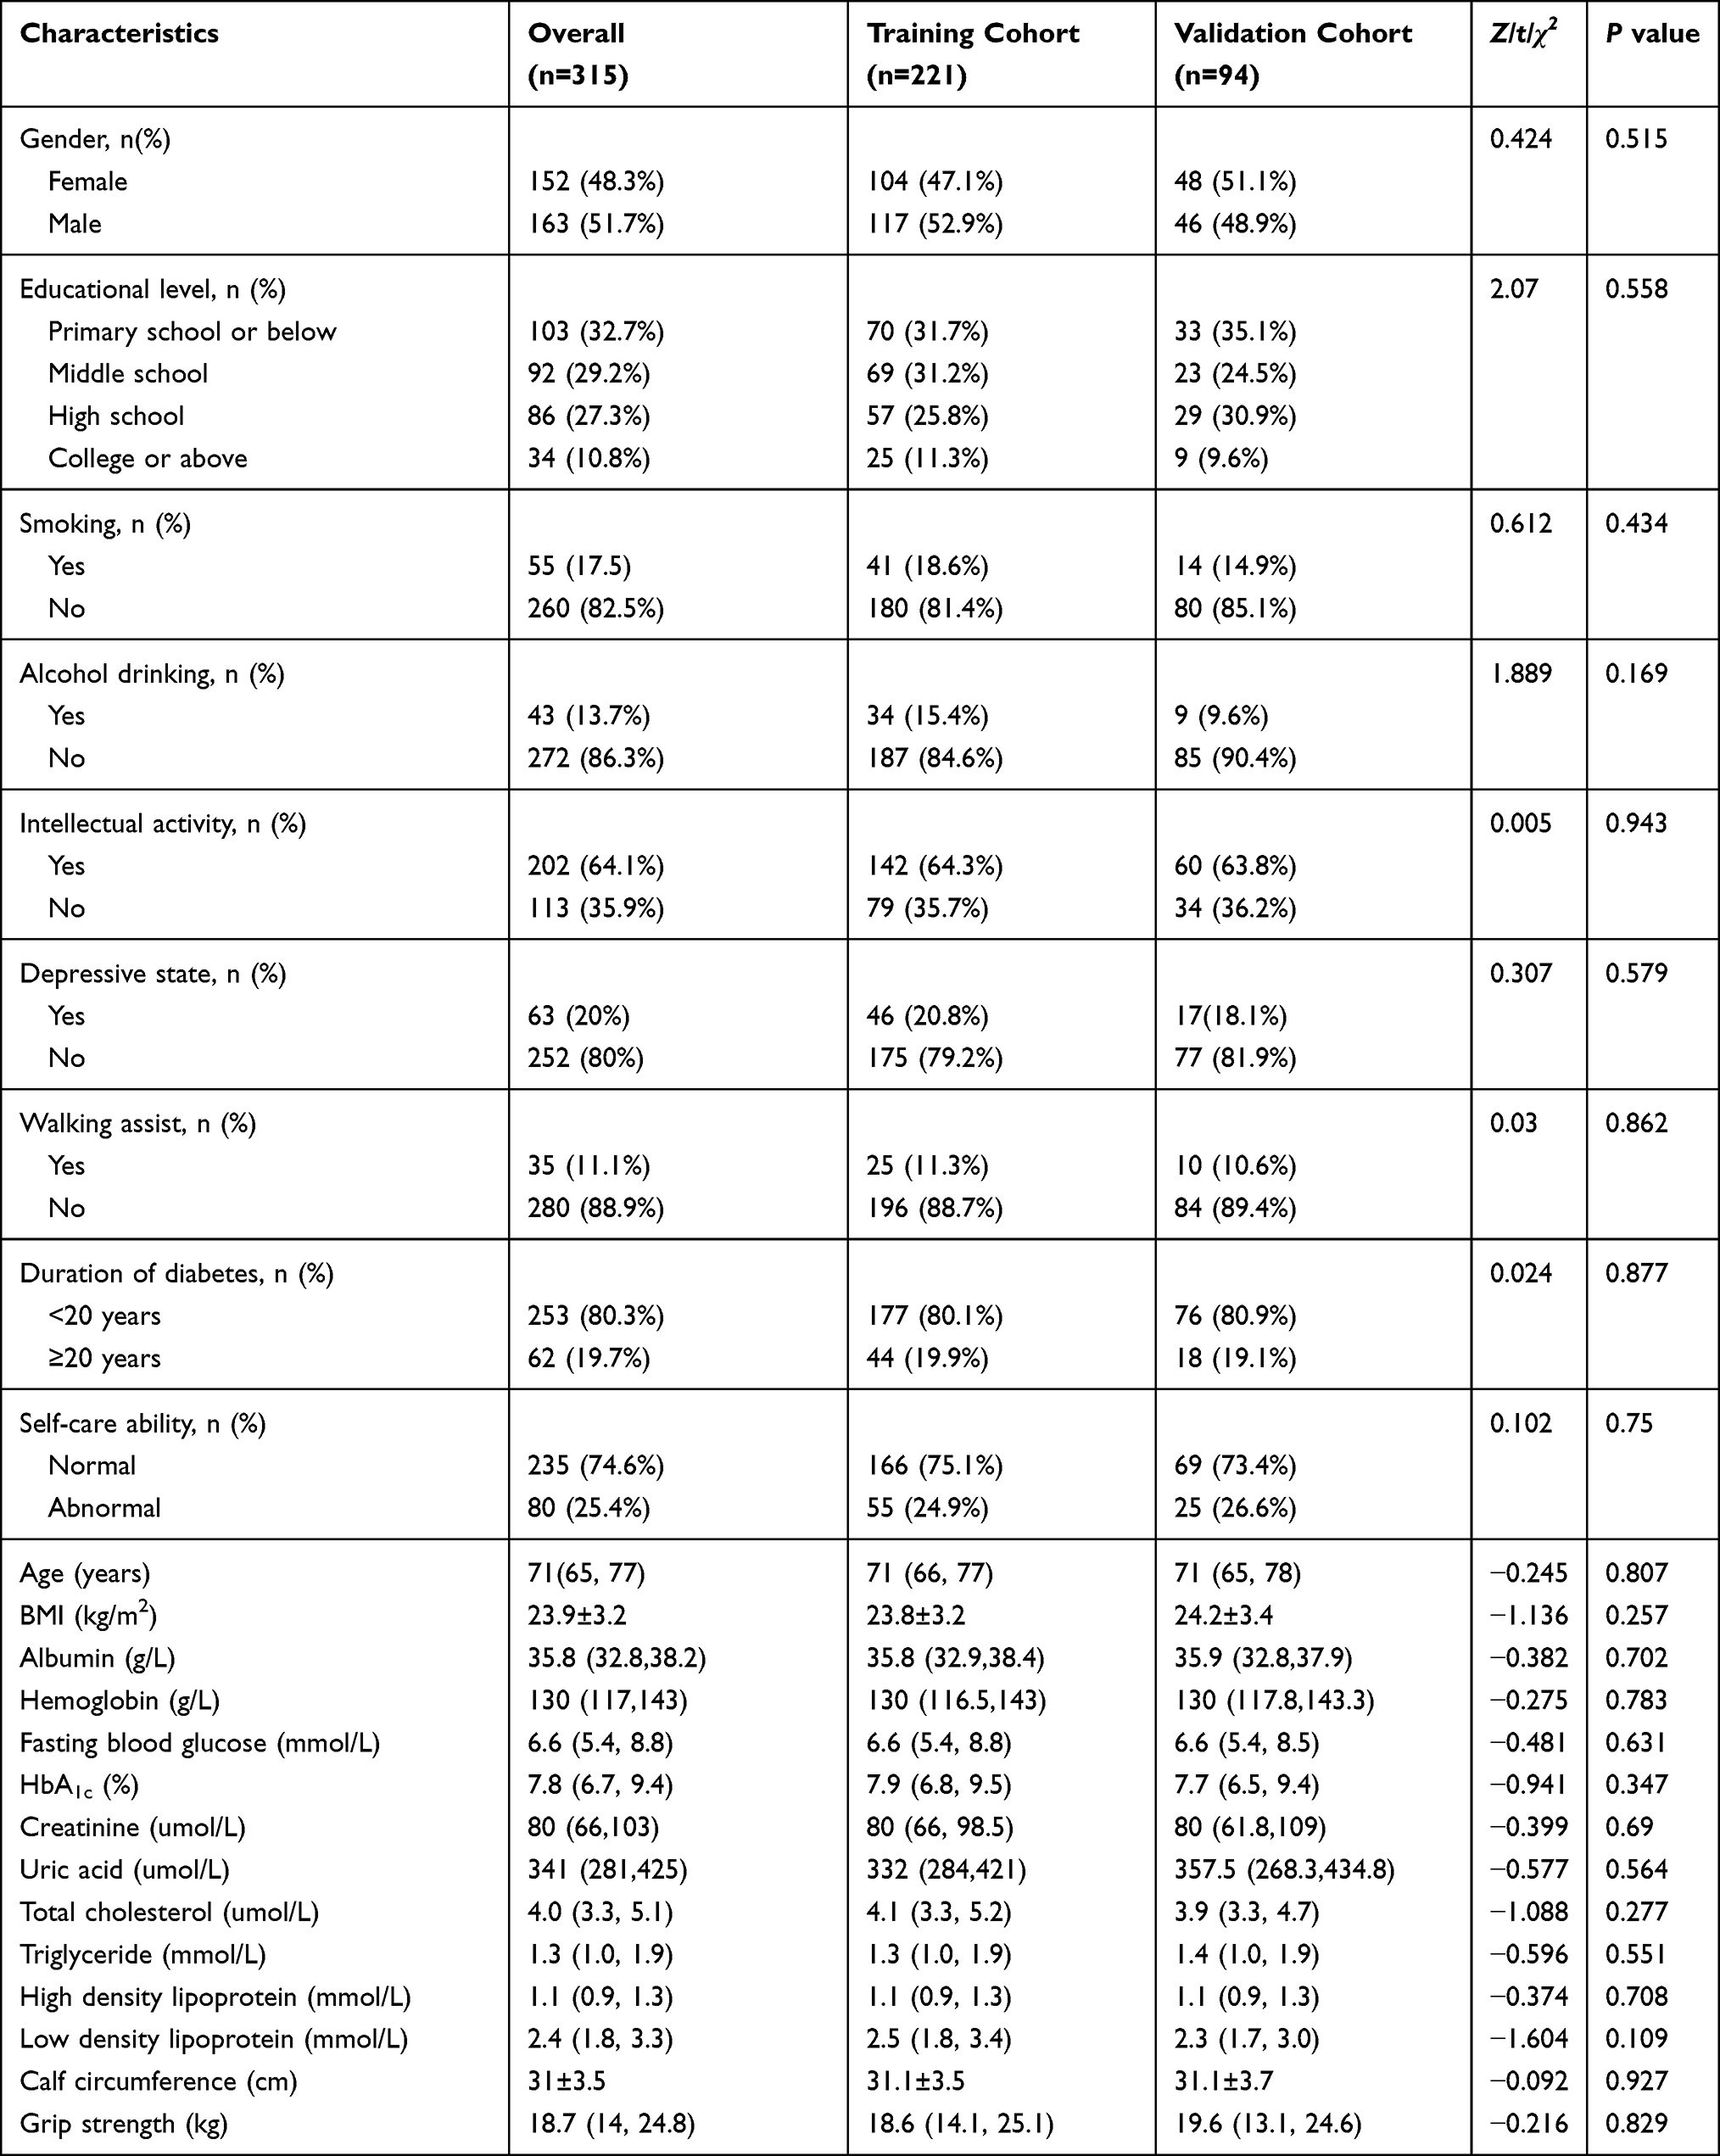 |
Table 1 Characteristics of Training Cohort and Validation Cohort |
Predictor Selection
Univariate logistic regression was performed to screen meaningful variables (Table 2). The results showed that age, education level, BMI, albumin, hemoglobin, creatinine, calf circumference, grip strength, intellectual activity, depressive state, walking assist, duration of diabetes, and self-care ability were the influencing factors of cognitive frailty in elderly diabetic patients. Then, we used LASSO regression 10-fold cross validation to identify valuable predictors of cognitive frailty in elderly diabetic patients. The non-zero coefficient in the LASSO regression model was included in the multivariate logistic regression analysis (Figure 1). The results of the multivariate regression analysis demonstrated that age, intellectual activity, albumin, calf circumference, depressive state, and duration of diabetes were independent influencing factors for cognitive frailty in older patients with diabetes (P<0.05), as shown in Table 2.
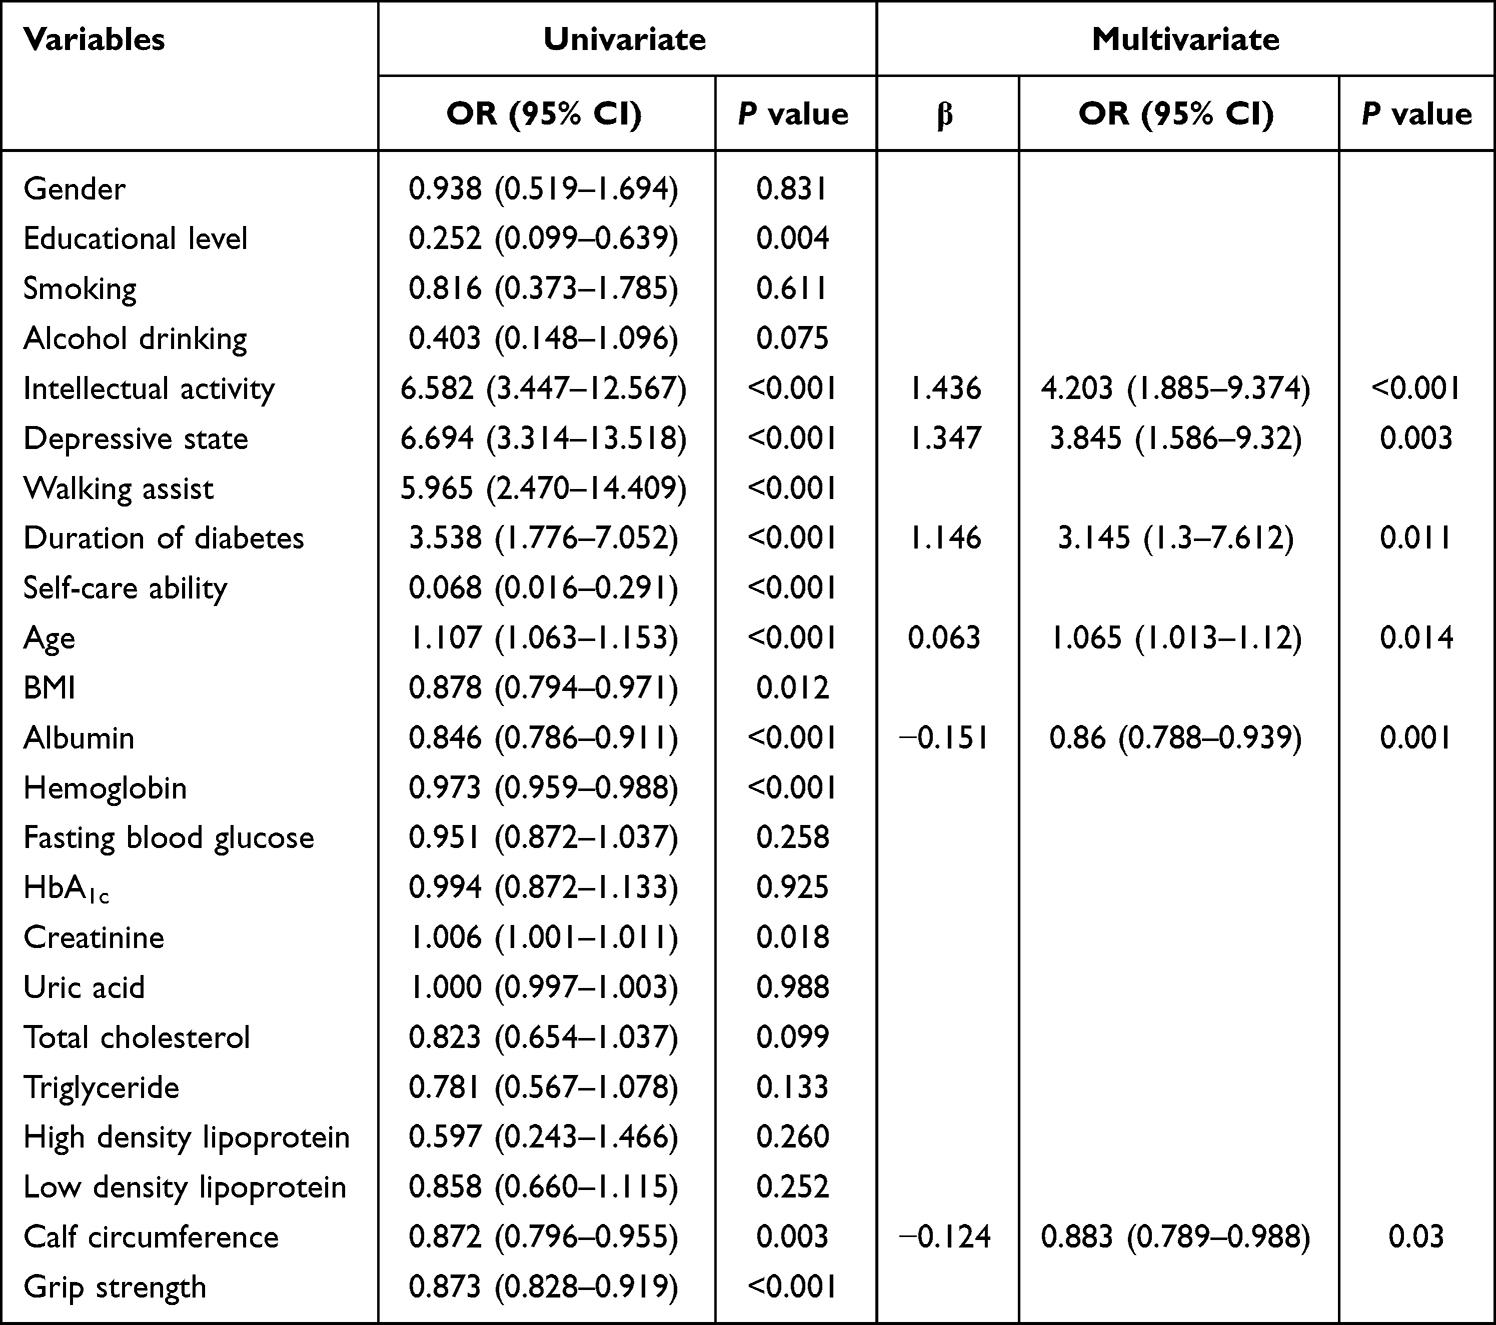 |
Table 2 Logistic Regression Analysis of Risk Factors for Cognitive Frailty in Diabetic Patients |
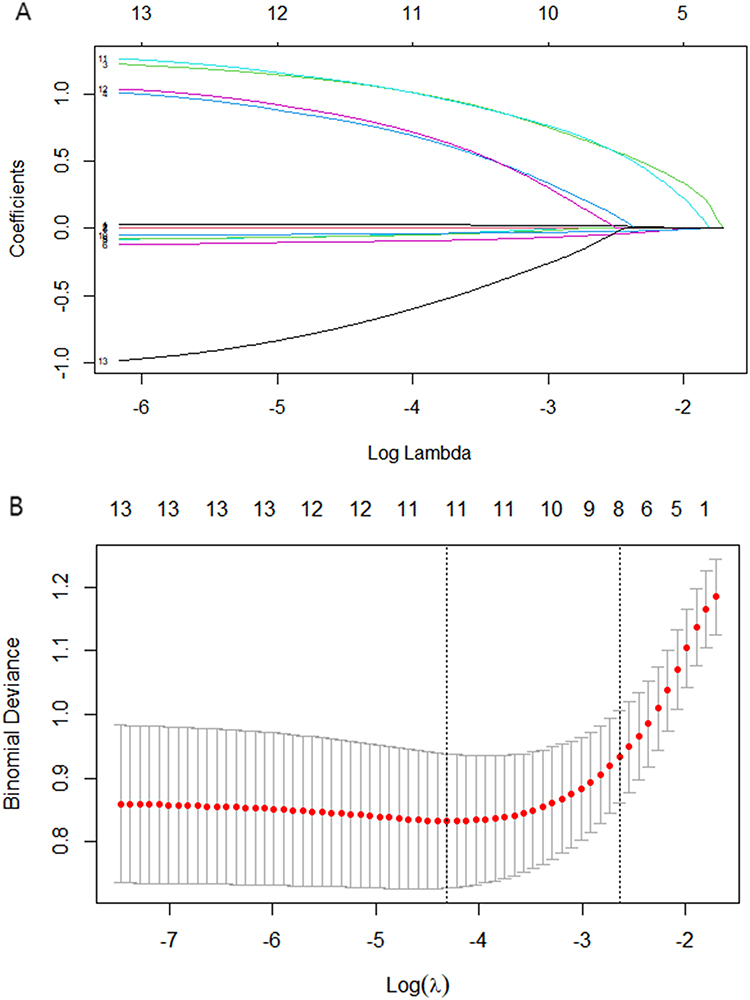 |
Figure 1 Screening variables based on LASSO regression. (A) The LASSO regression model selecting the tuning parameter (λ). (B) The coefficient profiles distribution of log (λ) sequence based on LASSO regression. The C index was plotted with versus log (λ). The 1 standard error of the minimum criterion (1-SE criteria) and the minimum criterion drew the vertical line at the optimal value respectively, where the lambda of the minimum criterion produced 11 features with non-zero coefficients. |
Development of an Individualized Prediction Model
The significant independent predictors obtained from the multivariate analysis were used to generate a nomogram using R language software. Figure 2 illustrates the constructed nomogram derived from the multivariate regression analysis. The area under the receiver operating characteristic (ROC) curve for the nomogram model was 0.866 (95% CI = 0.809–0.922) for the training cohort and 0.821 (95% CI = 0.716–0.927) for the validation cohort (Figure 3), indicating favorable discrimination ability.
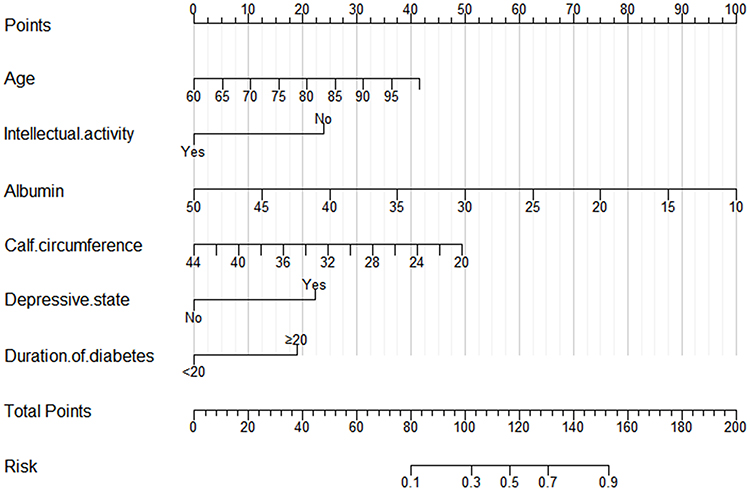 |
Figure 2 Nomogram for predicting cognitive frailty in elderly diabetic patients. |
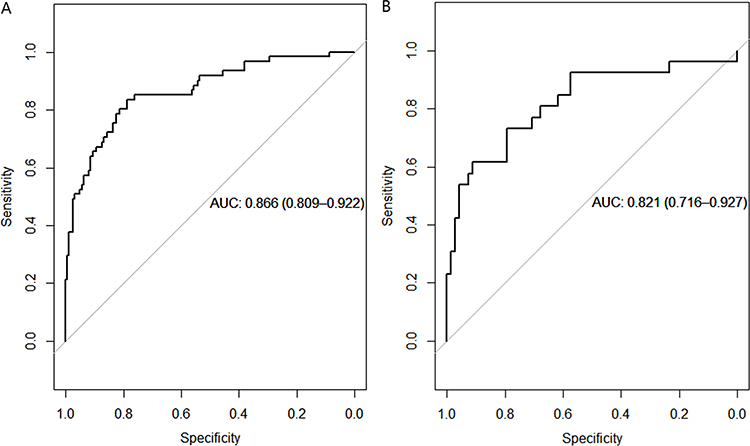 |
Figure 3 ROC curve of the predictive model. (A) Training cohort. (B) Validation cohort. |
Calibration and Clinical Use of the Nomogram
The calibration curve demonstrated a slope close to 1 (Figure 4), indicating good calibration and consistency of the model. The Hosmer-Lemeshow test suggested that the nomogram model results align well with actual outcomes (χ2 = 9.463, P = 0.305) and can be employed to predict the risk of cognitive frailty in elderly diabetic patients. The decision curve analysis (DCA) curve did not intersect with the two extreme curves, implying that the net return rate of the nomogram prediction model is higher than that intervention and non-intervention, underscoring the model’s clinical applicability (Figure 5).
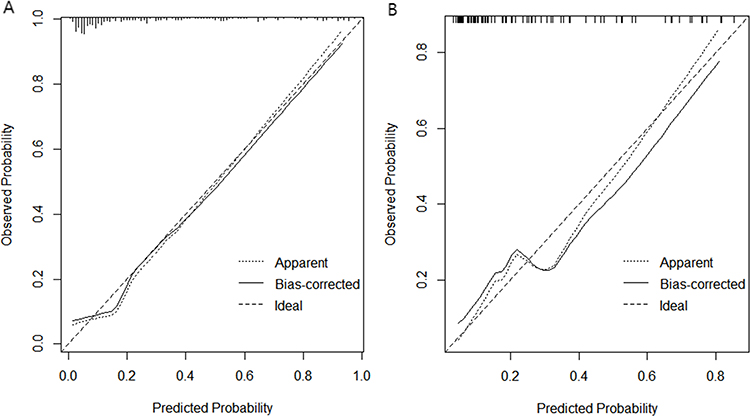 |
Figure 4 Calibration curve for the nomogram. (A) Training cohort. (B) Validation cohort. |
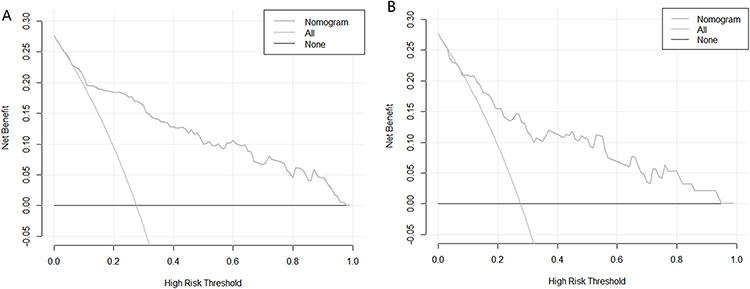 |
Figure 5 DCA of the nomogram. (A) Training cohort. (B) Validation cohort. |
Discussion
Presently, the research on cognitive frailty is mainly concentrated in the community and there are few studies on cognitive frailty in hospitalized patients and no risk prediction model for cognitive frailty in diabetic patients has been found. In our study population, the prevalence of cognitive frailty among hospitalized elderly diabetic patients was found to be 27.6%, indicating a high level of cognitive frailty in this population. Cognitive frailty can affect the quality of life of older people, leading to dementia, disability, disability and even death.25,26 Therefore, it is of great significance to develop a risk prediction model for early identification of cognitive frailty in elderly individuals with diabetes and timely intervention. The prediction model can help medical staff identify the risk population of cognitive frailty in elderly diabetic patients and quantify the risk of individual cognitive frailty and timely intervention.
This study revealed that age, albumin, calf circumference, intellectual activity, depressive state, and diabetes duration were independent influencing factors for cognitive frailty in elderly patients with diabetes. Advanced age is a prominent influencing factor in the development of cognitive frailty and plays a significant role in the frailty process. Consistent with previous community surveys,27 our study demonstrated that the risk of cognitive frailty increases with age. Aging leads to significant reductions in physiological functions, including decreased muscle strength and quality in the limbs, as well as accelerated atrophy of the hippocampus and cerebral cortex, thereby increasing the risk of cognitive frailty.28 Diabetes is associated with frailty accompanied by cognitive impairment (OR 2.01, 95% CI = 1.12–3.60).13 Our study revealed that older adults with a diabetes duration of more than 20 years were more likely to experience cognitive frailty (OR 3.145, 95% CI = 1.3–7.612). This may be related to the fact that diabetes is a vascular risk factor for cognitive frailty, and that patients with a long duration of diabetes are affected vascular and nerves, leading to complications of diabetes, with an increased risk of developing cognitive decline and frailty.29–31 Medical professionals need to focus on cognitive function and frailty in older patients with diabetes, especially those with advanced age and long duration of diabetes, in order to make early response strategies.
Frailty and cognitive function interact with nutritional status.32,33 In our study, albumin emerged as a significant factor associated with cognitive frailty. Prior research has indicated that inadequate protein intake is one of the nutritional contributors to frailty,34 and inadequate energy/protein nutrition among older adults is associated with poorer cognitive function.35 Studies have shown that inflammation and malnutrition are both mechanisms of cognitive frailty, and albumin levels can reflect both inflammatory state and nutritional status.36 Additionally, other studies have indicated that albumin may serve as a marker for cognitive decline and cognitive frailty.37 Consequently, protein assumes an essential role in nutritional supplementation to address cognitive frailty, and professionals can supplement protein and increase albumin levels for the elderly according to the situation. Calf circumference has been employed as a simple indicator of skeletal muscle mass, sarcopenia, and nutritional status.38–40 Studies conducted in South Korea have shown an association between calf circumference and cognitive frailty,41 which is consistent with the findings of our study. Specifically, our study revealed that smaller calf circumference in the elderly was associated with a higher risk of cognitive frailty. In diabetic patients, insulin resistance inhibits the energy intake process of muscle cells, leading to short-term muscle contraction difficulties and long-term muscle mass reduction and atrophy, thereby accelerating the progression of cognitive frailty.42 Specialists need to pay attention to the elderly with smaller calf circumference, develop personalized interventions for them, improve bone and muscle mass, and reduce the risk of cognitive frailty.
Depressive state, characterized by a low mood, is a common psychological issue among the elderly.43 Our study also demonstrated that depression serves as an emotional factor influencing cognitive frailty, which is consistent with the findings of Xie et al,44 who reported an odds ratio of 3.88 (95% CI = 2.39–6.29). The elderly with depressive state have poor mood and decreased appetite, resulting in malnutrition, decreased albumin levels, decreased muscle mass, decreased bone mineral density, and smaller calf circumference, which ultimately leads to an increased risk of cognitive frailty. Professionals need to pay attention to the mental health of the elderly and provide psychological counseling for the elderly to improve their quality of life. Studies have indicated that elderly individuals who frequently engage in intellectual activities have a lower risk of frailty (adjusted RR 0.65, 95% CI = 0.47–0.90),45 which is consistent with our findings. A bidirectional relationship exists between intellectual activity and cognitive function, whereby improved cognitive function fosters increased engagement in intellectual activities among the elderly.46,47 Participation in physical and intellectual activities can be beneficial in improving cognitive function and frailty in older adults.48–50 The elderly should take the initiative to carry out intellectual activities. Professionals and family members should encourage the elderly to carry out intellectual activities every day to exercise their brain ability to reduce the risk of cognitive frailty.
Limitations
The nomogram prediction model constructed in this study demonstrates effective risk prediction for cognitive frailty in elderly diabetic patients. However, there are certain limitations that need to be acknowledged. Firstly, as this study is based on a cross-sectional design, it is important to note that causal inferences cannot be drawn. Secondly, the data collection was confined to a single hospital and focused specifically on elderly diabetic patients. Consequently, further validation of our nomogram model is essential in diverse settings and populations.
Conclusion
In this study, the nomogram consisting of age, albumin levels, calf circumference, intellectual activity, depressive state, and duration of diabetes is a simple and user-friendly tool, with exhibits excellent predictive performance and clinical practicability. The nomogram can quantify the risk of cognitive frailty in elderly diabetic patients, so as to help better develop intervention strategies and delay the process of cognitive frailty in the elderly and improve the quality of life. Furthermore, we encourage the validation and widespread utilization of this nomogram across diverse populations and healthcare settings in the future.
Ethical Approval
The study has been approved by the ethics committee of The Third Affiliated Hospital of Guangzhou Medical University (approval No. 2022198), which was consistent with medical ethics. This research was based on the ethical principles of the Declaration of Helsinki.
Acknowledgment
Thanks to all who contributed to this study. Thank the statistician Yanhui Gao for the review of statistical methods and articles.
Funding
There is no funding to report.
Disclosure
The authors declare that they have no conflicts of interest in this work.
References
1. Cohen RA, Marsiske MM, Smith GE. Neuropsychology of aging. Handb Clin Neurol. 2019;167:149–180. doi:10.1016/B978-0-12-804766-8.00010-8
2. Morley JE, Vellas B, van Kan GA, et al. Frailty consensus: a call to action. J Am Med Dir Assoc. 2013;14(6):392–397. doi:10.1016/j.jamda.2013.03.022
3. Kwak D, Thompson LV. Frailty: past, present, and future? Sports Med Health Sci. 2021;3(1):1–10. doi:10.1016/j.smhs.2020.11.005
4. Picca A, Coelho-Junior HJ, Calvani R, et al. Biomarkers shared by frailty and sarcopenia in older adults: a systematic review and meta-analysis. Ageing Res Rev. 2022;73:101530. doi:10.1016/j.arr.2021.101530
5. Vermeiren S, Vella-Azzopardi R, Beckwee D, et al. Frailty and the prediction of negative health outcomes: a meta-analysis. J Am Med Dir Assoc. 2016;17(12):1163 e1161–1163 e1117. doi:10.1016/j.jamda.2016.09.010
6. Fhon JR, Rodrigues RA, Neira WF, et al. Fall and its association with the frailty syndrome in the elderly: systematic review with meta-analysis. Rev Esc Enferm USP. 2016;50(6):1005–1013. doi:10.1590/S0080-623420160000700018
7. Ward DD, Ranson JM, Wallace LMK, et al. Frailty, lifestyle, genetics and dementia risk. J Neurol Neurosurg Psychiatry. 2022;93(4):343–350. doi:10.1136/jnnp-2021-327396
8. Ruan Q, Yu Z, Chen M, et al. Cognitive frailty, a novel target for the prevention of elderly dependency. Ageing Res Rev. 2015;20:1–10. doi:10.1016/j.arr.2014.12.004
9. Panza F, Lozupone M, Solfrizzi V, et al. Different cognitive frailty models and health- and cognitive-related outcomes in older age: from epidemiology to prevention. J Alzheimers Dis. 2018;62(3):993–1012. doi:10.3233/JAD-170963
10. Glovaci D, Fan W, Wong ND. Epidemiology of diabetes mellitus and cardiovascular disease. Curr Cardiol Rep. 2019;21(4):21. doi:10.1007/s11886-019-1107-y
11. Fougere B, Delrieu J, Del Campo N, et al. Cognitive frailty: mechanisms, tools to measure, prevention and controversy. Clin Geriatr Med. 2017;33(3):339–355. doi:10.1016/j.cger.2017.03.001
12. Ma L, Chan P. Understanding the physiological links between physical frailty and cognitive decline. Aging Dis. 2020;11(2):405–418. doi:10.14336/AD.2019.0521
13. Thein FS, Li Y, Nyunt MSZ, et al. Physical frailty and cognitive impairment is associated with diabetes and adversely impact functional status and mortality. Postgrad Med. 2018;130(6):561–567. doi:10.1080/00325481.2018.1491779
14. Balachandran VP, Gonen M, Smith JJ, et al. Nomograms in oncology: more than meets the eye. Lancet Oncol. 2015;16(4):e173–180. doi:10.1016/S1470-2045(14)71116-7
15. International Expert C. International Expert Committee report on the role of the A1C assay in the diagnosis of diabetes. Diabetes Care. 2009;32(7):1327–1334. doi:10.2337/dc09-9033.
16. van Smeden M, Moons KG, de Groot JA, et al. Sample size for binary logistic prediction models: beyond events per variable criteria. Stat Methods Med Res. 2019;28(8):2455–2474. doi:10.1177/0962280218784726
17. Kelaiditi E, Cesari M, Canevelli M, et al. Cognitive frailty: rational and definition from an (I.A.N.A./I.A.G.G.) international consensus group. J Nutr Health Aging. 2013;17(9):726–734. doi:10.1007/s12603-013-0367-2
18. Fried LP, Tangen CM, Walston J, et al. Frailty in older adults: evidence for a phenotype. J Gerontol a Biol Sci Med Sci. 2001;56(3):M146–156. doi:10.1093/gerona/56.3.m146
19. Nasreddine ZS, Phillips NA, Bedirian V, et al. The Montreal cognitive assessment, MoCA: a brief screening tool for mild cognitive impairment. J Am Geriatr Soc. 2005;53(4):695–699. doi:10.1111/j.1532-5415.2005.53221.x
20. Eriksen S, Bjorklof GH, Helvik AS, et al. The validity of the hospital anxiety and depression scale and the geriatric depression scale-5 in home-dwelling old adults in Norway(✰). J Affect Disord. 2019;256:380–385. doi:10.1016/j.jad.2019.05.049
21. Wade DT, Collin C. The Barthel ADL index: a standard measure of physical disability? Int Disabil Stud. 1988;10(2):64–67. doi:10.3109/09638288809164105
22. Wu WT, Li YJ, Feng AZ, et al. Data mining in clinical big data: the frequently used databases, steps, and methodological models. Mil Med Res. 2021;8(1):44. doi:10.1186/s40779-021-00338-z
23. Moons KG, Altman DG, Reitsma JB, et al. Transparent reporting of a multivariable prediction model for individual prognosis or diagnosis (TRIPOD): explanation and elaboration. Ann Intern Med. 2015;162(1):W1–73. doi:10.7326/M14-0698
24. Friedman J, Hastie T, Tibshirani R. Regularization paths for generalized linear models via coordinate descent. J Stat Softw. 2010;33(1):1–22. doi:10.18637/jss.v033.i01
25. Feng L, Zin Nyunt MS, Gao Q, et al. Cognitive frailty and adverse health outcomes: findings from the Singapore longitudinal ageing studies (SLAS). J Am Med Dir Assoc. 2017;18(3):252–258. doi:10.1016/j.jamda.2016.09.015
26. Bu Z, Huang A, Xue M, et al. Cognitive frailty as a predictor of adverse outcomes among older adults: a systematic review and meta-analysis. Brain Behav. 2021;11(1):e01926. doi:10.1002/brb3.1926
27. Malek Rivan NF, Shahar S, Rajab NF, et al. Cognitive frailty among Malaysian older adults: baseline findings from the LRGS TUA cohort study. Clin Interv Aging. 2019;14:1343–1352. doi:10.2147/CIA.S211027
28. Sambuco N. Sex differences in the aging brain? A voxel-based morphometry analysis of the hippocampus and the amygdala. Neuroreport. 2021;32(16):1320–1324. doi:10.1097/WNR.0000000000001728
29. Li FR, Yang HL, Zhou R, et al. Diabetes duration and glycaemic control as predictors of cardiovascular disease and mortality. Diabetes Obes Metab. 2021;23(6):1361–1370. doi:10.1111/dom.14348
30. Reinke C, Buchmann N, Fink A, et al. Diabetes duration and the risk of dementia: a cohort study based on German health claims data. Age Ageing. 2022;51(1). doi:10.1093/ageing/afab231
31. Bellary S, Kyrou I, Brown JE, et al. Type 2 diabetes mellitus in older adults: clinical considerations and management. Nat Rev Endocrinol. 2021;17(9):534–548. doi:10.1038/s41574-021-00512-2
32. Chye L, Wei K, Nyunt MSZ, et al. Strong relationship between malnutrition and cognitive frailty in the Singapore longitudinal ageing studies (SLAS-1 and SLAS-2). J Prev Alzheimers Dis. 2018;5(2):142–148. doi:10.14283/jpad.2017.46
33. Gomez-Gomez ME, Zapico SC. Frailty, cognitive decline, neurodegenerative diseases and nutrition interventions. Int J Mol Sci. 2019;20(11):2842. doi:10.3390/ijms20112842
34. Ni Lochlainn M, Cox NJ, Wilson T, et al. Nutrition and frailty: opportunities for prevention and treatment. Nutrients. 2021;13(7):2349. doi:10.3390/nu13072349
35. Morley JE. Cognition and nutrition. Curr Opin Clin Nutr Metab Care. 2014;17(1):1–4. doi:10.1097/MCO.0000000000000005
36. Sugimoto T, Arai H, Sakurai T. An update on cognitive frailty: its definition, impact, associated factors and underlying mechanisms, and interventions. Geriatr Gerontol Int. 2021;22(2):99–109. doi:10.1111/ggi.14322
37. Sargent L, Nalls M, Starkweather A, et al. Shared biological pathways for frailty and cognitive impairment: a systematic review. Ageing Res Rev. 2018;47:149–158. doi:10.1016/j.arr.2018.08.001
38. Maeda K, Koga T, Nasu T, et al. Predictive accuracy of calf circumference measurements to detect decreased skeletal muscle mass and European society for clinical nutrition and metabolism-defined malnutrition in hospitalized older patients. Ann Nutr Metab. 2017;71(1–2):10–15. doi:10.1159/000478707
39. Gonzalez MC, Mehrnezhad A, Razaviarab N, et al. Calf circumference: cutoff values from the NHANES 1999–2006. Am J Clin Nutr. 2021;113(6):1679–1687. doi:10.1093/ajcn/nqab029
40. Portero-McLellan KC, Staudt C, Silva FR, et al. The use of calf circumference measurement as an anthropometric tool to monitor nutritional status in elderly inpatients. J Nutr Health Aging. 2010;14(4):266–270. doi:10.1007/s12603-010-0059-0
41. Kim M, Jeong MJ, Yoo J, et al. Calf circumference as a screening tool for cognitive frailty in community-dwelling older adults: the Korean frailty and aging cohort study (KFACS). J Clin Med. 2018;7(10):332. doi:10.3390/jcm7100332
42. Yanase T, Yanagita I, Muta K, et al. Frailty in elderly diabetes patients. Endocr J. 2018;65(1):1–11. doi:10.1507/endocrj.EJ17-0390
43. Zis P, Daskalaki A, Bountouni I, et al. Depression and chronic pain in the elderly: links and management challenges. Clin Interv Aging. 2017;12:709–720. doi:10.2147/CIA.S113576
44. Xie B, Ma C, Chen Y, et al. Prevalence and risk factors of the co-occurrence of physical frailty and cognitive impairment in Chinese community-dwelling older adults. Health Soc Care Community. 2021;29(1):294–303. doi:10.1111/hsc.13092
45. Huang Y, Guo X, Du J, et al. Associations between intellectual and social activities with frailty among community-dwelling older adults in China: a prospective cohort study. Front Med. 2021;8:693818. doi:10.3389/fmed.2021.693818
46. Li X, Zhang J, Hou R, et al. Bidirectional associations of intellectual and social activities with cognitive function among middle-aged and elderly adults in China. J Affect Disord. 2022;319:83–89. doi:10.1016/j.jad.2022.09.031
47. Fernandez I, Garcia-Molla A, Oliver A, et al. The role of social and intellectual activity participation in older adults’ cognitive function. Arch Gerontol Geriatr. 2023;107:104891. doi:10.1016/j.archger.2022.104891
48. Bangsbo J, Blackwell J, Boraxbekk CJ, et al. Copenhagen consensus statement 2019: physical activity and ageing. Br J Sports Med. 2019;53(14):856–858. doi:10.1136/bjsports-2018-100451
49. Lee SY, Nyunt MSZ, Gao Q, et al. Association of Tai Chi exercise with physical and neurocognitive functions, frailty, quality of life and mortality in older adults: Singapore longitudinal ageing study. Age Ageing. 2022;51(4). doi:10.1093/ageing/afac086
50. Wang X, Lu Y, Li C, et al. Associations of lifestyle activities and a heathy diet with frailty in old age: a community-based study in Singapore. Aging. 2020;12(1):288–308. doi:10.18632/aging.102615
 © 2023 The Author(s). This work is published and licensed by Dove Medical Press Limited. The full terms of this license are available at https://www.dovepress.com/terms.php and incorporate the Creative Commons Attribution - Non Commercial (unported, v3.0) License.
By accessing the work you hereby accept the Terms. Non-commercial uses of the work are permitted without any further permission from Dove Medical Press Limited, provided the work is properly attributed. For permission for commercial use of this work, please see paragraphs 4.2 and 5 of our Terms.
© 2023 The Author(s). This work is published and licensed by Dove Medical Press Limited. The full terms of this license are available at https://www.dovepress.com/terms.php and incorporate the Creative Commons Attribution - Non Commercial (unported, v3.0) License.
By accessing the work you hereby accept the Terms. Non-commercial uses of the work are permitted without any further permission from Dove Medical Press Limited, provided the work is properly attributed. For permission for commercial use of this work, please see paragraphs 4.2 and 5 of our Terms.