
Back to Journals » International Journal of Chronic Obstructive Pulmonary Disease » Volume 21
The Burden of Chronic Obstructive Pulmonary Disease in the US: A Systematic Review of Nationally Representative Health Surveys
Authors Robayo M  , Obeng-Nyarkoh PI , Hartmann-Boyce J, Valentín-Figueroa ME, Cook S, Sánchez-Romero LM
Received 4 December 2025
Accepted for publication 29 April 2026
Published 14 July 2026 Volume 2026:21 582740
DOI https://doi.org/10.2147/COPD.S582740
Checked for plagiarism Yes
Review by Single anonymous peer review
Peer reviewer comments 2
Editor who approved publication: Prof. Dr. Zijing Zhou
Maria Robayo,1 Peggy-ita Obeng-Nyarkoh,2 Jamie Hartmann-Boyce,3 Maria E Valentín-Figueroa,1 Steven Cook,4 Luz M Sánchez-Romero1
1Department of Oncology, Georgetown University Medical Center, Washington, DC, USA; 2Geisel School of Medicine, Dartmouth College, Hanover, NH, USA; 3Department of Health Promotion and Policy, University of Massachusetts Amherst, Amherst, MA, USA; 4Department of Epidemiology, University of Michigan, Ann Arbor, MI, USA
Correspondence: Luz M Sánchez-Romero, Department of Oncology, Georgetown University Medical Center, 2115 Wisconsin Ave, Suite 300, Washington, DC, 20007, USA, Email [email protected]
Background: COPD prevalence estimates from US national surveys vary widely, likely reflecting differences in diagnostic criteria and measurement approaches. This review aimed to systematically characterize variability in COPD prevalence estimates across nationally representative US surveys, with emphasis on differences by diagnostic criteria and across key population subgroups.
Methods: We searched OVID Medline, OVID Embase and PubMed from inception through October 7th, 2025, for observational studies reporting COPD prevalence in the US general population using nationally representative survey data. Estimates were summarized by diagnostic criteria (spirometry, self-reported) and key subgroups (smoking status, sex and race/ethnicity). Risk of bias (RoB) was assessed using the National Institutes of Health (NIH) Quality Assessment Tool for Observational Cohort and Cross-Sectional Studies.
Results: We included 22 studies from four surveys: The National Health and Nutrition Examination Survey (NHANES); The National Health Interview Survey (NHIS); The Behavioral Risk Factor Surveillance System (BRFSS); and The Population Assessment of Tobacco and Health (PATH). RoB scores ranged between 7 and 8 out of a total of 11 points. Six studies used spirometry and 16 used self-reported diagnosis. Spirometry estimates were consistently higher (12.5– 13.8%) than self-reported estimates (3.0– 7.2%), with NHIS (1997– 2020) showing the highest self-reported estimates. When using spirometry, prevalence was highest in males (17.9%– 23.7%), but when using self-reported data, prevalence was highest in females (3.0%– 8.5%). Current smokers had the highest prevalence in both spirometry (21.2%– 25.7%) and self-report (6.3%– 16.7%). Prevalence was highest among Non-Hispanic Whites using spirometry (13.8%– 17.5%), but it was highest among “Other” when using self-report (1.9%– 11.2%). Among the studies that reported prevalence by COPD severity level, most were classified as mild to moderate obstruction.
Conclusion: Consistent assessment methods across surveys are necessary to better understand and address the real burden of COPD across the diverse US population, supporting more effective surveillance while informing public health policy and prevention efforts.
Keywords: systematic review, COPD, smoking, trends, epidemiology, USA, National Health Surveys
Introduction
Chronic obstructive pulmonary disease (COPD) is a heterogeneous chronic respiratory disease characterized by persistent, often progressive, airflow limitation and respiratory symptoms, resulting from airway abnormalities (bronchitis, bronchiolitis) and/or alveolar damage (emphysema), ranging in severity from mild to very severe.1,2 The main conditions that primarily fall under COPD are chronic bronchitis (CB) and emphysema (E).1 As of 2024, the US Centers for Disease Control and Prevention (CDC) reports that COPD affects more than 15 million Americans and accounts for approximately 150,000 deaths per year.2,3 Beyond its impact on mortality, patients with COPD are at an increased risk of other diseases such as cardiovascular disease and lung cancer.4 Additionally, COPD presents a significant healthcare and economic burden in the US with direct medical expenses and lost productivity contributing to billions of dollars in annual healthcare expenses.5 It is estimated that between 2019–2035 COPD will be responsible for approximately 45 million quality-adjusted life years.6
While cigarette smoking is the leading risk factor for COPD, the disease also affects many adults who never smoked.7–9 This includes demographic groups like older adults, and individuals with a history of asthma.9 Moreover, environmental and occupational exposures such as long-term exposure to biomass fuel, indoor and outdoor air pollution, secondhand smoke, and occupational dust and chemicals are also important contributors to COPD development.1,10
Although estimates from US national data suggest that overall COPD prevalence has remained relatively stable in recent years, important subgroup differences persist,8 making ongoing surveillance a critical priority. Looking beyond overall national prevalence estimates helps us see which communities carry a heavier burden of the disease, and understanding these differences is key to designing prevention efforts, directing resources where they are needed most, and ultimately reducing the impact of COPD. However, measuring COPD is not always straightforward. Changes in survey design, diagnostic criteria, and even question wording can make prevalence appear to change in ways that do not reflect real trends in disease burden.11,12 These differences make it harder to compare results across studies or over time and can blur our understanding of who is most affected, which has important implications for surveillance and population health strategies. To the best of our knowledge, there is currently no comprehensive synthesis examining variability in COPD prevalence estimates across US nationally representative surveys and diagnostic criteria. Therefore, this review aims to summarize and compare COPD prevalence estimates across nationally representative US surveys by diagnostic criteria (spirometry vs self-reported), smoking status, sex, and race/ethnicity.
Methods
Study Protocol
This systematic review examined observational studies on COPD trends in the general adult US population using nationally representative data, focusing on differences by smoking status, sex, and race/ethnicity. COPD diagnoses were based on the definitions used from National Health Surveys – whether based on (1) spirometry values and/or (2) self-reported data. Data collection and reporting followed the Preferred Reporting Items for Systematic Reviews and Meta-Analyses (PRISMA) guidelines (Supplementary Table 1).13 This study was registered in the National Institute for Health Research (NIHR) International Prospective Register of Systematic Reviews (PROSPERO ID CRD42023399386).14
Search Strategy & Search Terms
Three electronic databases of peer-reviewed articles (OVID Medline, OVID Embase, and PubMed) were searched for articles published in English from the earliest available study through October 7th, 2025. The search strategy was developed with the support of a research librarian. We developed a search string utilizing keywords and Medical Subject Headings that comprised the fields of (1) COPD, (2) Prevalence, (3) Tobacco, and (4) US population. Detailed description of the search terms used can be found Supplementary Material A.
Inclusion and Exclusion Criteria
We included observational studies that reported COPD prevalence in the US general adult population, overall and across subgroups when available (tobacco product use, sex, and race/ethnicity). Eligible studies were cross-sectional or cohort studies providing cross-sectional results, published in English, and based on nationally representative US health surveys. Studies could be limited to smokers or nonsmokers or include both groups. We excluded studies that 1) did not define the outcome as COPD (eg, reported only emphysema or chronic bronchitis); 2) were based on non-US populations; 3) focused exclusively on individuals with major comorbid conditions (eg, HIV, COVID-19, cancer, or hospitalized patients); 4) examined recreational substance use; or 5) were clinical trials, simulation models, case reports, systematic reviews, conference abstracts, or study protocols (Supplementary Table 2).
Article Screening and Selection
Duplicate records were removed prior to screening using Zotero15 and RefWorks.16 The studies identified from the search were then imported into Rayyan17 and Covidence18 for further duplicate checks and for title/abstract and full-text screening. Two reviewers (PO-N and MEV-F) independently screened titles and abstracts for relevance using the predefined exclusion criteria. Full texts of potentially eligible studies were then independently assessed by the same reviewers to determine inclusion for data extraction. Any disagreements between them were reviewed and corrected by a third author (LMS-R).
Data Extraction
Data extraction of the included studies was conducted independently among three authors (PO-N, MEV-F, and MR). Studies’ data was collected in a Google Docs form. Data included bibliographic information (title, first author’s surname, and journal), survey name, study design (cross-sectional or longitudinal), sample size, and whether results were stratified by participants’ characteristics, including smoking status, sex, and race/ethnicity. Additional data included population type (eg, youth or adults), age range, smoking status definition, COPD diagnostic criteria, and prevalence estimates.
Risk of Bias Assessment
The risk of bias of each included observational study was independently evaluated by two authors (LMS-R and MR) using the National Institutes of Health (NIH) Quality Assessment Tool for Observational Cohort and Cross-sectional Studies.19 Although the NIH quality assessment tool is not intended to generate an overall numerical score, we summarized the number of criteria met for each study to facilitate transparency and comparability consistent with previous reviews.20–22 Each article was independently reviewed using the 14-item checklist, which addresses potential risks of selection, information, and confounding bias. The results of the quality assessment are shown in Supplementary Table 3.
Each item of the risk-of-bias (RoB) was assigned to the individual criteria for each study using one of five options: “Yes,” “No,” “Not Applicable (N/A),” “Not Reported (NR),” or “Cannot Determine (CD),” depending on the information available. Because only cross-sectional studies were included, questions pertaining to temporality and repeated exposure assessment (Items 6, 7, and 10) and those requiring follow-up or blinded outcome assessment (Items 12 and 13) were classified as N/A. Accordingly, each study was scored on a maximum of 11 items. Quality ratings were categorized using thresholds commonly applied in previous systematic reviews20–22 using this tool: poor (0–3); fair (4–7); and good (8–11). RoB scoring over a total of 11 points was based on the precedent from Homagarani et al (2023),20 which also included mainly cross-sectional studies. All scoring and judgments were made independently and finalized through consensus.
Synthesis
We narratively synthesized the studies organizing findings from the included studies by (1) type of COPD diagnostic criteria (spirometry, self-report or both), and (2) population subgroups (eg, smoking status, sex, race/ethnicity) We presented prevalence results graphically to illustrate overall and within subgroup patterns and variability across studies. All figures were generated using R Studio (4.5.1).23 This approach allows for comparison of estimates while preserving the contextual differences inherent to each dataset. Meta-analysis was not conducted due to substantial heterogeneity across studies in terms of diagnostic criteria (spirometry vs self-report), outcome definitions, time-period, age groups, timing of bronchodilator spirometry (pre or post),24 and subgroup reporting formats. These methodological inconsistencies made statistical pooling inappropriate as it could produce unreliable or non-comparable estimates.
Race and ethnicity categorization also varied across studies, with some surveys presenting only broad categories (eg, “Other,” “Asian/Other”) or combining smaller racial groups due to sample size limitations. To maintain consistency across studies for results description, we aligned categories, when necessary, by retaining the most reported groups (Non-Hispanic White, Non-Hispanic Black, Hispanic) and combining residual categories (eg, Asian, Native American, multiracial) into an “Other” group. As our synthesis focuses on comparative interpretation and no statistical pooling was performed, this approach allowed us to interpret prevalence patterns across studies while acknowledging limitations in the original reporting.
Characteristics of Included Studies
The electronic database search resulted in 3,472 studies. After removing 1,467 duplicates, 2,005 titles and abstracts were screened for relevance of which 224 full texts were reviewed. A total of 22 studies25–46 were included in the analysis (Figure 1). Table 1 presents the characteristics of the included studies, including study ID, sample size, data collection period, survey source, diagnostic criteria, subgroups analyzed, and overall risk of bias.
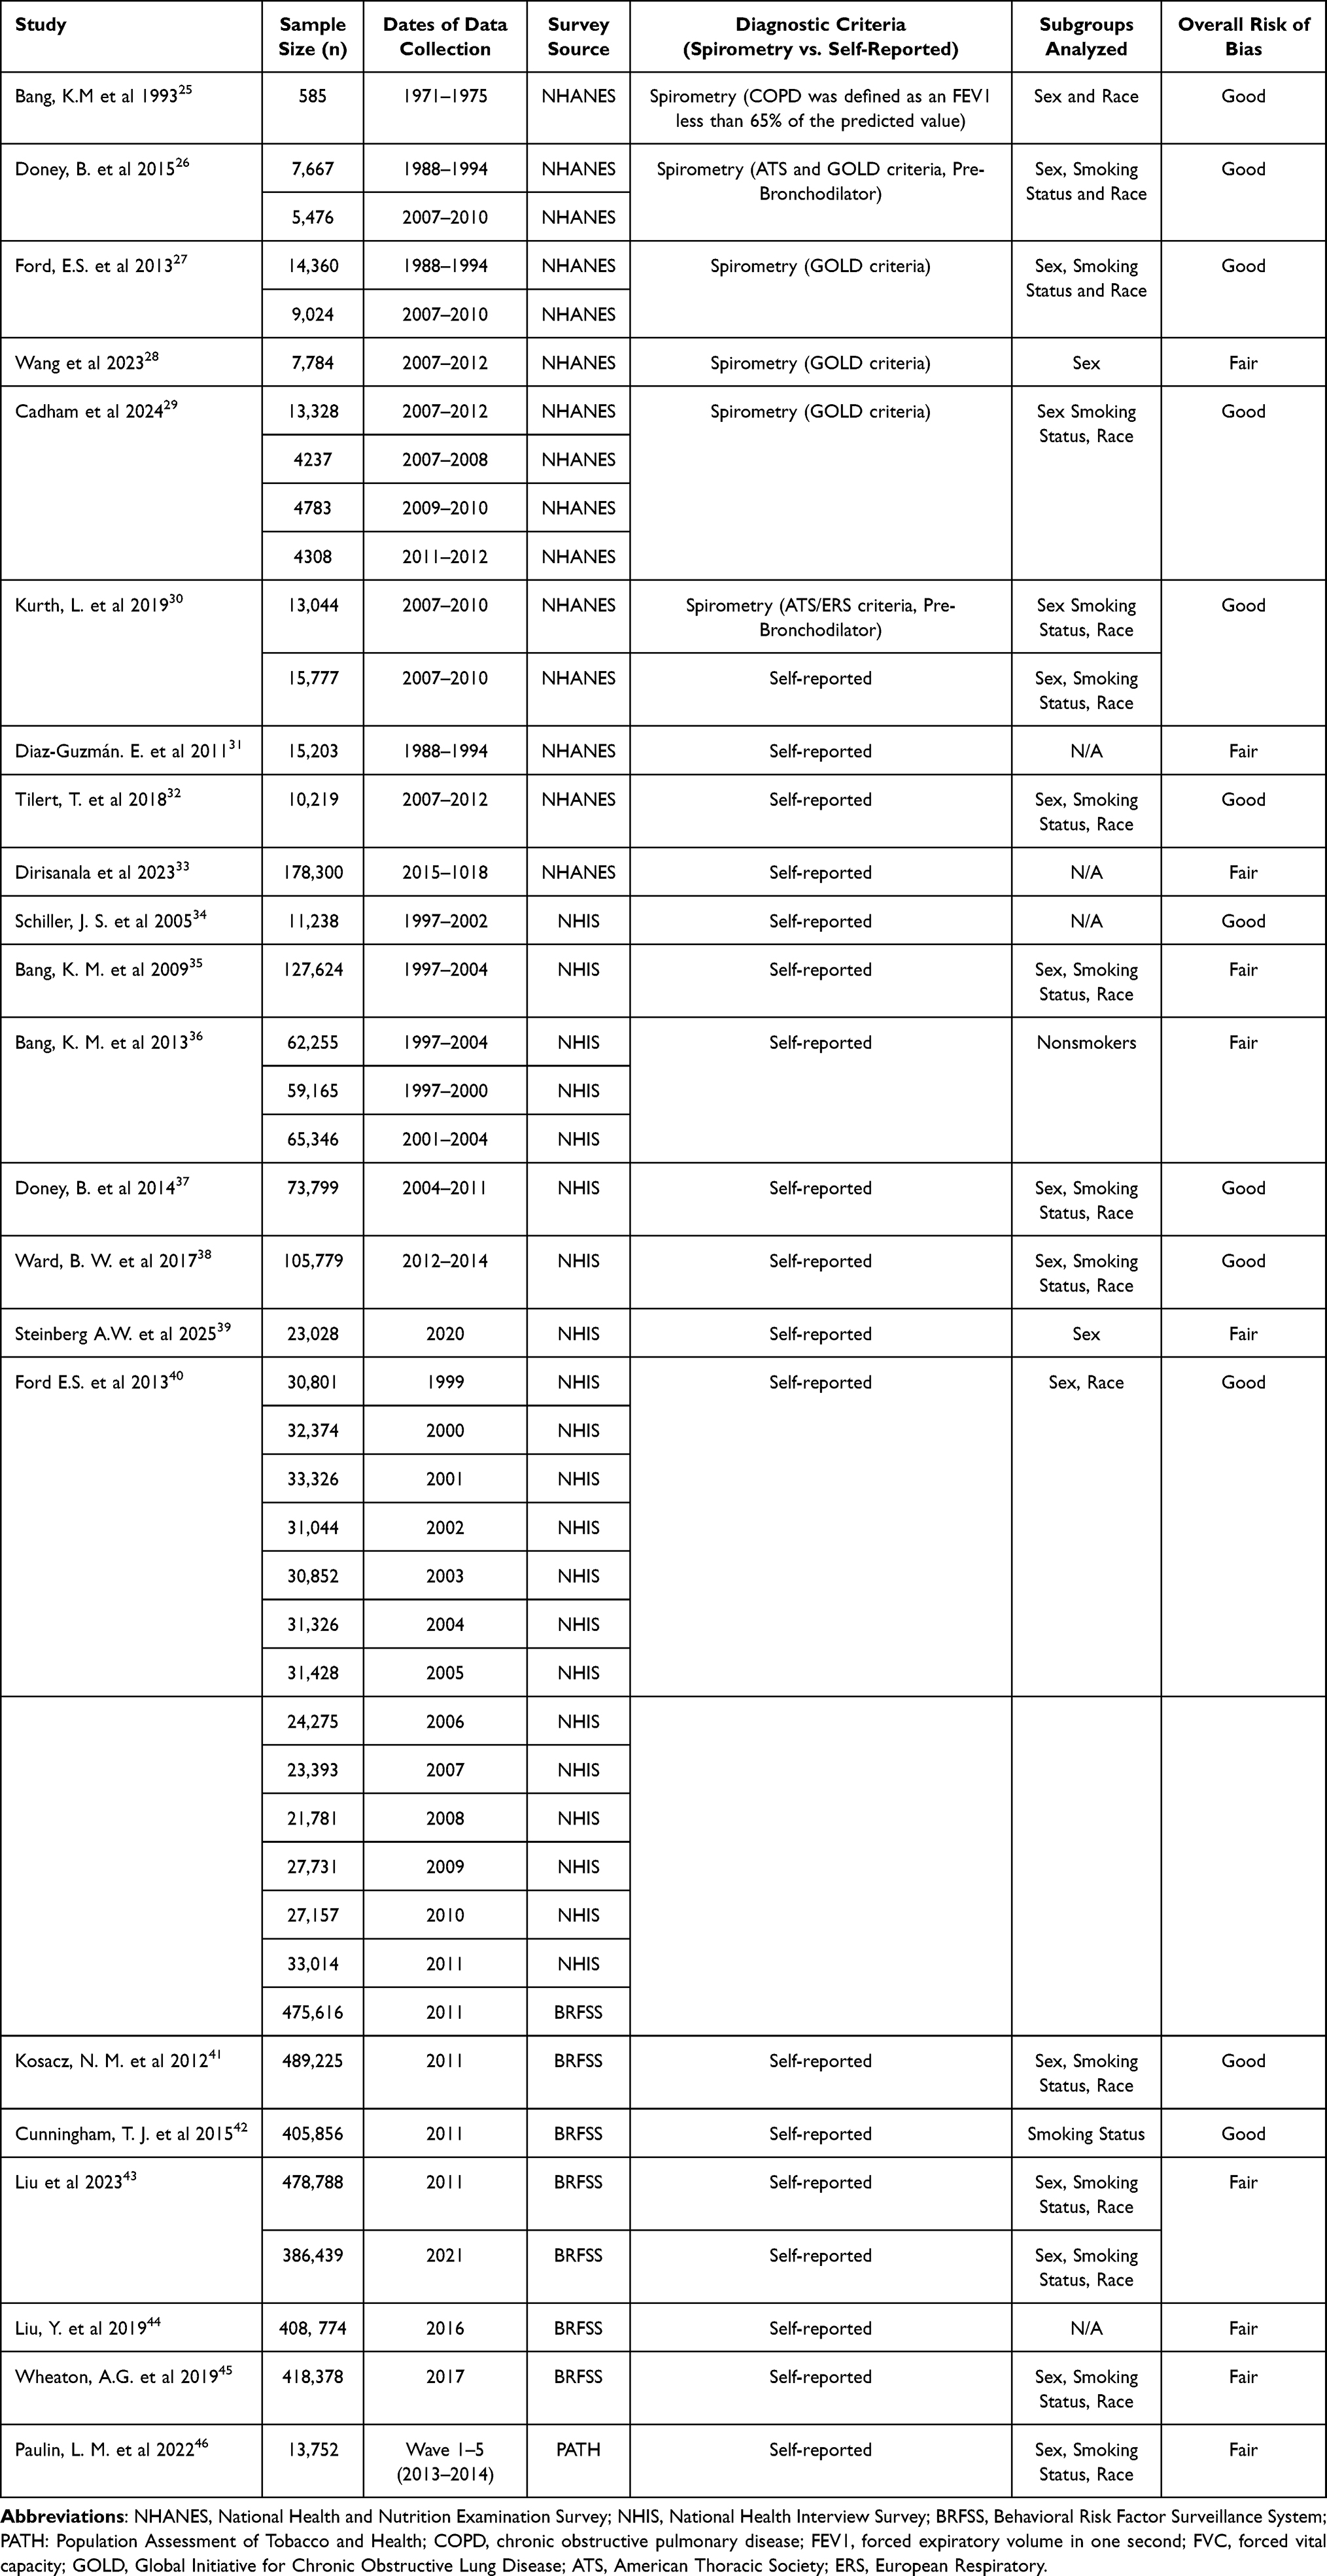 |
Table 1 Characteristics of Included Studies |
 |
Figure 1 PRISMA flow diagram of the selection.47 |
Results were extracted from four nationally representative US population surveys. The National Health and Nutrition Examination Survey (NHANES), a cross-sectional survey conducted since 1971 and continuous since 1999 in two-year cycles, assesses health and nutrition through interview and examinations; spirometry data was collected for adults aged 18 and older only during 1988–1994 and 2007 to 2012.48,49 The National Health Interview Survey (NHIS), an annual cross-sectional survey conducted since 1957, collects information on health conditions, health behaviors, and access to care among adults aged 18 and older through at-home interviews.50 The Behavioral Risk Factor Surveillance System (BRFSS) started in 1984 and is a telephone survey of adults aged 18 and older that monitors chronic conditions, health behaviors, and preventive service use.51 The Population Assessment of Tobacco and Health (PATH) study is a longitudinal study established in 2013 that follows youth aged 12 and older and adults across multiple waves (years) to assess tobacco use patterns, related health outcomes, and behaviors.52–54 However, the included study analyzed PATH data cross-sectionally. Supplementary Material B provides a detailed description of the surveys’ methods.
Risk of Bias (RoB) Assessment
Overall, the quality of the 22 included articles was either fair or good, with RoB scores ranging between 7 and 8 out of a total of 11 points. The most identified issues were participation rates of eligible people under 50% (or participation rate not disclosed) and a lack of adjustment of the statistical analyses for relevant covariates (Table 1 and Supplementary Table 3).
COPD Measurements Across Studies
Among the 22 included studies, six25–30 reported COPD prevalence based on spirometry values, all using NHANES data from 1988–1994, 2007–2010, or 2007–2012. COPD definitions followed either the Global Initiative for Chronic Obstructive Lung Disease (GOLD) criteria, defined as post-bronchodilator spirometry value of forced expiratory volume in one second (FEV1)/forced vital capacity (FVC) <0.70 ratio,55,56 or the American Thoracic Society (ATS) criteria, defined as spirometry values below the lower fifth percentile (LLN) of the FEV1/FVC ratio from the general population.57 In the retrieved studies, these criteria were applied to either pre-bronchodilator or post-bronchodilator values. One study26 reported prevalence using both the ATS and the GOLD definition, while another25 defined COPD as a forced expiratory volume in one second (FEV1) less than 65% of the predicted value. Of those six studies, two reported only overall COPD prevalence,25,28 one prevalence by severity level,26 and three reported both.27,29,30
Of these studies, Kurth et al (2019, RoB: Good) used NHANES 2007–2010 data and reported overall and by severity prevalence estimates based on spirometry (ATS criteria) and overall COPD from self-reported diagnosis of chronic bronchitis or emphysema30 Similarly, Cadham et al (2024, RoB: Good) used NHANES 2007–2012 data and applied the GOLD criteria to spirometry values, reporting overall and by severity prevalence, and overall COPD prevalence based on self-reported data.29
The remaining 16 studies31–46 reported COPD prevalence based on self-reported data, drawing from a mix of national surveys including NHIS, BRFSS, PATH, and NHANES. These studies used survey questions about whether a healthcare provider had ever diagnosed participants with chronic obstructive pulmonary disease (COPD), chronic bronchitis (CB), or emphysema (E). Question wording varied slightly, but structure was generally consistent. However, reporting timeframes differed across surveys. For example, NHIS included questions on both lifetime diagnosis (eg, “Have you ever been told…”) and recent diagnosis (eg, “During the past 12 months…”) Also, studies differed in which measure they reported34–40 BRFSS used a yes/no format to assess whether participants had ever been diagnosed with COPD, chronic bronchitis, or emphysema40–45 In the PATH study (Wave 1, 2013–2014) participants reported the presence of respiratory conditions using a checklist that included COPD, chronic bronchitis, emphysema, asthma, or other lung diseases.46 NHANES studies from 1988−199431 and 2007−201232 defined COPD based on a yes to the questions “Has a doctor ever told you that you have emphysema?” or “Do you still have chronic bronchitis?”, while a more recent study33 from 2015–2018 relied on a direct question asking “Have you ever been told that you have COPD?”.
Self-Reported COPD with Severity Classification
Among studies that used self-reported data, two studies of NHANES further characterized COPD severity by assessing lung function with spirometry. Diaz-Guzman et al (2011, RoB: Fair), using pre-bronchodilator values from 1988–1994, categorized participants with self-reported CB or E into obstructed, restricted, symptomatic with normal function, normal, or missing spirometry31 Tilert et al (2018, RoB: Good), during 2007–2012, defined COPD based on self-reported physician diagnosis and applied ATS criteria to identify airflow obstruction, reporting severity as no obstruction, mild, moderate or worse based on FEV1 % predicted.32
Results
Overall Prevalence of COPD
COPD prevalence was consistently higher when assessed by spirometry than with self-reported data. In US adults, estimates from NHANES 1988–2012 have generally ranged from 12.5%–13.8%,27,29 though prevalence was lower (1.6%) in a subpopulation of younger adults aged 20–50.28 Across the 4 studies (1988–2012)26,27,29,30 that reported prevalence by COPD severity levels, mild airflow obstruction (AO) was more prevalent (7.3%–16.6%), followed by moderate AO (4.4%–9.0%) and severe AO (0.7%–2.2%). One study27 also reported restrictive impairment (PRISm; FEV1/FVC ≥ 0.70 and FVC < 80% predicted) with prevalence estimates of 7.6% in 1988–1994 and 6.5% in 2007–2010 (Supplementary Tables 4–7).
In contrast to spirometry-based estimates, self-reported COPD prevalence was generally lower and varied across surveys. Results from studies utilizing NHIS data reported the highest prevalence, ranging from 3.0–7.2% (1997–2020).34–40 Estimates from BRFSS ranged from 6.0%–6.7% (2011–2021),40,41,43–45 NHANES from 4.3%–6.7% (1988–2012),29,31–33 and PATH Wave 1 reported 5.1% (2013–2014).46
A clear example of the differences in prevalence between spirometry and self-reported measures was observed from Kurth et al (2019, RoB: Good)30 Using NHANES 2007–2010, the author reported a COPD prevalence of 12.4% using spirometry values from adults 18–79 years, but of 3.5% when using self-reported data from adults 20–79 years.30 A similar pattern was observed in Cadham et al (2024, RoB: Good), using NHANES 2007–2012, the author reported a prevalence of 138% for spirometry and 5.9% for self-reported in a population of adults aged 20–79 years.29 Figure 2 shows overall COPD prevalence by survey type and assessment method (Supplementary Table 4).
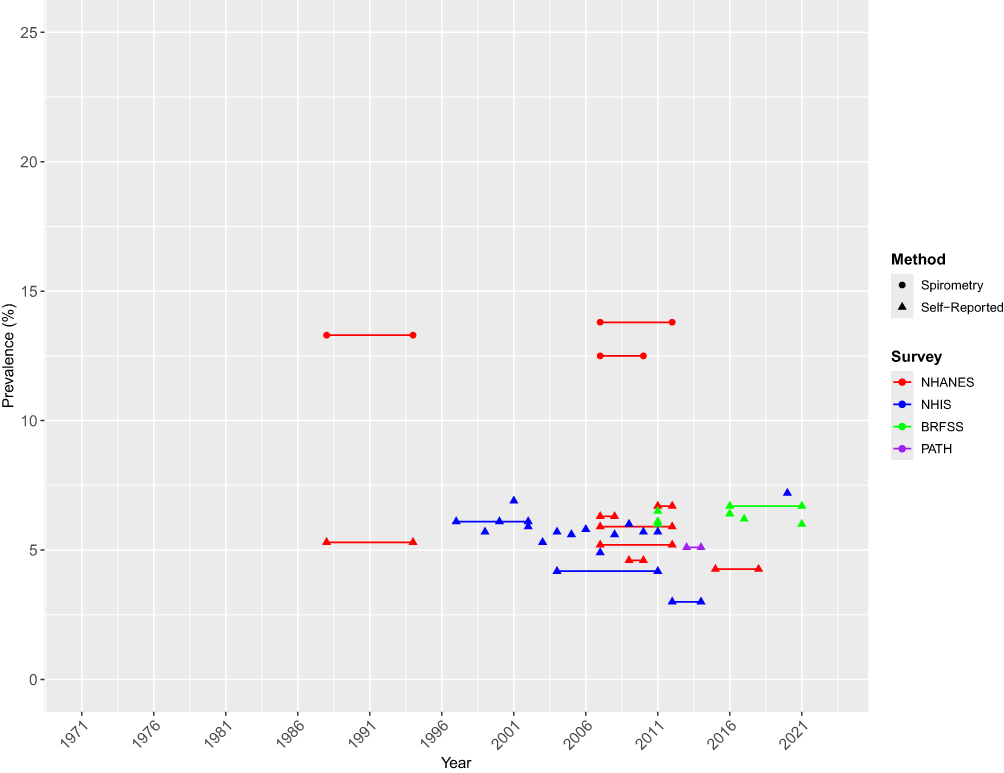 |
Figure 2 Overall Trends in COPD Prevalence. Points connected by a single line represent pooled estimates across two or more survey periods. |
COPD Prevalence by Smoking Status
Of the 22 included studies, 17 studies reported COPD prevalence among adults who smoke.25–27,29,30,32,35–39,41–43,45,46 Of these, 5 reported estimates based on spirometry,25–27,29,30 11 on self-reported data,32,35–39,41–43,45,46 and one on both methods.30 Figure 3 presents the COPD prevalence by smoking status, survey and assessment method (Supplementary Tables 4 and 6).
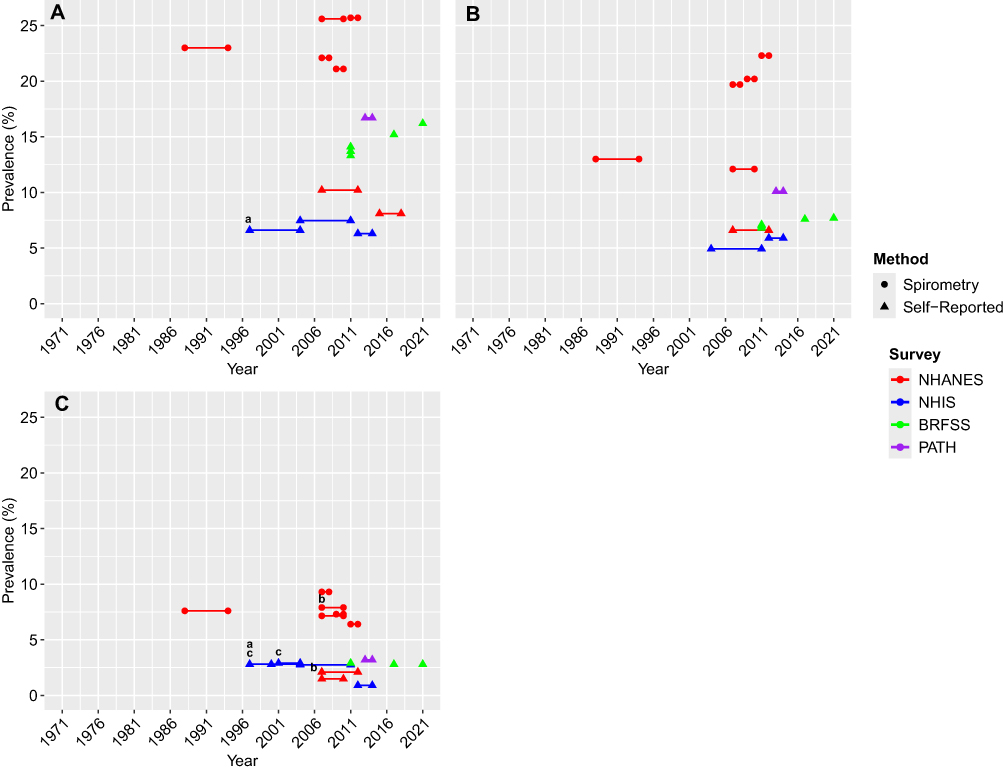 |
Figure 3 Trends in COPD Prevalence by Smoking Status. (A) Current smokers, (B) Former smokers, and (C) Never smokers. (a) adult workers; (b) ever-employed adults; and (c) nonsmokers. Points connected by a single line represent pooled estimates across two or more survey periods. |
Definitions of smoking status were generally consistent across national surveys (focused on cigarette use), with a broader range of combustible tobacco products included in the PATH study (cigarettes, traditional cigars, cigarillos, filtered cigars, pipe tobacco, hookah, snus pouches, moist snuff, chewing tobacco, and e-cigarettes). NHIS, BRFSS, and NHANES defined current smokers as individuals who had smoked at least 100 cigarettes in their lifetime and currently smoked every day or on some days; one study32 included a serum cotinine level of >10 ng/mL to classify as smoking. Former smokers were defined as those who had smoked at least 100 cigarettes but were not currently smoking. The PATH definition of current and former users was based on any past 30-day use and lifetime quantity or frequency of all listed tobacco products.46 Specifically, lifetime quantity refers to having smoked at least 100 cigarettes in one’s lifetime, whereas lifetime frequency refers to having ever used other tobacco products. Participants who reported using any product within the past 30 days were classified as current users (eg, exclusive past-30-day cigarette use). Those who had previously used tobacco products regularly but reported no use in the past 30 days were classified as former users Never smokers were typically defined as those who had never smoked or had smoked fewer than 100 cigarettes in their lifetime. PATH’s definition included individuals who had never regularly used any tobacco products (combustible and noncombustible) or had smoked fewer than 100 cigarettes in their lifetime (never or former experimental users).46 Six studies did not provide their smoking status definition.26,28,37,40,41,43
Overall COPD prevalence was highest among current smokers and the lowest among never smokers. Among studies that estimated prevalence using NHANES spirometry data from 1988–2012, prevalence ranged from 21.2%–25.7% among current smokers, 12.1%–22.3% among former smokers, and 6.4%–9.3% among never smokers.27,29
Across all smoking groups, spirometry prevalence was consistently higher for mild airflow obstruction (AO) compared to moderate or severe, with current smokers showing the highest prevalence across all severity levels (Supplementary Table 5).26,27,29,30 Among current smokers, prevalence of mild obstruction ranged from 8.8%–40.4%, moderate obstruction from 5.7%–24.0%, and severe obstruction from 0.7%–5.8%. Former smokers showed lower values, mild AO ranged from 8.8%–22.5%, moderate AO from 4.5%–9.4%, and severe AO 0.7%–1.8%, while never smokers had the lowest prevalence, with mild AO ranges of 3.4%–11.8%, moderate AO from 1.1%–3.9%, and severe AO from 0.3%–0.8% (severe AO). The prevalence of restrictive impairment was 8.3%, 6.0%, and 8.2% among current, former, and never smokers, respectively, during 1988–1994, and 7.2%, 6.1%, and 6.5%, respectively, in 2007–2010.27
Self-reported COPD prevalence estimates among current smokers ranged from 6.3%–7.5% in NHIS (1997–2014),35,37,38 13.3%–16.2% in BRFSS (2011–2021),41–43,45 10.2% in NHANES (2007–2012)32 and 16.7% in PATH (2011–2021).46 Among former smokers, estimates ranged from 4.4%–5.9% in NHIS,35,37,38 5.1%–7.7% in BRFSS,41–43,45 6.6% in NHANES,32 and 10.1% in PATH.46 Among never smokers, reported prevalence ranged from 0.9%–2.9% in NHIS,35–38 2.8%–2.9% in BRFSS,41–43,45 2.1% in NHANES,32 and 3.2% in PATH.46 Notably, PATH reported the highest prevalence across all smoking categories.46
Kurth et al (2019, RoB: Good) using NHANES 2007–2010, reported COPD prevalence among never and ever smokers using both spirometry and self-reported diagnosis. For never smokers, prevalence was 72% using spirometry and 15% using self-report. Among ever smokers, prevalence was 18.5% using spirometry and 5.6% using self-report.30
Bang et al (1993, RoB: Good), using NHANES 1971–1975 spirometry data (FEV1 < 65% predicted) in a subpopulation of Black adults, classified participants as current, former, or never smokers, but reported combined estimates for current and former smokers. Among males, COPD prevalence was higher in current and former smokers (54%) than in never smokers (0%), whereas among females, prevalence was higher in never smokers (84%) than in current and former smokers (5.0%).25 Another study by Steinberg et al (2025, RoB: Fair), using NHIS 2020, classified participants as never or ever smokers based on self-reported smoking history COPD was higher among ever smokers than never smokers, with females showing higher prevalence than males (32% vs 1.7% for never smokers; 15.9% vs. 11.5% for ever smokers).39
COPD Prevalence by Sex
COPD prevalence by sex was assessed in 16 studies.25–30,32,35,37–41,43,45,46 Of these, 5 used spirometry,25–29 10 used self-report,32,35,37–41,43,45,46 and one used both methods.30 Figure 4 shows COPD prevalence by sex, survey type, and assessment method (Supplementary Tables 4 and 7).
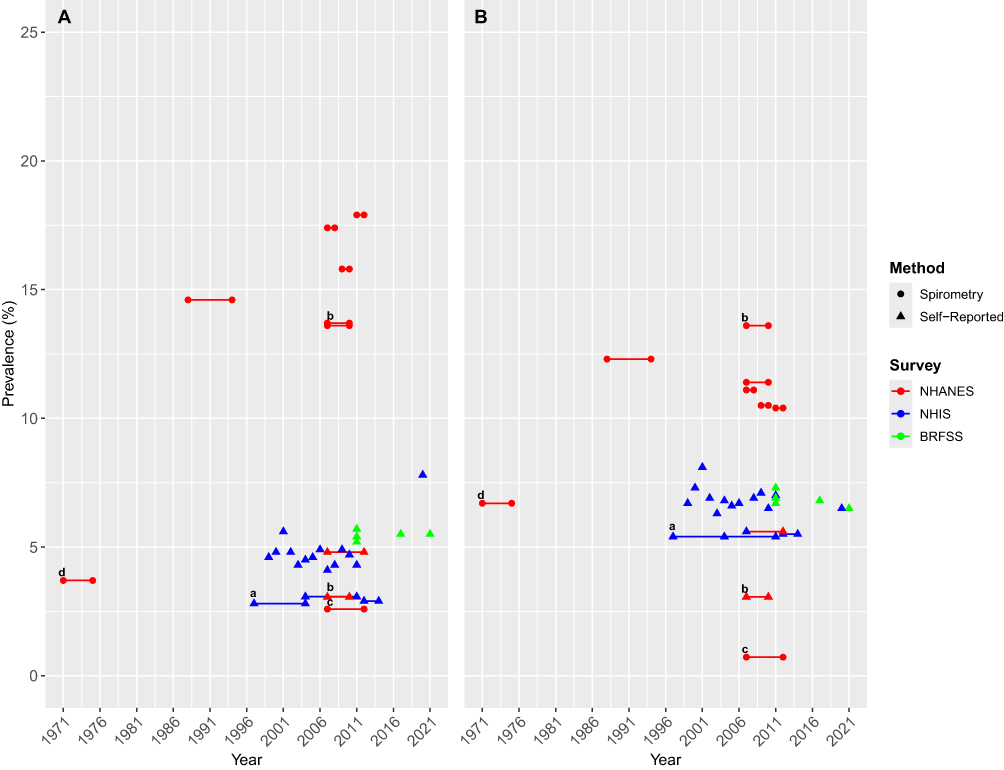 |
Figure 4 Trends in COPD Prevalence by Sex. Panels represent sex groups: (A) Males and (B) Females. (a) adult workers; (b) ever-employed adults; (c) adults aged 20–50 years; and (d) Black individuals (FEV1 < 65% predicted). Points connected by a single line represent pooled estimates across two or more survey periods. |
COPD prevalence based on spirometry was higher in males than females. Using NHANES data from 1988–2012 in ages 20–79 years, prevalence ranged from 17.9%–23.7% in males compared with 10.4%–12.3% in females.27,29 In a subpopulation of younger adults aged 20–50 years from 2007–2012, Wang et al (2023, RoB: Fair), using GOLD criteria, reported a lower prevalence of 26% in males and 072% in females.28 Bang et al (1993, RoB: Good), analyzing spirometry data (FEV1 < 65% pred) in a subpopulation of Black adults, reported a COPD prevalence of 3.7% for males and 6.7% for females.25
Across both sexes, males showed the highest prevalence across all COPD spirometry severity levels using NHANES 1988–2012 data (Supplementary Table 5).26,27,29,30 Males’ estimates ranged from 8.6%–24.0% for mild obstruction, from 4.5%–9.4% for moderate obstruction, and from 0.5%–3.4% for severe obstruction, while among females, prevalence ranged from 4.4%–16.3%, 4.2%–8.6%, and 0.7%–2.7%, across severity levels, respectively. The prevalence of restrictive impairment was 6.5% in males and 8.5% in females during 1988–1994, and 6.9% in males and 6.1% in females during 2007–2010.27
In contrast, self-reported data showed higher prevalence in females than males. Among males, NHIS estimates ranged from 2.8%–7.8% (1997–2020)35,37–40 while BRFSS estimates ranged from 5.2%–6.5% (2011–2021).40,41,43,45 NHANES reported a prevalence of 4.8% in 2007−201232 and PATH Wave 1 (2013–2014) of 6.6%.46 Among females, NHIS (1997–2014) estimates ranged from 3.0%–8.1%,35,37–40 BRFSS (2011–2021) ranged from 6.5%–7.3%,40,41,43,45 NHANES reported 5.6%,32 and PATH reported the highest estimate at 8.5%.46
Kurth et al (2019, RoB: Good) compared both spirometry and self-reported measures in NHANES 2007–2010 Prevalence using spirometry was 13.6% in males and 11.3% in females, while self-reported prevalence was 3.1% in males and 3.9% in females.30
COPD Prevalence by Race and Ethnicity
Racial/ethnic patterns in COPD prevalence were reported in 14 studies.25–27,29,30,32,35,37–39,41,43,45,46 Because of the limited number of observations among populations that were not Black or White, as well as overlap with categories (eg, Asians being classified as Asian and Asian/Pacific Islander), for this study we categorized the prevalence estimates in 4 categories: 1) non-Hispanic White; 2) non-Hispanic Black; 3) Hispanics (comprised of Hispanic, Mexican-American, and Other, Hispanic); and 4) Other (comprised of Other, Asian, Native Hawaiian/Pacific Islander, American Indian/Alaskan Native, Other, non-Hispanic, Other/Multiracial, and Asian/Pacific Islander) Figure 5 presents COPD prevalence by race and ethnicity, survey type, and assessment method (Supplementary Tables 4 and 7).
 |
Figure 5 Trends in COPD Prevalence by Race and Ethnicity. (A) Non-Hispanic Whites, (B) Non-Hispanic Blacks, (C) Hispanic individuals, and (D) Other racial/ethnic groups. (a) adult workers; (b) ever-employed adults; and (c) Black individuals (FEV1 < 65% predicted). In panel D (Other racial/ethnic groups), numeric labels identify specific racial/ethnic subgroups: 1 = American Indian/Alaska Native (AI/AN), 2 = Asian/Pacific Islander (Asian/PI), 3 = Asian, 4 = Native Hawaiian/Pacific Islander (NH Native HI/PI), 5 = American Indian (AI), and 6 = Asian Native. Points connected by a single line represent pooled estimates across two or more survey periods. |
Four studies using spirometry data from 1988−201225–27,29 found that non-Hispanic Whites showed the highest prevalence of COPD across all racial and ethnic groups, ranging from 13.8%–17.5%. Estimates for non-Hispanic Blacks ranged from 9.3%–11.9%, for Hispanics from 3.8%–8.3%, for the “Other” category from 6.7%–11.7%. In earlier NHANES data (1971–1976) focused on Black adults and using FEV1 < 65% predicted COPD prevalence was estimated at 5.4%.25
Among racial and ethnic groups, non-Hispanic Whites showed the highest prevalence across all spirometry severity levels in NHANES 1988–2012 (Supplementary Table 5).25–27,29 Non-Hispanic White adults’ mild severity ranged from 8.2%–21.9%, moderate from 4.7%–9.8%, and severe from 0.6%–3.5%. For non-Hispanic Black adults, prevalence of mild severity ranged from 1.5%–16.2%, moderate from 4.2%–8.1%, and severe from 0.9%–3.0%. Among Hispanic adults, mild severity ranged from 2.2–12.7%, moderate from 1.2%–4.0%, and severe from 0.1%–0.8%. Adults classified as “Other” reported mild COPD prevalence from 2.1%–5.2%, moderate from 3.3%–5.8%, and severe from 0.7%–1.5%. The prevalence of restrictive impairment during 1988–1994 was 6.5% among non-Hispanic White adults, 9.5% among non-Hispanic Black adults, 6.7% among Mexican Americans, and 17.7% among adults classified as “Other”. In 2007–2020, prevalence was 5.2%, 7.3%, 6.2%, and 15.2%, respectively.27
Across 9 self-reported studies,32,35,37,38,40,41,43,45,46 the “Other” category reported the highest COPD prevalence, followed by non-Hispanic Whites, non-Hispanic Blacks, and Hispanics. Prevalence for non-Hispanic Whites ranged from 3.8%–7.5% in NHIS (1997–2014),35,37,38,40 6.3%–6.9% in BRFSS (2011–2021),40,41,43,45 5.9% in NHANES (2007–2012),32 and 8.5% in PATH Wave 1 (2013–2014).46 Among non-Hispanic Blacks, estimates ranged from 2.1%–6.3% in NHIS,35,37,38,40 6.1%–6.6% in BRFSS,40,41,43,45 4.6% in NHANES,32 and 6.9% in PATH.46 PATH reported the highest prevalence for both racial/ethnic groups.46
Among the “Other” category, BRFSS reported the highest prevalence estimates among all surveys, ranging from 1.9%–11.2% (2011–2021),40,41,43,45 with the lowest prevalence from BRFSS observed from non-Hispanic Asian or Pacific Islander adults (1.9%).43 NHIS estimates ranged from 0.7%–4.1% (1997–2014),35,37,38,40 with the lowest prevalence reported also from non-Hispanic Asians (0.7% in 2012–14).39 PATH reported a COPD prevalence across adults classified as “Other” of 4.4%.46
Among Hispanics, reported prevalence ranged from 0.9%–4.3% in NHIS.38,40 The lowest estimate (0.9%) was reported by Ward et al (2017, RoB: Good) in adults aged 18 and older, while the highest (43%) was reported by Ford et al (2013, RoB: Good) in adults aged 25 and older between 1999 and 201138,40 All other NHIS estimates ranged from 31%–4.3%.40 BRFSS estimates ranged from 3.6%–4.1% (2011–2021),40,41,43,45 NHANES reported 2.0%,32 and PATH reported the highest prevalence at 4.5%.46
Kurth et al (2019, RoB: Good) using NHANES 2007–2010, compared COPD prevalence based on spirometry and self-reported measures. The study found higher prevalence from non-Hispanic Whites across all race/ethnicity groups, regardless of the method of COPD assessment Using spirometry, prevalence was 13.6% among non-Hispanic Whites, 11.2% among non-Hispanic Blacks, and ~8.0% among Hispanics. Using self-report, prevalence was 3.9% among non-Hispanic Whites, 3.5% among non-Hispanic Blacks, ~2.0% among Hispanics.30
Discussion
Results from this systematic review reveal that COPD prevalence in the US varies across national surveys and is influenced by diagnostic criteria and population characteristics. Studies using spirometry measures consistently found higher COPD prevalence than those relying on self-reported data. These findings align with previous research showing that self-reported data may underestimate COPD burden due to limited healthcare access, underdiagnosis, and variability in symptom recognition.58–60 This suggests that reliance on self-reported diagnosis likely captures only a subset of individuals with airflow limitation in the US, underscoring the need for improved diagnostic approaches for population assessment. Across studies reporting COPD prevalence by severity level, mild and moderate COPD cases were more frequently identified than severe ones, reflecting the large proportion of early-stage disease in the population.
Smoking was strongly associated with COPD in both self-reported and spirometry-based methods. In line with previous national public health reports,61–64 we found that current smokers had the highest prevalence, followed by former and never smokers. This is consistent with evidence that COPD risk increases with greater smoking exposure.2 Nevertheless, our findings also reinforce the need to account for COPD risk in never smokers, among whom prevalence ranged from 0.9% to 3.2% based on self-reported diagnosis and from 6.4% to 7.9% using spirometry data. The literature has shown that between 25 and 45% of COPD cases globally occur among non-smokers, pointing to the need to consider the importance of non-smoking risk factors.65,66 Occupational exposures to dust, chemicals, and fumes, as well as environmental pollutants and biomass fuel use, contribute substantially to disease risk.66,67 In addition, early-life respiratory infections may further increase susceptibility.
We also identified that COPD prevalence was higher among males in studies using spirometry values but higher among females when using self-reported data. Similar COPD prevalence results from spirometry being higher in males and self-reporting data producing higher estimates from females has been reported by other US population’s studies.68–70 These differences likely reflect a combination of biological susceptibility, diagnostic bias and healthcare-seeking behavior. Prior studies suggest that females may experience more severe symptoms at lower lung function levels but are less likely to receive a formal COPD diagnosis.71–73 An exception was observed in a study of Black adults, where Bang et al (1993) (NHANES 1971–1975, FEV1 < 65% predicted) reported higher prevalence among females than males.25 These findings underscore how both biological differences and diagnostic practices contribute to observed sex disparities in COPD prevalence and highlight the need for more accurate approaches to COPD diagnosis and management.73,74
When stratified by race and ethnicity, non-Hispanic White adults consistently had the highest COPD prevalence in studies using spirometry data, while self-reported diagnosis led to higher prevalence in the “Other” (included American Indian/Alaska Native, American Indian, Asian, Asian Native, and Native Hawaiian/Pacific Islander) racial/ethnic category. The elevated prevalence observed in this aggregated group likely reflects the high burden among American Indian/Alaska Native adults, who showed the highest prevalence (~11%) within this category. Prior research has noted that aggregation of small populations can mask important differences in how the disease affects each group.75 For example, studies have shown that American Indian and Alaska Native adults experience some of the highest rates of COPD-related mortality in the US,76,77 yet these trends may be harder to see in national data that does not break down results by specific subgroups.
Of central importance, the results from this review demonstrate that the criteria and method used to diagnose COPD shape our understanding of prevalence patterns and disparities. While national surveillance systems provide essential information, differences in survey design, question wording, and diagnostic definitions introduce variability that must be considered when interpreting and comparing estimates.11,78,79 However, this variability alone does not fully explain observed patterns. Structural determinants, including socioeconomic conditions, differential exposure profiles, and access to healthcare, play a critical role in shaping both true disease burden and its detection.80 For example, limited access to healthcare and diagnostic testing such as spirometry may contribute to underdiagnosis across vulnerable populations.59,80,81 Together, these factors underscore that observed differences in COPD prevalence likely reflect not only methodological variation but also inequities in diagnosis.59,81
This systematic review provides the first comprehensive synthesis of COPD prevalence estimates specific to the US population, addressing a gap in other global and regional analyses. Prior systematic reviews and meta-analyses have primarily focused on international data. For example, Halbert et al year (2006)82 found a pooled COPD prevalence of 7.6% using data from US and non-US studies. Olortegui-Rodriguez et al (2022)83 estimated a pooled prevalence of 8.9% in Latin America and the Caribbean, and Jarhyan et al (2022)84 reported 11.1% in South Asia. In contrast, our review provides US-specific estimates of overall COPD prevalence and reports on the differences by smoking behavior, sex, and race/ethnicity, contributing to the limited literature directly comparing estimates across multiple national surveys.69,82
This review has several limitations. First, COPD diagnostic criteria and smoking status definitions varied across studies and survey years which limited comparability. An important source of potential misclassification is the use of pre- rather than post-bronchodilator spirometry. Clinical guidelines recommend post-bronchodilator spirometry to confirm persistent airflow limitation, as reliance on pre-bronchodilator values may overestimate COPD prevalence.24,56,85 For example, many studies used pre-bronchodilator spirometry, which may overestimate COPD prevalence compared to post-bronchodilator criteria recommended by GOLD and ATS.56,85 A study85 showed that COPD prevalence was 20.9% when defined using pre-bronchodilator data, compared to 14.0% using post-bronchodilator values, about one-third higher estimate. Other studies have reported similar overestimations of up to 30% when relying solely on pre-bronchodilator values.12 Definitions of smoking status also vary slightly across national surveys, with some defining current smokers as individuals who have smoked at least 100 cigarettes in their lifetime and currently smoke every day or on some days (NHIS, NHANES, BRFSS), whereas PATH defines current use based on any past 30-day tobacco use across multiple products.25–27,29,30,32,35–39,41–43,45,46 Such differences in how smoking status is defined and assessed may contribute to variations in the estimated prevalence of current and former smokers.86–88 Moreover, only NHANES collected spirometry data, which restricts our ability to directly compare severity estimates across national surveys. Implementing spirometry in large population surveys is challenging, as it requires trained and certified personnel, and centralized quality control, which can make such efforts resource-intensive and costly.89–91 Second, self-reported COPD diagnosis is subject to recall and reporting bias and may be affected by healthcare access or awareness. Third, differences in question phrasing across surveys may also contribute to variation in prevalence estimates. Fourth, limited sample sizes for Asian American, Native Hawaiian, and American Indian populations led to their aggregation into the “Other” category, which restricts meaningful subgroup analysis and may obscure disparities. Fifth, the overall RoB quality of the studies varied particularly due to low participation rates or no disclosed information on participation rates, and limited covariate adjustment, which may affect the prevalence estimates. We did not conduct a meta-analysis as there was substantial heterogeneity in study designs, temporality of the results, and outcome definitions that prevented statistical pooling, limiting our ability to generate summary estimates. Lastly, although evaluating causality was not the aim of our review, the cross-sectional design, and variable reporting timeframe of the included studies limits the ability to assess temporal relationships or disease progression.
Strengthening COPD surveillance in the US is a priority for future research. A critical gap is the limited inclusion of objective measures of airflow obstruction, with spirometry available only in NHANES – and there only up to 2012.29,92 This restricts accurate estimation of disease burden and limits early detection.1,59 Expanding the use of spirometry or other validated tools93 in nationally representative surveys would improve assessment of disease severity, strengthen surveillance, and inform more effective clinical and public health strategies.
Conclusion
Overall, the findings from our systematic review show that the way we measure and diagnose COPD shapes both what we see and who we see. Because overall estimates based on self-reported diagnosis were lower than those based on spirometry, reliance on self-reported COPD alone is likely to underestimate the true burden of disease and should be interpreted with caution when used for surveillance or population-level assessment. National surveys need consistent diagnostic criteria and should report results by population subgroups so that important patterns are not missed. As cigarette smoking declines, the patterns of COPD prevalence may change. Environmental pollution, workplace exposures, and even lung problems earlier in life are becoming more important, especially for groups that have often been overlooked in research. Closing these gaps will require both clinical and public health efforts. Clinicians can improve early detection by looking beyond self-reported data and using lung function tests for people at risk, while public health programs can focus on proven measures such as cleaner air, safer workplaces, and better access to care.94–96 Combining better measurement with early detection and prevention offers the best chance to lower COPD rates and the persistent differences in how COPD affects different groups.
Abbreviations
COPD, Chronic Obstructive Pulmonary Disease; NHANES, National Health and Nutrition Examination Survey; NHIS, National Health Interview Survey; BRFSS, Behavioral Risk Factor Surveillance System; PATH, Population Assessment of Tobacco and Health; GOLD, Global Initiative for Chronic Obstructive Lung Disease; ATS, American Thoracic Society; FVC, forced vital capacity; % pred, percent predicted; FEV1, forced expiratory volume in one second.
Data Sharing Statement
All the reference from the data included in this study are reported in the article or in the accompany online Supplementary Materials.
Ethics Approval and Informed Consent
This study is a systematic review of existing literature on public health and healthcare resources. No subjects were enrolled in this study. Patients or members of the public were not involved in the development of the research question or choice of outcome measures.
Author Contributions
All authors made a significant contribution to the work reported, whether that is in the conception, study design, execution, acquisition of data, analysis and interpretation, or in all these areas; took part in drafting, revising or critically reviewing the article; gave final approval of the version to be published; have agreed on the journal to which the article has been submitted; and agree to be accountable for all aspects of the work.
Funding
Research reported in this publication was supported by the National Cancer Institute of the National Institutes of Health under Award Number K01CA260378 and U54CA229974.
Disclosure
Dr Luz Sánchez-Romero reports grants from NIH-National Cancer Institute-FDA, during the conduct of the study. The author(s) report no conflicts of interest in this work.
References
1. Global Initiative for Chronic Obstructive Lung Disease (GOLD). Global strategy for the diagnosis, management, and prevention of chronic obstructive pulmonary disease: 2026 report. 2026. Available from: https://goldcopd.org/wp-content/uploads/2026/01/GOLD-REPORT-2026-v1.3-8Dec2025_WMV2.pdf.
2. Centers for Disease Control and Prevention (CDC). Disease of the week: COPD. Atlanta (GA): Centers for Disease Control and Prevention; 2022 Oct 7. Available from: https://www.cdc.gov/copd/index.html.
3. Centers for Disease Control and Prevention (CDC). Chronic obstructive pulmonary disease (COPD): indicator definitions & supporting information. Atlanta (GA): U.S. Department of Health and Human Services; 2024 Jun 3. Available from: https://www.cdc.gov/cdi/indicator-definitions/chronic-obstructive-pulmonary-disease.html.
4. Sin DD, Anthonisen NR, Soriano JB, Agusti AG. Mortality in COPD: role of comorbidities. Eur Respir J. 2006;28(6):1245–19. PMID: 17138679. doi:10.1183/09031936.00133805.
5. May SM, Li JT. Burden of chronic obstructive pulmonary disease: healthcare costs and beyond. Allergy Asthma Proc. 2015;36(1):4–10. PMID: 25562549; PMCID: PMC5554331. doi:10.2500/aap.2015.36.3812.
6. Zafari Z, Li S, Eakin MN, Bellanger M, Reed RM. Projecting long-term health and economic burden of COPD in the United States. Chest. 2021;159(4):1400–1410.
7. American Lung Association (ALA). COPD trends brief: prevalence. Chicago (IL): American Lung Association. 2023. Available from: https://www.lung.org/research/trends-in-lung-disease/copd-trends-brief/copd-prevalence.
8. Kamal R, Srivastava AK, Kesavachandran CN. Meta-analysis approach to study the prevalence of chronic obstructive pulmonary disease among current, former and non-smokers. Toxicol Rep. 2015;2:1064–1074. PMID: 28962448; PMCID: PMC5598418. doi:10.1016/j.toxrep.2015.07.013
9. Yang IA, Jenkins CR, Salvi SS. Chronic obstructive pulmonary disease in never-smokers: risk factors, pathogenesis, and implications for prevention and treatment. Lancet Respir Med. 2022;10(5):497–511. PMID: 35427530. doi:10.1016/S2213-2600(21)00506-3.
10. Syamlal G, Doney B, Mazurek JM; Centers for Disease Control and Prevention. Chronic Obstructive Pulmonary Disease Prevalence Among Adults Who Have Never Smoked, by Industry and Occupation — united States, 2013–2017. MMWR. 2019;68(13):303–308. doi:10.15585/mmwr.mm6813a2
11. Ekerljung L, Rönmark E, Lötvall J, Wennergren G, Torén K, Lundbäck B. Questionnaire layout and wording influence prevalence and risk estimates of respiratory symptoms in a population cohort. Clin Respir J. 2013;7(1):53–63. PMID: 22243692; PMCID: PMC3654566. doi:10.1111/j.1752-699X.2012.00281.x.
12. Vollmer WM, Gíslason Þ, Burney P, et al. Comparison of spirometry criteria for the diagnosis of COPD: results from the BOLD study. Eur Respir J. 2009;34(3):588–597. PMID: 19460786; PMCID: PMC3334278. doi:10.1183/09031936.00164608.
13. Campbell M, McKenzie JE, Sowden A, et al. Synthesis without meta-analysis (SWiM) in systematic reviews: reporting guideline. BMJ. 2020:l6890. doi:10.1136/bmj.l6890
14. Valentin M, Obeng-Nyarkoh P-I, María Sánchez-Romero L. Trends of COPD Prevalence in the US Population: a Systematic Review of Nationally Representative Surveys. 2024 Available from: https://www.crd.york.ac.uk/PROSPERO/view/CRD42023399386.
15. Zotero. Your personal research assistant. Available from: https://www.zotero.org/.
16. RefWorks. Reference management software. Available from: https://refworks.proquest.com/.
17. Ouzzani M, Hammady H, Fedorowicz Z, Elmagarmid A. Rayyan—a web and mobile app for systematic reviews. Syst Rev. 2016;5(1):210. doi:10.1186/s13643-016-0384-4
18. Kellermeyer L, Harnke B, Knight S. Covidence and Rayyan. J Med Libr Assoc. 2018;106(4):580–583. PMCID: PMC6148615. doi:10.5195/jmla.2018.513.
19. National Institutes of Health (NIH). Quality assessment tool for observational cohort and cross-sectional studies. Bethesda (MD): National Heart, Lung, and Blood Institute; 2014. Available from: https://www.nhlbi.nih.gov/health-pro/guidelines/in-develop/cardiovascular-risk-reduction/tools/cohort.
20. Mohseni Homagarani Y, Adlparvar K, Teimuri S, Tarrahi MJ, Nilchian F. The effect of diabetes mellitus on oral health-related quality of life: a systematic review and meta-analysis study. Front Public Health. 2023;11:1112008. PMID: 36908413; PMCID: PMC9998896. doi:10.3389/fpubh.2023.1112008
21. Awad MKA, Elsahhar A, Alwakeel M, et al. Admission neutrophil-to-lymphocyte ratio to predict mortality in burn patients: a meta-analysis. Intensive Care Med Exp. 2024;12(1):86. PMID: 39352440; PMCID: PMC11445202. doi:10.1186/s40635-024-00668-x.
22. Dutra TP, Sacramento CM, Nagay BE, et al. Do smokers have a different gingival crevicular fluid cytokine/chemokine profile than nonsmokers in clinically healthy periodontal sites? A systematic review and meta-analysis. Clin Oral Investig. 2022;26(2):1183–1197. PMID: 34812957. doi:10.1007/s00784-021-04267-y.
23. R Core Team. R Foundation for Statistical Computing R: a language and environment for statistical computing. Vienna (AT): 2024. Available from: https://www.R-project.org/.
24. Singh D, Stockley R, Anzueto A, et al. GOLD Science Committee recommendations for the use of pre- and post-bronchodilator spirometry for the diagnosis of COPD. Eur Respir J. 2025;65(2):2401603. PMID: 39638416; PMCID: PMC11799884. doi:10.1183/13993003.01603-2024.
25. Bang KM. Prevalence of Chronic Obstructive Pulmonary Disease in Blacks. J Natl Med Assoc. 1993;85(1):51–55.
26. Doney B, Hnizdo E, Dillon CF, et al. Prevalence of Airflow Obstruction in U.S. Adults Aged 40–79 Years: NHANES Data 1988–1994 and 2007–2010. COPD. 2015;12(4):355–365. doi:10.3109/15412555.2014.948998
27. Ford ES, Mannino DM, Wheaton AG, Giles WH, Presley-Cantrell L, Croft JB. Trends in the prevalence of obstructive and restrictive lung function among adults in the United States: findings from the National Health and Nutrition Examination surveys from 1988–1994 to 2007–2010. Chest. 2013;143(5):1395–1406. PMID: 23715520; PMCID: PMC4563801. doi:10.1378/chest.12-1135.
28. Wang Z, Li Y, Lin J, et al. Prevalence, risk factors, and mortality of COPD in young people in the USA: results from a population-based retrospective cohort. BMJ Open Respir Res. 2023;10(1):e001550. PMID: 37451700; PMCID: PMC10351298. doi:10.1136/bmjresp-2022-001550.
29. Cadham CJ, Oh H, Han MK, et al. The prevalence and mortality risks of PRISm and COPD in the United States from NHANES 2007–2012. Respir Res. 2024;25(1):208. doi:10.1186/s12931-024-02841-y
30. Kurth L, Doney B, Halldin C, Hale J, Frenk SM. Airflow obstruction among ever-employed U.S. adults aged 18–79 years by industry and occupation: NHANES 2007–2008 to 2011–2012. Am J Ind Med. 2019;62(1):30–42. PMID: 30520118; PMCID: PMC6487473. doi:10.1002/ajim.22930.
31. Diaz-Guzman E, Khosravi M, Mannino DM. Asthma, chronic obstructive pulmonary disease, and mortality in the U.S. population. COPD. 2011;8(6):400–407. PMID: 22149399. doi:10.3109/15412555.2011.611200.
32. Tilert T, Paulose-Ram R, Howard D, Butler J, Lee S, Wang MQ. Prevalence and factors associated with self-reported chronic obstructive pulmonary disease among adults aged 40–79: the National Health and Nutrition Examination Survey (NHANES) 2007–2012. EC Pulmonol Respir Med. 2018;7(9):650–662. PMID: 30294723; PMCID: PMC6169793.
33. Dirisanala S, Laller S, Ganti N, et al. E-cigarette use and prevalence of lung diseases among the U.S. population: a NHANES survey. J Investig Med. 2023;71(6):613–622. PMID: 37052242. doi:10.1177/10815589231167357.
34. Schiller JS, Ni H. Cigarette smoking and smoking cessation among persons with chronic obstructive pulmonary disease. Am J Health Promot. 2006;20(5):319–323. doi:10.4278/0890-1171-20.5.319
35. Bang KM, Syamlal G, Mazurek JM. Prevalence of chronic obstructive pulmonary disease in the U.S. working population: an analysis of data from the 1997–2004 National Health Interview Survey. COPD. 2009;6(5):380–387. PMID: 19863367. doi:10.1080/15412550903140899.
36. Bang KM, Syamlal G, Mazurek JM, Wassell JT. Chronic obstructive pulmonary disease prevalence among nonsmokers by occupation in the United States. J Occup Environ Med. 2013;55(9):1021–1026. PMID: 23969499. doi:10.1097/JOM.0b013e31829baa97.
37. Doney B, Hnizdo E, Syamlal G, et al. Prevalence of chronic obstructive pulmonary disease among US working adults aged 40 to 70 years. National Health Interview Survey data 2004 to 2011. J Occup Environ Med. 2014;56(10):1088–1093. PMID: 25285832; PMCID: PMC4555867. doi:10.1097/JOM.0000000000000232.
38. Ward BW, Nugent CN, Blumberg SJ, Vahratian A. Measuring the Prevalence of Diagnosed Chronic Obstructive Pulmonary Disease in the United States Using Data From the 2012–2014 National Health Interview Survey. Public Health Rep. 2017;132(2):149–156. PMID: 28135423; PMCID: PMC5349479. doi:10.1177/0033354916688197.
39. Steinberg AW, Ozga JE, Tang Z, Stanton CA, Sargent JD, Paulin LM. Gender, tobacco and chronic obstructive pulmonary disease: analysis of the 2020 National Health Interview Survey. BMJ Open Respir Res. 2025;12(1):e002462. PMID: 40340913; PMCID: PMC12067816. doi:10.1136/bmjresp-2024-002462.
40. Ford ES, Croft JB, Mannino DM, Wheaton AG, Zhang X, Giles WH. COPD surveillance--United States, 1999–2011. Chest. 2013;144(1):284–305. PMID: 23619732; PMCID: PMC3707177. doi:10.1378/chest.13-0809.
41. Centers for Disease Control and Prevention (CDC). Chronic obstructive pulmonary disease among adults--United States, 2011. MMWR Morb Mortal Wkly Rep. 2012;61(46):938–943. PMID: 23169314.
42. Cunningham TJ, Ford ES, Rolle IV, Wheaton AG, Croft JB. Associations of Self-Reported Cigarette Smoking with Chronic Obstructive Pulmonary Disease and Co-Morbid Chronic Conditions in the United States. COPD. 2015;12(3):276–286. PMID: 25207639; PMCID: PMC4454614. doi:10.3109/15412555.2014.949001.
43. Liu Y, Carlson SA, Watson KB, Xu F, Greenlund KJ. Trends in the Prevalence of Chronic Obstructive Pulmonary Disease Among Adults Aged ≥18 Years - United States, 2011–2021. MMWR Morb Mortal Wkly Rep. 2023;72(46):1250–1256. doi:10.15585/mmwr.mm7246a1
44. Liu Y, Wheaton AG, Murphy LB, Xu F, Croft JB, Greenlund KJ. Chronic Obstructive Pulmonary Disease and Arthritis Among US Adults, 2016. Prev Chronic Dis. 2019. PMID: 31322106; PMCID: PMC6716415. doi:10.5888/pcd16.190035
45. Wheaton AG, Liu Y, Croft JB, et al. Chronic Obstructive Pulmonary Disease and Smoking Status - United States, 2017. MMWR Morb Mortal Wkly Rep. 2019;68(24):533–538. PMID: 31220055; PMCID: PMC6586372. doi:10.15585/mmwr.mm6824a1.
46. Paulin LM, Halenar MJ, Edwards KC, et al. Association of tobacco product use with chronic obstructive pulmonary disease (COPD) prevalence and incidence in Waves 1 through 5 (2013–2019) of the Population Assessment of Tobacco and Health (PATH) Study. Respir Res. 2022;23(1):273. Erratum in: Respir Res. 2025 Mar 8;26(1):93. doi: 10.1186/s12931-025-03166-0. PMID: 36183112; PMCID: PMC9526897. doi:10.1186/s12931-022-02197-1.
47. Page MJ, McKenzie JE, Bossuyt PM, et al. The PRISMA 2020 statement: an updated guideline for reporting systematic reviews. BMJ. 2021;372:n71. doi:10.1136/bmj.n71
48. Zipf G, Chiappa M, Porter KS, Ostchega Y, Lewis BG, Dostal J. National health and nutrition examination survey: plan and operations, 1999–2010. Vital Health Stat. 2013;56:1–37. PMID: 25078429.
49. Plan and operation of the Third National Health and Nutrition Examination Survey, 1988–1994. Series 1: programs and collection procedures. Vital Health Stat. 1994;32:1–407. PMID: 7975354.
50. National Center for Health Statistics (US), editor. National Health Interview Survey: research for the 1995–2004 redesign. Hyattsville (MD): U.S. Department of Health and Human Services, Centers for Disease Control and Prevention, National Center for Health Statistics; 1999 Jul. Available from: https://stacks.cdc.gov/view/cdc/11305.
51. Centers for Disease Control and Prevention (CDC). Methodologic changes in the Behavioral Risk Factor Surveillance System in 2011 and potential effects on prevalence estimates. MMWR Morb Mortal Wkly Rep. 2012;61(22):410–413.
52. Hyland A, Ambrose BK, Conway KP, et al. Design and methods of the Population Assessment of Tobacco and Health (PATH) Study. Tob Control. 2017;26(4):371–378. PMID: 27507901; PMCID: PMC5299069. 43. doi:10.1136/tobaccocontrol-2016-052934.
53. Tourangeau R, Yan T, Sun H, Hyland A, Stanton CA. Population Assessment of Tobacco and Health (PATH) reliability and validity study: selected reliability and validity estimates. Tob Control. 2019;28(6):663–668. PMID: 30297373. doi:10.1136/tobaccocontrol-2018-054561.
54. National Institute on Drug Abuse (NIDA). Population Assessment of Tobacco and Health (PATH) study: about the PATH study. Bethesda (MD): National Institutes of Health. 2025. Available from: https://nida.nih.gov/research/nida-research-programs-activities/population-assessment-tobacco-health-path-study/about-path-study.
55. Güder G, Brenner S, Angermann CE, et al. “GOLD or lower limit of normal definition? A comparison with expert-based diagnosis of chronic obstructive pulmonary disease in a prospective cohort-study”. Respir Res. 2012;13(1):13. PMID: 22309369; PMCID: PMC3299632. doi:10.1186/1465-9921-13-13.
56. Agustí A, Celli BR, Criner GJ, et al. Global Initiative for Chronic Obstructive Lung Disease 2023 Report: GOLD Executive Summary. Am J Respir Crit Care Med. 2023;207(7):819–837. PMID: 36856433; PMCID: PMC10111975. doi:10.1164/rccm.202301-0106PP.
57. Graham BL, Steenbruggen I, Miller MR, et al. Standardization of Spirometry 2019 Update. An Official American Thoracic Society and European Respiratory Society Technical Statement. Am J Respir Crit Care Med. 2019;200(8):e70–e88. doi:10.1164/rccm.201908-1590ST
58. Mannino DM, Homa DM, Akinbami LJ, Ford ES, Redd SC. Chronic obstructive pulmonary disease surveillance-United States, 1971–2000. MMWR Surveill Summ. 2002;51(6):1–16. PMID: 12198919.
59. Ho T, Cusack RP, Chaudhary N, Satia I, Kurmi OP. Under- and over-diagnosis of COPD: a global perspective. Breathe. 2019;15(1):24–35. PMID: 30838057; PMCID: PMC6395975. doi:10.1183/20734735.0346-2018.
60. Laniado-Laborín R. Smoking and chronic obstructive pulmonary disease (COPD). Parallel epidemics of the 21 century. Int J Environ Res Public Health. 2009;6(1):209–224. PMID: 19440278; PMCID: PMC2672326. doi:10.3390/ijerph6010209.
61. National Heart. Lung, and Blood Institute. Causes and risk factors of chronic obstructive pulmonary disease (COPD) [Internet]. U.S. Department of Health and Human Services. 2025. Available from: https://www.nhlbi.nih.gov/health/copd/causes.
62. U.S. Department of Health and Human Services. The Health Consequences of Smoking—50 years of Progress: A Report of the Surgeon General. Atlanta (GA): U.S. Department of Health and Human Services, Centers for Disease Control and Prevention, National Center for Chronic Disease Prevention and Health Promotion, Office on Smoking and Health; 2014.
63. Centers for Disease Control and Prevention. Smoking and chronic obstructive pulmonary disease (COPD) [Internet]. In: Tips From Former Smokers®. National Center for Chronic Disease Prevention and Health Promotion; 2024. Available from: https://www.cdc.gov/tobacco/campaign/tips/diseases/copd.html#two.
64. American Lung Association. What causes COPD? [Internet]. In: COPD (Chronic Obstructive Pulmonary Disease). 2025 Mar. Available from: https://www.lung.org/lung-health-diseases/lung-disease-lookup/copd/what-causes-copd.
65. Celli BR, Halbert RJ, Nordyke RJ, Schau B. Airway obstruction in never smokers: results from the Third National Health and Nutrition Examination Survey. Am J Med. 2005;118(12):1364–1372. PMID: 16378780. doi:10.1016/j.amjmed.2005.06.041.
66. Lamprecht B, McBurnie MA, Vollmer WM, et al; BOLD Collaborative Research Group. COPD in never smokers: results from the population-based burden of obstructive lung disease study. Chest. 2011;139(4):752–763. PMID: 20884729; PMCID: PMC3168866. doi:10.1378/chest.10-1253
67. Salvi SS, Barnes PJ. Chronic obstructive pulmonary disease in non-smokers. Lancet. 2009;374(9691):733–743. PMID: 19716966. doi:10.1016/S0140-6736(09)61303-9.
68. Ntritsos G, Franek J, Belbasis L, et al. Gender-specific estimates of COPD prevalence: a systematic review and meta-analysis. Int J Chron Obstruct Pulmon Dis. 2018;13:1507–1514. PMID: 29785100; PMCID: PMC5953270. doi:10.2147/COPD.S146390
69. Rosenberg SR, Kalhan R, Mannino DM. Epidemiology of Chronic Obstructive Pulmonary Disease: prevalence, Morbidity, Mortality, and Risk Factors. Semin Respir Crit Care Med. 2015;36(4):457–469. PMID: 26238634. doi:10.1055/s-0035-1555607.
70. Akinbami LJ, Liu X. Chronic obstructive pulmonary disease among adults aged 18 and over in the United States, 1998–2009. NCHS Data Brief. 2011;63:1–8. PMID: 22142836.
71. Han MK, Postma D, Mannino DM, et al. Gender and chronic obstructive pulmonary disease: why it matters. Am J Respir Crit Care Med. 2007;176(12):1179–1184. PMID: 17673696; PMCID: PMC2720110. doi:10.1164/rccm.200704-553CC.
72. Aryal S, Diaz-Guzman E, Mannino DM. Influence of sex on chronic obstructive pulmonary disease risk and treatment outcomes. Int J Chron Obstruct Pulmon Dis. 2014;9:1145–1154. PMID: 25342899; PMCID: PMC4206206. 60. doi:10.2147/COPD.S54476
73. Czarnota P, MacLeod JL, Gupta N, Manichaikul A, Shim YM. Sex Differences in Chronic Obstructive Pulmonary Disease: implications for Pathogenesis, Diagnosis, and Treatment. Int J Mol Sci. 2025;26(6):2747. PMID: 40141389; PMCID: PMC11942865. 65. doi:10.3390/ijms26062747.
74. Perez TA, Castillo EG, Ancochea J, et al. Sex differences between Female and men with COPD: a new analysis of the 3CIA study. Respir Med. 2020;171:106105. PMID: 32858497. doi:10.1016/j.rmed.2020.106105
75. Arrazola RA, Griffin T, Lunsford NB, et al. US Cigarette Smoking Disparities by Race and Ethnicity - Keep Going and Going! Prev Chronic Dis. 2023:20E45. PMID: 37262328; PMCID: PMC10240929. doi:10.5888/pcd20.220375
76. Laffey KG, Nelson AD, Laffey MJ, Nguyen Q, Sheets LR, Schrum AG. Chronic respiratory disease disparity between American Indian/Alaska Native and white populations 2011–2018. BMC Public Health. 2021;21(1):1466. PMID: 34320979; PMCID: PMC8317382. doi:10.1186/s12889-021-11528-8.
77. Laffey KG, Nelson AD, Laffey MJ, Nguyen Q, Sheets LR, Schrum AG. Regional Differences in American Indian/Alaska Native Chronic Respiratory Disease Disparity: evidence from National Survey Results. Int J Environ Res Public Health. 2024;21(8):1070. PMID: 39200679; PMCID: PMC11354713. doi:10.3390/ijerph21081070.
78. Al Wachami N, Guennouni M, Iderdar Y, et al. Estimating the global prevalence of chronic obstructive pulmonary disease (COPD): a systematic review and meta-analysis. BMC Public Health. 2024;24(1):297. PMID: 38273271; PMCID: PMC10811845. doi:10.1186/s12889-024-17686-9.
79. Hwang YI, Kim CH, Kang HR, et al. Comparison of the prevalence of chronic obstructive pulmonary disease diagnosed by lower limit of normal and fixed ratio criteria. J Korean Med Sci. 2009;24(4):621–626. PMID: 19654942; PMCID: PMC2719218. doi:10.3346/jkms.2009.24.4.621.
80. Grigsby M, Siddharthan T, Chowdhury MA, et al. Socioeconomic status and COPD among low- and middle-income countries. Int J Chron Obstruct Pulmon Dis. 2016;11:2497–2507. PMID: 27785006; PMCID: PMC5065097. doi:10.2147/COPD.S111145
81. Casas Herrera A, de Oca M M, López Varela MV, et al. COPD Underdiagnosis and Misdiagnosis in a High-Risk Primary Care Population in Four Latin American Countries. A Key to Enhance Disease Diagnosis: the PUMA Study. PLoS One. 2016;11(4):e0152266. PMID: 27073880; PMCID: PMC4830516. doi:10.1371/journal.pone.0152266.
82. Halbert RJ, Natoli JL, Gano A, Badamgarav E, Buist AS, Mannino DM. Global burden of COPD: systematic review and meta-analysis. Eur Respir J. 2006;28(3):523–532. doi:10.1183/09031936.06.0012460572
83. Olortegui-Rodriguez JJ, Soriano-Moreno DR, Benites-Bullón A, Pelayo-Luis PP, Huaringa-Marcelo J. Prevalence and incidence of chronic obstructive pulmonary disease in Latin America and the Caribbean: a systematic review and meta-analysis. BMC Pulm Med. 2022;22(1):273. PMID: 35842603; PMCID: PMC9288210. doi:10.1186/s12890-022-02067-y.
84. Jarhyan P, Hutchinson A, Khaw D, Prabhakaran D, Mohan S. Prevalence of chronic obstructive pulmonary disease and chronic bronchitis in eight countries: a systematic review and meta-analysis. Bull World Health Organ. 2022;100(3):216–230. PMID: 35261410; PMCID: PMC8886252. doi:10.2471/BLT.21.286870.
85. Tilert T, Dillon C, Paulose-Ram R, et al. Estimating the U.S. prevalence of chronic obstructive pulmonary disease using pre- and post-bronchodilator spirometry: the National Health and Nutrition Examination Survey (NHANES) 2007–2010. Respir Res. 2013;14:103. doi:10.1186/1465-9921-14-103
86. Ryan H, Trosclair A, Gfroerer J. Adult current smoking: differences in definitions and prevalence estimates--NHIS and NSDUH, 2008. J Environ Public Health. 2012;2012:918368. PMID: 22649464; PMCID: PMC3357540. doi:10.1155/2012/918368
87. Rodu B, Cole P. Smoking prevalence: a comparison of two American surveys. Public Health. 2009;123(9):598–601. PMID: 19733373. doi:10.1016/j.puhe.2009.07.014.
88. Messeri P, Cantrell J, Mowery P, Bennett M, Hair E, Vallone D. Examining differences in cigarette smoking prevalence among young adults across national surveillance surveys. PLoS One. 2019;14(12):e0225312. PMID: 31834881; PMCID: PMC6910680. doi:10.1371/journal.pone.0225312.
89. Sakhare G, Chitte Y, Munje R, Joshi S, Bhakare M. Using spirometry for screening and diagnosis of chronic respiratory diseases in primary health care: findings from a community health project in rural India. J Global Health Rep. 2024;8:e2024004. doi:10.29392/001c.116246
90. Tan WC, Bourbeau J, Hernandez P, et al; CanCOLD Collaborative Research Group. Bronchodilator responsiveness and reported respiratory symptoms in an adult population. PLoS One. 2013;8(3):e58932. PMID: 23554960; PMCID: PMC3598856. doi:10.1371/journal.pone.0058932
91. Ayuk A, Ndukwu C, Uwaezuoke S, et al. Spirometry practice and the impact of a Phase 1 training workshop among health workers in southern Nigeria: a cross-sectional study. BMC Pulm Med. 2020;20:258. doi:10.1186/s12890-020-01291-8
92. National Health and Nutrition Examination Survey (U.S.). National Health and Nutrition Examination Survey (NHANES): respiratory health spirometry procedures manual. 2011.
93. Schnieders E, Ünal E, Winkler V, et al. Performance of alternative COPD case-finding tools: a systematic review and meta-analysis. Eur Respir Rev. 2021;30(160):200350. PMID: 34039672; PMCID: PMC9488779. doi:10.1183/16000617.0350-2020.
94. Bailey KL. The importance of the assessment of pulmonary function in COPD. Med Clin North Am. 2012;96(4):745–752. PMID: 22793942; PMCID: PMC3998207. doi:10.1016/j.mcna.2012.04.011.
95. Murgia N, Gambelunghe A. Occupational COPD-The most under-recognized occupational lung disease? Respirology. 2022;27(6):399–410. PMID: 35513770; PMCID: PMC9321745. doi:10.1111/resp.14272.
96. Ambrosino N, Bertella E. Lifestyle interventions in prevention and comprehensive management of COPD. Breathe. 2018;14(3):186–194. PMID: 30186516; PMCID: PMC6118879. doi:10.1183/20734735.018618.
 © 2026 The Author(s). This work is published and licensed by Dove Medical Press Limited. The
full terms of this license are available at https://www.dovepress.com/terms
and incorporate the Creative Commons Attribution
- Non Commercial (unported, 4.0) License.
By accessing the work you hereby accept the Terms. Non-commercial uses of the work are permitted
without any further permission from Dove Medical Press Limited, provided the work is properly
attributed. For permission for commercial use of this work, please see paragraphs 4.2 and 5 of our Terms.
© 2026 The Author(s). This work is published and licensed by Dove Medical Press Limited. The
full terms of this license are available at https://www.dovepress.com/terms
and incorporate the Creative Commons Attribution
- Non Commercial (unported, 4.0) License.
By accessing the work you hereby accept the Terms. Non-commercial uses of the work are permitted
without any further permission from Dove Medical Press Limited, provided the work is properly
attributed. For permission for commercial use of this work, please see paragraphs 4.2 and 5 of our Terms.
Recommended articles

Hospital Burden of Chronic Obstructive Pulmonary Disease in Hong Kong – The Trend from 2006 to 2014
Chan HS, Ko FWS, Chan JWM, Choo KL, So LKY, Lam DCL, Sin KM, Wong WY, Cheng YL, Wong MML
International Journal of Chronic Obstructive Pulmonary Disease 2023, 18:507-519
Published Date: 6 April 2023
Burden of Disease in Patients with Mild or Mild-to-Moderate Chronic Obstructive Pulmonary Disease (Global Initiative for Chronic Obstructive Lung Disease Group A or B): A Systematic Literature Review
Czira A, Purushotham S, Iheanacho I, Rothnie KJ, Compton C, Ismaila AS
International Journal of Chronic Obstructive Pulmonary Disease 2023, 18:719-731
Published Date: 29 April 2023

COPD in People with HIV: Epidemiology, Pathogenesis, Management, and Prevention Strategies
Byanova KL, Abelman R, North CM, Christenson SA, Huang L
International Journal of Chronic Obstructive Pulmonary Disease 2023, 18:2795-2817
Published Date: 29 November 2023
Characteristics of Current Smokers versus Former Smokers with COPD and Their Associations with Smoking Cessation Within 4.5 Years: Results from COSYCONET
Alter P, Stoleriu C, Kahnert K, Henke MO, Bals R, Trudzinski FC, Watz H, Speicher T, Söhler S, Welte T, Rabe KF, Wouters EFM, Vogelmeier CF, Jörres RA
International Journal of Chronic Obstructive Pulmonary Disease 2023, 18:2911-2923
Published Date: 6 December 2023
Risk of Death and Cardiovascular Events Following an Exacerbation of COPD: The EXACOS-CV US Study
Daniels K, Lanes S, Tave A, Pollack MF, Mannino DM, Criner G, Neikirk A, Rhodes K, Feigler N, Nordon C
International Journal of Chronic Obstructive Pulmonary Disease 2024, 19:225-241
Published Date: 18 January 2024