
Back to Journals » International Journal of General Medicine » Volume 18
Temporal Trends in Serum Homer1 Levels and Their Prognostic Implications in Aneurysmal Subarachnoid Hemorrhage: A Prospective Cohort Study
Authors Dai J, Lin Q, Ye L, Chen X, Li Z, Lu C, Chen M, Ba H, Sun J, Cai J
Received 24 November 2024
Accepted for publication 23 January 2025
Published 1 February 2025 Volume 2025:18 Pages 567—584
DOI https://doi.org/10.2147/IJGM.S508325
Checked for plagiarism Yes
Review by Single anonymous peer review
Peer reviewer comments 2
Editor who approved publication: Dr Woon-Man Kung
Junxia Dai, Qun Lin, Liangzhi Ye, Xiaoxiang Chen, Zhiwei Li, Chuan Lu, Maohua Chen, Huajun Ba, Jun Sun, Jianyong Cai
Department of Neurosurgery, Laboratory of Pan-Vascular Disease Management Center, The Dingli Clinical College of Wenzhou Medical University, The Wenzhou Central Hospital, Wenzhou, 325000, People’s Republic of China
Correspondence: Jianyong Cai, Email [email protected]
Background: Homer scaffold protein 1 (homer1) may harbor neuroprotective effects against acute brain injury. This study aimed to investigate the prognostic role of serum homer1 in human aneurysmal subarachnoid hemorrhage (aSAH).
Methods: A total of 209 patients with aSAH and 100 controls were encompassed in this prospective cohort study. Serum homer1 levels were quantified at admission in all patients, on post-aSAH days 1, 3, 5, 7, 10, and 14 in 83 patients and at recruitments in controls. The modified Fisher scale (mFisher) and World Federation of Neurological Surgeons Scale (WFNS) were used for severity assessment. Glasgow Outcome Scale (GOS) scores of 1– 3 at post-aSAH 90 days indicated poor prognosis.
Results: Serum homer1 levels of patients were abruptly elevated at admission, peaked at day 3, and afterwards decreased from day 5 until day 14 after aSAH, and were markedly higher during 14 days than those of controls. Serum homer1 levels were linearly and independently correlated with WFNS scores, mFisher scores, continuous GOS scores, ordinal GOS scores, poor prognosis risk and delayed cerebral ischemia (DCI) likelihood. DCI partially mediated association of serum homer1 levels with poor prognosis. The prognosis model was composed of the four independent predictors, that is serum homer1 levels, DCI, WFNS scores and mFisher scores. As demonstrated by a series of statistical methods, the model had a good performance.
Conclusion: Serum homer1 levels are significantly elevated in acute phase after aSAH, and are strongly related to heightened bleeding intensity, poor 90-day prognosis and DCI. Nevertheless, associational mechanism of serum homer1 and poor prognosis mediated by DCI needs to be further deciphered.
Keywords: aneurysm, subarachnoid hemorrhage, cohort study, mediation effect, homer scaffold protein 1
Introduction
Aneurysmal subarachnoid hemorrhage (aSAH) is one of the most common cerebrovascular disorders with serious sequelae.1 Clinically, the World Federation of Neurosurgical Societies (WFNS) and modified Fisher (mFisher) scales are preferred for assessing severity of aSAH,2,3 and the Glasgow Outcome Scale (GOS) is extensively accepted for evaluating neurological outcomes of patients.4,5 Delayed cerebral ischemia (DCI), mechanistically similar to early brain injury, involves a series of cascading molecular reactions, covering inflammatory reactions, oxidative stress, apoptosis and more.6–10 Patients with aSAH are vulnerable to DCI, while those with DCI tend to have higher risk of poor neurological outcomes.9,10 Thus, it is equally important to predict both DCI and poor neurological outcomes following aSAH. Recent decades, blood biomarkers, because of their easy obtainability, have garnered wide attentions as to their close correlations with the severity, DCI and clinical outcomes of aSAH.11–13
Homer scaffolding protein 1 (homer1) structurally belongs to a dense postsynaptic protein and functionally acts as a cytoplasmic adaptor with primary participation in synaptic plasticity and signal transduction.14,15 Homer1 is principally expressed in the nervous system.16 In animals subjected to traumatic, hemorrhagic, or ischemic brain injury, homer1 may confer protective effects against acute brain injury via improving synaptic plasticity, modulating calcium signal homeostasis, and moderating inflammation and mitochondrial endoplasmic reticulum stress.17–19 Notably, elevated serum homer1 levels after acute ischemic stroke independently distinguished patients at risk of post-stroke three-month worse outcomes.20 Thus, these features could identify homer1 as a potential endogenous protective factor for minimizing secondary brain injury, hinting its application as a biomarker of brain injury. Here, we discerned temporal trends of serum homer1 levels post-aSAH and attempted to investigate its predictive effects on clinical outcomes of patients, alongside determining the mediation role of DCI.
Methods and Materials
Study Design and Ethical Consent
In this observational analytic study at the Wenzhou Central Hospital, patients were consecutively recruited between April 2018 and April 2023. Inclusion criteria of patients encompassed (1) age of 18 years or greater; (2) first-onset stroke; (3) diagnosis of SAH by computed tomography scan; (4) verification of intracranial aneurysm via computed tomography angiography or digital subtraction angiography; (5) hospital admission within posthemorrhagic 24 hours; (6) surgical repairment of aneurysm within postadmission 48 hours. And then, we further excluded those patients who presented with (1) other sicknesses in nervous system, such as moderate-severe craniocerebral trauma, intracranial tumors, myasthenia gravis and infections; (2) severe disorders in certain organs, such as malignancies, uremia, cirrhosis and ascites; or (3) some specific conditions, such as pregnancies, missed visits, deficient information, declination to participation and unavailable blood samples. Controls were enrolled according to the following requirements: (1) shortage of some severe illnesses, such as stroke, myocardial infarction, malignancies, uremia and ascites, but no exclusions of some chronic diseases, such as hypertension, diabetes mellitus and hyperlipidemia; and (2) normal results in some conventional tests, such as electrocardiogram, chest radiograph, blood leucocyte counts and blood electrolyte levels. As displayed in Figure 1, this study was classified into two segments. In the cross-sectional sub-study, the longitudinal change of serum homer1 levels after aSAH was investigated. In the prospective cohort sub-study, we determined the predictive significance of serum homer1 levels for poor 90-day prognosis, alongside unraveling the mediation role of DCI. The current study conformed to all relevant national terms and institutional clauses and obeyed the tenets of the Helsinki Declaration and its later amendments. The study protocol was approved by the Institutional Ethics Review Committee of the Wenzhou Central Hospital (L2024-03-020). Written informed consent forms were obtained from all individuals or their proxies as appropriate.
 |
Figure 1 Study-plan diagram for analyzing the prognostic role of serum homer scaffold protein 1 in aneurysmal subarachnoid hemorrhage. This study was categorized as a cross-sectional sub-study and a prospective cohort sub-study to ascertain the time course of serum homer scaffold protein 1 levels and their prognostic implications in aneurysmal subarachnoid hemorrhage. Abbreviations: aSAH, aneurysmal subarachnoid hemorrhage; homer1, homer scaffold protein 1. |
Data Acquirements and Outcome Assessments
Demographic data, adverse life habits, medical history and medication history were collected by two clinicians, who were blinded to the outcome of interest. The WFNS scores at admission were documented for reflecting clinical severity of aSAH. All radiological examinations were performed strictly in accordance with radiological standards. mFisher scores were recorded for assessing radiological intensity of aSAH. Location, size and shape of aneurysms, intraventricular entry of hemorrhage and acute hydrocephalus were registered. Neurosurgical clipping or endovascular intervention was performed to treat aneurysms. External ventricular drainage was performed, as necessary. In parallel with previous reports, DCI was confirmed when the following requirements were met: (1) clinical worsening (eg, new focal deficits, consciousness level decrements, or both), and/or (2) occurrence of new infarctions via head computerized tomography scans that were invisible at admission or in the early postoperative phase and could not be attributed to any other reasons with the aid of clinical assessments, head imaging checking, and suitable laboratory tests.21 On the basis of 5-level GOS, the neurological functional statuses in daily life were evaluated using the blinded method. In the form of structured interviews via telephone visits, all inquiries were carried out at 90 days following aSAH by two proficient neurosurgical specialists, who had no access into information about clinical, radiological and biochemical results. Patients with GOS scores of 1–3 were designated to have poor prognosis.22
Immune Analysis
Blood samples of controls were acquired at their study entry. According to the previous reports,23–25 the specific time points of blood drawings in the current study were preestablished as admission and days 1, 3, 5, 7, 10, and 14 after aSAH. In compliance with the voluntary principle, blood specimens of some patients were obtained at multiple time points and the others, only at admission. Blood samples were put into 5 mL gel-containing biochemistry tubes (Hubei New Desheng Material Technology Co., Ltd., China), and then were centrifuged at 3000 × g for 10 min. Finally, the isolated serum was transferred to Eppendorf Tubes (Eppendorf Tubes® BioBased, China) for preservation below 80°C until later use. By applying the enzyme-linked immunosorbent assay (ELISA) kit (Article Number: abx387846; Abbexa LTD, Cambridge, UK), serum homer1 levels were measured following the specifications. The intra-assay coefficient of variation and inter-assay coefficient of variation were below 8% and 10%, respectively, for this ELISA kit, the detection sensitivity was 9.38 pg/mL and the detection range varied from 15.63 to 1000 pg/mL. All measurements must be duplicated and completed within three months since sampling by the same proficient specialist who was blinded to the study data. The dual results were averaged for the final analytical use.
Statistical Analysis
The used statistical and plotting softwares encompassed the SPSS 25.0 (BMI Software Inc., USA), R 4.2.4 (https://www.r-project.org), GraphPad Prism 9.0 (GraphPad Software, Inc., Boston, MA, USA) and MedCalc 20.305 (MedCalc Software, Mariakel, Belgium). Categorical variables were reported in the form of counts (proportions). Following the Shapiro–Wilk test or Kolmogorov–Smirnov test, normally and non-normally distributed continuous variables were shown as means (standard deviations) and medians (percentiles 25th-75th), respectively. The employed statistical methods for data comparisons included the chi-square test, Fisher’s exact test, Mann–Whitney U-test, independent t-test and Kruskal–Wallis test. Bivariate correlations were done using the Spearman’s test. As for the multivariate analyses, the dependent variables covered serum homer1 levels, continuous GOS scores, ordinal GOS scores, poor prognosis and DCI, and the multivariable methods successively included the multivariate linear regression analysis, ordinal regression analysis and binary logistic regression analyses. To determine independent factors, significantly different variables on univariate analyses (P value < 0.05) were entered into the respective multivariate model. The mediation analysis was performed to determine the mediation effect of DCI on the relationship between serum homer1 levels and poor prognosis. The restricted cubic spline analysis was done because potential linearity correlation of serum homer1 levels with WFNS scores, mFisher scores, GOS scores, DCI risk and poor prognosis possibility ensured rationality in further relevant analyses. The prognosis model was made up of the independent predictors of poor prognosis and was graphically represented by the nomogram. Clinical validity of the model was verified by using the decision curve analysis, its stability was demonstrated by applying the calibration curve analysis, and its predictive ability was confirmed by adopting the receiver operating characteristic (ROC) curve analysis. Due to natural characteristics owned by the prospective cohort study, only two patients were lost to follow-up and a sufficient number of confounding factors were selected here, so influence on results from missing data or potential unmeasured confounders could be negligible. Statistical significance was defined as a two-sided P-value of <0.05.
Results
Participant Features
A total of 276 patients were initially assessed, 67 patients were excluded and finally, 209 patients were retained for the clinical analysis. The total patients accepted blood drawings at admission, and 83 of them also volunteered for blood collections on days 1, 3, 5, 7, 10, and 14 post-aSAH. The basic characteristics of the total patients and these 83 patients are summarized in Table 1. All features were not significantly different between the two groups (all P values > 0.05; Table 1). A collective of 100 controls had the mean age of 50.4 years (standard deviation, 10.3 years), contained 51 males and 49 females, and included 24 tobacco smokers, 22 alcohol smokers, 28 hyperlipidemic individuals, 9 diabetic subjects and 21 hypertensive persons. No substantial distinctions were found in terms of age, gender, tobacco smoking, alcohol consuming, hypertension, diabetes mellitus and hyperlipidemia between controls and those 83 patients consenting for blood drawings at several time points (all P values > 0.05).
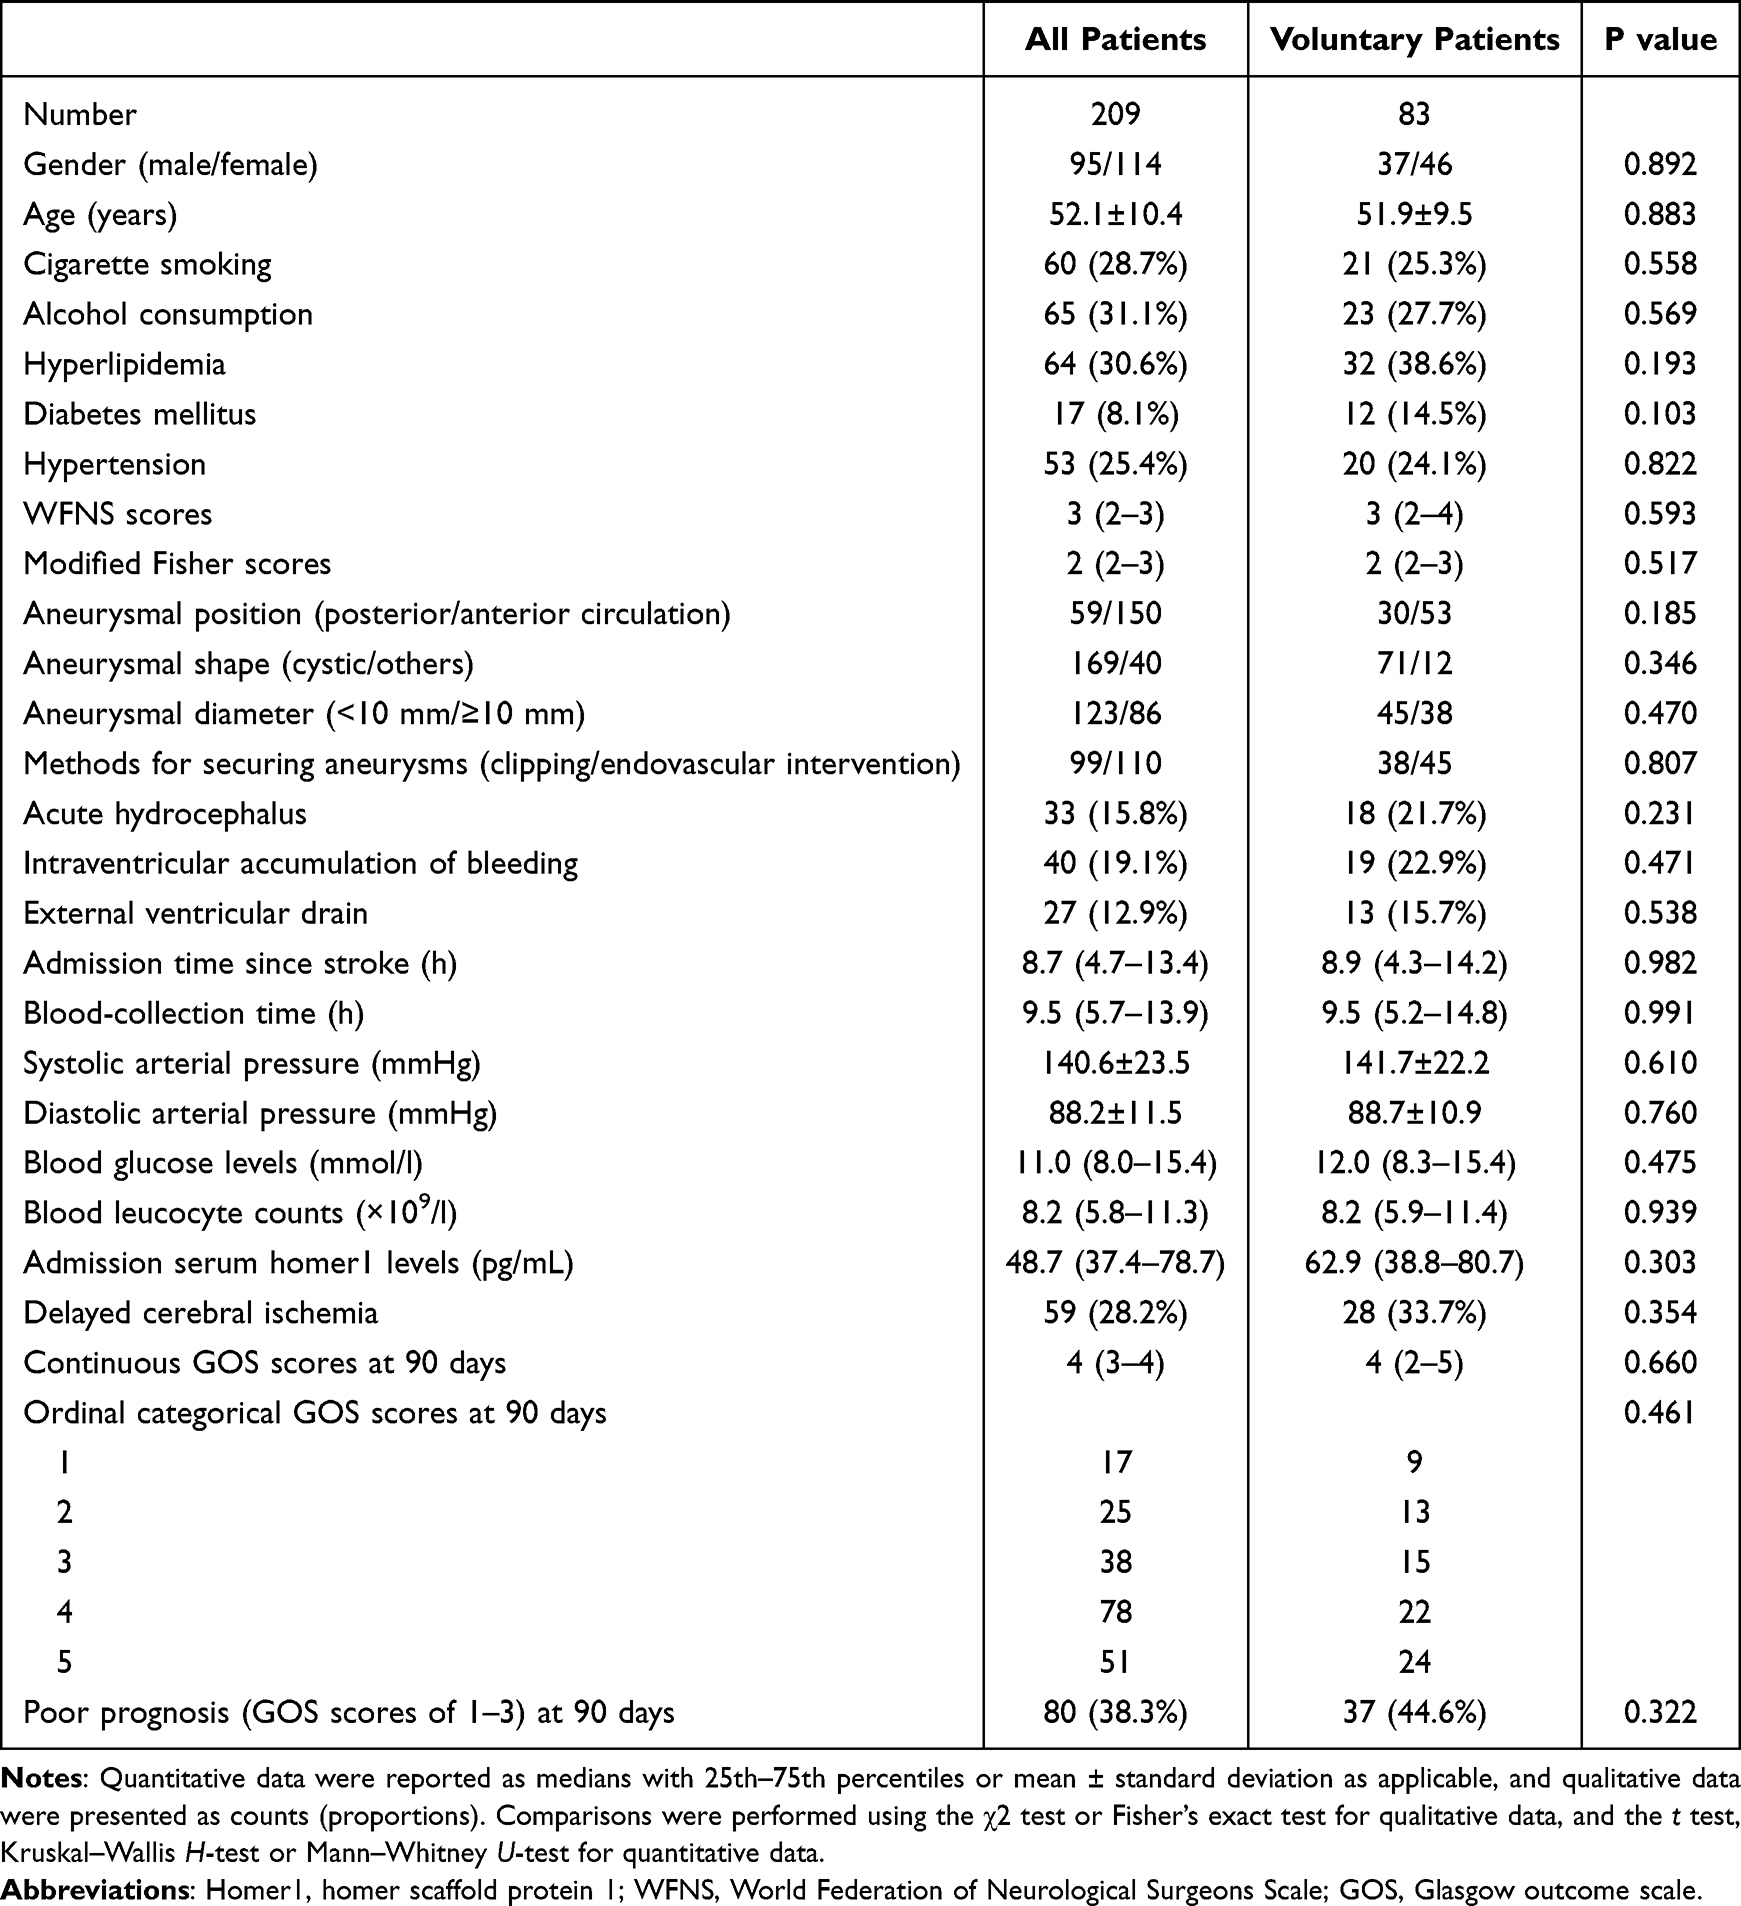 |
Table 1 Basic Features Between All Patients and Voluntary Patients Consenting for Blood-Drawings at Multiple Time Points After Aneurysmal Subarachnoid Hemorrhage |
Change of Serum Homer1 Levels and Its Relation to Illness Severity
All 209 patients, relative to those 83 patients consenting for blood drawings at several time points, had similar admission serum homer1 levels (P value > 0.05; Figure 2). Serum homer1 levels of those 83 patients rapidly increased upon admission, reached higher levels on post-injury day 1, peaked at day 3, and then diminished slowly from day 5 until day 14 following aSAH, and were markedly higher during 14 days than those of controls (P < 0.001; Figure 2). Additionally, under the ROC curves shown in Figure 3, the prognostic predictive ability of admission serum homer1 levels was similar between all 209 patients and those 83 patients (P value > 0.05); among those 83 patients, the prognostic predictive ability of admission serum homer1 levels was equivalent to those of serum homer1 levels on days 1, 3, 5, and 7 after aSAH (all P values > 0.05), and significantly surpassed those of serum homer1 levels on days 10 and 14 following aSAH (both P values < 0.05), indicating admission serum homer1 levels could have the potential ability to predict clinical outcome of patients with aSAH. Within the framework of the restricted cubic spline analysis, admission serum homer1 levels of all 209 patients were linearly correlated with WFNS scores (P value for nonlinear > 0.05; Figure 4) and mFisher scores (P value for nonlinear > 0.05; Figure 5). As shown in Table 2, admission serum homer1 levels of all 209 patients were positively correlated with WFNS scores, mFisher scores, acute hydrocephalus, intraventricular entry of hemorrhage, external ventricular drainage and blood glucose levels (all P values < 0.05). By incorporating the above six related variables into the multivariate linear regression model, admission serum homer1 levels were independently correlated with WFNS scores [beta (β), 7.706; 95% confidence interval (CI), 4.457–10.955; variance inflation factor (VIF), 1.708; P < 0.001] and mFisher scores (β, 7.417; 95% CI, 3.513–11.321; VIF, 1.719; P < 0.001).
 |
Table 2 Bivariate Correlation Analyses of Admission Serum Homer Scaffold Protein 1 Levels and Glasgow Outcome Scale Scores After Aneurysmal Subarachnoid Hemorrhage |
 |
Figure 2 Change of serum homer scaffold protein 1 levels following subarachnoid hemorrhage. Serum homer scaffold protein l levels of patients had a prompt incremental trend at admission, with the highest peak at day 3, and then gradually declined until day 14, with markedly higher levels during the 14 days in patients than in controls (P<0.001). ***P<0.001. Abbreviations: SAH, subarachnoid hemorrhage; homer1, homer scaffold protein 1; ns, non-significant. |
 |
Figure 3 Areas under receiver operating characteristic curve of serum homer scaffold protein 1 levels at multiple time points. As for predicting 90-day poor prognosis after subarachnoid hemorrhage, admission serum homer scaffold protein 1 levels did not show significantly lower area under the receiver operating characteristic curve. *P<0.05. Abbreviations: Homer1, homer scaffold protein 1; ns, nonsignificant. |
 |
Figure 4 Linearity relationship between admission serum homer scaffold protein 1 levels and World Federation of Neurosurgical Societies Scale scores after subarachnoid hemorrhage. Under restricted cubic spline, admission serum homer scaffold protein 1 levels were linearly correlated with World Federation of Neurosurgical Societies Scale scores following subarachnoid hemorrhage (P for nonlinear >0.05). Abbreviations: Homer1, homer scaffold protein 1; WFNS, World Federation of Neurosurgical Societies Scale. |
 |
Figure 5 Restricted cubic spline assessing linear relationship between admission serum homer scaffold protein 1 levels and modified Fisher scores after subarachnoid hemorrhage. Admission serum homer scaffold protein 1 levels had a linear correlation with modified Fisher scores after subarachnoid hemorrhage (P for nonlinear >0.05). Abbreviation: Homer1, homer scaffold protein 1. |
Admission Serum Homer1 Levels and 90-Day Functional Outcome
Admission serum homer1 levels of all 209 patients were linearly related to continuous GOS scores at 90 days following aSAH (P value for nonlinear > 0.05; Figure 6). As listed in Table 2, GOS scores were strongly inversely correlated with admission serum homer1 levels and other variables, including age, WFNS scores, mFisher scores, acute hydrocephalus, intraventricular entry of hemorrhage, external ventricular drainage, DCI and blood glucose levels (all P values < 0.05). With incorporation of the preceding significant variables into the multivariate linear regression model, the continuous GOS scores were independently correlated with mFisher scores (β, −0.366; 95% CI, −0.540 to -0.191; VIF, 1.839; P < 0.001), WFNS scores (β, −0.316; 95% CI, −0.464 to -0.168; VIF, 1.909; P < 0.001), admission serum homer1 levels (β, −0.008; 95% CI, −0.014 to -0.002; VIF, 1.577; P = 0.007) and DCI (β, −0.427; 95% CI, −0.725 to -0.129; VIF, 1.312; P = 0.005).
 |
Figure 6 Restricted cubic spline assessing linearity correlation of admission serum homer scaffold protein 1 levels with Glasgow outcome scale scores at 90-day mark following subarachnoid hemorrhage. Linearity correlation was revealed between admission serum homer scaffold protein 1 levels and ninety-day Glasgow outcome scale scores after subarachnoid hemorrhage (P for nonlinear >0.05). Abbreviations: Homer1, homer scaffold protein 1; GOS, Glasgow outcome scale. |
Among the five subgroups based on the ordinal GOS scores, WFNS scores, mFisher scores, intraventricular entry of hemorrhage, DCI, admission serum homer1 levels and blood glucose levels statistically significantly differed (all P values < 0.05; Table 3). With the entry of the above-mentioned six variables in the ordinal regression model, mFisher scores (β, −0.869; 95% CI, −1.267 to -0.470; VIF, 1.846; P < 0.001), WFNS scores (β, −0.634; 95% CI, −0.970 to -0.298; VIF, 1.918; P < 0.001), admission serum homer1 levels (β, −0.020; 95% CI, −0.033 to -0.007; VIF, 1.602; P = 0.004), and DCI (β, −0.748; 95% CI, −1.402 to -0.094; VIF, 1.330; P = 0.025) were independently related to ordinal GOS scores.
 |
Table 3 Differences of Baseline Characteristics Across Glasgow Outcome Scale Scores After Aneurysmal Subarachnoid Hemorrhage |
Admission serum homer1 levels of all 209 patients were linearly related to the possibility of poor prognosis 90 days after stroke (P value for nonlinear > 0.05; Figure 7). Under the ROC curve, admission serum homer1 levels efficiently predicted poor ninety-day prognosis and admission serum homer1 levels more than 71.0 pg/mL distinguished the probability of poor prognosis with the maximal Youden index at 0.567 in predicting poor prognosis with 67.5% sensitivity and 89.2 specificity (Figure 8). As listed in Table 4, patients with poor prognosis, as opposed to the other remainders, exhibited significantly elevated WFNS scores, mFisher scores, blood glucose levels and admission serum homer1 levels (all P values < 0.05) as well as displayed substantially heightened proportions of DCI, intraventricular entry of hemorrhage and external ventricular drainage (all P values < 0.05). When the aforementioned variables were forced into the binary logistic regression model, mFisher scores (odds ratio [OR], 1.940; 95% CI, 1.163–3.235; VIF, 1.847; P = 0.011), WFNS scores (OR, 1.841; 95% CI, 1.158–2.925; VIF, 1.920; P = 0.010), admission serum homer1 levels (OR, 1.021; 95% CI, 1.004–1.039; VIF, 1.607; P = 0.014), and DCI (OR, 2.424; 95% CI, 1.062–5.531; VIF, 1.351; P = 0.035) independently predicted poor prognosis at ninety-day mark postinjury (P value = 0.266; by Hosmer and Lemeshow test).
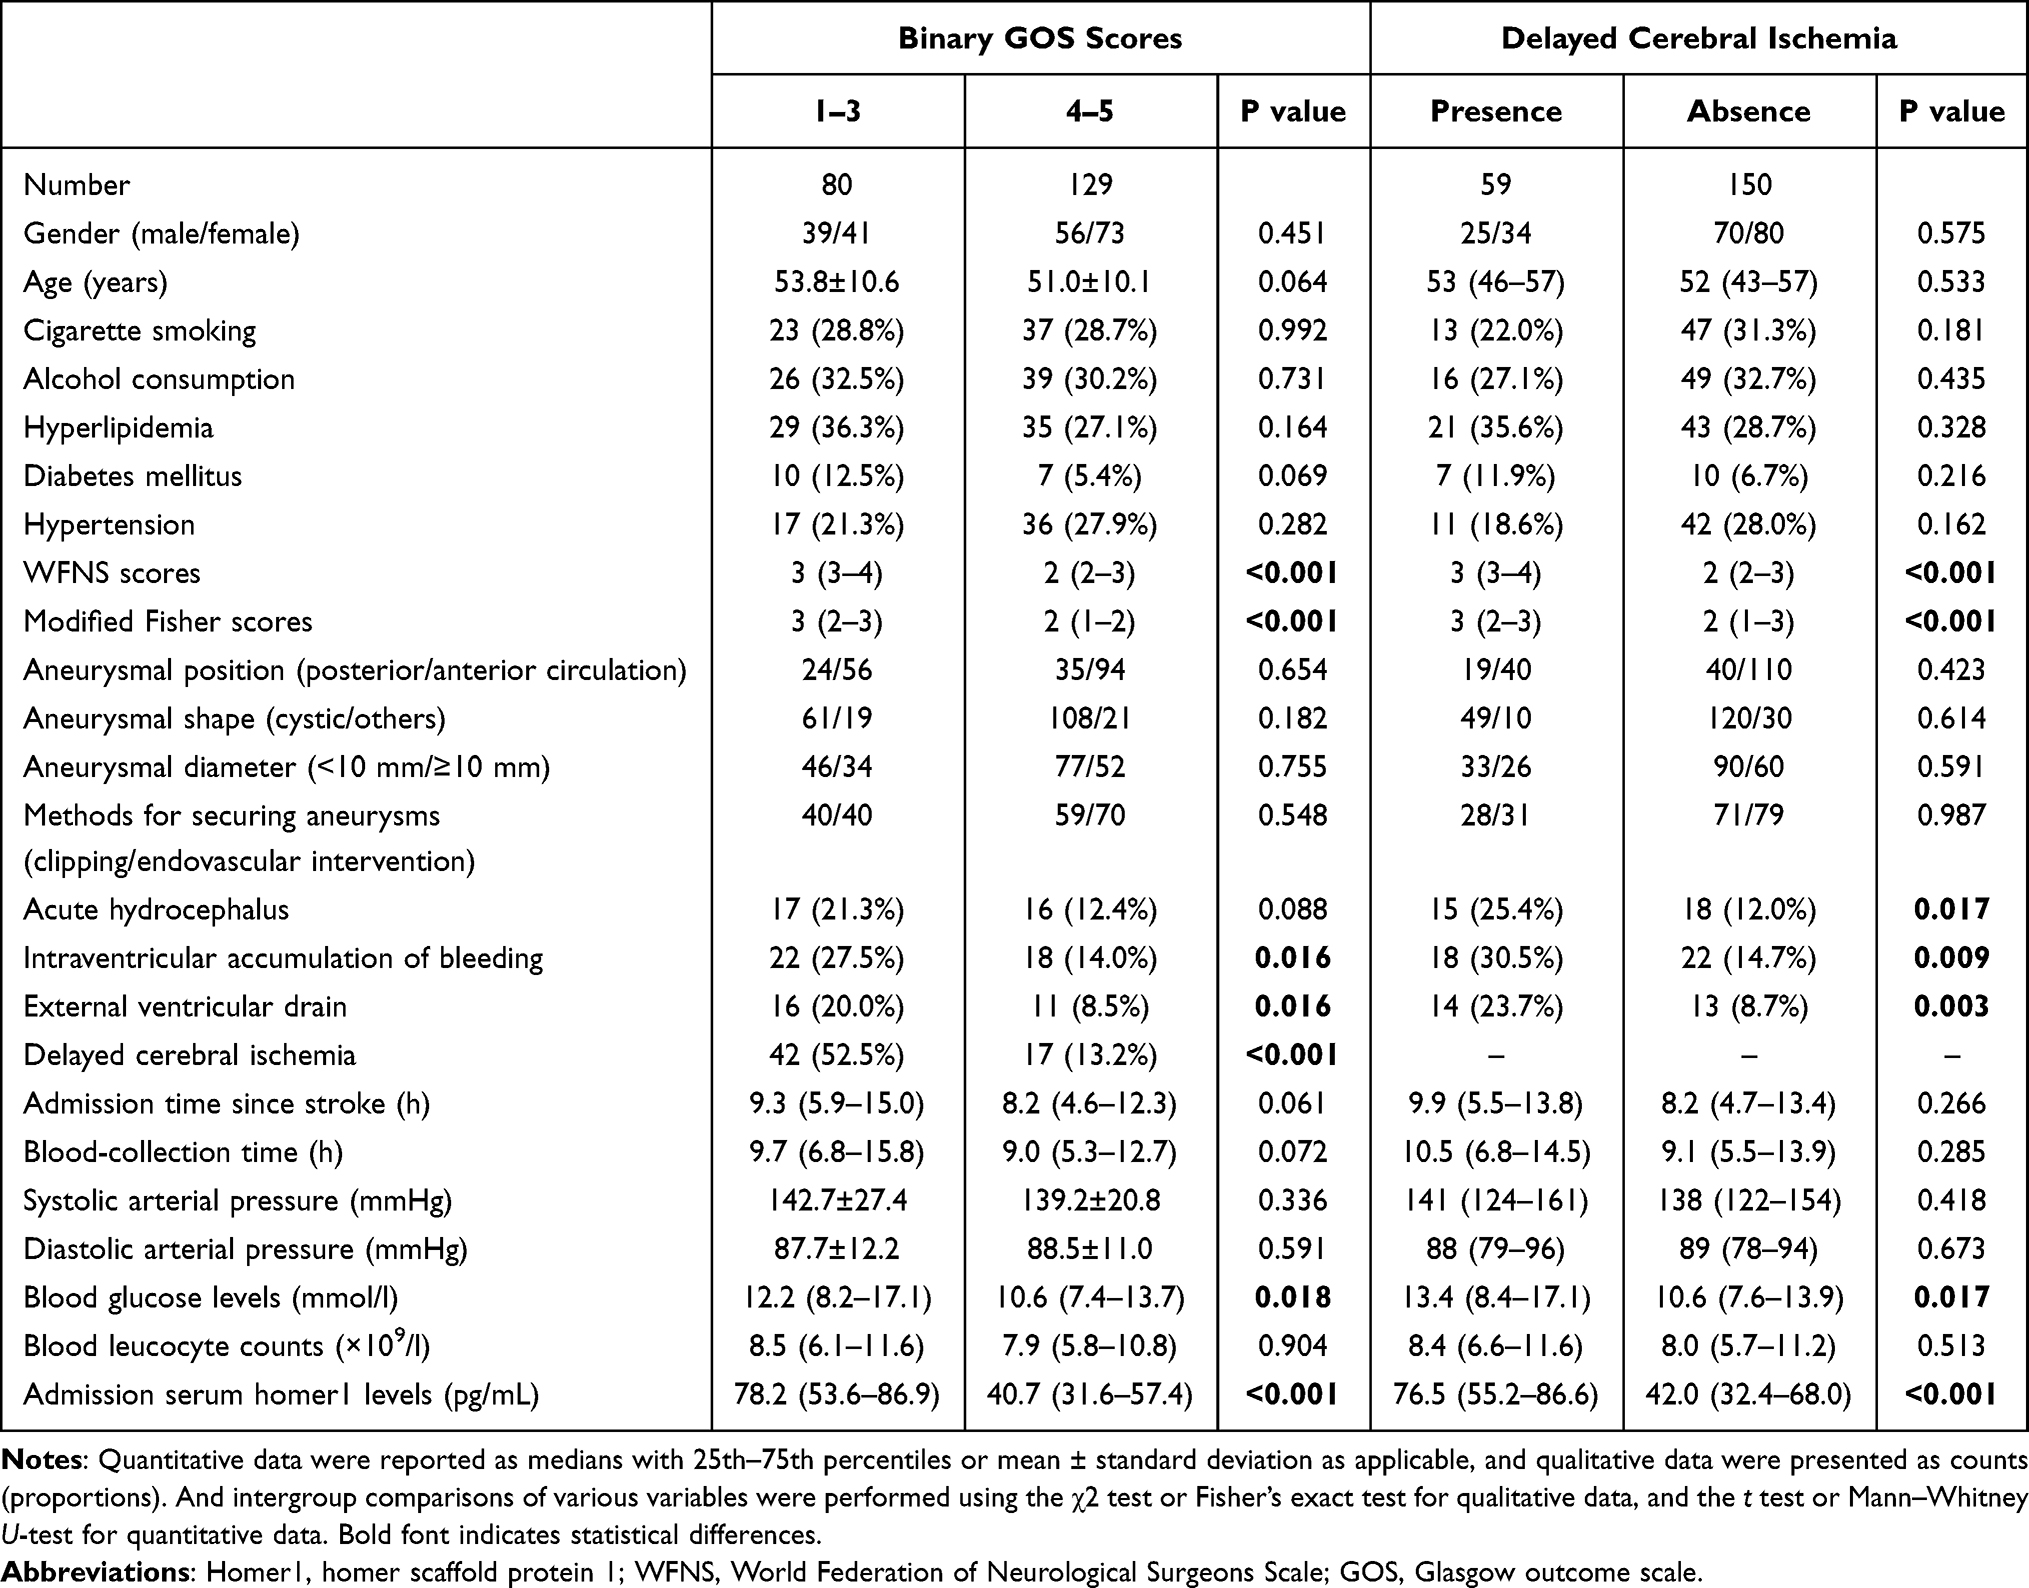 |
Table 4 Intergroup Differences of Baseline Characteristics Across Binary Glasgow Outcome Scale and Delayed Cerebral Ischemia After Aneurysmal Subarachnoid Hemorrhage |
 |
Figure 7 Linearity association of admission serum homer scaffold protein 1 levels with likelihood of poor prognosis at 90-day mark following subarachnoid hemorrhage. Within the framework of restricted cubic spline analysis, admission serum homer scaffold protein 1 levels were linearly correlated with risk of 90-day poor prognosis post-subarachnoid hemorrhage (P for nonlinear >0.05). Abbreviation: Homer1, homer scaffold protein 1. |
 |
Figure 8 Assessment regarding prognostic effectiveness of admission serum homer scaffold protein 1 levels following subarachnoid hemorrhage. In the background of receiver operating characteristic curve analysis, admission serum homer scaffold protein 1 levels above 71.0 pg/mL distinguished poor prognosis risk at 90 days following subarachnoid hemorrhage with the maximum Youden index of 0.567. Abbreviations: AUC, area under curve; 95% CI, 95% confidence interval. |
The four independent predictors of poor prognosis at 90 days post-aSAH, that is WFNS, mFisher, DCI and serum homer1, were consolidated to construct a combined model for predicting a poor prognosis. The model was visually reflected by the nomogram, with total scores calculated from the four variables pointing to the corresponding risk of poor prognosis (Figure 9), had a good stability reflected by mean absolute error at 0.029 using the calibration curve analysis (Figure 10), exhibited an impactful clinical benefit manifested as being most away from both “all” and “none” lines among all variables employing the decision curve evaluation (Figure 11), showed significantly higher prognostic predictive ability than any of the four independent predictors under the ROC curve (all P values < 0.01; Figure 12).
 |
Figure 9 Nomogram visualizing the combined model of 90-day poor prognosis after aneurysmal subarachnoid hemorrhage. The nomogram was composed of delayed cerebral ischemia, serum homer scaffold protein 1 levels, modified Fisher scores and World Federation of Neurosurgical Societies Scale scores. Each variable corresponded to the designated scoring points. The summed total scores were used to reflect the risk of poor prognosis at ninety-day mark following subarachnoid hemorrhage. Abbreviations: DCI, delayed cerebral ischemia; WFNS, World Federation of Neurosurgical Societies Scale; mFisher, modified Fisher; homer1, homer scaffold protein 1. |
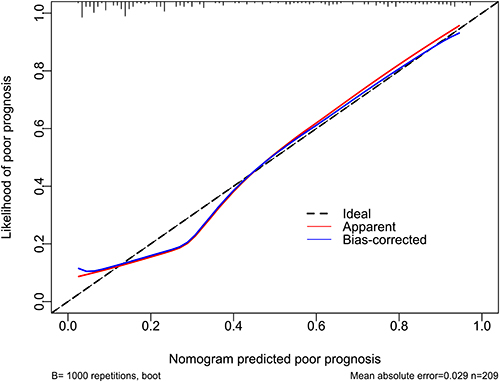 |
Figure 10 Calibration curve evaluating clinical stability of the combined model of 90-day poor prognosis after aneurysmal subarachnoid hemorrhage. Delayed cerebral ischemia, serum homer scaffold protein 1 levels, modified Fisher scores and World Federation of Neurosurgical Societies Scale scores composed the combined model of 90-day poor prognosis following aneurysmal subarachnoid hemorrhage. The model showed a good clinical stability due to low mean absolute error of 0.029 under the calibration curve. |
 |
Figure 11 Decision curve estimating clinical benefit of the combined model of 90-day poor prognosis after aneurysmal subarachnoid hemorrhage. The combined model of 90-day poor prognosis following aneurysmal subarachnoid hemorrhage was made up of delayed cerebral ischemia, serum homer scaffold protein 1 levels, modified Fisher scores and World Federation of Neurosurgical Societies Scale scores. The model was relatively valid among all five variables because it was most far away from both “none” and “all” lines based on the decision curve. Abbreviations: DCI, delayed cerebral ischemia; WFNS, World Federation of Neurosurgical Societies Scale; mFisher, modified Fisher; homer1, homer scaffold protein 1. |
 |
Figure 12 Receiver operating characteristic curve assessing discrimination efficiency of the combined model of 90-day poor prognosis following aneurysmal subarachnoid hemorrhage. The combined model of 90-day poor prognosis following aneurysmal subarachnoid hemorrhage comprised delayed cerebral ischemia, serum homer scaffold protein 1 levels, modified Fisher scores and World Federation of Neurosurgical Societies Scale scores. The model, as opposed to any of the preceding four variables, had a significantly elevated distinguishable ability for poor prognosis at 90 days after aneurysmal subarachnoid hemorrhage (all P values <0.01). **P<0.01. Abbreviations: DCI, delayed cerebral ischemia; WFNS, World Federation of Neurosurgical Societies Scale; mFisher, modified Fisher; homer1, homer scaffold protein 1; AUC, area under curve; 95% CI, 95% confidence interval. |
Mediation Role of DCI in Prognosis Association
Based on the restricted cubic spline analysis, admission homer1 levels exhibited a linear correlation with the risk of DCI (P value for nonlinear > 0.05; Figure 13). Compared to patients without DCI, those with DCI had significantly elevated WFNS scores, mFisher scores, blood glucose levels and admission serum homer1 levels, and displayed substantially increased percentages of acute hydrocephalus, external ventricular drainage and intraventricular entry of hemorrhage (all P values <0.05; Table 4). By integrating the prior seven variables into the binary logistic regression model, the mFisher scores (OR, 1.865; 95% CI, 1.115–3.118; VIF, 1.838; P = 0.017) and admission serum homer1 levels (OR, 1.021; 95% CI, 1.003–1.038; VIF, 1.585; P = 0.021) independently predict DCI. Furthermore, mediation analysis was performed to assess whether the association between serum homer1 levels the likelihood of poor prognosis was partially mediated by DCI. As shown in Figure 14, the association between admission serum homer1 levels and the probability of poor prognosis was partially mediated by DCI, and DCI accounted for 22.8% of this association.
 |
Figure 13 Restricted cubic spline evaluating linearity relationship between admission serum homer scaffold protein 1 levels and possibility of delayed cerebral ischemia following subarachnoid hemorrhage. There was a linear correlation between serum homo-scaffold protein 1 levels and the probability of delayed cerebral ischemia after subarachnoid hemorrhage (P for nonlinear >0.05). Abbreviation: Homer1, homer scaffold protein 1. |
 |
Figure 14 Mediation analysis determining mediation effect of delayed cerebral infarction. The association between admission serum homer scaffold protein 1 levels and the probability of poor prognosis after subarachnoid hemorrhage was partially mediated by delayed cerebral ischemia, with a mediation ratio of 22.8%. Abbreviations: Homer1, homer scaffold protein 1; β, beta. |
Discussion
To the best of our knowledge, this is the first prospective cohort study to measure serum homer1 levels after aSAH in humans. Serum homer1 levels of this cohort of aSAH patients were increased shortly after injury, reached the highest values on post-aSAH day 3, and remained significantly elevated values over controls until 14 days after aSAH. Serum homer1 levels were independently correlated with WFNS scores and mFisher scores. Ninety-day neurological outcome was assessed by using continuous, ordinal and binary GOS scores, and three multivariate analyses showed that serum homer1 levels were independently associated with poor neurological prognosis. Moreover, the prognosis model containing WFNS scores, mFisher scores, serum homer1 levels and DCI performed well. Interestingly, DCI partially mediated this prognosis association. Thus, serum homer1 may represent a potential prognostic biomarker of aSAH.
In mice subjected to permanent middle cerebral artery occlusion, homer1 was expressed in ischemic penumbral foci with the highest levels at postinjury eight hours.19 In another experimental study of intracerebral hemorrhage, homer1 expressions reached its highest levels on the third day post-injury and almost recovered to normal levels on the seventh day.17 An aggregate of 89 patients with acute ischemic stroke, who were admitted to the hospital from to 24–72 hours following the onset of symptoms, exhibited substantially elevated serum homer1 levels relative to a collective of 83 healthy controls.20 The above evidence alludes to assumption that serum homer1 levels may be elevated after aSAH.
In the current study of 209 patients with aSAH, serum homer1 levels of 209 patients were quantified in the early phase after stroke, with the median blood drawing time of 9.5 hours, and blood samples of 83 patients were also obtained at days 1, 3, 5, 7, 10, and 14 after aSAH. Moreover, the demographical, clinical, radiological and biochemical data were similar between all 209 patients and those 83 patients, signifying that these 83 patients could be highly representative of the entire group of patients. Moreover, in accordance with the previous studies,23–25 blood-collection time in the current study was designedly extended to 14 days after aSAH. Although a previous study found a significant elevation of serum homer1 levels after acute ischemic stroke,20 to the best of our knowledge, no other studies have done such an investigation, except that our study showed that serum homer1 levels peaked at day 3 post-aSAH and had significantly increased value over controls until day 14 following aSAH. Thus, our data may provide sufficient evidence to support the conception that blood levels of homer1 could be elevated quickly after aSAH and higher levels over normal status may persist for at least two weeks following injury.
Homer1 is prominently distributed in nervous system under normal conditions.16 At pathological state, increased expressions of homer1 were mainly localized in the neurons of mice after permanent middle cerebral artery occlusion19 and in the astrocytes of mice with intracerebral hemorrhage.17 Hence, it is reasonably believed that homer1 in the blood may be partially derived from the central nervous system. Nonetheless, a significant elevation in homer1 mRNA expression in peripheral blood leukocytes has been observed in humans with acute ischemic stroke.26 Thus, we cannot exclude the possibility that a fraction of homer1 in the blood from this cohort of aSAH patients may be obtained from peripheral blood cells.
It has been increasingly recognized that homer1 may be a protective factor against acute brain injury diseases,27–29 indicating that homer1 may be a potent therapeutic agent for acute brain injury. In consideration of homer1 as a protective protein,27–29 an upregulation of homer1 expressions in brain tissues17,19 may be a compensatory response to acute brain injury. Systemic inflammatory response syndrome, which is typical of system injury, is a paramount extracerebral adverse event of aSAH with close link to poor prognosis of patients.30–32 So, peripheral compensatory reaction to aSAH should be existent to homer1 protein. Overall, it is believed that a significant elevation of blood homer1 levels persisting until day 14 following aSAH may be a beneficial response to acute brain injury. In other words, an enhancement of blood homer1 levels may be a protective mechanism against acute brain injury subsequent to aSAH.
The WFNS and mFisher scales have been extensively used to mirror neurological outcomes in aSAH.2,3 In patients with acute ischemic stroke, admission serum homer1 levels were tightly correlated with the initial National Institute of Health Stroke Scale by applying unifactorial correlation analysis.20 To offer more powerful evidence to strengthen the hypothesis that serum homer1 may possess sufficient ability to evaluate illness severity of aSAH, assessments of linear relationships between admission serum homer1 levels, WFNS and mFisher scores were scheduled under the restricted cubic spline before bivariate correlation analyses were done. Moreover, independent correlations between admission serum homer1 levels, WFNS and mFisher scores were demonstrated using multivariable linear regression analysis. In summary, these findings shed light on the notion that serum homer1 may be a promising biomarker that can mirror the disease severity of aSAH.
In a cohort of 89 patients with acute ischemic stroke, admission serum homer1 levels independently anticipated three-month poor prognosis (modified Rankin scale scores of 3–6) with area under the ROC curve at 0.837.20 In this group of aSAH patients, the predictive areas of admission serum homer1 levels in all 209 patients and those 83 patients were, respectively, 0.775 and 0.814 for predicting a poor prognosis (GOS scores from 1 to 3) at the ninety-day mark following stroke. Moreover, the prognostic predictive ability of admission serum homer1 levels was analogous to those of post-injury days 1, 3, 5, and 7, and significantly exceed those of post-stroke days 10 and 15. Thus, it may be reasonably believed that admission serum homer1 levels could be capable of prognosticating clinical outcomes of patients with aSAH. Moreover, admission serum homer1 levels more than 71.0 pg/mL distinguished the probability of poor prognosis with the maximal Youden index at 0.567 in predicting poor prognosis with 67.5% sensitivity and 89.2 specificity. Hereby, admission serum homer1 levels were selected as a study variable for associating with clinical outcomes of human aSAH.
To ascertain the relationship between admission homer1 levels and neurological outcomes indicated by GOS at 90-day after aSAH, GOS was considered as a continuous variable or an ordinal categorical variable, or converted into a binary variable (GOS 1–3 versus 4–5). Univariate analysis was first performed to identify significantly distinct variables, and afterwards, those significantly different variables were forced into the multifactorial models, including linear regression model, binary logistic regression model and ordinal regression model. Serum homer1 levels, WFNS scores, mFisher scores, and DCI were independently associated with 90-day neurological outcomes. Likewise, admission serum homer1 levels independently discriminated patients at risk of three-month poor prognosis after acute ischemic stroke.20 These data support the hypothesis that serum homer1 may serve as a promising biochemical marker of poor prognosis after aSAH.
In our study, serum homer1 and the other three poor prognostic determinants (WFNS score, mFisher score, and DCI) were consolidated to construct a model. The model displayed robust clinical efficiency, validity, and stability using several statistical approaches, including the calibration curve, decision curve, and ROC curve analyses. Specifically, by referring to the nomogram, the total scores from the four independent predictors could mirror the risk of poor prognosis, thereby instructing clinical treatments and risk stratification; the model displayed higher clinical benefit as compared to the four independent predictors based on the decision curve; and the model had significantly higher prognostic predictive ability over the four independent predictors under the ROC curve. Overall, serum homer1 exhibited a good additive effect on the previous conventional metrics, that is DCI, WFNS and mFisher scales, further reinforcing serum homer1 as a potential prognostic biomarker from the other angle.
Here, we confirmed that serum homer1 levels could have the potential for clinical application as a prognostic biomarker in medical practice for severity stratification and prognosis prediction of aSAH, possibly leading to improvement of patient outcomes or refinement of risk stratification methods; however, nearly forty-five minutes are needed for immune analysis, and measurement cost is relatively high, clinical accessibility and feasibility of routine homer1 testing is limited. Nevertheless, with technological development and cost reduction of immune analysis, the clinical application of routine homer1 testing could be achieved in future.
Currently, serum homer1 was an independent predictor of DCI. Thus, significantly increased serum homer1 levels may be linked to the pathophysiological processes of DCI. Mediation analysis showed that DCI partially mediated the association between serum homer1 levels and poor prognosis, meaning that serum homer1 as a strong contributor to the poor prognosis of aSAH may be in part attributed to the partial mediation effect of DCI. Taking account of homer1 as a protective protein,27–29 elevated blood homer1 release may be a protective process in relieving DCI and improving clinical outcomes of patients with aSAH. In other words, it is inferred from the other aspect that homer1 may emerge as a potent therapeutic agent for secondary injury following aSAH. As expected, exploration of the therapeutic potential of homer1 and the mechanistic investigations will be the two hot topics in further studies.
This study had several limitations and strengths. The strengths of this study are as follows: (1) to the best of our knowledge, this is the first series using the prospective design and comprehensive analysis to explore serum homer1 levels after aSAH and subsequently reveal that serum homer1 may be a potential prognostic indicator of aSAH and this association may be partially mediated by DCI, so the novelty may proffer insights into clinical studies regarding prognostic role of serum homer1 in aSAH; (2) the correlation of serum homer1 levels with severity and its association with prognosis were all statistically confirmed here using various multivariate analyses, leading to statistically powerful reliability and scientificity in conclusions, and therefore a strong impetus would be provided from this study for facilitating in-depth analysis of serum homer1 as a prognostic biomarker of aSAH. The limitations are that (1) although we came to the conclusion based on the statistically enough sample size of 209 patients that serum homer1 may have the potential as a prognostic metric of aSAH, the conclusions could be imperatively validated by deploying a larger cohort study before serum homer1 could be formally applied in clinical practice; (2) to determine the prognosis prediction ability of serum homer1 levels at multiple time points, a collective of 83 patients accepted continual blood drawings, but this sample size may be inadequate for overall analysis, and therefore to increase the sample size is a selectable modality in the later study; (3) the designated time intervals at 14 days after aSAH may not be completely adequate for such clinical analysis given that serum homer1 levels had not recovered to normal status at day 14 in this cohort; therefore, increasing the time points will be an optimal choice in future research; (4) the study’s reliance on self-reported consent for multiple blood collections introduces potential selection bias, and although the subgroup had consistent baseline data as all patients, a random selection of such patients will be better in subsequent studies; (5) in this study, the prognosis model has been compared with the conventional clinical scales, that is WFNS and mFisher, showing that the model may be of clinical value. However, the comparison of serum homer1 levels with other biomarkers is limited. Expanding on this comparison in future would provide better context for the significance of homer1 as a prognostic marker.
Conclusions
Serum homer1 levels are markedly elevated during 14 days after aSAH, are independently correlated with aSAH severity and are independently predictive of DCI and 90-day poor prognosis following aSAH. Thus, serum homer1 could be applied as a prognostic biomarker in medical practice for severity stratification and prognosis prediction of aSAH, thereby improving patient outcomes and refining risk stratification methods. Also, homer1 may be a potential therapeutic agent for secondary injury following aSAH. Nevertheless, associational mechanism of serum homer1 with poor prognosis mediated by DCI warrants to be further unveiled.
Data Sharing Statement
The datasets generated and/or analyzed during the current study are not publicly available because they are personal data but are available from the corresponding author upon reasonable request.
Acknowledgments
We gratefully thank all study participants, their relatives, and the staff at the recruitment centers for their invaluable contributions.
Funding
This work was financially supported by grants from the Zhejiang Provincial Public Welfare Research Project (No. LGD21H090005, LGD22H090014), and Medical Health Science and Technology Project of Zhejiang Provincial Health Commission (No.2022KY1199).
Disclosure
The authors declared no potential conflict of interest.
References
1. van Gijn J, Kerr RS, Rinkel GJ. Subarachnoid hemorrhage. Lancet. 2007;369(9558):306–318. doi:10.1016/S0140-6736(07)60153-6
2. Halder A, Das KK, Kanjilal S, et al. Under recognized yet a clinically relevant impact of aneurysm location in Distal Anterior Cerebral Artery (DACA) aneurysms: insights from a contemporary surgical experience. Neurosurg Rev. 2024;47(1):517. doi:10.1007/s10143-024-02759-5
3. Hamming A, van Dijck J, Singh R, Peul W, Moojen W. Comparison of long-term clinical outcome after endovascular versus neurosurgical treatment of ruptured intracranial anterior circulation aneurysms: a single-centre experience. Brain Spine. 2024;4:102902. doi:10.1016/j.bas.2024.102902
4. Sun Z, Xue F, Wang K, Zhang D, Dong M, Zhang J. A nomogram model for predicting postoperative prognosis in patients with aneurysmal subarachnoid hemorrhage using preoperative biochemical indices. BMC Neurol. 2024;24(1):270. doi:10.1186/s12883-024-03774-1
5. Wang C, Sun J, Liu J. Clinical effect of external ventricular drainage under intracranial pressure monitoring in the treatment of aneurysmal subarachnoid hemorrhage patients and investigation of the mechanism of miR-146a-5p/STC1 axis in inhibiting early brain injury in aneurys. Cell Mol Biol. 2024;70(5):295–302. doi:10.14715/cmb/2024.70.5.44
6. Lauzier DC, Jayaraman K, Yuan JY, et al. Early brain injury after subarachnoid hemorrhage: incidence and mechanisms. Stroke. 2023;54(5):1426–1440. doi:10.1161/STROKEAHA.122.040072
7. Topkoru B, Egemen E, Solaroglu I, Zhang JH. Early brain injury or vasospasm? An overview of common mechanisms. Curr Drug Targets. 2017;18(12):1424–1429. doi:10.2174/1389450117666160905112923
8. Macdonald RL. Delayed neurological deterioration after subarachnoid. Hemorrhage Nat Rev Neurol. 2014;10(1):44–58. doi:10.1038/nrneurol.2013.246
9. Xiao ZK, Wang B, Liu JH, et al. Risk factors for the development of delayed cerebral ischemia after aneurysmal subarachnoid hemorrhage: a systematic review and meta-analysis. World Neurosurg. 2024;193:427–446. doi:10.1016/j.wneu.2024.09.104
10. Provencio JJ, Inkelas S, Vergouwen MDI. Delayed cerebral ischemia after aneurysmal subarachnoid hemorrhage: the role of the complement and innate immune system. Transl Stroke Res. 2024;16(1):18–24. doi:10.1007/s12975-024-01290-5
11. Wang L, Zhou H, Zheng W, et al. Clinical value of serum complement component 1q levels in the prognostic analysis of aneurysmal subarachnoid hemorrhage: a prospective cohort study. Front Neurol. 2024;15:1341731. doi:10.3389/fneur.2024.1341731
12. Yan T, Chen Z, Zou S, et al. A prospective cohort study on serum A20 as a prognostic biomarker of aneurysmal subarachnoid hemorrhage. World J Emerg Med. 2023;14(5):360–366. doi:10.5847/wjem.j.1920-8642.2023.079
13. Wu X, Ji D, Wang Z, et al. Elevated serum NOX2 levels contribute to delayed cerebral ischemia and a poor prognosis after aneurysmal subarachnoid hemorrhage: a prospective cohort study. Neuropsychiatr Dis Treat. 2023;19:1027–1042. doi:10.2147/NDT.S407907
14. Yu S, Wang G, Yao B, Xiao L, Tuo H. Arc and Homer1 are involved in comorbid epilepsy and depression: a microarray data analysis. Epilepsy Behav. 2022;132:108738. doi:10.1016/j.yebeh.2022.108738
15. Luo P, Li X, Fei Z, Poon W. Scaffold protein Homer 1: implications for neurological diseases. Neurochem Int. 2012;61(5):731–738. doi:10.1016/j.neuint.2012.06.014
16. Jähne S, Mikulasch F, Heuer HGH, et al. Presynaptic activity and protein turnover are correlated at the single-synapse level. Cell Rep. 2021;34(11):108841. doi:10.1016/j.celrep.2021.108841
17. Fei X, Dou YN, Wang L, et al. Homer1 promotes the conversion of A1 astrocytes to A2 astrocytes and improves the recovery of transgenic mice after intracerebral hemorrhage. J Neuroinflammation. 2022;19(1):67. doi:10.1186/s12974-022-02428-8
18. Luo P, Chen T, Zhao Y, et al. Postsynaptic scaffold protein Homer 1a protects against traumatic brain injury via regulating group I metabotropic glutamate receptors. Cell Death Dis. 2014;5(4):e1174. doi:10.1038/cddis.2014.116
19. Lv W, Zhang Q, Li Y, et al. Homer1 ameliorates ischemic stroke by inhibiting necroptosis-induced neuronal damage and neuroinflammation. Inflamm Res. 2024;73(1):131–144. doi:10.1007/s00011-023-01824-x
20. Lv W, Ruan Z, Zhang Q, et al. Serum homer1 is a novel biomarker for predicting the clinical outcomes of acute ischemic stroke patients. J Inflamm Res. 2024;17:1337–1347. doi:10.2147/JIR.S453018
21. Vergouwen MD, Vermeulen M, van Gijn J, et al. Definition of delayed cerebral ischemia after aneurysmal subarachnoid hemorrhage as an outcome event in clinical trials and observational studies: proposal of a multidisciplinary research group. Stroke. 2010;41(10):2391–2395. doi:10.1161/STROKEAHA.110.589275
22. Biluts Mersha H, Bogale Megerssa T. Microsurgical treatment of ruptured intracranial aneurysms: an Ethiopian experience. World Neurosurg X. 2024;23:100363. doi:10.1016/j.wnsx.2024.100363
23. Chen Z, Zou S, Shan H, et al. Longitudinal change of serum AIM2 levels after aneurysmal subarachnoid hemorrhage and its prognostic significance: a two-center prospective cohort study. Sci Rep. 2024;14(1):10430. doi:10.1038/s41598-024-61185-1
24. Ohgaki F, Tatezuki J, Takemoto Y, Miyazaki K, Mochimatsu Y. Serum C-reactive protein value on day 14 as a possible prognostic factor of aneurysmal subarachnoid hemorrhage. J Int Med Res. 2024;52(5):3000605241253755. doi:10.1177/03000605241253755
25. Wang D, Ma L, Li Z, Ye G, Chen M. Serum sestrin2 emerges as a prognostic biomarker of human aneurysmal subarachnoid hemorrhage: a prospective observational cohort single-center study. Int J Gen Med. 2023;16:3869–3887. doi:10.2147/IJGM.S428011
26. Zhu M, Zuo J, Shen J, et al. Diagnostic potential of differentially expressed homer1 and homer2 in ischemic stroke. Cell Physiol Biochem. 2016;39(6):2353–2363. doi:10.1159/000447927
27. Saadh MJ, Castillo-Acobo RY, Baher H, et al. The protective role of sulforaphane and Homer1a in retinal ischemia-reperfusion injury: unraveling the neuroprotective interplay. Life Sci. 2023;329:121968. doi:10.1016/j.lfs.2023.121968
28. Dou Y, Fei X, He X, et al. Homer1a reduces inflammatory response after retinal ischemia/reperfusion injury. Neural Regen Res. 2024;19(7):1608–1617. doi:10.4103/1673-5374.386490
29. Fei X, Wang L, Dou YN, et al. Extracellular vesicle encapsulated Homer1a as novel nanotherapeutics against intracerebral hemorrhage in a mouse model. J Neuroinflammation. 2024;21(1):85. doi:10.1186/s12974-024-03088-6
30. Chai CZ, Ho UC, Kuo LT. Systemic inflammation after aneurysmal subarachnoid hemorrhage. Int J mol Sci. 2023;24(13):10943. doi:10.3390/ijms241310943
31. Wang X, Tian W, Zhao Y, Yang Y, Deng L. Systemic immune inflammation index and system inflammation response index on the third postoperative day predict poor prognosis of aneurysmal subarachnoid hemorrhage patients. Medicine. 2024;103(16):e37818. doi:10.1097/MD.0000000000037818
32. Li T, Li R, Lin F, Chen X. A mediation analysis of the association between systemic inflammation response index, in-hospital complications, and poor long-term functional outcomes in patients with aneurysmal subarachnoid hemorrhage: insights from a large prospective cohort study. J Inflamm Res. 2024;17:3697–3708. doi:10.2147/JIR.S460364
 © 2025 The Author(s). This work is published and licensed by Dove Medical Press Limited. The
full terms of this license are available at https://www.dovepress.com/terms
and incorporate the Creative Commons Attribution
- Non Commercial (unported, 3.0) License.
By accessing the work you hereby accept the Terms. Non-commercial uses of the work are permitted
without any further permission from Dove Medical Press Limited, provided the work is properly
attributed. For permission for commercial use of this work, please see paragraphs 4.2 and 5 of our Terms.
© 2025 The Author(s). This work is published and licensed by Dove Medical Press Limited. The
full terms of this license are available at https://www.dovepress.com/terms
and incorporate the Creative Commons Attribution
- Non Commercial (unported, 3.0) License.
By accessing the work you hereby accept the Terms. Non-commercial uses of the work are permitted
without any further permission from Dove Medical Press Limited, provided the work is properly
attributed. For permission for commercial use of this work, please see paragraphs 4.2 and 5 of our Terms.
Recommended articles
Serum Soluble Scavenger Receptor A Levels are Associated with Delayed Cerebral Ischemia and Poor Clinical Outcome After Aneurysmal Subarachnoid Hemorrhage: A Prospective Observational Study
Jiang F, Chen Z, Hu J, Liu Q
Neuropsychiatric Disease and Treatment 2022, 18:2529-2541
Published Date: 2 November 2022
Declined Serum Resolvin D1 Levels to Predict Severity and Prognosis of Human Aneurysmal Subarachnoid Hemorrhage: A Prospective Cohort Study
Yu D, Jiang F, Xu W, He P, Chen F, Liu X, Bao X
Neuropsychiatric Disease and Treatment 2023, 19:1463-1476
Published Date: 27 June 2023
Serum Sestrin2 Emerges as a Prognostic Biomarker of Human Aneurysmal Subarachnoid Hemorrhage: A Prospective Observational Cohort Single-Center Study
Wang D, Ma L, Li Z, Ye G, Chen M
International Journal of General Medicine 2023, 16:3869-3887
Published Date: 28 August 2023
Clinical Value of Serum Secretoneurin Levels in Prediction of Delayed Cerebral Ischemia and Prognostic Analysis of Aneurysmal Subarachnoid Hemorrhage: A Prospective Cohort Study
Ma J, Huang X, Hu Y, Xu B, Jin C
International Journal of General Medicine 2024, 17:3555-3573
Published Date: 16 August 2024
Development and Validation of a Nomogram Model for Assessing the Impact of Continuous Lumbar Drainage Volume on Prognosis in Patients with Acute Hydrocephalus After Aneurysmal Subarachnoid Hemorrhage
Wen T, Su J, Yang X, Tan J, He Z
International Journal of General Medicine 2026, 19:587564
Published Date: 12 May 2026