Back to Journals » Diabetes, Metabolic Syndrome and Obesity » Volume 15
Tang-Ping-San Decoction Remodel Intestinal Flora and Barrier to Ameliorate Type 2 Diabetes Mellitus in Rodent Model
Authors Yin W, Zhang SQ, Pang WL, Chen XJ, Wen J, Hou J, Wang C, Song LY ![]() , Qiu ZM, Liang PT, Yuan JL, Yang ZS, Bian Y
, Qiu ZM, Liang PT, Yuan JL, Yang ZS, Bian Y
Received 20 May 2022
Accepted for publication 16 August 2022
Published 20 August 2022 Volume 2022:15 Pages 2563—2581
DOI https://doi.org/10.2147/DMSO.S375572
Checked for plagiarism Yes
Review by Single anonymous peer review
Peer reviewer comments 2
Editor who approved publication: Prof. Dr. Juei-Tang Cheng
Wen Yin,* Si-Qi Zhang,* Wen-Lin Pang,* Xiao-Jiao Chen, Jing Wen, Jiong Hou, Cui Wang, Li-Yun Song, Zhen-Ming Qiu, Peng-Tao Liang, Jia-Li Yuan, Zhong-Shan Yang, Yao Bian
Yunnan Provincial Key Laboratory of Molecular Biology for Sinomedicine, Yunnan University of Chinese Medicine, Kunming, Yunnan, People’s Republic of China
*These authors contributed equally to this work
Correspondence: Zhong-Shan Yang; Yao Bian, Yunnan University of Chinese Medicine, Kunming, Yunnan, People’s Republic of China, Tel +86-871-65919932, Email [email protected]; [email protected]
Purpose: Type 2 diabetes mellitus (T2DM) is a complex genetic disease associated with genetic and environmental factors. Previous studies have shown that changes in the gut microbiota may affect the development of host metabolic diseases and promote the progression of T2DM. Tang-ping-san (TPS) decoction can effectively treat T2DM. However, its specific mechanisms must be evaluated.
Patients and Methods: In the present study, we established an animal model of T2DM using a high‑fat diet (HFD) with intraperitoneal injection streptozotocin injection.
Results: The therapeutic effect of TPS decoction on T2DM in mice was initially evaluated. TPS decoction was found to improve hyperglycemia, hyperlipidemia, insulin resistance, and pathological liver, pancreatic, and colon changes. Moreover, it reduced the pro-inflammatory cytokine levels. Based on 16SrRNA sequencing, TPS decoction reduced the Firmicutes/Bacteroidetes ratio at the phylum level. At the genus level, it increased the relative abundances of Akkermansia, Muribaculaceae, and the Eubacterium coprostanoligenes group and decreased the relative abundance of Fusobacterium, Escherichia coli, Dubosiella, and Helicobacter.
Conclusion: TPS decoction improves T2DM and liver function and reduces the risk of hyperglycemia, hyperlipidemia, insulin resistance, pathological organ changes, and inflammatory reactions. The mechanism of TPS decoction in T2DM can be correlated with the reversal of gut microbiota dysfunction and repair of the intestinal mucosal barrier.
Keywords: type 2 diabetes mellitus, tang-ping-san decoction, gut microbiota, glycolipid metabolism, insulin resistance
Introduction
Type 2 diabetes (T2DM) is a complex endocrine disease associated with several environmental and genetic factors. The final endpoint of this condition is pancreatic islet failure or insufficient insulin (INS) action causing high blood glucose levels.1 T2DM poses global burdens and the number of patients with T2DM can reach up to 642 million in 2040.2 Nevertheless, the causes of T2DM have not been completely elucidated. The lack of effective treatments is a significant challenge worldwide.
As the second genome in humans, the gut microbiota (GM) has a close relationship with immunity, intestinal inflammation, and mental and metabolic diseases.3–5 Previous studies have shown that GM is involved in glucose metabolism disorders and insulin resistance (IR). Patients with T2DM can develop GM imbalance.6
The human intestine is a complex micro-ecosystem. Several bacteria participate in host metabolism. Under physiological conditions, the GM maintains glycolipid metabolism stability by digesting and absorbing food and by generating metabolites.7 Unhealthy eating habits can disrupt intestinal bacteria, which alters host metabolism leading to T2DM. Compared with healthy people, patients with T2DM had a lower abundance of Lactobacillus and Akkermansia in the gut and a higher abundance of harmful bacteria such as Enterobacteriaceae.8 Abnormal metabolite levels secondary to intestinal flora disorders are associated with inflammation, IR, and glucose and lipid metabolism disorders.9 Probiotics such as Roseburia, Bacteroides, Akkermansia, and Lactobacillus can help treat glucose metabolism disorders and restore INS sensitivity.10 Metformin alters the abundance of Bacteroidetes, Escherichia, and other bacteria to maintain the intestinal barrier and promote the production of short-chain fatty acids (SCFAs). These mechanisms alter bile acid metabolism and decrease blood glucose levels.11
High-fat and high-sugar diets change the GM and cause intestinal inflammation by destroying tight junctions, increasing intestinal tract permeability,12,13 producing lipopolysaccharide (LPS), altering the bacterial composition, and allowing the entry of intestinal flora into the circulation. These phenomena result in chronic metabolic inflammation, IR, and T2DM exacerbation.14
Elevated serum LPS levels are referred to as metabolic endotoxemia, and the primary mechanisms are alteration of the intestinal flora and destruction of intestinal mucosal barrier function. Metabolic endotoxemia is believed to be associated with the development of T2DM,15 obesity, and INS resistance.16 These findings suggest that modifying intestinal flora and maintaining the integrity of the intestinal mucosal barrier might be beneficial for patients with T2DM.14
For several thousands of years, traditional Chinese medicine has been used for treating diabetes. A meta-analysis showed that traditional Chinese medicine could decrease the risk of T2DM development and could restore normal blood glucose levels.17 The mechanisms of traditional Chinese medicine in T2DM treatment should be elucidated as they can provide a basis for the research and development of novel medicines.
Modifying intestinal flora is an essential target of traditional Chinese medicine for treating T2DM. Berberine can decrease the abundance of pathogenic bacteria and can increases the abundance of Blautia and Allobaculum in the intestinal tract of HFD rats. SCFAs are important signaling molecules that regulate energy in the human body, which can inhibit the growth of harmful bacteria, enhance intestinal mucosal barrier function, reduce inflammation, and improve insulin resistance.18 Curcumin can significantly improve INS resistance and reduce blood glucose levels in T2DM mice.19 In a previous study, Rehmannia glutinosa stachyose was used to treat T2DM rats. Results showed that the treatment group had significantly lower blood glucose levels and higher INS levels than the model group. This phenomenon improved the intestinal micro ecological environment of T2DM rats. From the perspective of intestinal flora, Rehmannia glutinosa stachyose is effective against T2DM.20 Polygonatum sibiricum polysaccharide improved impaired glucose tolerance and decreased fasting blood glucose levels and glycosylated hemoglobin levels in T2DM mice.21 Polygonatum sibiricum polysaccharide regulated intestinal flora disorders in T2DM mice, which then significantly decreased the abundance of pathogenic bacteria, including the rumen cocci of Firmicutes, and increased the abundance of beneficial bacteria such as Bacteroidetes, which mediate the bidirectional regulation of blood glucose levels and intestinal flora.22 A high number of Parabacteroides, Blautia, and Akkermansia decreases the abundance of Aerococcus, Staphylococcus, and Corynebacterium microbiota. Huang-Lian-Jie-Du decoction improved lipid and bile acid metabolism and IR in T2DM mice.23
Tang-ping-san (TPS) decoction is a formula used to treat T2DM. It comprises Astragalus mongholicus, the root of the kudzu vine, the rhizome of Chinese goldthread, parched hawthorn fruit, stir-baked semen Raphani, Polygonatum sibiricum Delar, Lycii radices cortex, Eucommia ulmoides Oliver, and fried Anemarrhena. Our previous study found that patients with T2DM treated with TPS decoction had lower fasting blood glucose (FBG) levels and postprandial blood glucose levels than those treated with metformin. Moreover, their clinical symptoms were relieved. Nevertheless, the mechanisms of action of TPS decoction in T2DM are unclear. Therefore, the effects of TPS decoction were evaluated using an experimental T2DM model to determine the associated mechanisms.
Materials and Methods
T2DM Animal Experiment
The T2DM mouse model was established by destroying pancreatic β cells and promoting INS resistance by adopting high-fat diet feeding and by administering streptozotocin intraperitoneally (Sigma, the USA). In total, 46 SPF grade C57/BL6 male mice (weight: 16 ± 2 g, SBF Biotechnology Co., Ltd., Beijing) received adaptive feeding for 1 week, and 40 mice were randomly selected for high-fat diet feeding for 6 weeks (D12492, Research Diets, the USA) (Supplementary Material: Table S1). The streptozotocin solution with a pH of 4.5 was prepared using 0.01 mol/L of sodium citrate buffer and was administered intraperitoneally at a dose of 100 mg/kg. After 72 h, the blood glucose level in the tail vein samples was assessed. Results showed that the FGB level was > 11.1 mmol/L, which remained stable for 7 days. Finally, the T2DM mouse model was established successfully. Six mice that were fed with basal diet were included in the control group (M10110C2, Moldiets, China) (Supplementary Material: Table S2). Mice that successfully developed T2DM were randomly divided into the model and tang-ping-san low-, medium-, and high-dose groups (TPS-L, TPS-M, and TPS-H, respectively). The decoction was administered at ½ of the clinical equivalent dose for 1 and 2 times. The control and model groups received physiological saline at corresponding volumes. Then, the animals received oral administration at a specific time per day for 28 days. In the experimental period, the appetite, hair, stool, weight, behavior, and overall status of all the groups were evaluated, and the data were recorded. After the oral administration was completed, all mice were subjected to fasting overnight, and they were anesthetized via the intraperitoneal administration of chloral hydrate. Blood samples were collected from the eyeball, liver, pancreas, and proximal colon and were stored at −80°C. All experimental protocols were approved by the Animal Care and Use Committee of Yunnan University of Traditional Chinese Medicine. All procedures were conducted based on the Care and Use of Laboratory Animals published by the US National Institute of Health.
Morphological Examination
The tissue was fixed in 4% paraformaldehyde (Beyotime, China), dehydrated, and embedded in paraffin. Paraffin-embedded tissues were then sectioned and morphological changes were evaluated under a light microscope after hematoxylin and eosin (H&E) or oil red staining.
Assessment of Weight, Blood Glucose Levels, and Glucose Tolerance
The body weight of mice was measured at 10 am every Sunday, and the FBG levels at the tail tip were evaluated to assess changes in blood glucose levels. After the final treatment, the mice were subjected to fasting for 12 h. Then, the mice in each group received glucose treatment at a dose of 2 g/kg. The blood glucose levels were evaluated at 0, 30, 60, and 120 min using a portable blood glucose monitor using the blood samples collected from the tail vein. The curve of blood glucose concentrations was drawn along with time changes. Next, the area under the curve was calculated.
Evaluation of Insulin Resistance and Sensitivity Indexes
The mice fasted for 12 h, and they were anesthetized with 4% chloral hydrate. Then, blood samples were collected from the eyeball, and the serum was obtained via centrifugation at 3500 rpm/min for 15 min. Next, the INS levels were assessed using enzyme-linked immunoassay (ELISA). The detailed procedures were conducted based on the instructions of the kit (Jiangsu Meibiao Biotechnology Co., Ltd.). The Homeostatic Model Assessment for Insulin Resistance (HOMA-IR) score was calculated as (FBG level × fasting insulin [FINS] level)/22.5.
Biochemical Analyses
Blood and serum samples were collected, as described in Section 2.6. The lipopolysaccharide (LPS), tumor necrosis factor-alpha (TNF-α), interleukin (IL)-4, IL-10, IL-1β, and IL-6 levels were assessed using enzyme-linked immunoassay (Jiangsu Meibiao Biotechnology Co., Ltd). The total cholesterol (TC), total glyceride (TG), low-density lipoprotein cholesterol (LDL-C), high-density lipoprotein cholesterol (HDL-C), aspartate aminotransferase (AST), and alanine transaminase (ALT) levels were investigated using the microplate test (Jiancheng Bioengineering Institute, Nanjing, China). All procedures were conducted based on the instructions of each kit.
Assessment of Liver Glycogen Levels
Approximate volumes of liver tissue samples were collected from the mice. Then, a specific volume of phosphate-buffered saline (pH 7.4) was added. The samples were placed into a homogenizer and were centrifuged at 3000 rpm/min for 20 min after complete homogenization to collect the supernatants. The glycogen concentrations of mice were evaluated using ELISA. The surgery was performed using the instructions of each kit (Jiangsu Meibiao Biotechnology Co., Ltd.).
Detection of Tight Junction Protein Expression in the Intestinal Tissues
The protein expression levels of ZO-1, claudin 1, and occludin in the intestinal tissues of mice were assessed via Western blotting. The total protein in each intestinal tissue was evaluated. Then, the samples were added with 6 × loading buffer and were boiled for 6 min. Next, 12% and 10% separating gel and 5% concentrated gel were prepared, and 50 µg of protein was loaded into each well. The total proteins were separated via polyacrylamide gel electrophoresis, and it was transferred to a PVDF film using the wet method. Seal milk powder with 5% skimmed for 2 hours. After dilution with ZO-1 (BIOSS, bs-1329R), claudin 1 (Servicebio, GB112543), and occludin (Servicebio, GB111401) based on the manufacturer’s instructions, add them to the PVDF film to ensure that the film is completely covered. The samples were incubated overnight in a shaker at a temperature of 4 °C. After rinsing with Tris buffered saline + Tween 20 on the second day, the dilution was added (Biosharp, BL003A), incubated at room temperature for 2 h, and ECL reagent was added after rinsing was completed. Next, the gray value on the strip was read using the Image J software.
Assessment of Intestinal Flora in Mice
Fresh feces were collected in a sterile cryopreservation tube, and intestinal flora was analyzed. polymerase chain reaction and high-throughput sequencing were completed by Shanghai Biotree Biomedical Biotechnology Co., Ltd.
Drug Preparation and Analysis
According to the formula of the equivalent dose ratio calculated based on the human and animal body surface area, the equivalent dose was calculated. The following components were used to prepare TPS decoction: astragalus propinquus schischkin, the root of kudzu vine, the rhizome of Chinese goldthread, parched hawthorn fruit, stir-baked semen Raphani, Polygonatum sibiricum Delar, Lycii radices cortex, Eucommia ulmoides Oliver, and fried Anemarrhena (Yunnan Zongshun Biotechnology Co., Ltd.). Quality of the medicinal materials: the volume of the water =1:8. The volume of water was added, and the mixture was boiled for 30 min. Next, it was grouped into three doses according to specific concentrations, which were as follows: 0.8 g of crude drug/mL (TPS-L group), 1.6 g of crude drug/mL (TPS-M group), and 3.2 g of crude drug/mL (TPS-H group). In total, 2 mL of 1.6 g of crude drug/mL liquid medicine was collected, and the sample was sent to Shanghai Biotree Biomedical Biotechnology Co., Ltd., for liquid chromatography with tandem mass spectrometry.
The procedures were performed using the UHPLC system (Vanquish, Thermo Fisher Scientific), and UPLC BEH C18 chromatographic column (1.7 μm 2.1 *100 mm) was utilized to perform liquid chromatography with tandem mass spectrometry. The elution gradients were as follows: 0–3.5 min, 95%–85% A; 3.5–6 min, 85%–70% A; 6–6.5 min, 70%–70% A; 6.5–12 min, 70%–30% A; 12–12.5 min, 30%–30% A; 12.5–18 min, 30%–0% A; 18–25 min, 0%–0% A; 25–26 min, 0%–95% A; and 26–30 min, 95%–95%. The flow speed was set at 0.4 mL/min and the injection volume at 5 μL. The mobile phase comprised 0.1% formic acid aqueous solution (A) and 0.1% formic acid acetonitrile solution (B).
Using information-dependent acquisition, the mass spectrometry (MS) and MS/MS data were obtained using Orbitrap Exploris 120 and Xcalibur. In all acquisition periods, the mass number ranged from 100 to 1500. The first four numbers were selected in each cycle to obtain the corresponding MS/MS data. The sheath gas velocity was 30 Arb; the auxiliary gas flow rate, 10 Arb; the ion transfer tube temperature, 350°C; the evaporator temperature, 350 °C; the full millisecond resolution, 60,000; the MS/MS resolution, 15,000; the collision energy, 42 in the mode of 16/38/ NCE; and the spraying voltage, 5.5 kV (positive) or −4 kV (negative).
Statistical Analysis
The Statistical Package for the Social Sciences software version 21.0 was used in statistical analyses. Experimental data were presented as mean ± standard deviation (`x ± s) using analysis of variance and the t-test. A P value of<0.05 was considered statistically significant.
Results
Identification of Primary Compounds in TPS Decoction via UPLC-OE-MS
Aqueous extracts were analyzed to establish the fingerprint of TPS decoction, as shown in Table 1. These include palmatine, jatrorrhizine, epiberberine, kukoamine B, berberine, daidzein, dehydrocorydaline, 5-hydroxymethylfurfural, isoleucine, sinapine, betaine, daidzein-8-C-glucoside, citric acid, fumaric acid, 7-hydroxycoumarin, salicylic acid, 5-OXO-D-PROLINE, quercetin-3-O-galactoside, caffeic acid, soyasapogenol B base + O-HexA-Pen-dHex, and protocatechualdehyde. One or more of these substances might be the primary active components of TPS decoction (Figures 1 and 2).
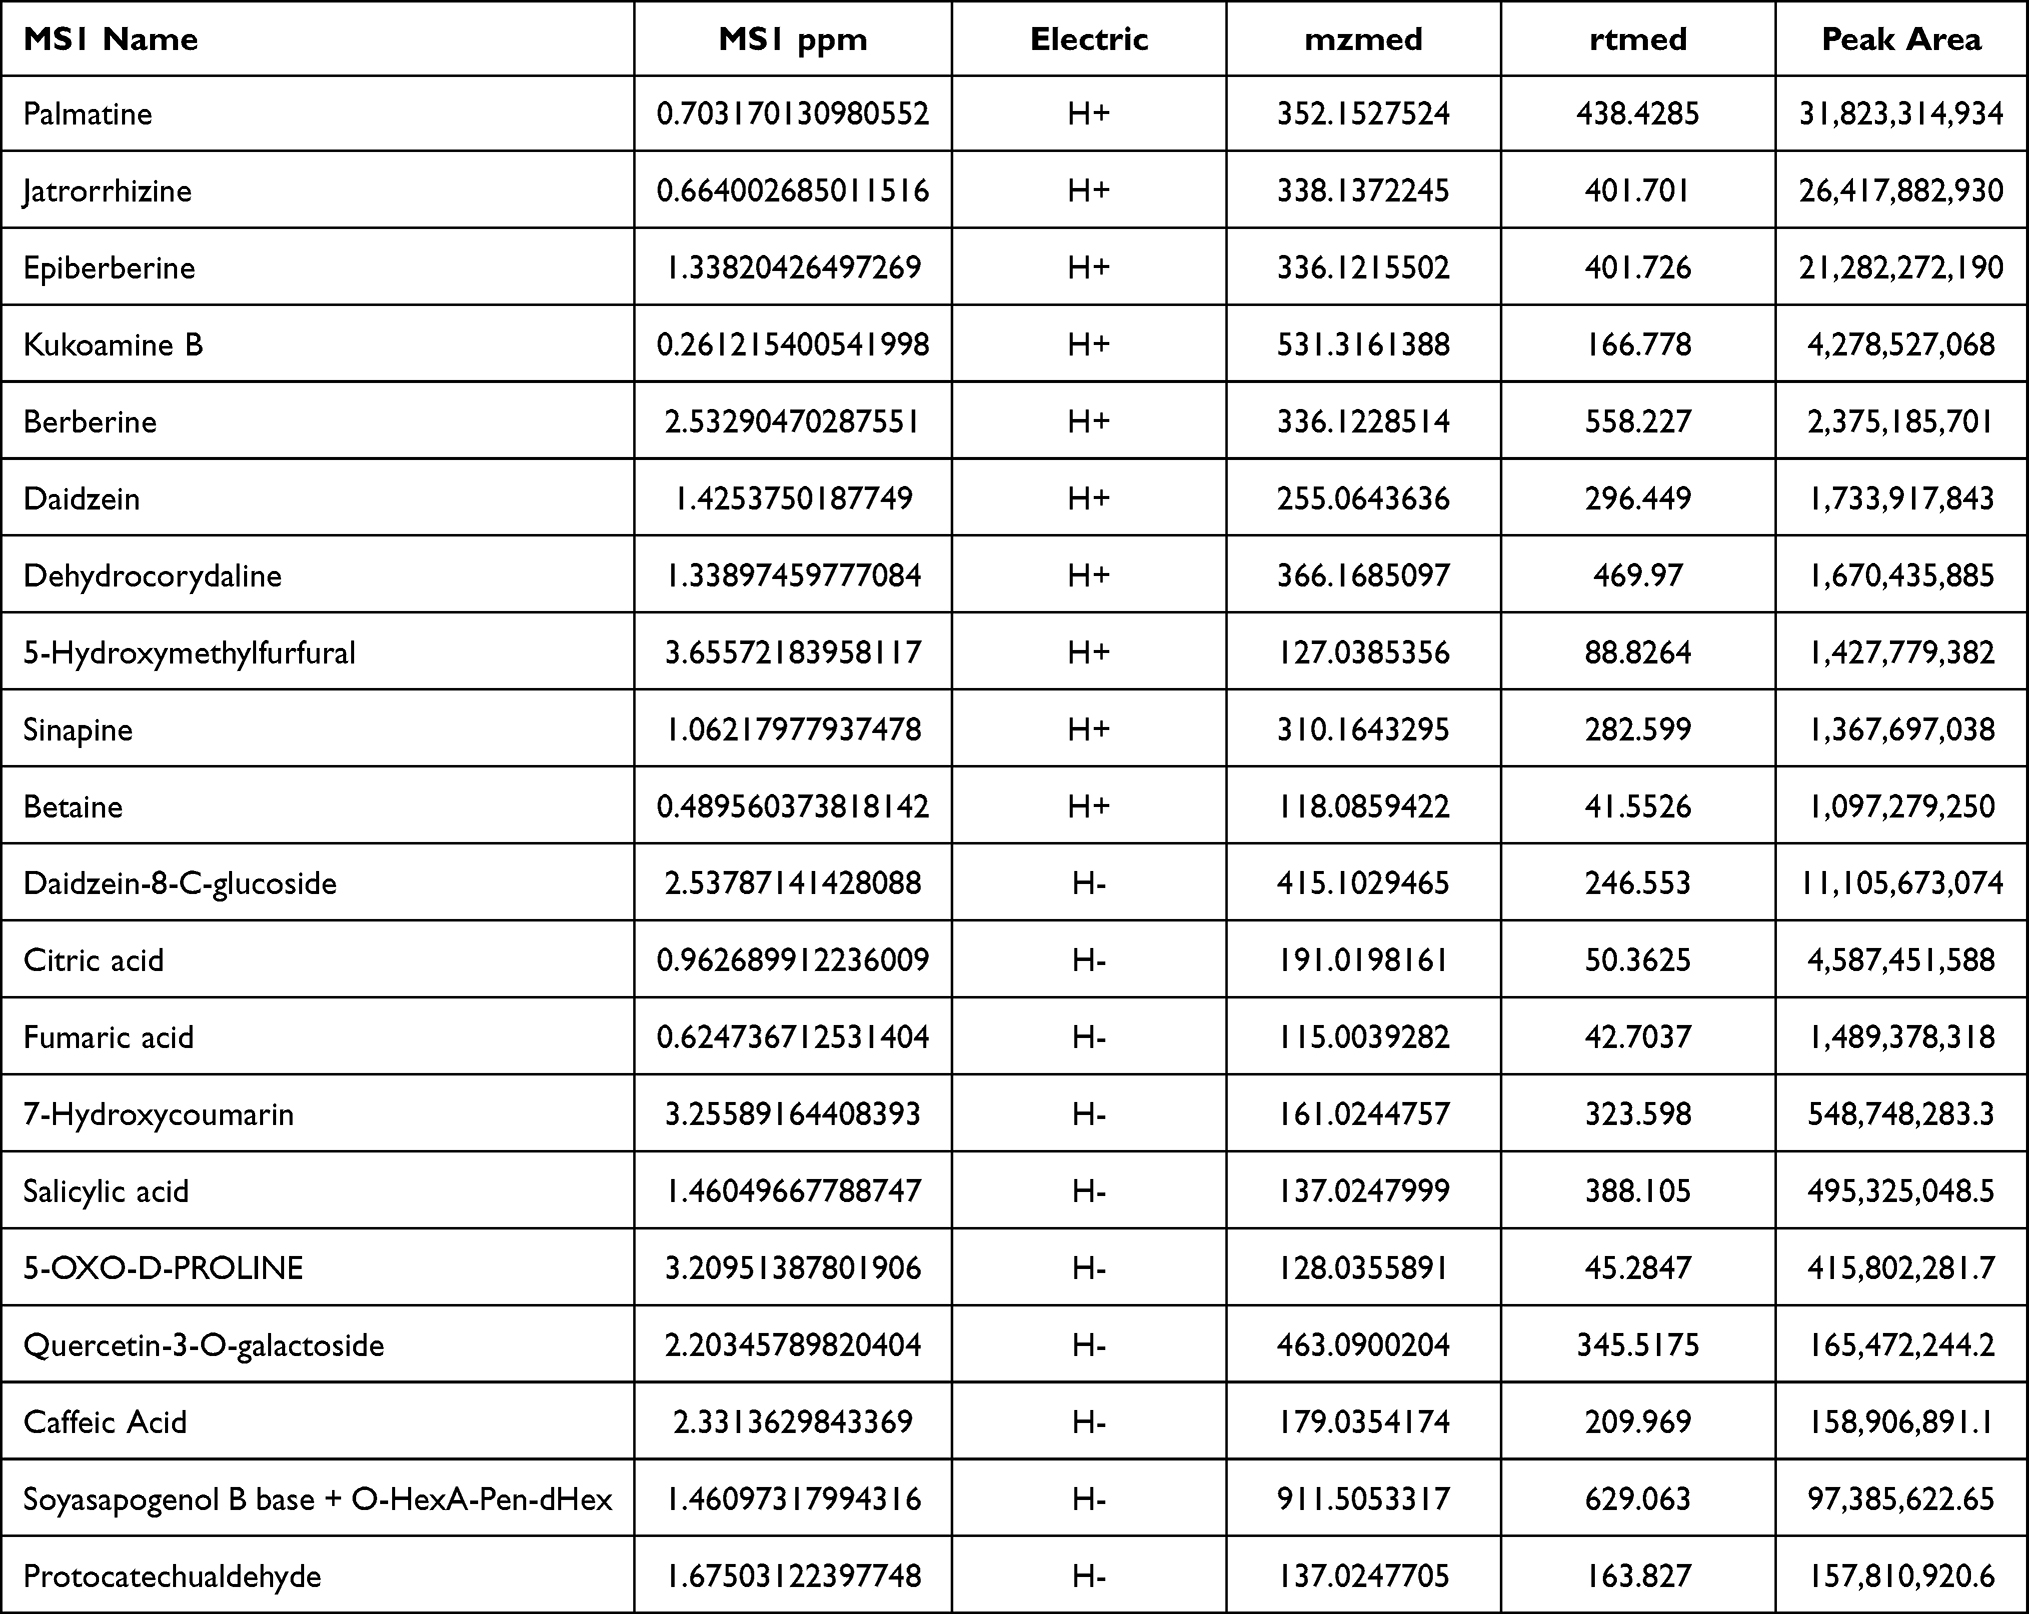 |
Table 1 Identification of Com Components of TPS Extract by UPLC-OE-MS Analysis |
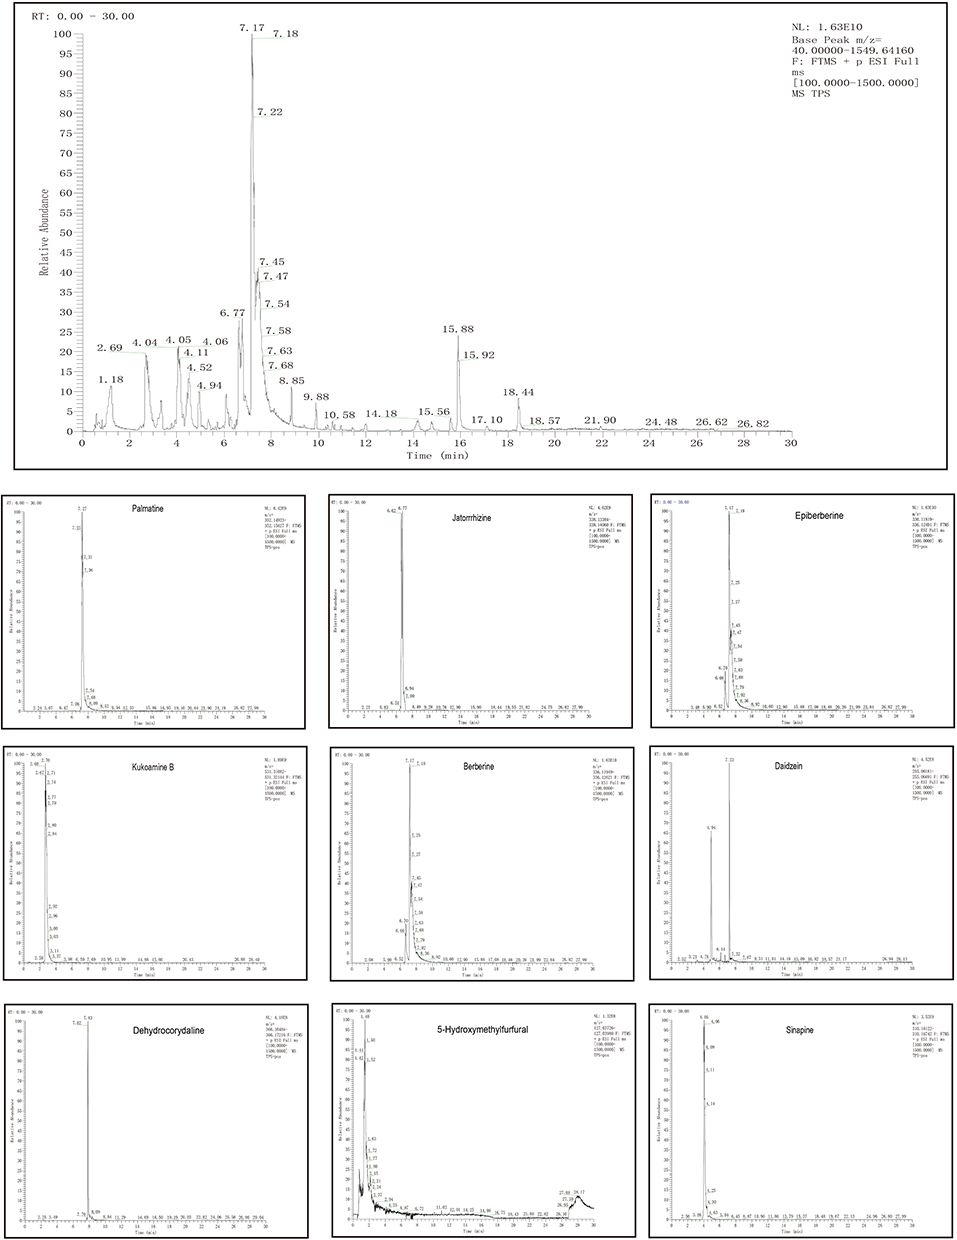 |
Figure 1 UPLC-OE-MS Analysis base peak intensity chromatograms of TPS extract in positive mode. |
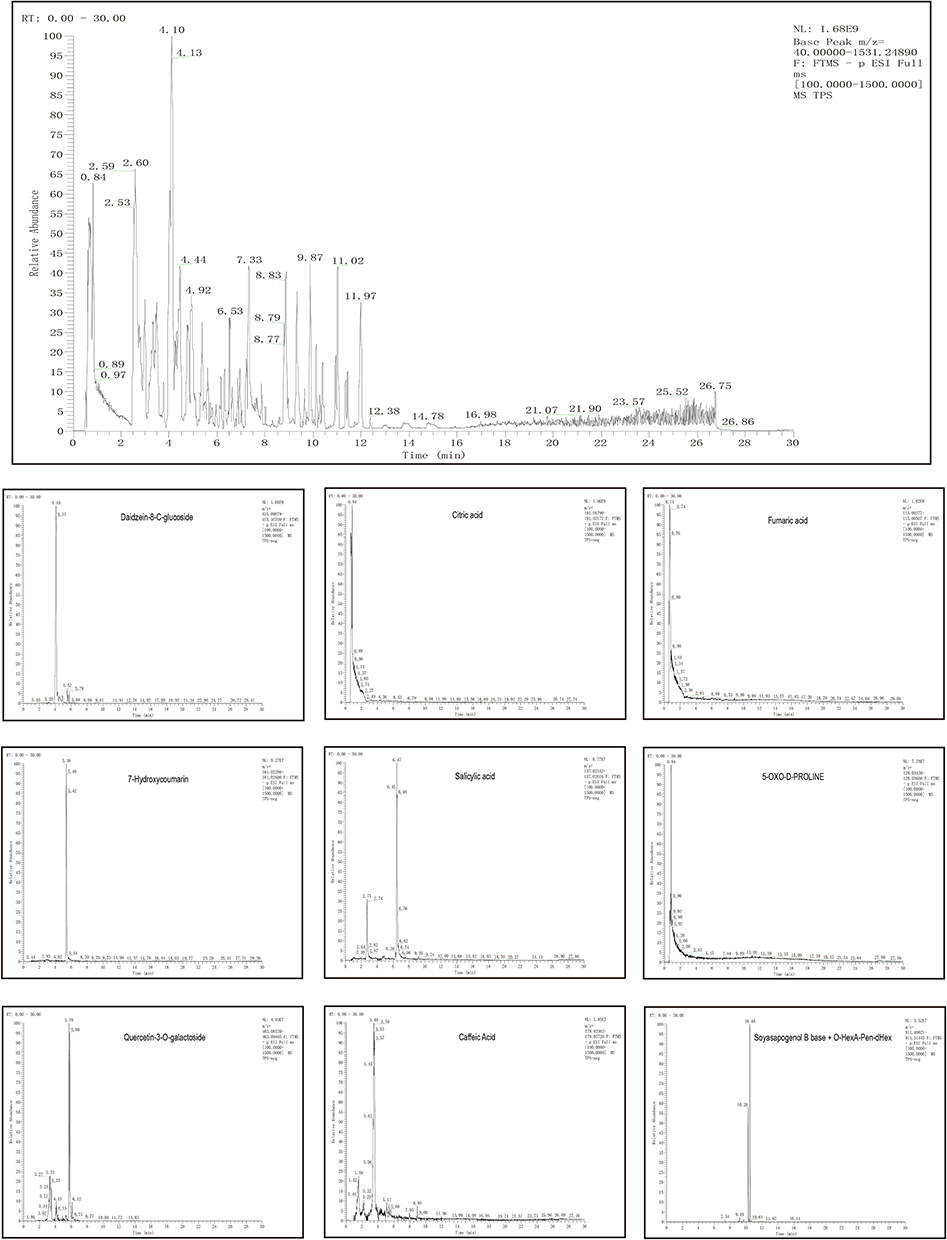 |
Figure 2 UPLC-OE-MS Analysis base peak intensity chromatograms of TPS extract in negative mode. |
Effects of TPS Decoction on Weight, Glucose Homeostasis, and Pathological Manifestations in T2DM Mice
The weights of the control group increased physiologically. On the first day of TPS decoction treatment, there was no significant difference in terms of weight between the model and all treatment groups (P > 0.05). The weight of the treatment group was lower than that of the control (P < 0.01). On the 28th day, the weights of all treatment groups were higher than those of the model group, particularly the TPS-H group (P < 0.01, Figure 3A). Body weight changes during modeling, which we show in Supplementary Material: Figure S1.
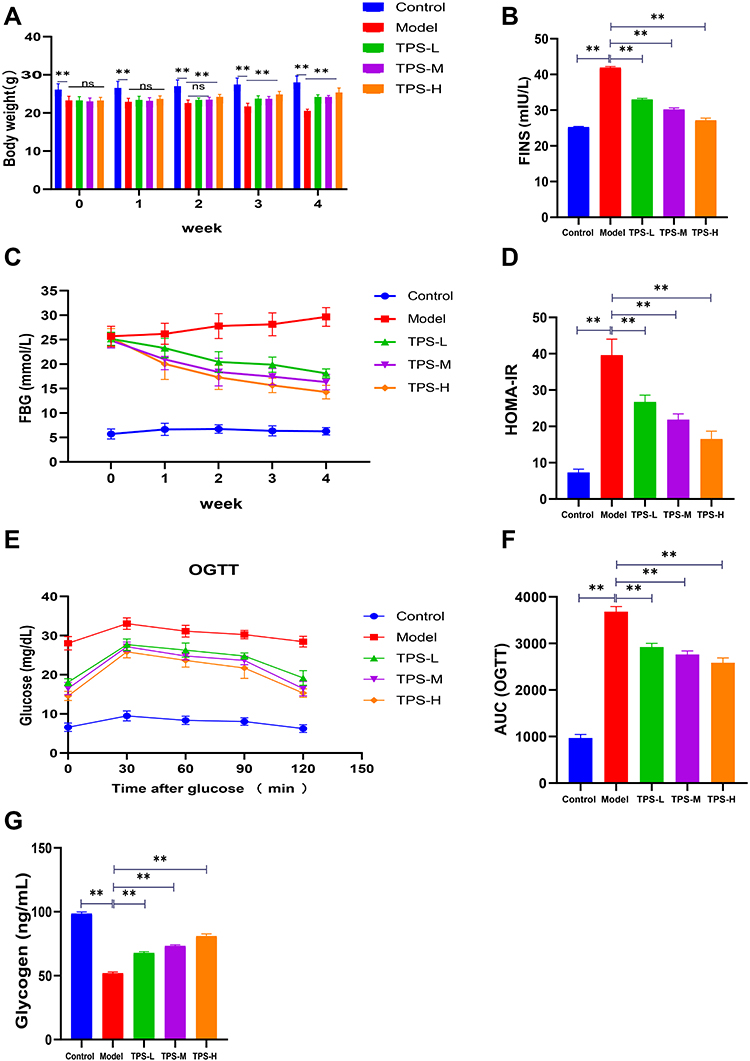 |
Figure 3 Effects of TPS on weight, glucose homeostasis in T2DM mice. (A)TPS treatment improves weight loss in T2DM mice; (B-D) Levels of FINS FBG and HOMA-IR after TPS treatment; (E and F) The AUC of OGTT was decreased in T2DM mice after TPS treatment; (G) TPS treatment increased hepatic glycogen content in T2DM mice. Control, Model, TPS-L, TPS-M and TPS-H (n = 6 per group) groups. Data are presented as the mean ± SD. **P < 0.01. Abbreviation: NS, non-significant. |
To determine whether TPS decoction improves glucose homeostasis in T2DM mice, the serum FBG and FINS levels and HOMA-IR scores were evaluated. The model group had significantly higher FBG and FINS levels and HOMA-IR scores than the control group. Nevertheless, these indicators decreased after TPS decoction treatment (Figures 3B-D). The FBG and oral glucose tolerance levels were evaluated using blood samples collected from the tail vein. The FBG levels of the model group increased significantly. Meanwhile, the TPS decoction group had a significantly lower FBG level than the model group. The area under the curve of oral glucose tolerance levels in the model group was higher than that in the control group, and this relationship reversed significantly with TPS decoction treatment (Figures 3E-F).
The control group had a significantly higher liver glycogen level than the model group (P < 0.01). The liver glycogen levels of the TPS-L, TPS-M, and TPS-H groups were significantly higher than those of the model group (P < 0.01, Figure 3G).
Based on the H&E staining results, the control group had a regular islet morphology with clear boundaries (Figure 4A). The islet cells were distributed uniformly with consistent size, rich cytoplasm, and light staining. By contrast, the model group had an irregular islet morphology with unclear boundaries. Most islets were atrophied and the remaining pancreatic structure was damaged.
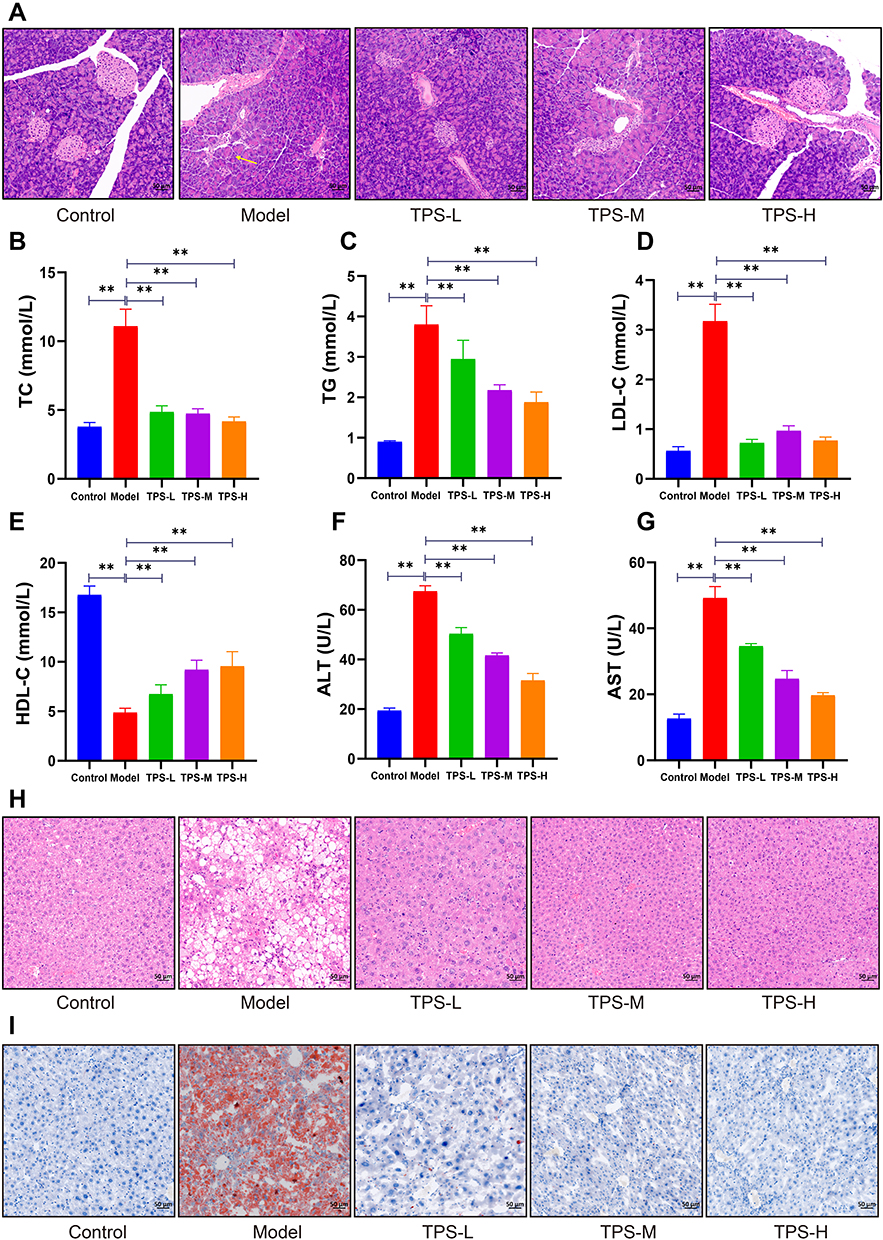 |
Figure 4 (A) Pathological changes of pancreas of mice in each group by HE staining (50μm). Effects of TPS on dyslipidemia and liver function in T2DM mice: (B-E) Changes in blood lipid levels after TPS treatment; (F-G) Changes in serum AST, ALT activities after TPS treatment; (H) Pathological changes of liver of mice in each group by HE staining (50μm); (I) Pathological changes of liver of mice in each group by oil red O dyeing (50μm). Control, Model, TPS-L, TPS-M and TPS-H (n = 6 per group) groups. Data are presented as the mean ± SD. **P < 0.01. Abbreviation: NS, non-significant. |
The pancreatic status of the TPS-H group significantly improved. Moreover, the islets were more regular with rare shrunken morphologies. There was less vacuolar degeneration and the number of islet cells increased. The islet size and morphology are associated with function. Thus, TPS decoction can improve body weight and glucose homeostasis in T2DM mice.
Effects of TPS Decoction on Dyslipidemia, Liver Lipid Deposition, and Liver Function in T2DM Mice
To determine whether TPS decoction improves dyslipidemia in T2DM mice, the TG, TC, LDL-C, and HDL-C levels were measured. Compared with the control group, the model group had significantly higher TG and TC levels and significantly lower HDL-C levels. This finding was consistent with the notion that T2DM causes dyslipidemia. By contrast, TPS decoction treatment significantly reduced the TG, TC, and LDL-C levels and increased the HDL-C levels (Figures 4B-E).
ALT and AST are sensitive markers of liver function. If hepatocytes are damaged, these transaminases are released into the circulation due to increased cell membrane permeability. Hence, the ALT and AST levels were measured, and the results showed that the model group had higher ALT and AST levels than the control group. Nevertheless, this relationship was reversed by TPS decoction treatment (Figures 4F-G).
H&E staining revealed that the model group had a high number of hepatocyte vacuoles and that the TPS-L, TPS-M, and TPS-H groups had a significantly low number of hepatocyte vacuoles (Figure 4H). Oil Red O staining showed that the model group had a significantly stronger lipid deposition than the control group and a significantly weaker lipid deposition than the TPS-L, TPS-M, and TPS-H groups (Figure 4I). Hence, TPS decoction can prevent dyslipidemia and reduce lipid deposition in T2DM mice.
Effects of TPS Decoction on Inflammatory Factors in T2DM Mice
The model group had significantly higher serum TNF-α, IL-1β, and IL-6 levels than the control group. However, the TPS-L, TPS-M, and TPS-H groups had significantly low TNF-α, IL-1β, and IL-6 levels (Figures 5A-C). The model group had significantly lower IL-4 and IL-10 levels than the control group. The TPS-L, TPS-M, and TPS-H groups had significantly higher serum anti-inflammatory factor levels than the model group (Figures 5D-E). Therefore, TPS decoction inhibits inflammation in T2DM mice.
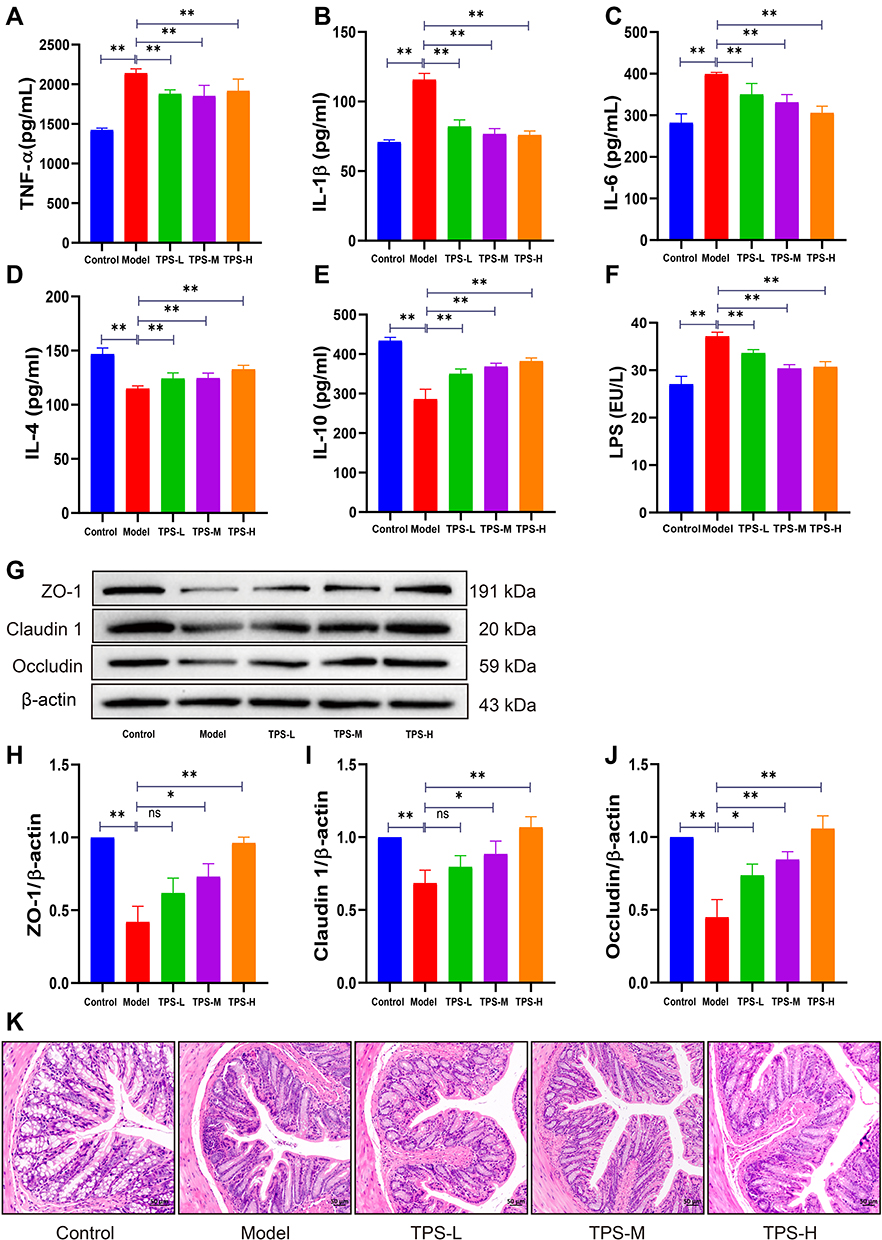 |
Figure 5 Effects of TPS on inflammatory factors in T2DM Mice. (A-C) TPS treatment decreased the levels of pro-inflammatory cytokines in serum; (D and E) TPS treatment reduced serum levels of anti-inflammatory cytokines; (F) TPS treatment reduced the level of LPS in serum; (G-J) Levels of tight junction proteins ZO-1, OCLN and Claudin1; (K) Pathological changes of colon of mice in each group by HE staining (50μm). Control, Model, TPS-L, TPS-M and TPS-H (n = 6 per group) groups. Data are presented as the mean ± SD. *P < 0.05 and **P < 0.01. Abbreviation: NS, non-significant. |
Effects of TPS Decoction on the Intestinal Microbiota of T2DM Mice
The model group had a lower expression of ZO-1, claudin 1, and occludin than the control group (Figures 5G-J). However, the TPS-L, TPS-M, and TPS-H groups had a high expression of ZO-1, claudin 1, and occludin. The model group had a significantly higher LPS level than the control group and a lower LPS level than the TPS-L, TPS-M, and TPS-H groups (Figure 5F).
In addition, to further assess pathobiological intestinal changes, H&E staining of intestinal tissues was conducted. In the model group, the colonic epithelial cells were damaged, and the cell arrangements were incomplete with inflammatory cell infiltration (Figure 5K). TPS decoction prevented these changes. Hence, it can repair the intestinal mucosal barrier and reduce the entry of LPS into the circulation in T2DM mice.
Effects of TPS Decoction on the Intestinal Microbiota of T2DM Mice
We performed 16S rRNA sequencing to assess changes in the GM in the intestinal tract of T2DM mice after TPS decoction treatment. Beta diversity analysis was conducted to identify differences in the GM structure between samples (R ranging from −1 to 1). If R was higher than 0, the difference between groups was significant, and P-values indicated the reliability of the statistical analysis. As shown in Table 2, the GM structure of the control and model groups significantly differed. This finding was similar between the TPS-H and model groups (Figure 6B). Principal coordinates analysis revealed that there were differences in the sample notes of the model and control groups. By contrast, the sample notes of the TPS-H and control groups were extremely close (Figure 6A). The model group had lower Chao1 and Shannon indexes than the control group. These indicators were higher in the TPS-H group than in the model group (Figures 6C and D). Similarly, clustering analysis showed that the structure and composition of the GM in T2DM mice changed. These alterations more likely occurred in the TPS-H group (Figure 6F).
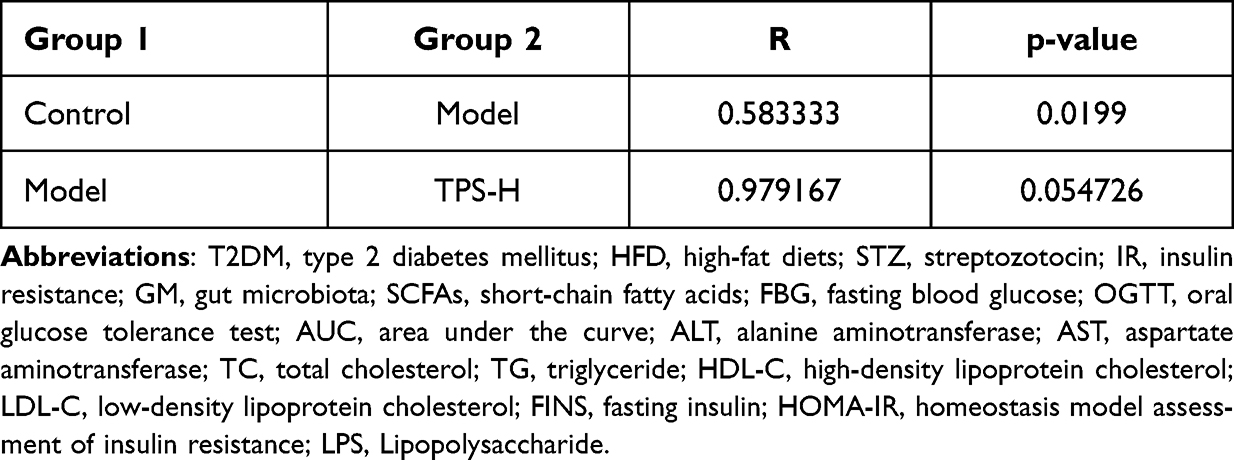 |
Table 2 Beta Diversity Profiling |
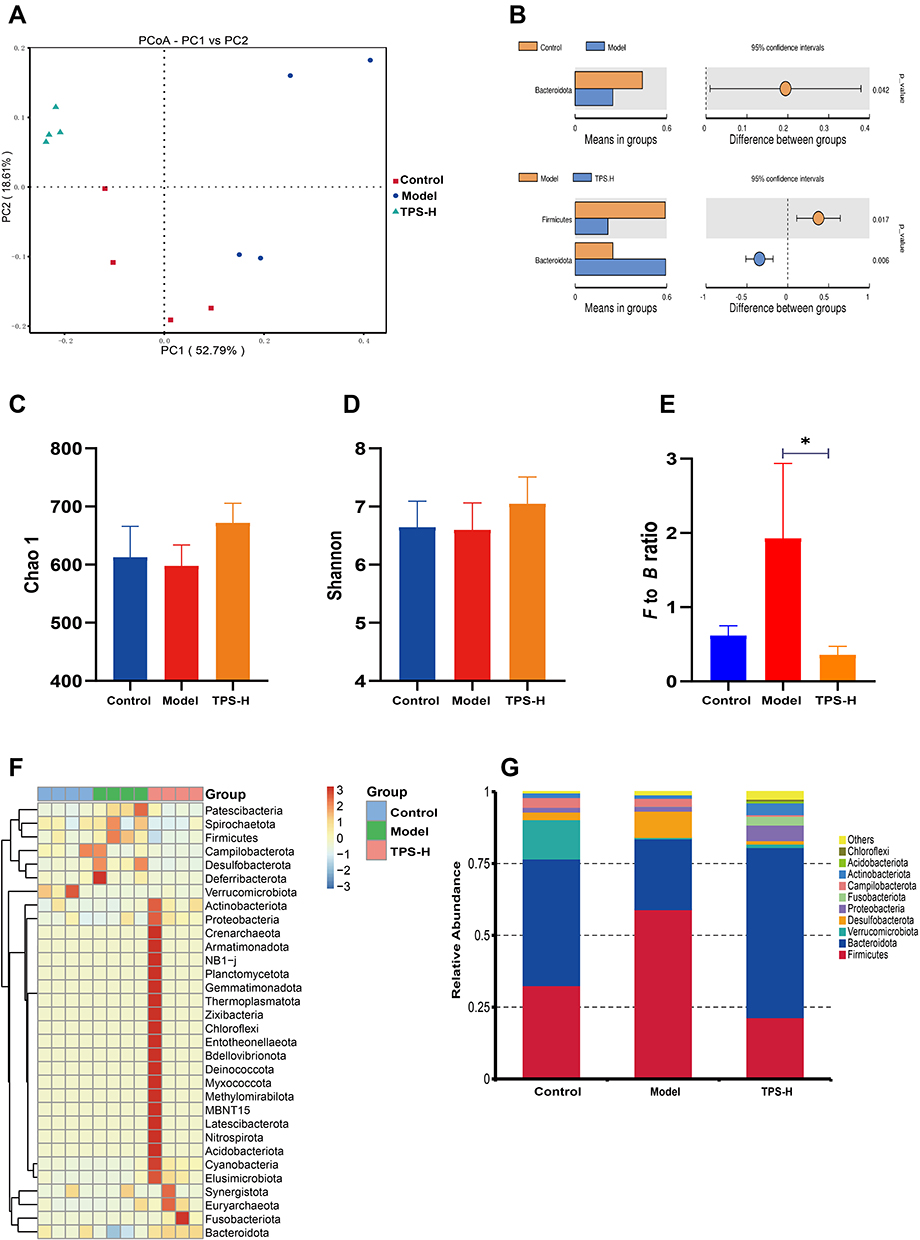 |
Figure 6 TPS treatment affected the gut microbiota community in T2DM mice. (A) PCoA indicated more similar beta diversity between TPS high-dose and Control groups than that between the Model and Control groups; (B) At the phylum level, differences in species abundance between groups; (C and D) Shannon and Simpson indexes were lower in TPS high-dose group than that in the Model group; (E) At the phylum level, TPS treatment decreased the F to B ratio in T2DM mice; (F) At the Phlylum level cluster analysis changes in a heatmap.The relative abundances of 30 dominant genera in the gut microbiota of four groups are presented in a heatmap; (G) Percent of community abundance on phylum level. Control, Model and TPS-H (n = 4 per group) groups. Data are presented as the mean ± SD. *P < 0.05. Abbreviation: NS, non-significant. |
The composition changes in the top ten dominant microbiota are shown in the phylum level of each sample (Figure 6G). The phylum-level species relative abundance table is presented in Supplementary Material: Table S3. Firmicutes and Bacteroidetes were the dominant bacteria. The Firmicutes/Bacteroidetes (F/B) ratio of the model group was higher than that of the control group. However, it was significantly lower in the TPS-H group than in the model group (Figure 6E). At the genus level, compared with the control group, the model group had significantly lower abundances of Akkermansia, Muribaculaceae, Bacteroides, Fusobacterium, and Dubosiella and significantly higher abundances of Colidextribacter and Helicobacter (Figures 7A and B). Compared with the model group, the TPS-H group had significantly higher abundances of Akkermansia, Muribaculaceae (P < 0.05), Bacteroides (P < 0.01), and the Eubacterium coprostanoligenes group and lower abundances of Fusobacterium, Colidextribacter (P < 0.05), Dubosiella (P < 0.01), and Helicobacter (P < 0.05).
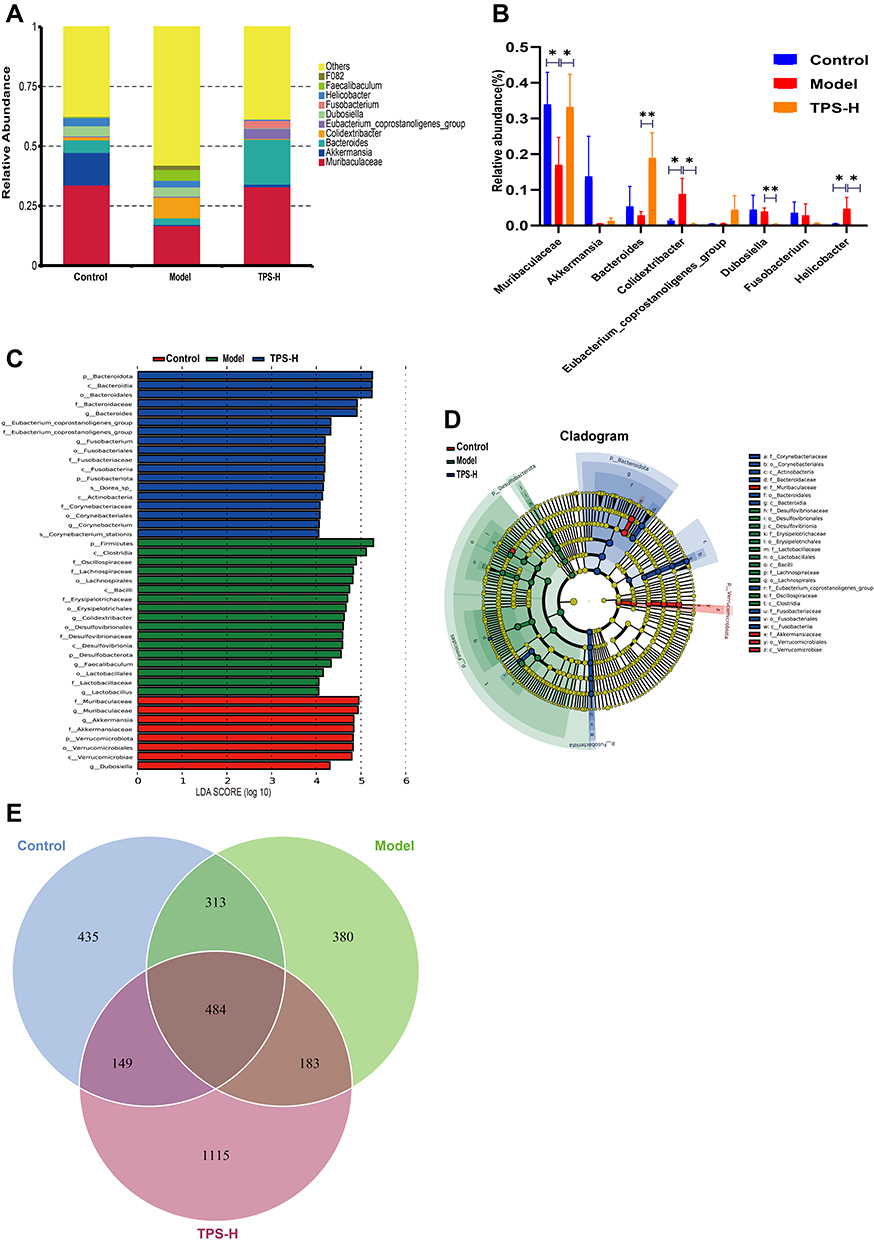 |
Figure 7 TPS treatment affected the gut microbiota community in T2DM mice. (A)Percent of community abundance on genus level; (B) At the genus level, TPS treatment affected the relative abundances of Akkermansia, Muribaculaceae, Bacteroides, Colidextribacter, Eubacterium_coprostanoligenes_group, Dubosiella, Fusobacterium, Helicobacter in T2DM mice; (C and D) LEfSe analysis of species abundance differences among multiple groups; (E)The Venn diagram depicted OTUs that differed in each group. Control, Model and TPS-H (n = 4 per group) groups. Data are presented as the mean ± SD. *P < 0.05 and **P < 0.01. Abbreviation: NS, non-significant. |
Differences in bacteria abundances between the groups were analyzed using LefSe (Figure 7C). Each transverse cylinder represents one species. The length of the cylinder represents the LDA value. If the LDA value was higher, the difference was greater. Different cylinder colors represented the biomarkers of the corresponding group. The biomarkers indicate a higher abundance in the specific group. The candidate biomarkers in the control group were Muribaculaceae, Akkermansia, Akkermansiaceae, Verrucomicrobiota, Verrucomicrobiales, Verrucomicrobia, and Dubosiella. The candidate biomarkers in the model group were Firmicutes, Clostridia, Oscillospiraceae, Lachnospiraceae, Lachnospirales, Bacilli, Erysipelotrichaceae, Erysipelotrichales, Colidextribacter, Desulfovibrionales, Desulfovibrionaceae, Desulfovibrionia, Desulfobacterota, Faecalibaculum, Lactobacillales, Lactobacillaceae, and Lactobacillus. The candidate biomarkers in the TPS-H group were Bacteroidota, Bacteroidia, Bacteroidales, Bacteroidaceae, Bacteroides, the Eubacterium coprostanoligenes group, Fusobacterium, Fusobacteriales, Fusobacteriaceae, Fusobacteriia, Fusobacteriota, Dorea spp., Actinobacteria, Corynebacteriaceae, Corynebacteriales, Corynebacterium, and Corynebacterium stationis.
The cladogram corresponds to different classified levels from the inside to the outside (Figure 7D). The connection lines between levels represent the ownership relationship. Each circle node represents one species. The yellow note indicated that the differences between groups were not significant. The other colors showed that this species was a biomarker of the group corresponding to that color (significant increase in abundance in this group). The colored fan-shaped area marks the subordinate classification interval of a specific microorganism.
The DADA2 method reduces noise, equal to clustering with 100% similarity.24 After noise reduction using the DADA2 method, every genemiceed de-duplication sequence is referred to as amplicon sequence variants (ASVs) or signature sequence (corresponding to the Operational Taxonomic Unit [out] sequence). The DADA2 method is more sensitive and specific than the traditional OTU method and can determine the real biological variation missed by the OTU method. False-positive sequences are delivered less often at the same interval.25 The replacement of ASVs for OTU significantly improves the accuracy, comprehensiveness, and repeatability of gene data analysis.26 The unique ASVs between groups or common ASVs were analyzed, and Venn diagrams were drawn to express the similarity and overlap of the composition of intestinal flora in each sample group (Figure 7E). The sequencing quality control sheets for all samples is in Supplementary Material: Table S4.
Discussion
Previous studies have shown that GM participates in the pathophysiology of T2DM. As the second genome in humans,27 the GM provides an opportunity to evaluate the pathogenesis of T2DM. Several studies reported changes in the structural composition of GM in patients with T2DM.28–32 The GM may affect the type, quantity, and proportion of flora by producing different metabolites, thereby causing endotoxemia and long-term chronic low-grade inflammatory reactions and destroying the integrity of the intestinal epithelial barrier.33
Oral hypoglycemic agents and INS are currently used as the primary medications for T2DM. Their mechanisms of action focus on increasing INS release and INS sensitivity and inhibiting the intestinal absorption of glucose. However, their curative effects have advantages and disadvantages. The treatment of T2DM remains an issue worldwide, and research on T2DM medications with a low risk of toxicity and side effects is extensive.
Several natural medicines and proprietary Chinese medicines have protective effects on islet β cells. Traditional Chinese medicines have large compound prescriptions, significant effects, multiple targets, and few side effects and are cost-effective. The influence of GM on the development of T2DM is an area in traditional Chinese medicine that is comprehensively evaluated.
TPS decoction is effective against T2DM. Modern pharmacological studies have shown that astragaloside (a primary component of Astragalus membranaceus) increased the number of Bifidobacterium and Lactobacillus in the intestinal tract of mice, inhibited the proliferation of Enterobacter, and improved metabolic disorders.34 Astragaloside IV regulated the disordered GM in T2DM mice fed a high-sugar and high-fat diet.35 Pueraria lobata extract improved glucose and lipid metabolism and inflammation by regulating GM and treating T2DM.36 HAW1-2 in hawthorn directly altered the intestinal microflora (particularly Bacteroides) and produced SCFAs.37 Eucommia ulmoides balanced the structure and composition of intestinal microflora and improved intestinal tissue morphology.38 Berberine directly inhibited the growth of Escherichia coli in the intestinal tract, changed the structure of the GM, and controlled blood glucose levels.39
We performed 16S rRNA high-throughput sequencing to compare the composition of the GM between the control, model, and TPS-H groups to explore the association between GM and T2DM. Gut microbiota alpha diversity refers to the diversity of flora in a specific region or ecosystem. It is a comprehensive index reflecting the richness and homogeneity of flora. The Shannon and Simpson indexes of T2DM mice increased significantly, thereby indicating that the diversity of the GM α in T2DM mice increased. TPS decoction treatment reduced the α diversity of intestinal microbiota. The β diversity of the mouse GM was analyzed via PCoA and cluster analysis. Results showed that the overall composition of the GM in T2DM mice changed significantly. TPS decoction prevented damage to the structure of intestinal bacteria in T2DM mice. Thus, T2DM alters the αand β diversities.
Firmicutes and Bacteroidetes are the two primary phyla in the GM, and the F/B ratio is a marker of metabolic diseases. The ratio between these phyla is associated with several diseases; it is significantly increased in several models, including T2DM, nonalcoholic fatty liver, and depression.40–42 Several data have shown that diabetes mellitus and obesity can increase the F/B ratio in humans and animals.43 Lowering the F/B ratio can alleviate metabolic disorders and inflammatory reactions.44 Some studies revealed that the F/B ratio affects the production of SCFAs, and it is associated with carbohydrate metabolism. In colon tissues, carbohydrates are metabolized into SCFAs with the participation of GM. SCFAs can reduce fat deposition in the liver and activate receptors in the liver and pancreas to improve glucose and lipid metabolism, relieve INS resistance, and combine with G-protein coupling receptor GPR43 to reduce inflammation. Therefore, TPS decoction reduces the F/B ratio caused by T2DM.
In the T2DM mouse model, the abundances of Akkermansia, Muribaculaceae, Bacteroides, Fusobacterium, and Dubosiella decreased, and the abundances of Colidextribacter and Helicobacter increased. TPS decoction increased the abundance of Akkermansia, Muribaculaceae, and the Eubacterium coprostanoligenes group and decreased the abundance of Fusobacterium, Colidextribacter, Dubosiella, and Helicobacter. Decreases in the intestinal probiotic Bacteroides were associated with abnormal glucose tolerance, which affects glucose and lipid metabolism in vivo and leads to obesity and diabetes mellitus.45
Another study showed that these processes are associated with the production of SCFAs produced by the decomposition of oligosaccharides, polysaccharides, peptides, proteins, and glycoproteins by the GM. These, in turn, directly regulate the number and function of pancreatic β cells, thereby participating in hepatic glycogen metabolism.46 The Eubacterium coprostanoligenes group is a cholesterol-lowering microorganism that negatively correlates with body weight and TG.47 The relative abundance of the Eubacterium coprostanoligenes group was higher in the TPS-H group than in the model group, thereby suggesting that TPS decoction treatment is effective. Previous studies found that the abundance of butyrate-producing bacteria (eg, Fusobacterium) in the GM of patients with T2DM was significantly lower than that of patients without T2DM.48 This result is consistent with that of the current study, and it indicates that Fusobacterium improves T2DM.
Chevalier et al revealed that the relative abundance of Muribaculaceae increased in an osteopathy model,49 which was inconsistent with the changes in our model. We believe that Muribaculaceae may play different roles in different diseases. Some strains of Bacteroides are believed to be probiotics, and they participate in regulating the dynamic balance of GM and in increasing host immunity.50,51 In the current study, TPS decoction increased the abundance of Bacteroides in T2DM mice. TPS decoction may promote the recovery of GM dynamic balance by increasing the content of Bacteroides, thereby improving T2DM symptoms. Nevertheless, the mechanism of Bacteroides and T2DM remains unclear, and further research on this notion is required. Akkermansia is a phylum that is extensively evaluated. It is associated with immune and metabolic diseases such as cancer, diabetes mellitus,52 obesity, and atherosclerosis. Increased Akkermansia abundance reduces LPS levels caused by a high-fat diet, and it is critical for maintaining glucose homeostasis.53 Previous studies showed that this bacterium could reduce the weight and TC of patients with obesity and improve INS sensitivity, IR, and inflammatory responses.54 Its mechanism may involve modifying the thickness of the intestinal mucosa and maintaining the integrity of the intestinal barrier.55 A previous study showed that the abundance of this bacterium decreases in obesity/T2DM, and its prevalence is negatively associated with its abundance,56 which is consistent with the negative correlation between Akkermansia and FINS and the HOMA-IR score in the current study. Akkermansia was more abundant in the TPS decoction group than in the model group, thereby indicating that TPS decoction regulates the GM. Hence, it is feasible to relieve T2DM by regulating the GM.
Intestinal mucosal barrier dysfunction is involved in intestinal diseases such as inflammatory bowel disease, Crohn’s disease, and bacterial diseases. Previous studies have shown that diabetes mellitus is correlated to intentional mucosal barrier injury. Diabetes mellitus is one of the pathological outcomes of intentional mucosal barrier injury and a factor that aggravates the dysfunction of the intestinal mucosal barrier.57 The intestinal mucosal barrier possesses the most complex structure and function among physiological barriers in humans. The mechanical barrier is primarily composed of tight junction proteins between intestinal epithelial cells. The biochemical barrier primarily comprised intestinal mucosal immunity. The biological barrier is primarily composed of intestinal symbiotic bacteria. Intestinal intercellular tight junction proteins include the transmembrane proteins occludin, claudin, junction adhesion molecule, and cytoskeletal proteins ZO-1 and ZO-2.58 Thus, T2DM is associated with intestinal mucosal barrier injury, increased intestinal permeability, and LPS shifting from the intestinal flora. Via the mediation of TLR4/CD14, macrophages release inflammatory factors that exacerbate IR and diabetes mellitus. Wang et al found that a high-energy diet increases the abundance of gram-negative bacteria in the intestinal tract of obese mice.49 Gram-negative bacteria destroy the intestinal mucosal barrier and promote the permeability of the intestinal wall, leading to LPS entering the circulation and inducing inflammatory immune responses. The endpoint is the induction of INS resistance via several reactions.59,60
In the current study, compared with the model group, the TPS decoction group had a significantly higher expression of tight junction proteins ZO-1, claudin 1, and occludin in the intestinal tissues and significantly lower serum LPS levels. The thinning of the colonic smooth muscle layer and the decrease of muscle cell numbers were significantly prevented. Therefore, TPS decoction prevents damage to the intestinal mucosal barrier and reduces LPS release.
The liver is an important metabolic organ for blood glucose level control. Approximately 90% of endogenous glucose is produced by the liver system, which can maintain blood glucose balance by regulating gluconeogenesis, glycogenolysis, and other pathways.61,62 Previous studies have shown that the inhibition of hepatic gluconeogenesis can improve blood glucose levels in patients with T2DM.63 The liver is not only an important organ that is involved not only in the synthesis, decomposition, and metabolism of carbohydrates in the body to maintain blood glucose stability but also in the degradation, clearance, and glucose metabolism of INS.64 Long-term hyperglycemia increases free fatty acid metabolism in the liver, which elevates blood TC and TG levels.65 Based on our findings, the FBG, blood lipid, ALT, and AST levels of T2DM mice were significantly higher than those of controls. The oral glucose tolerance levels, HOMA-IR score, and area under the curve of T2DM mice increased, thereby indicating IR in the model mice. Pathological investigation revealed that the liver cells in the model group mice were disordered and swollen, and there was vacuolar balloon deformation. Pancreatic islets were sparsely distributed and vacuolated. These findings are consistent with the pathological manifestations of T2DM.66,67 TPS decoction treatment reduced blood glucose levels and improved dyslipidemia, IR, and pathological changes in the liver, pancreas, and colon in T2DM mice. Therefore, it has a therapeutic effect against T2DM. The effect was significant in the TPS-H group.
Inflammation is a critical factor in the pathophysiology of T2DM. The production of local and systemic pro-inflammatory factors such as IL-6, IL-1β, and TNF-α intensifies the vicious cycle of T2DM by inducing IR.68 IL-6 decreases INS activity by blocking the expression of INS receptor signals, leading to IR development.69 IL-1β helps increase the secretion of intercellular adhesion molecule-1,70 resulting in the injury and death of islet β cells and further exacerbating diabetes mellitus. TNF-α induces the phosphorylation of INS receptor substrate-1,71 which disturbs glucose metabolism. Results showed that TPS decoction decreased the serum TNF-α, IL-1β, and IL-6 levels and increased IL-4 and IL-10 levels. Therefore, TPS decoction regulates inflammatory responses.
Conclusion
TPS decoction can be effective against T2DM in mice, and its mechanism may be correlated with gut microbiota regulation, intestinal mucosal barrier repair, downregulation of inflammatory factor expression, and IR improvement. The current study supports the clinical application of TPS decoction in T2DM and provides insights into the development of other T2DM medications.
Ethical Approval
The experimental procedures were reviewed and approved by the Committee for the Care and Use of Laboratory Animals at Yunnan University of Chinese Medicine. (Kunming, Yunnan, China). All procedures were conducted based on the Care and Use of Laboratory Animals published by the US National Institute of Health.
Acknowledgments
This research was supported by National Natural Science Foundation of China (81860646) and a grant from Yunnan Provincial Science and Technology Department (202201AS070084, 202101AZ070001-012, 2019FI016, 202005AC160058, 202105AF150031, YB220309, 30170104891).
Disclosure
The authors report no conflicts of interest in this work
References
1. Saeedi P, Salpea P, Karuranga S., et al. Mortality attributable to diabetes in 20-79 years old adults, 2019 estimates: results from the International Diabetes Federation Diabetes Atlas, 9 edition. Diabetes Res Clin Pract. 2020;162:108086.
2. Rivera-Mancía S, Lozada-García M, Pedraza-Chaverri J. Experimental evidence for curcumin and its analogs for management of diabetes mellitus and its associated complications. Eur J Pharmacol. 2015;756:30–37.
3. Neish A. Microbes in gastrointestinal health and disease. Gastroenterology. 2009;136(1):65–80.
4. Zheng P, Zeng B, Zhou C, et al. Gut microbiome remodeling induces depressive-like behaviors through a pathway mediated by the host’s metabolism. Mol Psychiatry. 2016;21(6):786–796.
5. Qin J, Li R, Raes J, et al. A human gut microbial gene catalogue established by metagenomic sequencing. Nature. 2010;464(7285):59–65.
6. Wu X, Ma C, Han L, et al. Molecular characterisation of the faecal microbiota in patients with type II diabetes. Curr Microbiol. 2010;61(1):69–78.
7. Ortega M, Fraile-Martínez O, Naya I, et al. Type 2 Diabetes Mellitus Associated with Obesity (Diabesity). The Central Role of Gut Microbiota and Its Translational Applications. Nutrients. 2020;12(9):654.
8. Tanase D, Gosav E, Neculae E, et al. Role of Gut Microbiota on Onset and Progression of Microvascular Complications of Type 2 Diabetes (T2DM). Nutrients. 2020;12:12.
9. Chávez-Carbajal A, Pizano-Zárate M, Hernández-Quiroz F, et al. Characterization of the Gut Microbiota of Individuals at Different T2D Stages Reveals a Complex Relationship with the Host. Microorganisms. 2020;8(1):548.
10. Huda M, Kim M, Bennett B. Modulating the Microbiota as a Therapeutic Intervention for Type 2 Diabetes. Front Endocrinol (Lausanne). 2021;12:632335.
11. Zhang Q, Hu N. Effects of Metformin on the Gut Microbiota in Obesity and Type 2 Diabetes Mellitus. Diabetes Metabolic Syndrome Obesity. 2020;13:5003–5014.
12. Pasini E, Corsetti G, Assanelli D, et al. Effects of chronic exercise on gut microbiota and intestinal barrier in human with type 2 diabetes. Minerva Med. 2019;110(1):3–11.
13. Nascimento J, Matheus V, Oliveira R, Tada S, Collares-Buzato C. High-Fat Diet Induces Disruption of the Tight Junction-Mediated Paracellular Barrier in the Proximal Small Intestine Before the Onset of Type 2 Diabetes and Endotoxemia. Dig Dis Sci. 2021;66(10):3359–3374.
14. Wu W, Liu L, Zhu H, et al. Butyrolactone-I, an efficient α-glucosidase inhibitor, improves type 2 diabetes with potent TNF-α-lowering properties through modulating gut microbiota in db/db mice. FASEB j. 2019;33(11):12616–12629.
15. Cani P, Bibiloni R, Knauf C, et al. Changes in gut microbiota control metabolic endotoxemia-induced inflammation in high-fat diet-induced obesity and diabetes in mice. Diabetes. 2008;57(6):1470–1481.
16. Cani P, Amar J, Iglesias M, et al. Metabolic endotoxemia initiates obesity and insulin resistance. Diabetes. 2007;56(7):1761–1772.
17. Pang B, Lian F, Zhao X, et al. Prevention of type 2 diabetes with the traditional Chinese patent medicine: a systematic review and meta-analysis. Diabetes Res Clin Pract. 2017;131:242–259.
18. Tilg H, Moschen A. Microbiota and diabetes: an evolving relationship. Gut. 2014;63(9):1513–1521.
19. Chuengsamarn S, Rattanamongkolgul S, Luechapudiporn R, Phisalaphong C, Jirawatnotai S. Curcumin extract for prevention of type 2 diabetes. Diabetes Care. 2012;35(11):2121–2127.
20. Zhang R, Zhou J, Jia Z, Zhang Y, Gu G. Hypoglycemic effect of Rehmannia glutinosa oligosaccharide in hyperglycemic and alloxan-induced diabetic rats and its mechanism. J Ethnopharmacol. 2004;90(1):39–43.
21. Mendes J, Leandro C, Bonaparte D, Pinto A. A rat model of diabetic wound infection for the evaluation of topical antimicrobial therapies. Comp Med. 2012;62(1):37–48.
22. Yan H, Lu J, Wang Y, Gu W, Yang X, Yu J. Intake of total saponins and polysaccharides from Polygonatum kingianum affects the gut microbiota in diabetic rats. Phytomedicine. 2017;26:45–54.
23. Chen M, Liao Z, Lu B, et al. Huang-Lian-Jie-Du-Decoction Ameliorates Hyperglycemia and Insulin Resistant in Association With Gut Microbiota Modulation. Front Microbiol. 2018;9:2380.
24. Callahan B, McMurdie P, Rosen M, Han A, Johnson A, Holmes S. DADA2: high-resolution sample inference from Illumina amplicon data. Nat Methods. 2016;13(7):581–583.
25. Callahan B, Wong J, Heiner C, et al. High-throughput amplicon sequencing of the full-length 16S rRNA gene with single-nucleotide resolution. Nucleic Acids Res. 2019;47(18):e103.
26. Amir A, McDonald D, Navas-Molina J, et al. Deblur Rapidly Resolves Single-Nucleotide Community Sequence Patterns. mSystems. 2017;2:2.
27. Hagan T, Cortese M, Rouphael N, et al. Antibiotics-Driven Gut Microbiome Perturbation Alters Immunity to Vaccines in Humans. Cell. 2019;178(6):1313–1328.e1313.
28. Vallianou N, Stratigou T, Tsagarakis S. Microbiome and diabetes: where are we now? Diabetes Res Clin Pract. 2018;146:111–118.
29. Sedighi M, Razavi S, Navab-Moghadam F, et al. Comparison of gut microbiota in adult patients with type 2 diabetes and healthy individuals. Microb Pathog. 2017;111:362–369.
30. Fassatoui M, Lopez-Siles M, Díaz-Rizzolo D, et al. Gut microbiota imbalances in Tunisian participants with type 1 and type 2 diabetes mellitus. Biosci Rep. 2019;39:6.
31. Halawa M, El-Salam M, Mostafa B, Sallout S. The Gut Microbiome, Lactobacillus acidophilus; Relation with Type 2 Diabetes Mellitus. Curr Diabetes Rev. 2019;15(6):480–485.
32. Chen P, Chien Y, Yang S. The alteration of gut microbiota in newly diagnosed type 2 diabetic patients. Nutrition. 2019;1:51–56.
33. Zhang P, Li L, Han X, et al. Fecal microbiota transplantation improves metabolism and gut microbiome composition in db/db mice. Acta Pharmacol Sin. 2020;41(5):678–685.
34. Joyce S, Gahan C. Disease-Associated Changes in Bile Acid Profiles and Links to Altered Gut Microbiota. Digestive Dis. 2017;35(3):169–177.
35. Gong P, Xiao X, Wang S, et al. Hypoglycemic effect of astragaloside IV via modulating gut microbiota and regulating AMPK/SIRT1 and PI3K/AKT pathway. J Ethnopharmacol. 2021;281:114558.
36. Zhang S, Zhang N, Guo S, et al. Pueraria thomsoniiGlycosides and flavonoids from the extract of Benth leaf alleviate type 2 diabetes in high-fat diet plus streptozotocin-induced mice by modulating the gut microbiota. Food Funct. 2022;13(7):3931–3945.
37. Guo C, Wang Y, Zhang S, et al. Crataegus pinnatifida polysaccharide alleviates colitis via modulation of gut microbiota and SCFAs metabolism. Int J Biol Macromol. 2021;181:357–368.
38. Zhai Z, Niu K, Liu Y, Lin C, Wu X. Eucommia ulmoidesThe Gut Microbiota-Bile Acids-TGR5 Axis Mediates Leaf Extract Alleviation of Injury to Colonic Epithelium Integrity. Front Microbiol. 2021;12:727681.
39. Zhang W, Xu J, Yu T, Chen Q. Effects of berberine and metformin on intestinal inflammation and gut microbiome composition in db/db mice. Biomed Pharmacother. 2019;118:109131.
40. Cheung S, Goldenthal A, Uhlemann A, Mann J, Miller J, Sublette M. Systematic Review of Gut Microbiota and Major Depression. Front Psychiatry. 2019;10:34.
41. Jasirwan C, Muradi A, Hasan I, Simadibrata M, Rinaldi I. Correlation of gut Firmicutes/Bacteroidetes ratio with fibrosis and steatosis stratified by body mass index in patients with non-alcoholic fatty liver disease. Biosci Microbiota Food Health. 2021;40(1):50–58.
42. Xia F, Wen L, Ge B, Li Y, Li F, Zhou B. Gut microbiota as a target for prevention and treatment of type 2 diabetes: mechanisms and dietary natural products. World J Diabetes. 2021;12(8):1146–1163.
43. Everard A, Cani P. Diabetes, obesity and gut microbiota. Best Pract Res Clin Gastroenterol. 2013;27(1):73–83.
44. Stojanov S, Berlec A, Štrukelj B. The Influence of Probiotics on the Firmicutes/Bacteroidetes Ratio in the Treatment of Obesity and Inflammatory Bowel disease. Microorganisms. 2020;8:11.
45. Qiao S, Bao L, Wang K, et al. Activation of a Specific Gut Bacteroides-Folate-Liver Axis Benefits for the Alleviation of Nonalcoholic Hepatic Steatosis. Cell Rep. 2020;32(6):108005.
46. Liu J, Segovia I, Yuan X, Gao Z. Controversial Roles of Gut Microbiota-Derived Short-Chain Fatty Acids (SCFAs) on Pancreatic β-Cell Growth and Insulin Secretion. Int J Mol Sci. 2020;21(3):215.
47. Wei W, Jiang W, Tian Z, et al. Fecal g. Streptococcus and g. Eubacterium_coprostanoligenes_group combined with sphingosine to modulate the serum dyslipidemia in high-fat diet mice. Clinical Nutrition. 2021;40(6):4234–4245.
48. Qin J, Li Y, Cai Z, et al. A metagenome-wide association study of gut microbiota in type 2 diabetes. Nature. 2012;490(7418):55–60.
49. Wang J, Bose S, Shin N, Chin Y, Choi Y, Kim H. Houttuynia CordataPharmaceutical Impact of and Metformin Combination on High-Fat-Diet-Induced Metabolic Disorders: link to Intestinal Microbiota and Metabolic Endotoxemia. Front Endocrinol (Lausanne). 2018;9:620.
50. Wang C, Xiao Y, Yu L, et al. Bacteroides vulgatusProtective effects of different strains against lipopolysaccharide-induced acute intestinal injury, and their underlying functional genes. J Adv Res. 2022;36:27–37.
51. Lee J, Kwon S, Han J, Cho S, Cho Y, Park J. A mucin-responsive hybrid two-component system controls Bacteroides thetaiotaomicron colonization and gut homeostasis. J Microbiol. 2022;60(2):215–223.
52. Brahe L, Le Chatelier E, Prifti E, et al. Specific gut microbiota features and metabolic markers in postmenopausal women with obesity. Nutr Diabetes. 2015;5:e159.
53. Shin N, Lee J, Lee H, et al. An increase in the Akkermansia spp. population induced by metformin treatment improves glucose homeostasis in diet-induced obese mice. Gut. 2014;63(5):727–735.
54. Depommier C, Everard A, Druart C, et al. Supplementation with Akkermansia muciniphila in overweight and obese human volunteers: a proof-of-concept exploratory study. Nat Med. 2019;25(7):1096–1103.
55. Derrien M, Vaughan E, Plugge C, de Vos W. Akkermansia muciniphila gen. Int j Sys Evolutionary Microbiol. 2004;54:1469–1476.
56. Everard A, Belzer C, Geurts L, et al. Cross-talk between Akkermansia muciniphila and intestinal epithelium controls diet-induced obesity. Proc Natl Acad Sci U S A. 2013;110(22):9066–9071.
57. Kong W, Zhang H, Song D, et al. Berberine reduces insulin resistance through protein kinase C-dependent up-regulation of insulin receptor expression. Metabolism. 2009;58(1):109–119.
58. Fedorak R, Vanner S, Paterson W, Bridges R. Canadian Digestive Health Foundation Public Impact Series 3: irritable bowel syndrome in Canada. J canadien de gastroenterol. 2012;26(5):252–256.
59. Shi X, Wang S, Luan H, et al. Clinopodium chinense Attenuates Palmitic Acid-Induced Vascular Endothelial Inflammation and Insulin Resistance through TLR4-Mediated NF- B and MAPK Pathways. Am J Chin Med. 2019;47(1):97–117.
60. Pahlavani M, Ramalho T, Koboziev I, et al. Adipose tissue inflammation in insulin resistance: review of mechanisms mediating anti-inflammatory effects of omega-3 polyunsaturated fatty acids. J Investigative Med. 2017;65(7):1021–1027.
61. Higuchi I, Kimura Y, Kobayashi M, et al. Relationships between plasma lactate, plasma alanine, genetic variations in lactate transporters and type 2 diabetes in the Japanese population. Drug Metab Pharmacokinet. 2020;35(1):131–138.
62. Dibe H, Townsend L, McKie G, Wright D. Epinephrine responsiveness is reduced in livers from trained mice. Physiol Rep. 2020;8(3):e14370.
63. Zhu Y, Qian X, Li J, et al. Astragaloside-IV protects H9C2 (2-1)cardiomyocytes from high glucose-induced injury via miR-34a-mediated autophagy pathway. Artif Cells, Nanomed Biotechnol. 2019;47(1):4172–4181.
64. Chen X, Han Y, Wang H. Relations of hepatic steatosis with liver functions, inflammations, glucolipid metabolism in chronic hepatitis B patients. Eur Rev Med Pharmacol Sci. 2018;22(17):5640–5646.
65. Wolf P, Winhofer Y, Anderwald C, Krå¡å¡ã¡k M, Krebs M. Intracellular lipid accumulation and shift during diabetes progression. Wiener medizinische Wochenschrift. 2014;164:320–329.
66. Huang S, Peng W, Jiang X, et al. The effect of chromium picolinate supplementation on the pancreas and macroangiopathy in type II diabetes mellitus rats. J Diabetes Res. 2014;2014:717219.
67. Fan Y, He Z, Wang W, et al. Tangganjian decoction ameliorates type 2 diabetes mellitus and nonalcoholic fatty liver disease in rats by activating the IRS/PI3K/AKT signaling pathway. Biomed Pharmacother. 2018;106:733–737.
68. Baek S, Kim K, Kim S, Son Y, Hong H, Yu S. SP prevents T2DM complications by immunomodulation. Sci Rep. 2020;10(1):16753.
69. Senn J, Klover P, Nowak I, Mooney R. Interleukin-6 induces cellular insulin resistance in hepatocytes. Diabetes. 2002;51(12):3391–3399.
70. Yang C, Luo S, Hsieh H, et al. Interleukin-1beta induces ICAM-1 expression enhancing leukocyte adhesion in human rheumatoid arthritis synovial fibroblasts: involvement of ERK, JNK, AP-1, and NF-kappaB. J Cell Physiol. 2010;224(2):516–526.
71. Rotter V, Nagaev I, Smith U. Interleukin-6 (IL-6) induces insulin resistance in 3T3-L1 adipocytes and is, like IL-8 and tumor necrosis factor-alpha, overexpressed in human fat cells from insulin-resistant subjects. J Biol Chem. 2003;278(46):45777–45784.
 © 2022 The Author(s). This work is published and licensed by Dove Medical Press Limited. The
full terms of this license are available at https://www.dovepress.com/terms
and incorporate the Creative Commons Attribution
- Non Commercial (unported, 3.0) License.
By accessing the work you hereby accept the Terms. Non-commercial uses of the work are permitted
without any further permission from Dove Medical Press Limited, provided the work is properly
attributed. For permission for commercial use of this work, please see paragraphs 4.2 and 5 of our Terms.
© 2022 The Author(s). This work is published and licensed by Dove Medical Press Limited. The
full terms of this license are available at https://www.dovepress.com/terms
and incorporate the Creative Commons Attribution
- Non Commercial (unported, 3.0) License.
By accessing the work you hereby accept the Terms. Non-commercial uses of the work are permitted
without any further permission from Dove Medical Press Limited, provided the work is properly
attributed. For permission for commercial use of this work, please see paragraphs 4.2 and 5 of our Terms.
Recommended articles
Electroacupuncture at Lower He-Sea and Front-Mu Acupoints Ameliorates Insulin Resistance in Type 2 Diabetes Mellitus by Regulating the Intestinal Flora and Gut Barrier
Wang H, Chen X, Chen C, Pan T, Li M, Yao L, Li X, Lu Q, Wang H, Wang Z
Diabetes, Metabolic Syndrome and Obesity 2022, 15:2265-2276
Published Date: 30 July 2022
Relationship Between Acyl and Desacyl Ghrelin Levels with Insulin Resistance and Body Fat Mass in Type 2 Diabetes Mellitus
Zang P, Yang CH, Liu J, Lei HY, Wang W, Guo QY, Lu B, Shao JQ
Diabetes, Metabolic Syndrome and Obesity 2022, 15:2763-2770
Published Date: 7 September 2022
The Association Between Sarcopenia and Diabetes: From Pathophysiology Mechanism to Therapeutic Strategy
Chen H, Huang X, Dong M, Wen S, Zhou L, Yuan X
Diabetes, Metabolic Syndrome and Obesity 2023, 16:1541-1554
Published Date: 30 May 2023
Impact of Lipids on Insulin Resistance: Insights from Human and Animal Studies
Elkanawati RY, Sumiwi SA, Levita J
Drug Design, Development and Therapy 2024, 18:3337-3360
Published Date: 31 July 2024
Lipotoxicity: A New Perspective in Type 2 Diabetes Mellitus
Chen B, Li T, Wu Y, Song L, Wang Y, Bian Y, Qiu Y, Yang Z
Diabetes, Metabolic Syndrome and Obesity 2025, 18:1223-1237
Published Date: 24 April 2025