Back to Journals » Diabetes, Metabolic Syndrome and Obesity » Volume 15
Relationship Between Acyl and Desacyl Ghrelin Levels with Insulin Resistance and Body Fat Mass in Type 2 Diabetes Mellitus
Authors Zang P ![]() , Yang CH, Liu J
, Yang CH, Liu J ![]() , Lei HY, Wang W, Guo QY, Lu B, Shao JQ
, Lei HY, Wang W, Guo QY, Lu B, Shao JQ
Received 15 April 2022
Accepted for publication 22 August 2022
Published 7 September 2022 Volume 2022:15 Pages 2763—2770
DOI https://doi.org/10.2147/DMSO.S368770
Checked for plagiarism Yes
Review by Single anonymous peer review
Peer reviewer comments 2
Editor who approved publication: Prof. Dr. Muthuswamy Balasubramanyam
Pu Zang,1,* Cui-Hua Yang,1,* Jun Liu,2 Hai-Yan Lei,2 Wei Wang,1 Qing-Yu Guo,1 Bin Lu,1 Jia-Qing Shao1
1Department of Endocrinology, Jinling Hospital, School of Medicine, Nanjing University, Nanjing, People’s Republic of China; 2Department of Endocrinology, Jinling Hospital, Southern Medical University, Nanjing, People’s Republic of China
*These authors contributed equally to this work
Correspondence: Jia-Qing Shao, Department of Endocrinology, Jinling Hospital, School of Medicine, Nanjing University, 305 East Zhongshan Road, Nanjing, People’s Republic of China, Tel +86-25-80860354, Email [email protected]
Purpose: Although strong evidence suggests that ghrelin plays an important role in regulating energy balance, the effects of acylated ghrelin (AG) and deacylated ghrelin (DAG) on fat mass are largely undefined. This study aimed to investigate the differential associations of both forms of ghrelin with insulin resistance and body fat mass in patients with type 2 diabetes mellitus (T2DM).
Patients and Methods: A total of 162 patients with type 2 diabetes were recruited and classified based on BMI and visceral fat area (VFA) as VFA normal group (n = 78), normal-BMI VFA obesity group (n = 20) and high-BMI VFA obesity group (n = 64). VFA and subcutaneous fat area (SFA) were detected by bioelectrical impedance analysis. Blood samples were collected to measure fasting glucose, insulin, lipids, AG and DAG levels after clinical examination.
Results: Compared with VFA normal group, DAG levels were significantly lower (421.7 ± 106.0 and 388.7 ± 96.5 pg/mL vs 524.4 ± 141.5 pg/mL, P < 0.01) in the two VFA obesity groups. No significant difference was found in AG levels within three groups. Among all subjects, BMI, VFA, SFA, fasting insulin and HOMA-IR were negatively correlated with DAG but positively with AG/DAG ratio (P < 0.01). In contrast, AG was positively correlated with HOMA-IR and fasting glucose (P < 0.01). Multiple stepwise regression analysis showed that fasting glucose was the independent factor of AG, VFA and HOMA-IR were the independent factors related to DAG.
Conclusion: DAG levels have a strong negative association with excess body fat mass and insulin resistance, whereas AG levels are closely related to elevated blood glucose levels in T2DM patients.
Keywords: acylated ghrelin, deacylated ghrelin, body fat mass, insulin resistance, type 2 diabetes mellitus
Introduction
The pathogenesis of type 2 diabetes mellitus (T2DM) is known to involve impaired insulin secretion and insulin resistance (IR). IR is closely related to metabolic syndrome, which is mainly characterized by obesity and metabolic dysfunction leading to increased cardiovascular mortality and morbidity.1 With a significant increase in the global obesity population, IR is prevalent and plays a key pathophysiological role in patients with metabolic syndrome. Thus, it is necessary to explore effective methods to improve insulin resistance and obesity in diabetic individuals.
Ghrelin is a 28-amino acid hormone that is mainly secreted from stomach A-like cells.2 It is divided into acylated ghrelin (AG) and deacylated ghrelin (DAG) according to whether its N-terminal serine residue is acylated.3 Ghrelin circulates in vivo mainly as deacylated ghrelin corresponding to more than 80% of the hormone.4 A growing body of evidence suggests that ghrelin has a role in insulin resistance and development of type 2 diabetes.5,6 Considering that total ghrelin (T-Ghr) is mainly composed of DAG form, T-Ghr and DAG values likely lead to the same conclusions in terms of differences among groups and associations with insulin resistance and glycometabolism in previous studies.7–9 Insulin resistance and obesity are closely related to low circulating levels of total ghrelin (T-Ghr) or DAG.7–10 However, the potential differential effects of two circulating ghrelin forms on energy balance in humans are largely undefined. Ghrelin circulating in acylated form has been reported to have a negative influence on pancreatic insulin secretion and lipid metabolism.11,12 On the other hand, DAG also has important metabolic activities, which presumably are GHSR-independent, including the ability to counteract the effect of AG in certain circumstances.13–15 Studies have shown different results in the circulating levels of AG and DAG in obese individuals, reflected not only at baseline but also at postprandial levels.6,14,15 Since acyl and des-acyl ghrelin appear to have opposite actions and interact with different receptors, it is important to note that assessing total ghrelin levels alone could not reflect the real metabolic status in obesity and diabetes.5,16 Therefore, more research should be conducted to elucidate the differential effects of AG and DAG on metabolic function.
Although BMI was a valuable anthropometric indicator to identify insulin resistance, it is affected by various factors such as age and muscle mass and thus does not accurately measure fat mass and reflect fat distribution.17 Additionally, obese individuals may differ in their fat distribution and disease risk. Regional adipose tissue distribution is suggested to play a crucial role in understanding the relationship between adiposity and metabolism.18,19 Visceral and subcutaneous fat mass is considered as good indicators to assess fat mass and fat distribution; moreover, the accumulation of visceral fat is closely related to adverse cardiovascular events.18,20 Few studies have explored the correlation of ghrelin concentration with fat mass, including visceral and subcutaneous fat. The potential influence of fat mass on different ghrelin forms remains largely undetermined. The goal of the present study was to illustrate the possible relationships among both forms of ghrelin and body fat mass, insulin resistance, and related markers of metabolic abnormalities in T2DM patients.
Materials and Methods
Study Individuals and Experimental Protocol
In a retrospective study, a total of 162 patients with T2DM (109 males and 53 females) were enrolled randomly from the Department of Endocrinology in Jinling Hospital. Their age ranged from 18 to 70 years. The inclusion criteria were diagnosis of T2DM according to the WHO 1999 criteria. Most patients were administered oral hypoglycemic agents (metformin and acarbose), combined with moderate diet and exercise intervention. Twenty-five patients were controlled by diet and exercise, and no subject was using insulin. The numbers of unmedicated patients were comparable among the three groups. The three patient groups were also matched for age, sex, duration of illness, medication type and dosage. The exclusion criteria were diagnosis of T1DM, special types of diabetes mellitus, acute and severe chronic illnesses, liver failure, renal failure, cancer, autoimmune disease and pregnancy. No subject had been treated with weight-reduction surgeries for obesity.
In order to investigate the influence of fat mass on different parameters in the presence of metabolic abnormalities, visceral fat area (VFA) and subcutaneous fat area (SFA) were assessed by dual bioelectrical impedance analysis. According to the Japanese visceral obesity criteria,21 visceral obesity was defined as a VFA ≥100 cm2. Using BMI and VFA value, patients with VFA <100cm2 were classified as VFA normal group (N = 78), VFA ≥ 100 cm2 BMI ≥25kg/m2 were classified as high-BMI VFA obesity group (N = 64) and patients with VFA ≥100cm2 and BMI <25kg/m2 were classified as normal-BMI VFA obesity group (N = 20). The study protocol was approved by the local ethics committee. All patients were informed of the aims of the study.
Anthropometric and Biochemical Data
Medical history including age, gender and other baseline characteristics were gained through medical records. We measured the height and weight of all subjects. Venous blood samples were collected from all subjects in the morning after overnight fasting for at least 8 hours. Fasting blood samples were collected using standard EDTA-aprotinin tubes, then chilled on ice and centrifuged at 4°C as soon as possible. The supernatants were acidified with 1 mol/L HCl (10% of sample volume) and stored at −80°C until assayed. VFA and SFA were measured by the dual bioelectrical impedance analysis method (HDS-2000; Omron Healthcare Co., Ltd.).
Serum Measurements
Insulin concentration was examined by electrochemiluminescence immunoassay (IMMULITE2000 XPi, Siemens, Germany). Other biochemical indices were detected by an automatic biochemical analyzer (Model 7600 Series Automatic Analyzer, Hitachi, Japan). Insulin resistance was quantified using HOMA-IR [fasting insulin (mU/L) × fasting glucose (mmol/L)]/22.5. Plasma acylated ghrelin (AG) and desacyl ghrelin (DAG) levels were determined using ELISA kits (Human acylated and deacylated Ghrelin EIA Kits, Bertin Corporation, reference range: 2–250 pg/mL; intraassay coefficient of variation <5%; interassay coefficient of variation <15%). These tests were done following the manufacturer’s instruction manual. AG/DAG ratio was calculated as AG divided by DAG.
Statistical Analysis
One-way ANOVA was applied to compare the groups for quantitative and chi square test was used for qualitative variables. Correlation analysis was performed using Pearson’s or Spearman’s rank correlation test. The effect of several variables on AG and DAG concentrations was considered with multiple linear regression analysis. P values <0.05 were considered statistically significant. All statistical analyses were conducted using SPSS software version 22.0.
Results
Baseline Characterization and Hormonal Profile Comparison
The clinical characteristics and hormonal profiles of each group are reported in Table 1. No statistically significant difference was observed within the three groups in terms of their age, sex, fasting glucose, TG and LDL. Compared with the visceral normal group, VFA obesity patients with high or normal BMI had significantly higher insulin levels and HOMA-IR (P < 0.01). Besides, TC in high-BMI VFA obesity group was higher than that in VFA normal group, whereas HDL was lower (P < 0.05).
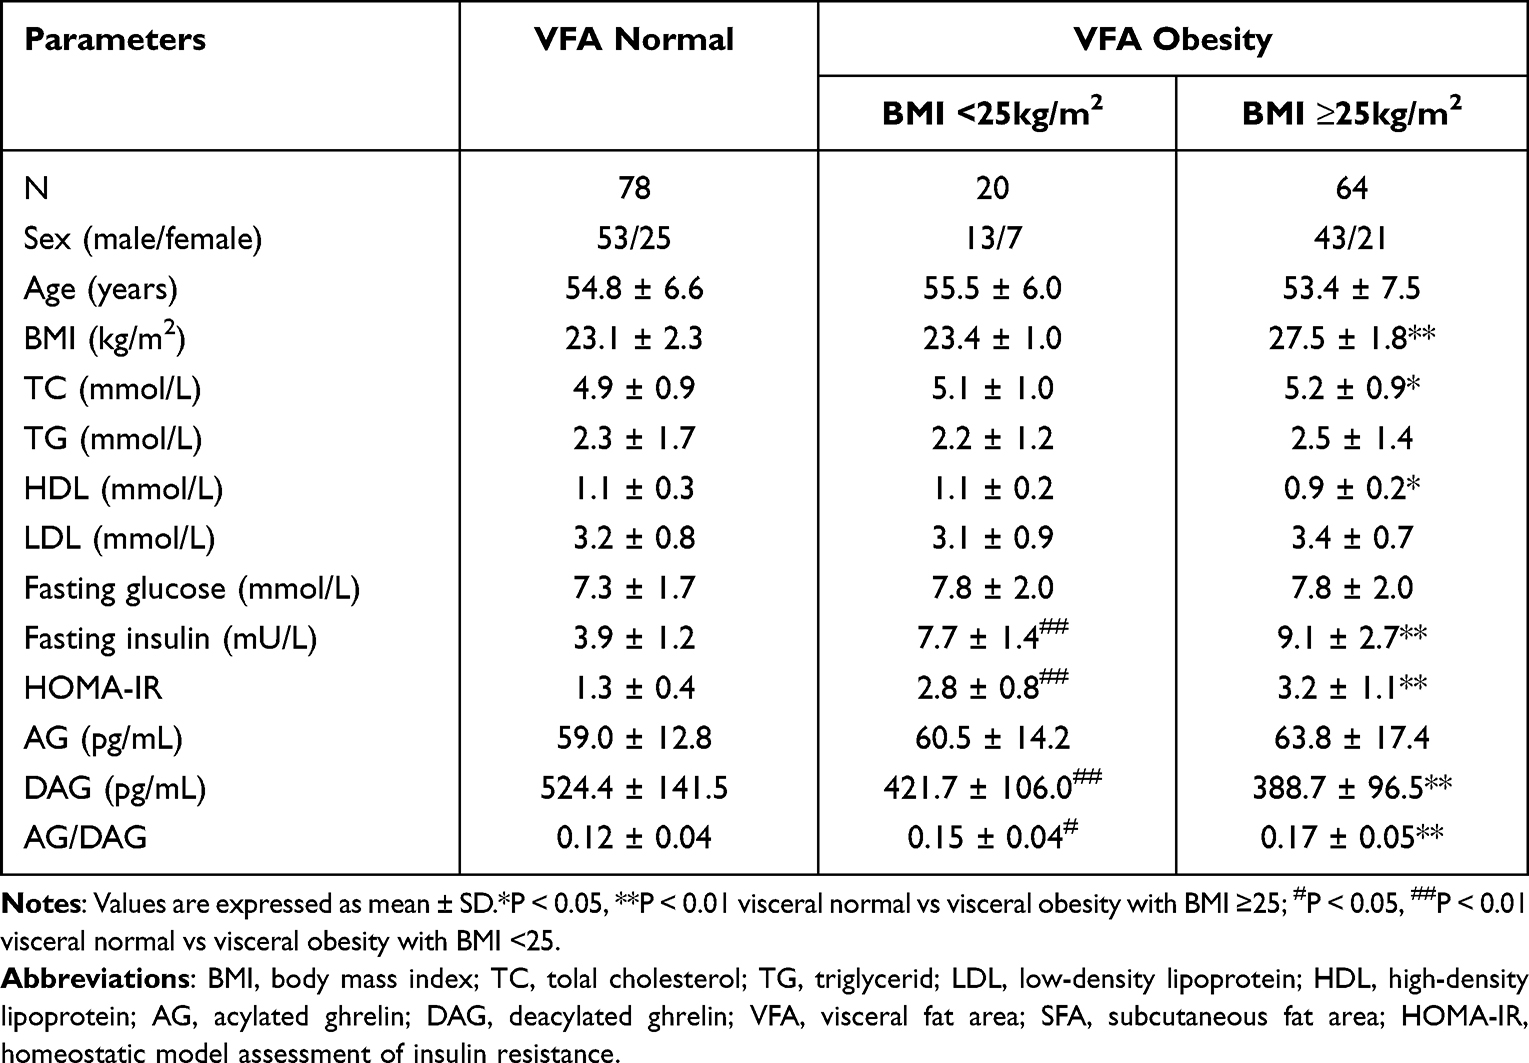 |
Table 1 Comparisons of Baseline Characteristics and Hormonal Profile Among Three Groups of T2DM Subjects |
As shown in Figure 1, compared with VFA normal group, DAG concentrations were significantly lower (421.7 ± 106.0 and 388.7 ± 96.5 pg/mL vs 524.4 ± 141.5 pg/mL, P < 0.01) in the two VFA obesity groups, whereas AG/DAG ratio was significantly higher (P < 0.01). In contrast, no significant difference was observed in AG concentrations within three groups (Figure 2). There were no differences with respect to baseline characteristics of the patients between the two VFA obesity groups.
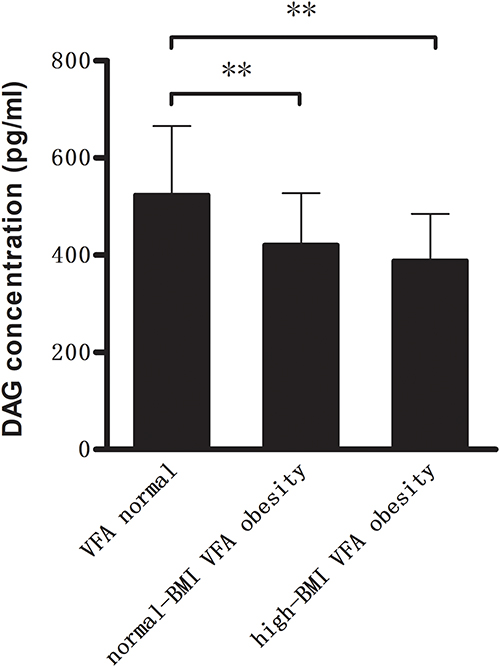 |
Figure 1 Compared with VFA normal group, plasma levels of deacylated ghrelin (DAG) were significantly lower in two VFA obesity groups (**P<0.01). |
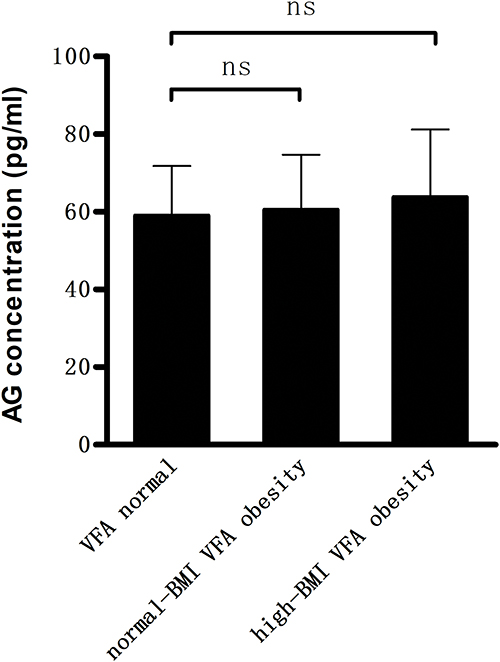 |
Figure 2 Compared with VFA normal group, the two VFA obesity groups showed no significant difference in the plasma levels of acylated ghrelin (AG) (ns.P>0.05). |
The Association Between Clinical Characteristics and AG, DAG and AG/DAG Ratio
In all T2DM patients (n = 162), fasting insulin levels and HOMA-IR were negatively associated with DAG but positively with AG/DAG ratio (P < 0.001). In contrast, AG was positively correlated with HOMA-IR (P = 0.006). Fasting glucose levels showed a positive correlation with AG (P < 0.001), whereas they had no correlations with DAG. A strong inverse correlation was observed between DAG and BMI, VFA, and SFA in the whole studied groups (P < 0.001). In contrast, no difference was found between these obesity parameters and AG. The associations between AG, DAG and AG/DAG ratio with other variables within all individuals are summarized in Table 2.
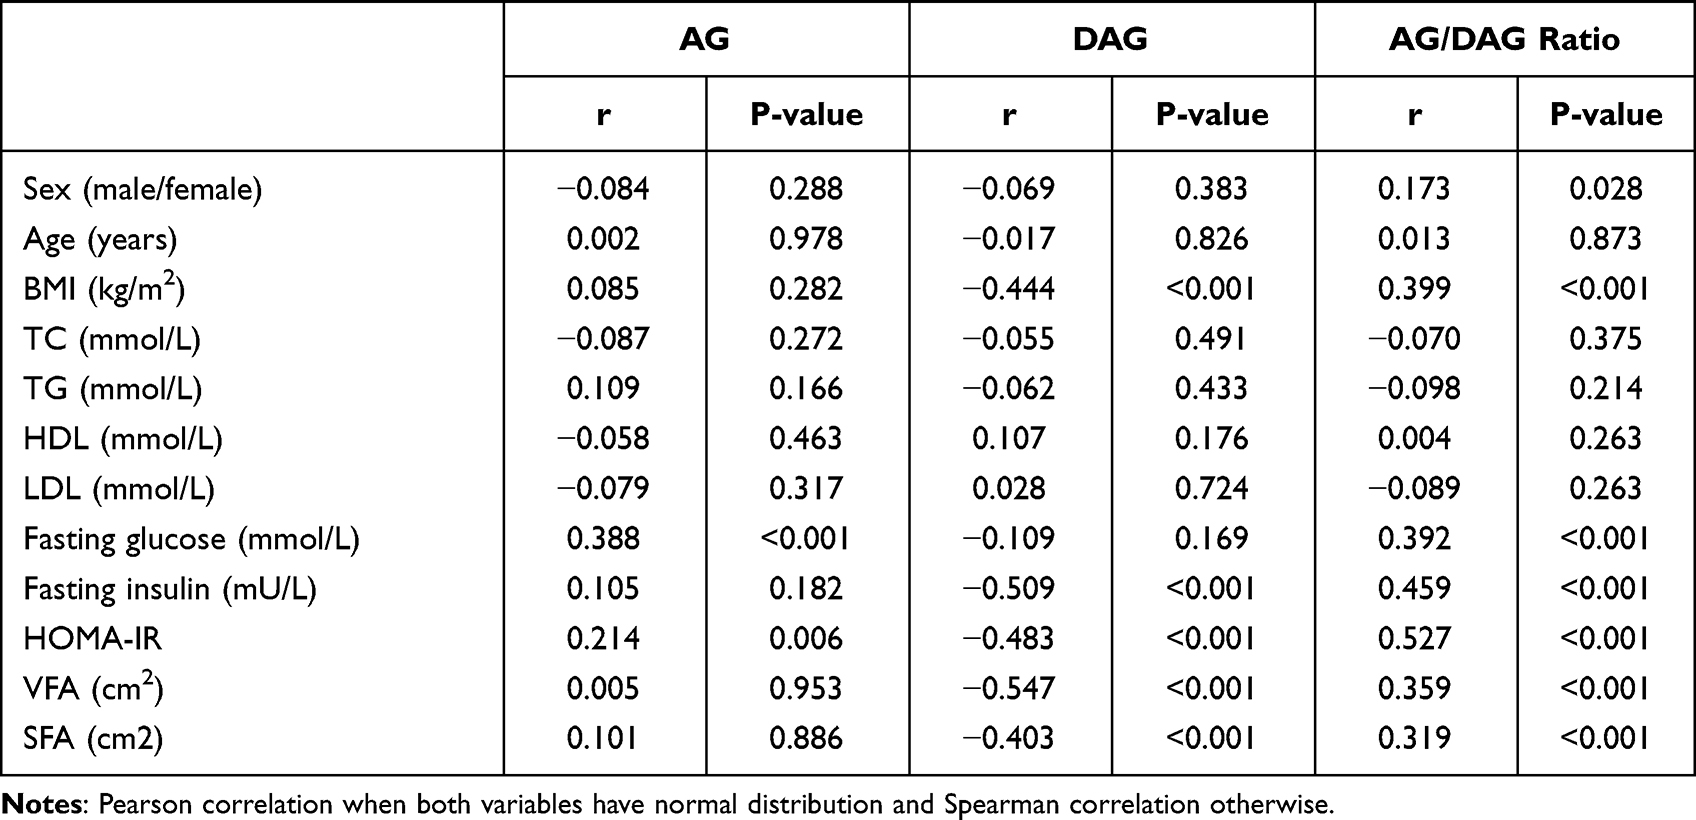 |
Table 2 Correlations Between AG, DAG and AG/DAG Ratio and Other Variables in All Subjects |
Multiple Stepwise Regression Analysis of Influencing Factors of AG and DAG
After multiple stepwise regression analysis, among the parameters only fasting glucose was independently associated with AG concentration (beta = 0.390, P < 0.001). In addition, VFA and HOMA-IR were the independent factors related to DAG concentration (beta = −0.422, −0.196, respectively; P < 0.05). The independent factors associated with AG and DAG are shown in Tables 3 and 4.
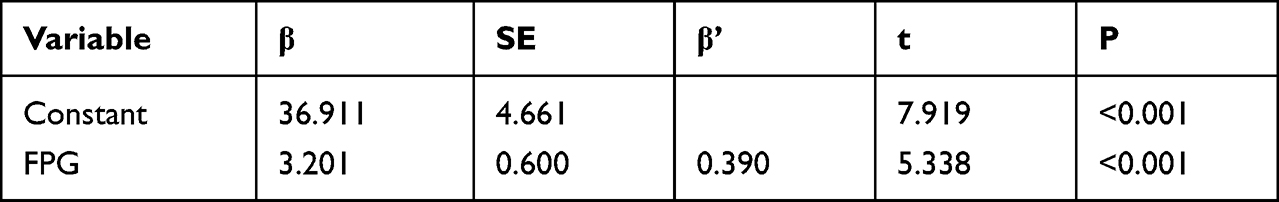 |
Table 3 Multiple Stepwise Regression Analysis of AG Concentration and Other Variables in All Subjects |
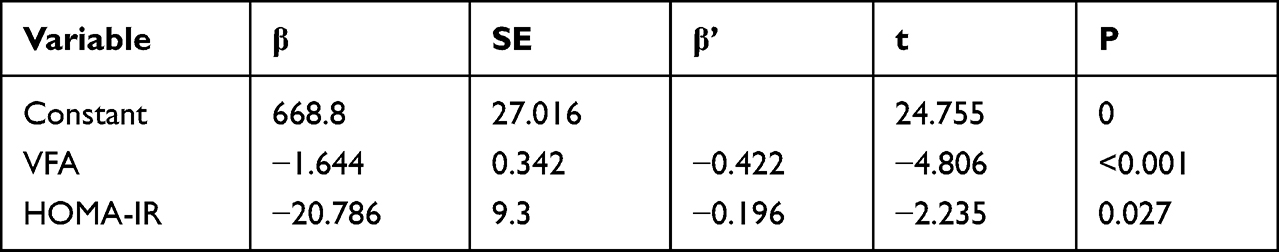 |
Table 4 Multiple Stepwise Regression Analysis of DAG Concentration and Other Variables in All Subjects |
Discussion
The present study assessed the relationship of different circulating forms of ghrelin and their ratio with fat content and insulin resistance in T2DM subjects. AG can simulate food intake, growth hormone secretion and adipogenesis by activating the growth hormone secretagogue receptor 1a (GHSR).5,22 DAG is originally considered as an inactive form of ghrelin since it cannot activate GHSR. However, further research suggests that DAG seems to have a positive impact on energy metabolism, including inhibiting glucose production and improving insulin resistance.14,15,23 Absolute or relative increase of AG potentially has a negative impact on insulin action,12,24 which is contrary to the effect of DAG.23,25 We found that circulating AG is positively correlated with fasting glucose levels; this is in agreement with the previous reports.6,24 Continuous infusion of AG worsens glucose metabolism and acutely reduced oral glucose disposal in humans and rodents.12,24 AG is expressed in pancreatic islets and released into the pancreatic microcirculation, where it suppresses insulin secretion, which may partially explain its physiological role in glucose metabolism.26 In contrast, no difference was observed between DAG and fasting glucose levels, suggesting that DAG levels are not affected by glucose status in T2DM. This is supported by the report that DAG levels are unrelated to glucose homeostasis parameters.27
Although the exact mechanisms of physiological effect of DAG are still unclear, emerging evidence suggests that DAG can counteract the adverse effects of AG on glycometabolism and insulin action.28,29 DAG seems to have inherent effects on energy metabolism that are independent of AG, probably because DAG acts on its own receptor. Those actions of DAG may support or antagonize the effects of AG.15,29 Our results showed that DAG was inversely associated with IR markers such as BMI, fasting insulin levels and HOMA-IR, whereas AG was positively associated with IR. This is in line with the main studies.6–10 DAG can improve insulin sensitivity and metabolic profile independent of GHSR,28–30 but has no effect on basal or stimulated insulin secretion.31 On the other hand, moderate hyperinsulinemia could inhibit ghrelin secretion, and therefore ensue to worsen insulin resistance through progressive reduction of total and deacylated ghrelin in obese individuals32. The potential role of these alterations in the development of obesity and IR should be further tested in future experimental and clinical prospective studies.
Further studies show that the negative correlation between ghrelin and insulin resistance does not remain significant after removing the effects of obesity, which indicates obesity may play a crucial role in ghrelin reduction and insulin resistance.6,8 Excessive fat accumulation is a vital feature of obesity and is largely involved in the development of insulin resistance.33 Additionally, excess visceral fat mass, characterized by abdominal fat accumulation, is strongly related to various metabolic syndrome features and adverse cardiovascular events.18–20 Recently, bioelectrical impedance analysis (BIA) is considered as a fast, simple, noninvasive and readily reliable body composition assessment technique with a good association with dual-energy X-ray absorptiometry (DXA) results.34 Thus, this study assessed VFA and SFA of T2DM patients by bioelectrical impedance analysis.
Previous observations have shown that obese mice and humans have lower DAG levels than their normal-weight counterparts where AG levels are similar, suggesting that obesity may reflect a relative DAG deficiency8,35,36 Our study found that compared with VFA normal group, VFA obese individuals with high or normal BMI have lower DAG levels and higher HOMA-IR. VFA was significantly negatively correlated with DAG levels. Further analyses showed that VFA and IR were the only two definite independent correlation factors for DAG. These results provide evidence that excess visceral fat mass is involved in the reduction of DAG concentrations, even in the normal-BMI VFA obese individuals. In addition, lower DAG levels have been identified as potential contributors to obesity-related reduction of insulin sensitivity;9,10,35 this is probably because obese subjects have lower levels of insulin receptors, which increase insulin levels in consequence.37 Besides, DAG can inhibit inflammation of adipose tissue caused by HFD and decrease macrophage infiltration of adipose tissue, thus alleviating obesity and improving insulin sensitivity in rodents.36 In contrast, administering AG reduces energy expenditure, enhances gene expression of fat storage-promoting enzymes in adipose tissue, and consequently promotes adipose tissue deposition in animal models.38 No correlation between AG concentrations and body fat mass was found in the study. Perhaps, the influencing factors and metabolic mechanism of AG are more complicated in the human body. Further research is needed to observe this issue in humans.
The balance of two different forms of ghrelin was assessed by AG/DAG ratio in our study. The high AG/DAG ratio in obese individuals indicates that excess visceral fat mass is likely to be related to attenuated ghrelin acylation.16 Furthermore, AG/DAG ratio was significantly positively correlated with insulin resistance and body fat mass, suggesting that the modulation of AG/DAG ratio may be a new treatment strategy for obese-related individuals.16,39
The present study is limited by its retrospective design and a relatively small sample size. The link between both forms of ghrelin and body fat mass can suggest but not prove causality. Thus, prospective cohort studies with larger sample size are needed to validate these findings. In addition, we did not investigate the ghrelin values after a standardized meal in T2DM patients, and this data may provide additional useful information. Nevertheless, the results provide more evidence of the correlation between different forms of ghrelin and body fat mass.
Conclusion
This study demonstrates that AG and DAG differentially affect body fat mass and glycometabolism in T2DM patients. DAG was negatively correlated with insulin resistance and body fat mass, whereas it did not associate with glucose homeostasis parameters. In contrast, AG was closely related to elevated blood glucose levels but unrelated to body fat mass. Further research is warranted to better understand the different roles and mechanisms of AG and DAG in human obesity and energy homeostasis.
Ethical Statement
This study was approved by the Ethics Committee of Jinling Hospital, Nanjing University, and was performed according to the Declaration of Helsinki. As our study was retrospective design, the individual Institutional Review Boards or the Data Protection and Research committees waived the requirement of informed consent due to appropriate handling of patient data and maintenance of patient data confidentiality.
Acknowledgments
This work was supported by Jiangsu Provincial Natural Science Foundation (BK20150558), Postdoctoral Foundation of China (2018M633693), and Jinling Hospital Foundation (YYBJ 2021046).
Disclosure
The authors report no conflicts of interest in this work.
References
1. Grundy SM. Metabolic syndrome: connecting and reconciling cardiovascular and diabetes worlds. J Am Coll Cardiol. 2006;47(6):1093–1100. doi:10.1016/j.jacc.2005.11.046
2. Kojima M, Hosoda H, Date Y, et al. Ghrelin is a growth-hormone-releasing acylated peptide from stomach. Nature. 1999;402(6762):656–660. doi:10.1038/45230
3. Kojima M, Ida T, Sato T. Structure of mammalian and nonmammalian ghrelins. Vitam Horm. 2008;77:31–46.
4. Delhanty PJ, Huisman M, Julien M, et al. The acylated (AG) to unacylated (UAG) ghrelin ratio in esterase inhibitor-treated blood is higher than previously described. Clin Endocrinol. 2015;82(1):142–146. doi:10.1111/cen.12489
5. Sovetkina A, Nadir R, Fung JNM, Nadjarpour A, Beddoe B. The physiological role of ghrelin in the regulation of energy and glucose homeostasis. Cureus. 2020;12(5):e7941. doi:10.7759/cureus.7941
6. Mani BK, Shankar K, Zigman JM. Ghrelin’s relationship to blood glucose. Endocrinology. 2019;160(5):1247–1261. doi:10.1210/en.2019-00074
7. Papandreou D, Karavolias C, Arvaniti F, et al. Fasting ghrelin levels are decreased in obese subjects and are significantly related with insulin resistance and body mass index. Open Access Maced J Med Sci. 2017;5(6):699–702. doi:10.3889/oamjms.2017.182
8. Al Qarni AA, Joatar FE, Das N, et al. Association of plasma ghrelin levels with insulin resistance in type 2 diabetes mellitus among Saudi subjects. Endocrinol Metab. 2017;32(2):230–240. doi:10.3803/EnM.2017.32.2.230
9. Barazzoni R, Zanetti M, Ferreira C, et al. Relationships between desacylated and acylated ghrelin and insulin sensitivity in the metabolic syndrome. J Clin Endocrinol Metab. 2007;92(10):3935–3940. doi:10.1210/jc.2006-2527
10. Barazzoni R, Gortan Cappellari G, Semolic A, et al. Plasma total and unacylated ghrelin predict 5-year changes in insulin resistance. Clin Nutr. 2016;35(5):1168–1173. doi:10.1016/j.clnu.2015.10.002
11. Barazzoni R, Bosutti A, Stebel M, et al. Ghrelin regulates mitochondrial-lipid metabolism gene expression and tissue fat distribution in liver and skeletal muscle. Am J Physiol Endocrinol Metab. 2005;288(1):E228–235. doi:10.1152/ajpendo.00115.2004
12. Broglio F, Prodam F, Riganti F, et al. The continuous infusion of acylated ghrelin enhances growth hormone secretion and worsens glucose metabolism in humans. J Endocrinol Invest. 2008;31(9):788–794. doi:10.1007/BF03349259
13. Delhanty PJ, Neggers SJ, van der Lely AJ. Des-acyl ghrelin: a metabolically active peptide. Endocr Dev. 2013;25:112–121.
14. Ozcan B, Neggers SJ, Miller AR, et al. Does des-acyl ghrelin improve glycemic control in obese diabetic subjects by decreasing acylated ghrelin levels? Eur J Endocrinol. 2014;170(6):799–807. doi:10.1530/EJE-13-0347
15. Delhanty PJ, Neggers S, van der Lely AJ. Should we consider des-acyl ghrelin as a separate hormone and if so, what does it do? Front Horm Res. 2014;42:163–174.
16. Gortan Cappellari G, Barazzoni R. Ghrelin forms in the modulation of energy balance and metabolism. Eat Weight Disord. 2019;24(6):997–1013. doi:10.1007/s40519-018-0599-6
17. Hayakawa YK, Sasaki H, Takao H, et al. The relationship of waist circumference and body mass index to grey matter volume in community dwelling adults with mild obesity. Obes Sci Pract. 2018;4(1):97–105. doi:10.1002/osp4.145
18. Preis SR, Massaro JM, Robins SJ, et al. Abdominal subcutaneous and visceral adipose tissue and insulin resistance in the Framingham heart study. Obesity. 2010;18(11):2191–2198. doi:10.1038/oby.2010.59
19. Larsson SC, Wolk A, Håkansson N, Bäck M. Overall and abdominal obesity and incident aortic valve stenosis: two prospective cohort studies. Eur Heart J. 2017;38(28):2192–2197. doi:10.1093/eurheartj/ehx140
20. Liu L, Feng J, Zhang G, et al. Visceral adipose tissue is more strongly associated with insulin resistance than subcutaneous adipose tissue in Chinese subjects with pre-diabetes. Curr Med Res Opin. 2018;34(1):123–129. doi:10.1080/03007995.2017.1364226
21. Examination Committee of Criteria for’Obesity Disease’in Japan. New criteria for ‘obesity disease’ in Japan. Guideline Circ J. 2022;66(11):987–992.
22. Wren AM, Small CJ, Ward HL, et al. The novel hypothalamic peptide ghrelin stimulates food intake and growth hormone secretion. Endocrinology. 2000;141(11):4325–4328. doi:10.1210/endo.141.11.7873
23. Delhanty PJ, Huisman M, Baldeon-Rojas LY, et al. Des-acyl ghrelin analogs prevent high-fat-diet-induced dysregulation of glucose homeostasis. FASEB J. 2013;27(4):1690–1700. doi:10.1096/fj.12-221143
24. Wadden D, Cahill F, Amini P, et al. Serum acylated ghrelin concentrations in response to short-term overfeeding in normal weight, overweight, and obese men. PLoS One. 2012;7(9):e45748. doi:10.1371/journal.pone.0045748
25. Benso A, St-Pierre DH, Prodam F, et al. Metabolic effects of overnight continuous infusion of unacylated ghrelin in humans. Eur J Endocrinol. 2012;166(5):911–916. doi:10.1530/EJE-11-0982
26. Dezaki K, Yada T. Islet β-cell ghrelin signaling for inhibition of insulin secretion. Methods Enzymol. 2012;514:317–331.
27. Veiga L, Brito M, Silva C, Silva-Nunes J. Glucose homeostasis in obese women is not associated to unacylated ghrelin plasma levels. Biomark Insights. 2020;15:1177271920928923. doi:10.1177/1177271920928923
28. Gauna C, Meyler F, Janssen JA, et al. Administration of acylated ghrelin reduces insulin sensitivity, whereas the combination of acylated plus unacylated ghrelin strongly improves insulin sensitivity. J Clin Endocrinol Metab. 2004;89(10):5035–5042. doi:10.1210/jc.2004-0363
29. Delhanty PJ, Neggers S, van der Lely AJ. Mechanisms in endocrinology: ghrelin: the differences between acyl- and des-acyl ghrelin. Eur J Endocrinol. 2012;167(5):601–608. doi:10.1530/EJE-12-0456
30. Delhanty PJ, Sun Y, Visser JA, et al. Unacylated ghrelin rapidly modulates lipogenic and insulin signaling pathway gene expression in metabolically active tissues of GHSR deleted mice. PLoS One. 2010;5(7):e11749. doi:10.1371/journal.pone.0011749
31. Tong J, Davis HW, Summer S, et al. Acute administration of unacylated ghrelin has no effect on basal or stimulated insulin secretion in healthy humans. Diabetes. 2014;63(7):2309–2319. doi:10.2337/db13-1598
32. Blijdorp K, van der Lely AJ, van den Heuvel-Eibrink MM, et al. Desacyl ghrelin is influenced by changes in insulin concentration during an insulin tolerance test. Growth Horm IGF Res. 2013;23(5):193–195. doi:10.1016/j.ghir.2013.06.003
33. Patel P, Abate N. Body fat distribution and insulin resistance. Nutrients. 2013;5(6):2019–2027. doi:10.3390/nu5062019
34. Ward LC. Bioelectrical impedance analysis for body composition assessment: reflections on accuracy, clinical utility, and standardisation. Eur J Clin Nutr. 2019;73(2):194–199. doi:10.1038/s41430-018-0335-3
35. Wang YM, Wu QX, Zhou Q, et al. Circulating acyl and des-acyl ghrelin levels in obese adults: a systematic review and meta-analysis. Sci Rep. 2022;12(1):2679. doi:10.1038/s41598-022-06636-3
36. Yuan F, Zhang Q, Dong H, et al. Effects of des-acyl ghrelin on insulin sensitivity and macrophage polarization in adipose tissue. J Transl Int Med. 2021;9(2):84–97. doi:10.2478/jtim-2021-0025
37. Goldfine ID. The insulin receptor: molecular biology and transmembrane signaling. Endocr Rev. 1987;8(3):235–255. doi:10.1210/edrv-8-3-235
38. Theander-Carrillo C, Wiedmer P, Cettour-Rose P, et al. Ghrelin action in the brain controls adipocyte metabolism. J Clin Invest. 2006;116(7):1983–1993. doi:10.1172/JCI25811
39. Perna S, Spadaccini D, Gasparri C, et al. Association between des-acyl ghrelin at fasting and predictive index of muscle derangement, metabolic markers and eating disorders: a cross-sectional study in overweight and obese adults. Nutr Neurosci. 2022;25(2):336–342. doi:10.1080/1028415X.2020.1752997
 © 2022 The Author(s). This work is published and licensed by Dove Medical Press Limited. The
full terms of this license are available at https://www.dovepress.com/terms
and incorporate the Creative Commons Attribution
- Non Commercial (unported, 3.0) License.
By accessing the work you hereby accept the Terms. Non-commercial uses of the work are permitted
without any further permission from Dove Medical Press Limited, provided the work is properly
attributed. For permission for commercial use of this work, please see paragraphs 4.2 and 5 of our Terms.
© 2022 The Author(s). This work is published and licensed by Dove Medical Press Limited. The
full terms of this license are available at https://www.dovepress.com/terms
and incorporate the Creative Commons Attribution
- Non Commercial (unported, 3.0) License.
By accessing the work you hereby accept the Terms. Non-commercial uses of the work are permitted
without any further permission from Dove Medical Press Limited, provided the work is properly
attributed. For permission for commercial use of this work, please see paragraphs 4.2 and 5 of our Terms.
Recommended articles
Tang-Ping-San Decoction Remodel Intestinal Flora and Barrier to Ameliorate Type 2 Diabetes Mellitus in Rodent Model
Yin W, Zhang SQ, Pang WL, Chen XJ, Wen J, Hou J, Wang C, Song LY, Qiu ZM, Liang PT, Yuan JL, Yang ZS, Bian Y
Diabetes, Metabolic Syndrome and Obesity 2022, 15:2563-2581
Published Date: 20 August 2022
Metabolic Characteristics of Gestational Diabetes Mellitus and the Effects on Pregnancy Outcomes
Luo P, Fan Y, Xiong Y, Zhang C, Yang Z, Sun F, Mei B
Diabetes, Metabolic Syndrome and Obesity 2023, 16:15-29
Published Date: 11 January 2023
The Association Between Sarcopenia and Diabetes: From Pathophysiology Mechanism to Therapeutic Strategy
Chen H, Huang X, Dong M, Wen S, Zhou L, Yuan X
Diabetes, Metabolic Syndrome and Obesity 2023, 16:1541-1554
Published Date: 30 May 2023
Impact of Lipids on Insulin Resistance: Insights from Human and Animal Studies
Elkanawati RY, Sumiwi SA, Levita J
Drug Design, Development and Therapy 2024, 18:3337-3360
Published Date: 31 July 2024
Lipotoxicity: A New Perspective in Type 2 Diabetes Mellitus
Chen B, Li T, Wu Y, Song L, Wang Y, Bian Y, Qiu Y, Yang Z
Diabetes, Metabolic Syndrome and Obesity 2025, 18:1223-1237
Published Date: 24 April 2025