Back to Journals » Journal of Hepatocellular Carcinoma » Volume 13
Subgroup-Specific Nomogram for Refined Risk Stratification in Hepatocellular Carcinoma Patients with Low LDL-C
Authors Liu B, Gu Z, Li L, Li L, Jin R, Hu C
Received 18 April 2026
Accepted for publication 9 June 2026
Published 15 June 2026 Volume 2026:13 616354
DOI https://doi.org/10.2147/JHC.S616354
Checked for plagiarism Yes
Review by Single anonymous peer review
Peer reviewer comments 2
Editor who approved publication: Dr Mohamed Shaker
Bojun Liu,1,* Zhixia Gu,2– 5,* Ling Li,6,* Lei Li,2– 5 Ronghua Jin,2– 5 Caixia Hu1
1Hepatic Disease and Oncology Minimally Invasive Interventional Center, Beijing Youan Hospital, Capital Medical University, Beijing, 100069, People’s Republic of China; 2National Key Laboratory of Intelligent Tracking and Forecasting for Infectious Diseases, Beijing Ditan Hospital, Capital Medical University, Beijing, 100015, People’s Republic of China; 3Beijing Institute of Infectious Disease, Beijing, 100015, People’s Republic of China; 4National Center for Infectious Diseases, Beijing Ditan Hospital, Capital Medical University, Beijing, 100015, People’s Republic of China; 5Beijing Key Laboratory of Viral Infectious Diseases, Beijing Ditan Hospital, Capital Medical University, Beijing, 100015, People’s Republic of China; 6Department of Severe Hepatology, Shandong Public Health Clinical Center, Jinan, Shandong, 250102, People’s Republic of China
*These authors contributed equally to this work
Correspondence: Ronghua Jin; Caixia Hu, Email [email protected]; [email protected]
Background: Hepatocellular carcinoma (HCC) exhibits high mortality and clinical heterogeneity. While low low-density lipoprotein cholesterol (LDL-C) is a recognized risk factor for HCC, its continuous dose-response relationship with overall survival (OS) remains unclear. Furthermore, existing prognostic models lack precision for this specific high-risk population, highlighting an urgent need for individualized risk stratification.
Methods: A retrospective cohort of 486 HCC patients treated at Beijing You’an Hospital (January 1, 2015–January 1, 2021) was analyzed. Restricted cubic splines (RCS) and Cox regression evaluated the LDL-C and OS dose-response relationship. Following quartile stratification (Q1–Q4), the cohort was dichotomized into low (Q1+Q2, n=245) and high (Q3+Q4, n=241) LDL-C groups. Within the high-risk low LDL-C subgroup, least absolute shrinkage and selection operator (LASSO) regression identified core features to construct a specific nomogram, validated via concordance index (C-index), receiver operating characteristic (ROC) curves, calibration, decision curve analysis (DCA), and Kaplan-Meier (KM) curves for risk stratification.
Results: RCS analysis revealed a non-linear relationship: mortality risk increased as baseline LDL-C decreased below 2.2 mmol/L. Multivariable Cox regression confirmed LDL-C as an independent protective factor for OS (HR=0.714, 95% CI: 0.539– 0.947, P=0.019). KM analysis demonstrated significantly inferior OS in the low LDL-C cohort compared to the high LDL-C group (P=0.013). The subgroup-specific nomogram, integrating drinking history, Barcelona Clinic Liver Cancer stage, tumor number, and thrombin time, exhibited good discrimination (C-index=0.686; 3- and 5-year AUCs=0.752 and 0.696, respectively), accurate calibration, and positive clinical benefit. Furthermore, the model achieved secondary risk stratification within this subgroup (P< 0.0001).
Conclusion: Lower baseline LDL-C is an independent predictor of worse OS. The developed subgroup-specific nomogram provides an objective tool for secondary risk stratification, aiding personalized therapeutic management for this high-risk population.
Keywords: hepatocellular carcinoma, HCC, low-density lipoprotein cholesterol, LDL-C, nomogram, overall survival, os, risk stratification
Introduction
Hepatocellular carcinoma (HCC) is a major global health issue with a poor prognosis and high biological complexity.1–4 As the primary organ for lipid metabolism, the liver maintains lipid homeostasis by regulating the synthesis and clearance of low-density lipoprotein cholesterol (LDL-C).5 However, this balance is frequently disrupted by hepatic inflammation, cirrhosis, and the tumor microenvironment.6,7 Recent evidence indicates that cholesterol metabolism reprogramming is not just a metabolic consequence but an active factor promoting tumor progression.8,9
In cardiovascular medicine, reducing LDL-C levels provides established clinical benefits.10 However, this relationship is often reversed in advanced liver diseases and malignancies, presenting a lipid paradox.11–13 Studies show that patients with HCC frequently develop hypolipidemia due to impaired hepatic synthetic function or increased cholesterol consumption by tumor cells.6,14 Recent epidemiological and Mendelian randomization studies have reported an inverse association between serum lipid levels and HCC risk.11–13 Although these studies demonstrate a link between lipid profiles and HCC susceptibility, quantitative evidence regarding the non-linear dose-response relationship between continuous LDL-C levels and overall survival (OS) in patients with HCC remains limited.
Despite the clinical relevance of lipid dysregulation in HCC,12 its application in routine practice is limited. Due to the high clinical and biological heterogeneity of liver cancer,15 patients with HCC and low LDL-C form a diverse population with varied survival outcomes. Identifying patients with the highest mortality risk within this low LDL-C subgroup is necessary to achieve accurate risk stratification.3 Currently, most staging and scoring systems for HCC are based on the general patient population,16,17 and the majority of these existing models do not incorporate lipid metabolic parameters, leaving a gap in individualized risk assessment. Consequently, few studies have developed individualized survival prediction tools for this specific high-risk cohort.
To address this unmet clinical need, the present study was designed with a stepwise approach. The primary objective was to evaluate the independent prognostic value of continuous LDL-C levels and quantitatively analyze their non-linear dose-response relationship with overall survival in a generalized HCC cohort using restricted cubic splines (RCS). Subsequently, building upon the identified risk threshold, our secondary objective was to develop and internally validate a targeted, subgroup-specific nomogram specifically for patients within the low LDL-C cohort. By applying the least absolute shrinkage and selection operator (LASSO) algorithm for optimal feature selection, this model aims to provide clinicians with a practical and quantitative tool to assist in refined risk stratification and personalized therapeutic decision-making.
Methods
Study Populations
A total of 486 patients with HCC treated at Beijing You’an Hospital, Capital Medical University, between January 1, 2015, and January 1, 2021, were enrolled in this retrospective study. The diagnosis of HCC was established in accordance with the American Association for the Study of Liver Diseases (AASLD) guidelines. The inclusion criteria were as follows: (1) confirmed diagnosis of hepatitis B virus (HBV) infection; (2) aged between 18 and 80 years; (3) availability of complete baseline serum LDL-C records and follow-up data; (4) Barcelona Clinic Liver Cancer (BCLC) stage 0, A, or B; (5) Child-Pugh class A or B. Patients who met any of the following criteria were excluded from the study: (1) presence of concurrent primary malignancies; (2) secondary (metastatic) liver cancer; (3) severe organ dysfunction, including severe cardiovascular, cerebrovascular, pulmonary, or renal diseases, or severe non-hepatogenic coagulopathy; (4) Patients with missing baseline LDL-C or follow-up survival data were excluded from the final analytical cohort, in strict adherence to a complete-case analysis approach. This study was approved by the Ethics Committee of Beijing You’an Hospital, Capital Medical University, and was conducted in strict adherence to the principles of the Declaration of Helsinki (LL-2023-131-K). The requirement for written informed consent was waived due to the retrospective design of the study.
Data Collection and Definitions
Clinical data of the patients were consecutively extracted from the hospital’s electronic medical record (EMR) system. The baseline information collected encompassed the following categories:
(1) Demographics, medical history, and clinical status: data on prior medical history (hypertension and diabetes), receipt of antiviral therapy, and the presence of cirrhosis (diagnosed via imaging or histology) were recorded.
(2) Laboratory parameters: all blood samples were collected prior to treatment and analyzed using standard laboratory methods. (I) Liver function and protein profiles: albumin (Alb), globulin (Glob), total bilirubin (TBIL), direct bilirubin (DBIL), gamma-glutamyl transferase (GGT), alanine aminotransferase (ALT), aspartate aminotransferase (AST), and alkaline phosphatase (ALP); (II) Renal function and electrolytes: creatinine (Cr), blood urea nitrogen (BUN), uric acid (UA), and serum potassium, sodium, and chloride levels; (III) Lipid profiles and apolipoproteins: LDL-C, high-density lipoprotein cholesterol (HDL-C), triglycerides (TG), apolipoprotein A1 (ApoA1), and apolipoprotein B (ApoB), as well as the calculated ApoA1/ApoB ratio; (IV) Hematological and inflammatory indices: white blood cell (WBC), red blood cell (RBC), and hemoglobin (Hb); (V) Coagulation profiles: prothrombin time (PT), international normalized ratio (INR), activated partial thromboplastin time (APTT), fibrinogen (Fib), and thrombin time (TT). Specifically, serum LDL-C levels were measured using the direct enzymatic colorimetric method. All biochemical analyses were performed collectively in the central clinical laboratory of our hospital using a fully automated chemistry analyzer. To ensure measurement consistency and accuracy, all procedures were strictly conducted by certified laboratory technicians in accordance with standard operating protocols.
(3) Tumor characteristics and staging systems: the level of the tumor marker alpha-fetoprotein (AFP) was recorded. Tumor burden, including tumor size (maximum diameter) and number, was evaluated via imaging. Liver functional reserve was assessed using the Child-Pugh score, and clinical staging was determined according to the BCLC staging system.
(4) Follow-up and clinical endpoints: The primary endpoint was OS, defined as the time interval from the date of diagnosis to death from any cause or the final follow-up on January 1, 2022.
TACE Sequential Local Ablation
All enrolled patients underwent a sequential therapeutic regimen comprising transarterial chemoembolization (TACE) and subsequent local ablation. All procedures were performed by physicians with a minimum of five years of clinical experience. Local ablation, including radiofrequency ablation (RFA), microwave ablation (MWA), or argon helium cryoablation (AHC) under ultrasound (US) or computed tomography (CT) guidance, was performed one to two weeks post-TACE to achieve in situ tumor necrosis.
The TACE procedure was performed via femoral artery access using the modified Seldinger technique. Diagnostic angiography of the common hepatic or superior mesenteric arteries was conducted to assess the tumor location and its vascular supply. Following this, superselective catheterization of the tumor-feeding branches was performed with a microcatheter. An embolic mixture containing lipiodol and chemotherapeutic drugs (oxaliplatin, fluorouracil, or epirubicin) was injected, supplemented by gelatin sponge particles. The specific formulation and dosage were tailored to the patient’s liver function and tumor status, aiming to completely block the tumor blood flow while protecting the healthy liver tissue. Finally, a post-operative angiography was performed immediately to confirm the successful occlusion of the target vessels.
Statistical Analysis
Continuous variables were expressed as the mean ± standard deviation (SD) or median (interquartile range, IQR) depending on their distribution, which was assessed using the Shapiro–Wilk test. Comparisons between groups were performed using Student’s t-test or the Mann–Whitney U-test, as appropriate. Categorical variables were presented as frequencies and percentages, and compared using the chi-square test or Fisher’s exact test. Kernel density estimation (KDE) was employed to depict the probability distribution characteristics of serum LDL-C in the overall population. All statistical analyses were conducted using R software (version 4.5.1). A two-sided P < 0.05 was considered statistically significant.
To evaluate the potential complex non-linear association between LDL-C and mortality risk, RCS analysis was utilized. LDL-C was modeled using restricted cubic splines with 4 knots placed at the default Harrell-recommended percentiles (5th, 35th, 65th, and 95th percentiles). By setting knots across the continuous distribution of LDL-C, the dose-response relationship between LDL-C and OS was flexibly characterized, thereby avoiding the bias introduced by assuming a predefined linear relationship. Patients were stratified into four groups (Q1-Q4) based on the quartiles of baseline LDL-C, and survival curves were plotted using the Kaplan-Meier (KM) method. Differences in survival rates between groups were statistically compared using the Log rank test.
Within the identified high-risk subgroup with low LDL-C, the LASSO regression analysis, coupled with 10-fold cross-validation, was applied to address potential multicollinearity among variables, select the most predictive and parsimonious feature set, and mitigate the risk of overfitting. The optimal regularization parameter (λ) was determined by minimizing the 10-fold cross-validated partial likelihood deviance, which served as a rigorous internal validation mechanism to penalize model complexity. Variables retaining non-zero coefficients after LASSO penalization were selected as candidate predictors. A nomogram was constructed using the rms package in R software.
To comprehensively validate the performance of the nomogram model, Harrell’s concordance index (C-index) was calculated to assess the overall discriminative ability of the model. Time-dependent receiver operating characteristic (ROC) curves were plotted, and the area under the curve (AUC) was calculated to evaluate the predictive efficacy at specific time points. Furthermore, calibration curves (bias-corrected via 1000 bootstrap resamples) and decision curve analysis (DCA) were employed to verify the accuracy and clinical utility of the model, respectively. Finally, patients in the subgroup were stratified into high-risk and low-risk groups based on the total score calculated from the nomogram, and KM curves were utilized to compare survival differences between the two risk groups.
Results
Baseline Characteristics and Distribution of Serum LDL-C Levels
We characterized the baseline distribution of serum LDL-C levels in the study cohort (n = 486). The kernel density estimation plot revealed an approximately normal distribution of LDL-C, with a mean of 2.23 ± 0.72 mmol/L (Figure 1A). Using the RCS model to characterize the non-linear association, we observed a sharp increase in mortality risk as serum LDL-C levels decreased. A clear monotonic trend emerged when LDL-C fell below the reference point of 2.2 mmol/L (Figure 1B). Consequently, 2.2 mmol/L was selected as it represented the threshold in the RCS curve where the HR crossed 1.0, signifying a transition in mortality risk.
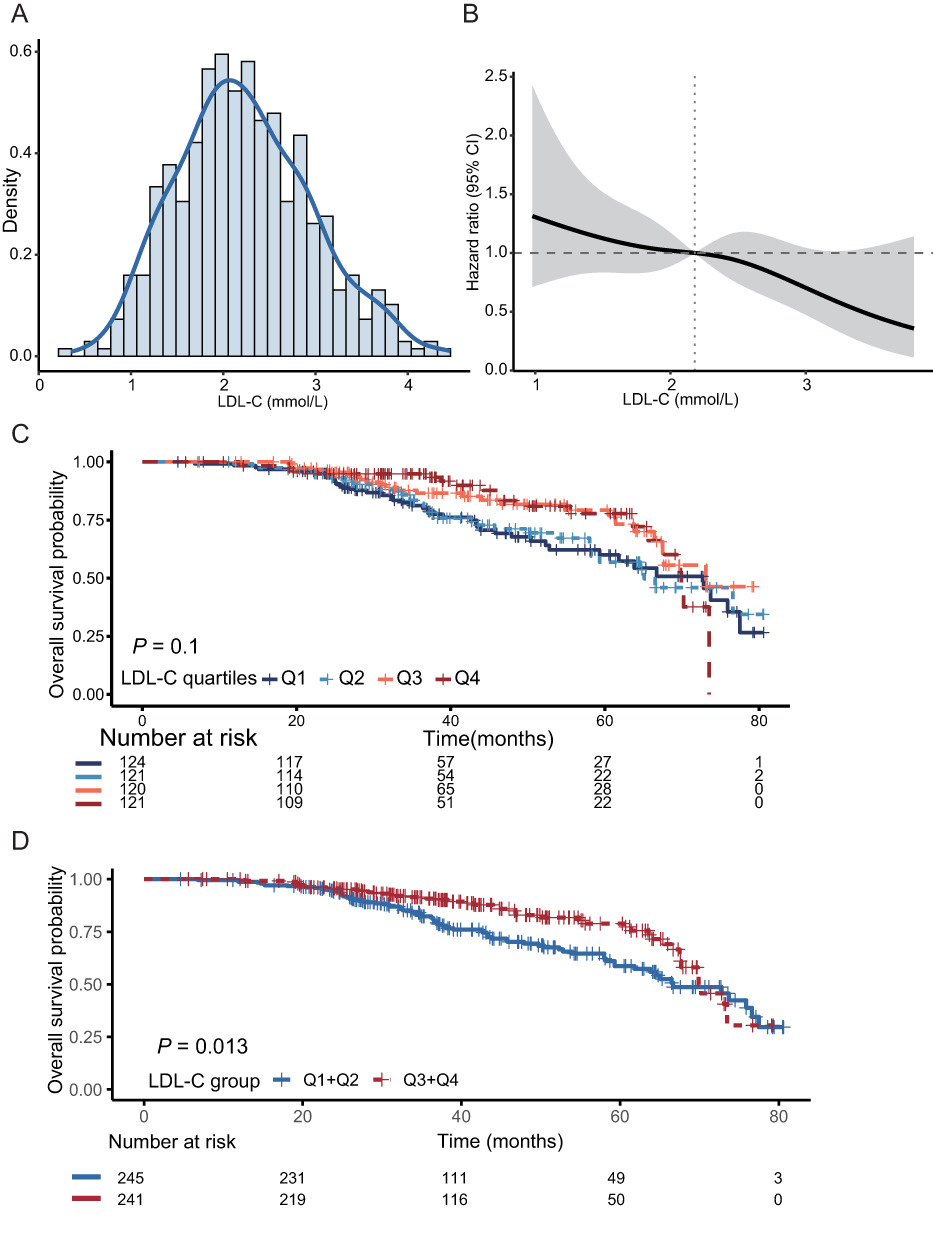 |
Figure 1 Characterization of serum LDL-C distribution and its raw association with overall survival in the entire cohort (n = 486). (A) Kernel density estimation plot depicting the probability distribution of baseline serum LDL-C levels. (B) Restricted cubic spline (RCS) curve illustrating the non-linear relationship between continuous serum LDL-C levels and the hazard ratio (HR) for mortality. (C) Kaplan-Meier survival curves for overall survival stratified by LDL-C quartiles (Q1-Q4). Differences between the four groups were compared using the Log rank test. (D) Kaplan-Meier survival curves for overall survival comparing the dichotomized low LDL-C group (Q1+Q2) and high LDL-C group (Q3+Q4). The P-value was determined by the Log rank test. Abbreviations: LDL-C, low-density lipoprotein cholesterol; Q, quartile. |
Based on these observations, the cohort was divided into four groups according to LDL-C quartiles (Q1–Q4) to compare clinical characteristics. The mean age of the overall population was 57.10 ± 8.45 years, and 81.5% were male (Table 1). A decrease in LDL-C levels was significantly associated with the deterioration of liver functional reserve. Compared to the highest quartile (Q4), the lowest quartile (Q1) had a significantly higher proportion of patients with Child-Pugh class B (54.8% vs. 13.2%, P < 0.001). Consistently, patients in the Q1 group exhibited pronounced impairment in hepatic synthesis and excretion, evidenced by lower Alb levels (P < 0.001) and elevated TBIL levels (P < 0.001). No significant differences were found among the four subgroups regarding tumor-related factors, including tumor size, tumor number, and BCLC stage (all P > 0.05). This indicates that the baseline tumor burden was well-balanced across the groups, suggesting that the survival differences observed among the various LDL-C groups were not primarily driven by discrepancies in initial tumor severity (Table 1).
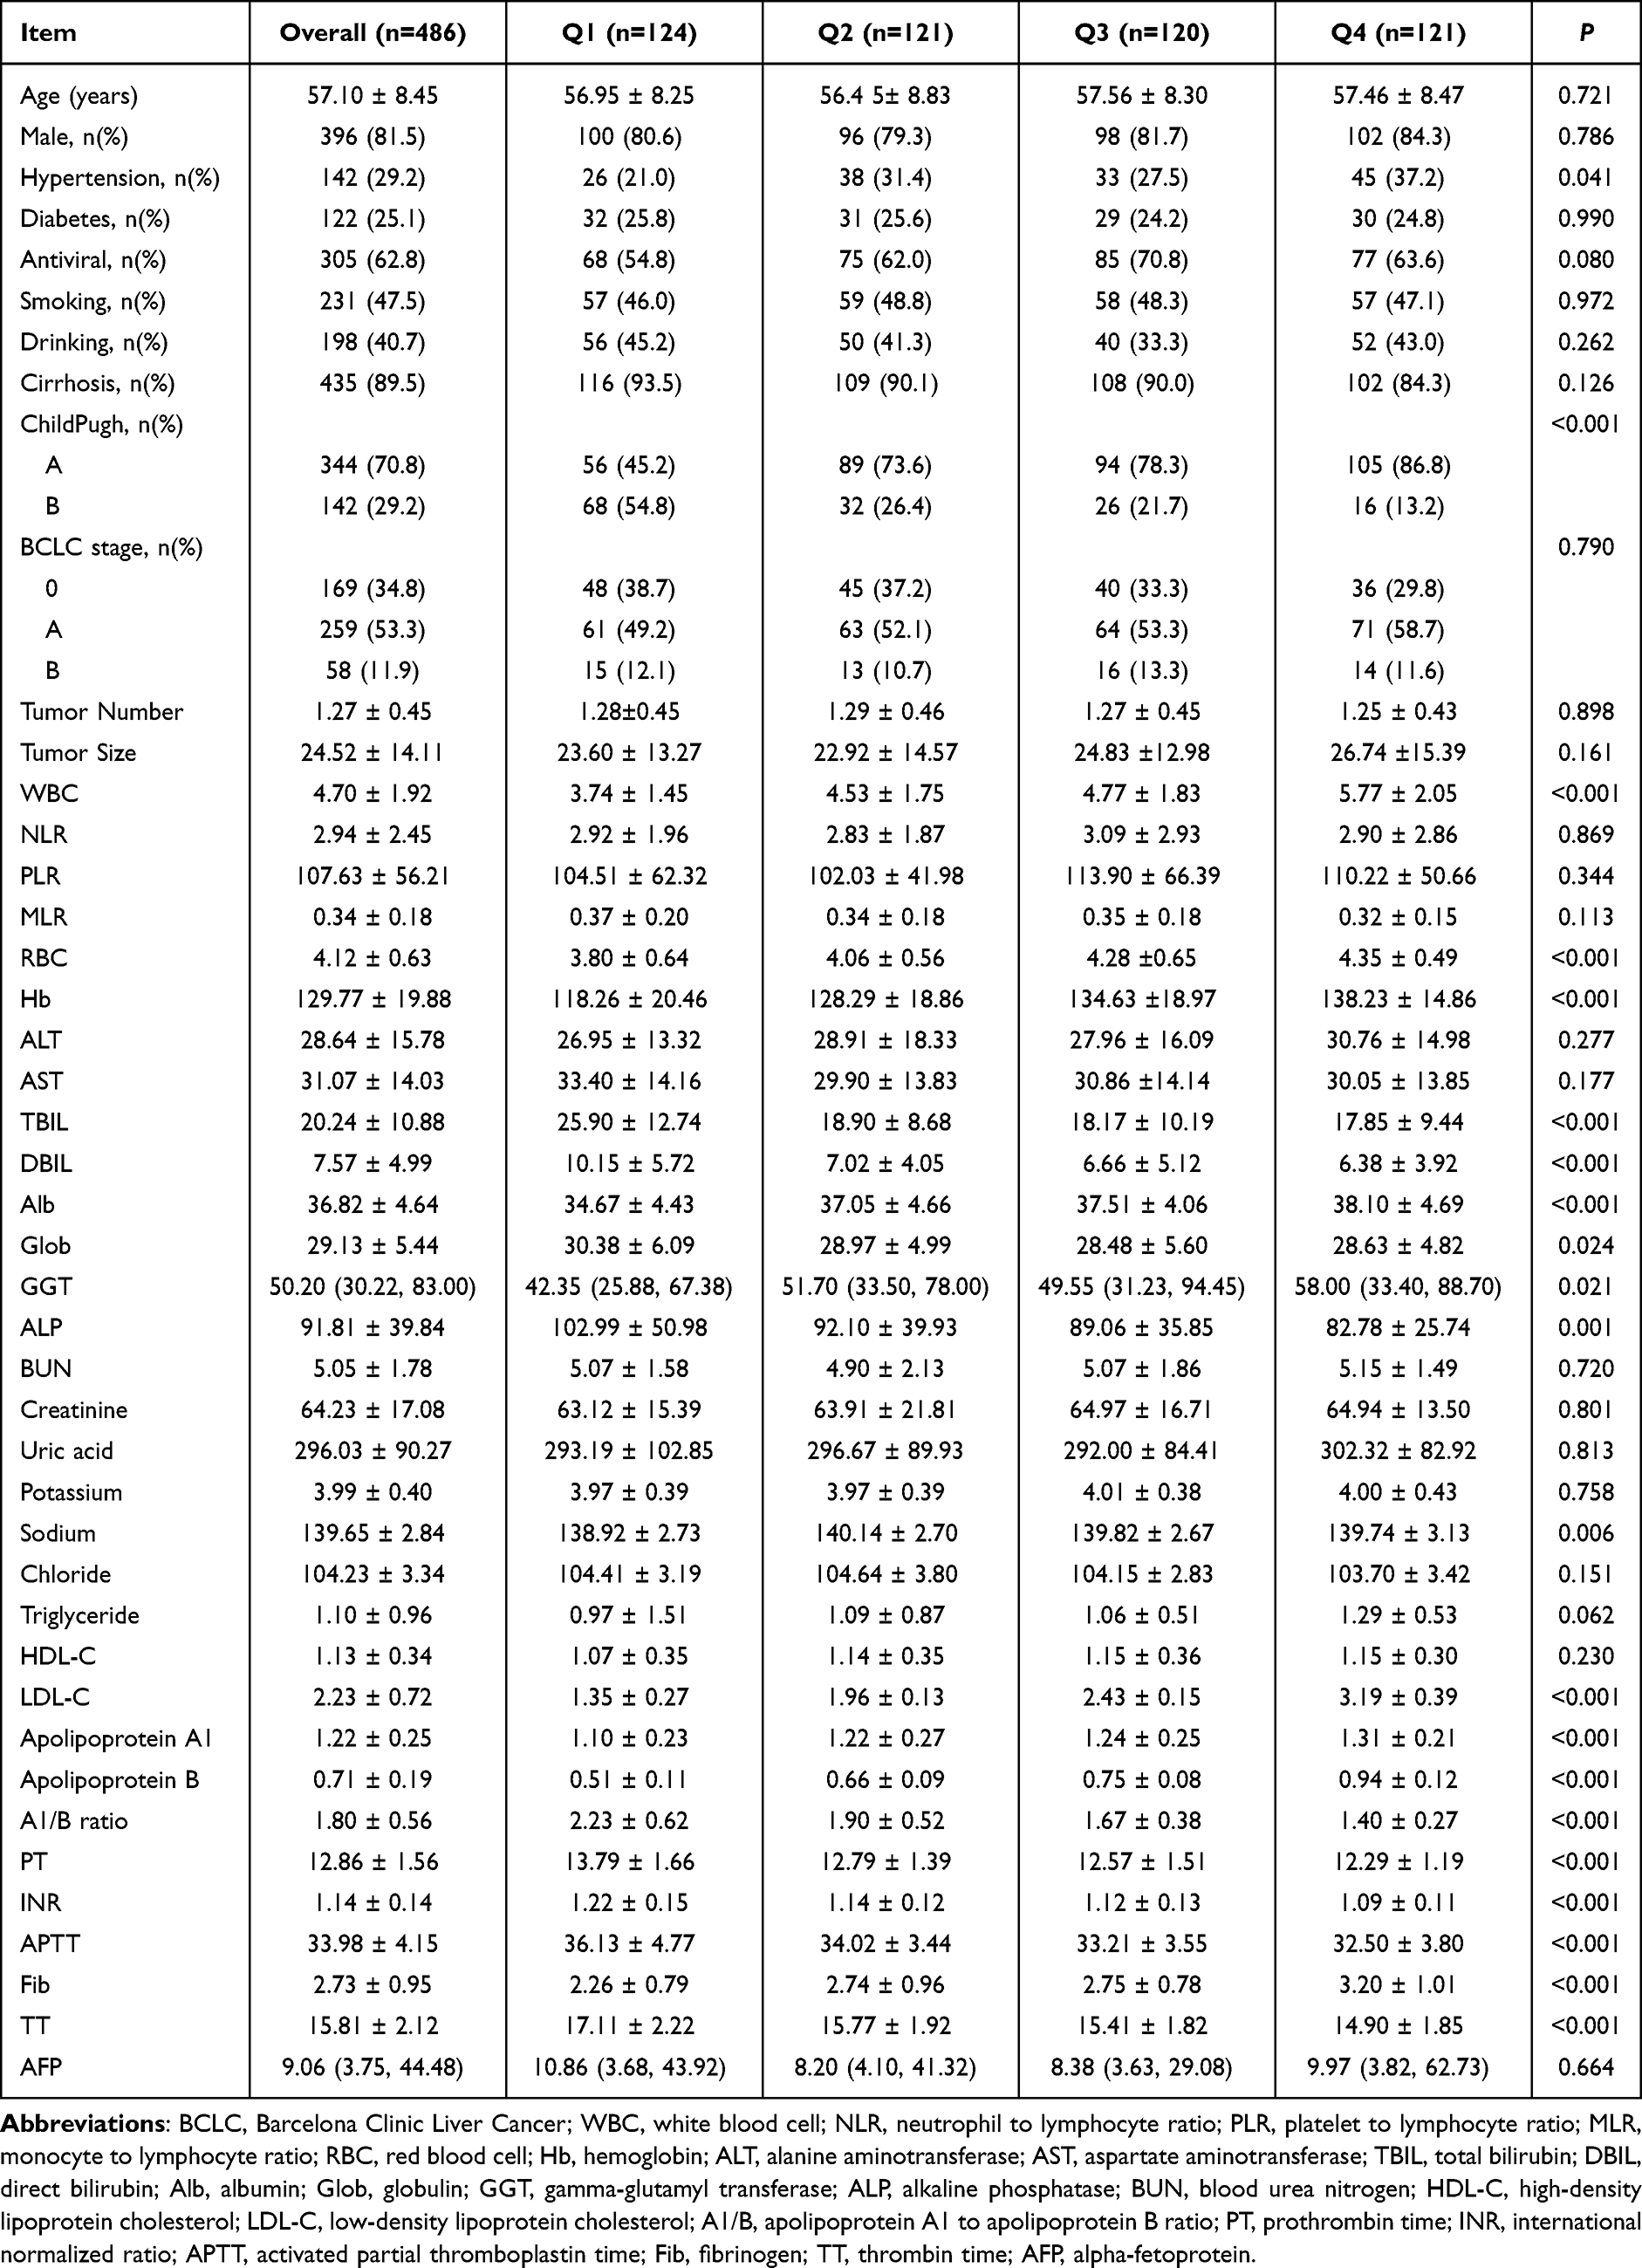 |
Table 1 Baseline Characteristics of HCC Patients Categorized by LDL-C Quartiles |
Independent Prognostic Value of LDL-C and Identification of the High-Risk Subgroup
To evaluate the independent prognostic value of LDL-C for OS in HCC patients over a median follow-up period of 44.1 months, LDL-C was incorporated into a Cox proportional hazards regression model as a continuous variable (Table 2). Univariate Cox regression analysis revealed that the baseline LDL-C level was a significant predictor of OS (HR = 0.696, 95% CI: 0.534–0.907, P = 0.007). After adjusting for age, gender, Alb, TBIL, BCLC stage, and AFP, multivariable Cox regression confirmed that the continuous LDL-C level was an independent protective factor for OS (HR = 0.714, 95% CI: 0.539–0.947, P = 0.019). Furthermore, trend analysis (Table 3) confirmed a significant stepwise increase in mortality risk as LDL-C quartiles decreased (P for trend = 0.024).
 |
Table 2 Univariate and Multivariable Cox Proportional Hazards Analysis of Continuous LDL-C for Overall Survival |
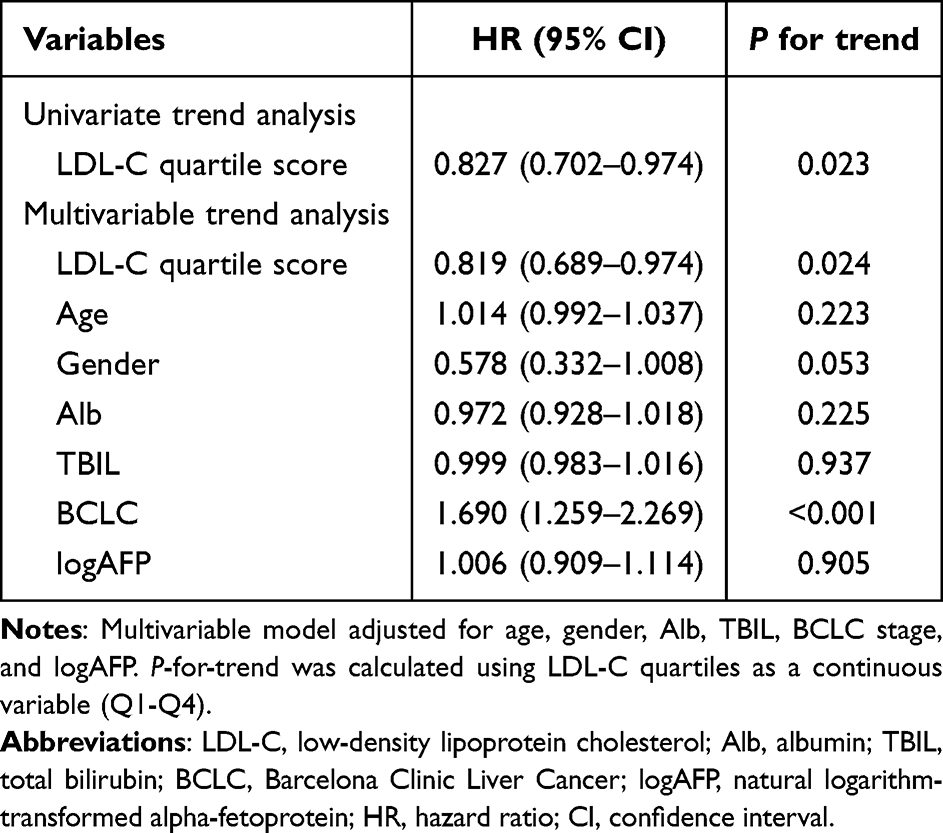 |
Table 3 Trend Analysis of LDL-C Quartiles for Overall Survival |
In the survival analysis, although the KM curves for the four quartile-based groups showed a trend of separation, the difference did not reach statistical significance (Figure 1C, P = 0.100). To enhance clinical utility and incorporate the risk transition reference point identified in the aforementioned RCS curve (2.2 mmol/L, Figure 1B), we dichotomized the cohort at the median level into a low LDL-C group (Q1+Q2, n = 245) and a high LDL-C group (Q3+Q4, n = 241). This binary stratification was considered reasonable based on the integration of three observations. First, as shown in Figure 1A, the baseline LDL-C of the overall cohort showed a mean of 2.23 ± 0.72 mmol/L. Second, the RCS analysis independently indicated a risk tipping point at approximately 2.2 mmol/L. Third, when dichotomizing the cohort at the median, the cutoff value naturally falls between the mean LDL-C of the Q2 group (1.96 mmol/L) and the Q3 group (2.43 mmol/L) (Table 1). This boundary interval (1.96–2.43 mmol/L) reasonably encompasses both the population mean (2.23 mmol/L) and the RCS-derived risk threshold (2.2 mmol/L). Consequently, combining Q1 and Q2 provided a practical, data-driven binary grouping for subsequent clinical evaluation.
To validate the prognostic relevance of this newly established stratification, we subsequently compared the survival outcomes between the two groups. The KM survival curves (Figure 1D) demonstrated that the OS of the low LDL-C group was significantly worse than that of the high LDL-C group (P = 0.013). Consequently, this low LDL-C subgroup of 245 patients with a significantly elevated prognostic risk was identified as the target high-risk population for subsequent predictive model construction.
Screening of Prognostic Features Within the High-Risk Subgroup
To address the clinical heterogeneity within the low LDL-C subgroup (n = 245), the LASSO clinicopathologic feature selection was performed to achieve dimensional reduction and identify the most robust prognostic predictors. Figure 2A illustrates the coefficient trajectories of the 30 candidate clinical variables against the log-transformed penalty parameter (λ) sequence, demonstrating how individual regression coefficients were continuously penalized and shrunk precisely toward zero as the tuning intensity intensified. To determine the optimal regularization workload, a 10-fold cross-validation algorithm was executed based on the partial likelihood deviance profile (Figure 2B). The optimal penalty parameter (λ) was selected at the minimum deviance point, which yielded a log(λ) value of approximately −2.85 (corresponding to a raw λ of 0.058, indicated by the left vertical dashed line). At this exact optimal tuning threshold, a parsimonious set of four variables retained non-zero coefficients, successfully separating themselves from confounding clinical traits. Consequently, these four core features were identified as the independent candidate predictors for OS in the low LDL-C cohort, encompassing drinking history, BCLC stage, tumor number, and TT.
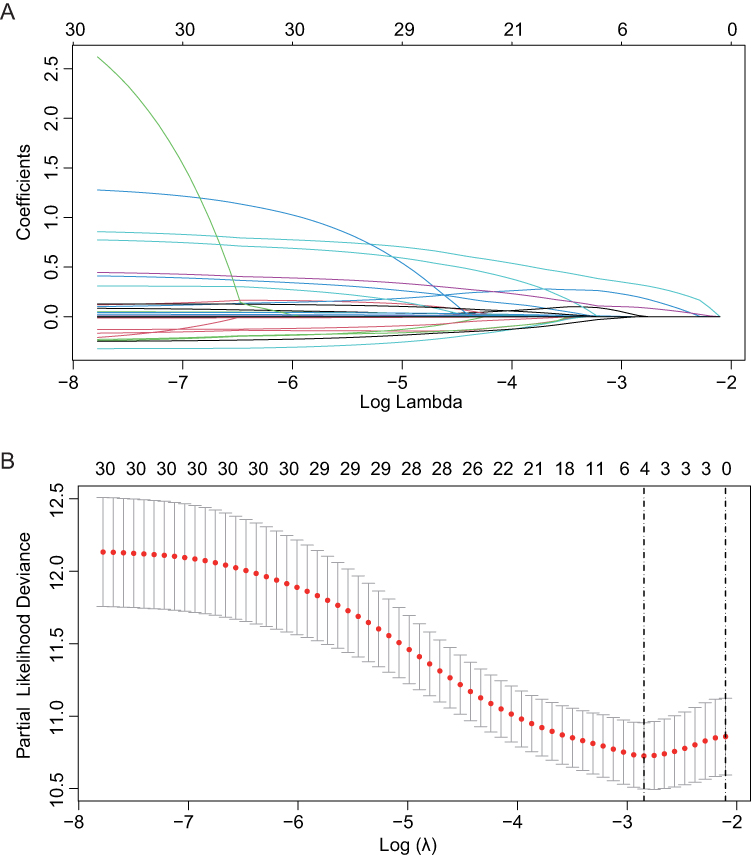 |
Figure 2 Feature selection using the LASSO regression algorithm in the low LDL-C high-risk subgroup (n = 245). (A) LASSO regression coefficient paths. (B) LASSO regression cross-validation curve. Abbreviations: LASSO, least absolute shrinkage and selection operator; LDL-C, low-density lipoprotein cholesterol. |
Construction and Validation of the Subgroup-Specific Nomogram
Based on the core features selected above, we constructed a nomogram specifically tailored for the low LDL-C subgroup (Figure 3A). Every risk factor corresponds to a specific score according to its value on the nomogram. It is necessary to sum the scores of all factors and draw a vertical line from the corresponding total points scale. This vertical line then intersects with the risk axes below to forecast the 3- and 5-year OS probabilities. The model demonstrated overall discrimination, with an optimism-corrected C-index of 0.686. ROC analysis revealed that the AUC values for predicting 3- and 5-year OS were 0.752 and 0.696, respectively (Figure 3B). Calibration curves confirmed that the survival probabilities predicted by the nomogram were highly consistent with the actual observations (Figure 3C and D). Furthermore, DCA indicated that using this model for clinical decision-making across a wide range of threshold probabilities yielded a significant net clinical benefit, outperforming traditional strategies (Figure 3E and F).
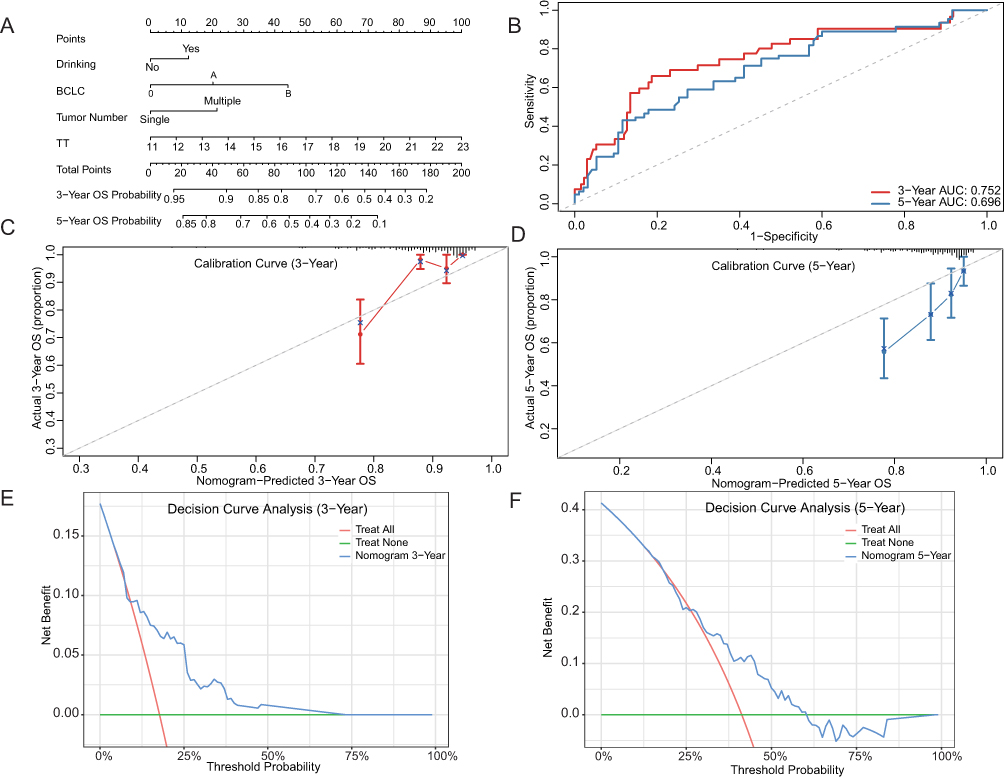 |
Figure 3 Construction and comprehensive validation of the specific prognostic nomogram for the low LDL-C subgroup. (A) The visual nomogram developed for predicting 3- and 5-year OS probabilities in patients within the low LDL-C subgroup. (B) Time-dependent ROC curves of the nomogram for predicting OS at 3 and 5 years. The AUC values are indicated in the legend. (C and D) Calibration curves comparing the nomogram-predicted OS probability (x-axis) with the actual observed OS probability (y-axis) at 3 years (C) and 5 years (D). (E and F) DCA of the nomogram for 3-year OS (E) and 5-year OS (F). The net benefit is plotted against the threshold probability. Abbreviations: LDL-C, low-density lipoprotein cholesterol; OS, overall survival; ROC, receiver operating characteristic; AUC, area under the curve; DCA, decision curve analysis. |
Risk Stratification and Model Utility Assessment
Finally, using the risk scores calculated from the nomogram, we stratified the 245 high-risk patients into a high-risk stratum (n = 122) and a low-risk stratum (n = 123). KM survival analysis (Figure 4) demonstrated a precipitous decline in the survival of patients in the high-risk stratum, indicating a significantly worse prognosis compared to those in the low-risk stratum (P < 0.0001). This result highlights the robust capability of the nomogram to achieve refined risk stratification within the traditionally defined high-risk, low LDL-C population.
 |
Figure 4 Risk stratification capability of the specific nomogram within the low LDL-C subgroup (n = 245). Kaplan-Meier survival curves comparing overall survival between the high-risk stratum and low-risk stratum defined by the median total score calculated from the nomogram. The difference in survival was statistically evaluated using the Log rank test (P < 0.0001). Abbreviation: LDL-C, low-density lipoprotein cholesterol. |
Discussion
This study delineated the stark prognostic implications of LDL-C in HCC. Rather than a simple linear correlation, our RCS analysis unmasked a critical survival tipping point: mortality risk sharply escalated as baseline LDL-C declined. This sharp escalation in mortality risk closely paralleled the deterioration of baseline hepatic reserve. Identifying this high-risk subset provided the clinical rationale for developing a tailored nomogram for refined secondary risk stratification.
Lipids are fundamental to cellular energy and structural integrity, making their clinical evaluation routine in oncology.18,19 While established cardiovascular guidelines designate LDL-C reduction as a cardioprotective target,10 this paradigm undergoes a functional inversion in advanced malignancies. Hypolipidemia is frequently documented across diverse cancers, including HCC, gastrointestinal, and hematological tumors, where epidemiological data correlate this phenotype with increased cancer incidence and inferior survival.20,21 Our multivariable Cox regression confirmed that continuous LDL-C is an independent protective factor for OS in HCC patients (HR = 0.714). This further corroborates that low LDL-C not only potentially promotes hepatocarcinogenesis11 but is also a critical risk factor driving adverse outcomes in HCC.
The inverse correlation between decreased LDL-C and poor HCC prognosis likely reflects a dual mechanism of hepatic synthetic failure and tumor-driven lipid scavenging. The liver strictly regulates systemic lipid homeostasis;22 correspondingly, our Q1 cohort exhibited a significantly higher proportion of Child-Pugh class B phenotypes, alongside decreased albumin and elevated bilirubin. This pattern indicates that a drastic reduction in serum LDL-C serves as a quantifiable clinical marker of metabolic decompensation in cirrhotic patients.23 Crucially, baseline tumor characteristics, including size, multifocality, and BCLC stage, were comparable across all LDL-C quartiles. While the balanced baseline characteristics indicate that low LDL-C is an independent risk factor rather than a mere consequence of advanced tumor stage, the observational nature of our study precludes the establishment of a strict causal relationship. The highly intertwined relationship among LDL-C depletion, nutritional impairment, and hepatic dysfunction necessitates cautious interpretation, as residual confounding from liver functional reserve cannot be entirely excluded. Instead, highly invasive HCC clones frequently upregulate the low-density lipoprotein receptor (LDLR) to secure exogenous cholesterol for rapid proliferation and biomembrane synthesis.24,25 Consequently, severe lipid depletion reflects a high metabolic tumor turnover superimposed on host organ failure.26 Furthermore, this sustained lipid deficit may influence cellular susceptibility to programmed cell death pathways, such as ferroptosis.27–29 However, these mechanistic links remain speculative hypotheses that require rigorous experimental validation in future studies.
Conventional prognostic systems, such as the BCLC staging system or ALBI score, are inherently calibrated for the general HCC population.3,16 These universal models often lack the resolution required to accurately stratify risk within specific metabolic phenotypes, such as the low LDL-C subgroup.3 The present study addresses this limitation by transitioning from a generalized prediction framework to a targeted secondary stratification approach. Despite the uniformly poor expected survival of the low LDL-C cohort, substantial clinical heterogeneity remains. By utilizing LASSO regression to manage high-dimensional data and resolve multicollinearity, we identified core prognostic features unique to this specific population. Notably, with 77 mortality events and exactly 4 predictive features ultimately incorporated into the final nomogram, our cohort provided an Events Per Variable (EPV) of 19.25. This substantially exceeds the widely recommended threshold of 10 to 15, ensuring the statistical stability of the final predictive model and strongly mitigating the risk of overfitting. The resulting nomogram demonstrated robust predictive accuracy (3-year AUC = 0.752, 5-year AUC = 0.696) and substantial net clinical benefit. This secondary risk stratification strategy equips clinicians with an objective, quantitative tool to pinpoint the highest-risk individuals within an already vulnerable baseline population, facilitating the implementation of intensive surveillance and tailored therapeutic interventions.30
An important clinical context of the present study is that all included patients uniformly underwent TACE-based sequential therapy. While this therapeutic homogeneity reduces variability related to treatment allocation, it inherently introduces a selection bias, which limits the generalizability of our findings to the broader HCC population treated with other modalities such as surgical resection, ablation, systemic therapy, or liver transplantation. Moreover, low LDL-C might partly reflect impaired liver synthetic function, poor nutritional status, or more advanced liver disease, factors that could also influence a patient’s tolerance and response to TACE itself.31 Therefore, it remains uncertain whether LDL-C acts exclusively as an independent biological prognostic marker or rather as a surrogate indicator for patients more likely to experience poorer outcomes following TACE-based treatment. In this regard, the potential interaction between LDL-C status and TACE-related variables, including treatment response, TACE refractoriness, and the number of TACE sessions, may partially confound the reported associations and warrants further detailed investigation.
Certain other limitations warrant consideration. First, the retrospective, single-center design necessitates external validation in diverse, multicenter cohorts to confirm the nomogram’s generalizability. Second, despite multivariable adjustments, potential residual confounding from unmeasured factors, such as prior statin or lipid-lowering therapy, cannot be completely ruled out. Additionally, the current analysis relies exclusively on baseline LDL-C measurements. The dynamic alterations of lipid profiles during active antitumor therapy may provide further prognostic insights and require prospective longitudinal investigation in future multi-omics studies.
Conclusion
In summary, lower baseline LDL-C is independently associated with worse OS in patients with HCC. To address the clinical heterogeneity within this vulnerable cohort, we developed a tailored nomogram integrating drinking history, BCLC stage, tumor number, and TT. By facilitating refined secondary risk stratification, this specialized model has the potential to complement universal prognostic systems, providing clinicians with an objective tool to assist in identifying high-risk individuals and potentially guiding personalized therapeutic strategies. However, considering the retrospective single-center design of our study, further external validation in prospective, multicenter cohorts is warranted before its definitive implementation in clinical practice.
Declaration Of Generative Ai In Scientific Writing
The authors acknowledge the use of Gemini (version 3.1 Pro) for language editing and translation to improve the readability and academic English phrasing of this manuscript. The authors reviewed and take full responsibility for the final content.
Data Sharing Statement
The original contributions proposed in this study can be obtained by contacting the corresponding author (Ronghua Jin, Email: [email protected]).
Ethics Statement
The study was approved by Ethics committee of Beijing You’an Hospital, Capital Medical University (LL-2023-131-K). All patient data were kept strictly confidential, and personal identifiers were removed prior to analysis.
Author Contributions
All authors made a significant contribution to the work reported, whether that is in the conception, study design, execution, acquisition of data, analysis and interpretation, or in all these areas; took part in drafting, revising or critically reviewing the article; gave final approval of the version to be published; have agreed on the journal to which the article has been submitted; and agree to be accountable for all aspects of the work.
Funding
No funding, grants, or other support was received for the preparation of this manuscript.
Disclosure
The authors declare that the research was conducted in the absence of any commercial or financial relationships that could be construed as a potential conflict of interest.
References
1. Singal AG, Llovet JM, Yarchoan M, et al. AASLD practice guidance on prevention, diagnosis, and treatment of hepatocellular carcinoma. Hepatology. 2023;78(6):1922–13. doi:10.1097/HEP.0000000000000466
2. Bray F, Laversanne M, Sung H, et al. Global cancer statistics 2022: GLOBOCAN estimates of incidence and mortality worldwide for 36 cancers in 185 countries. CA Cancer J Clin. 2024;74(3):229–263. doi:10.3322/caac.21834
3. Llovet JM, Kelley RK, Villanueva A, et al. Hepatocellular carcinoma. Nat Rev Dis Primers. 2021;7(1):6. doi:10.1038/s41572-020-00240-3
4. Luo WL, Wang QB, Li YK, et al. Impact of middle hepatic vein resection during hemihepatectomy on surgical outcomes and long-term prognosis in hepatocellular carcinoma: a retrospective study. J Hepatocell Carcinoma. 2025;12:2681–2692. doi:10.2147/JHC.S556306
5. Cui D, Yu X, Guan Q, et al. Cholesterol metabolism: molecular mechanisms, biological functions, diseases, and therapeutic targets. Mol Biomed. 2025;6(1):72. doi:10.1186/s43556-025-00321-3
6. Broadfield LA, Pane AA, Talebi A, Swinnen JV, Fendt SM. Lipid metabolism in cancer: new perspectives and emerging mechanisms. Dev Cell. 2021;56(10):1363–1393. doi:10.1016/j.devcel.2021.04.013
7. Sangineto M, Villani R, Cavallone F, Romano A, Loizzi D, Serviddio G. Lipid metabolism in development and progression of hepatocellular carcinoma. Cancers. 2020;12(6). 1419 doi:10.3390/cancers12061419
8. Peng L, Yan Q, Chen Z, et al. Research progress on the role of cholesterol in hepatocellular carcinoma. Eur J Pharmacol. 2023;938:175410. doi:10.1016/j.ejphar.2022.175410
9. Li Z, Wang Y, Xing R, et al. Cholesterol efflux drives the generation of immunosuppressive macrophages to promote the progression of human hepatocellular carcinoma. Cancer Immunol Res. 2023;11(10):1400–1413. doi:10.1158/2326-6066.CIR-22-0907
10. Mach F, Baigent C, Catapano AL, et al. 2019 ESC/EAS guidelines for the management of dyslipidaemias: lipid modification to reduce cardiovascular risk. Eur Heart J. 2020;41(1):111–188. doi:10.1093/eurheartj/ehz455
11. Zeng C, Liu S, Li H, Han X. Inverse association between serum lipid profiles and hepatocellular carcinoma risk: a meta-analysis of epidemiological studies. Front Oncol. 2025;15:1644677. doi:10.3389/fonc.2025.1644677
12. Cao J, Wang Z, Zhu M, Huang Y, Jin Z, Xiong Z. Low-density lipoprotein cholesterol and risk of hepatocellular carcinoma: a Mendelian randomization and mediation analysis. Lipids Health Dis. 2023;22(1):110. doi:10.1186/s12944-023-01877-1
13. Liang Z, Zhang Z, Tan X, Zeng P. Lipids, cholesterols, statins and liver cancer: a mendelian randomization study. Front Oncol. 2023;13:1251873. doi:10.3389/fonc.2023.1251873
14. Jiang J, Nilsson-Ehle P, Xu N. Influence of liver cancer on lipid and lipoprotein metabolism. Lipids Health Dis. 2006;5:4. doi:10.1186/1476-511X-5-4
15. Craig AJ, von Felden J, Garcia-Lezana T, Sarcognato S, Villanueva A. Tumour evolution in hepatocellular carcinoma. Nat Rev Gastroenterol Hepatol. 2020;17(3):139–152. doi:10.1038/s41575-019-0229-4
16. Johnson PJ, Berhane S, Kagebayashi C, et al. Assessment of liver function in patients with hepatocellular carcinoma: a new evidence-based approach-the ALBI grade. J Clin Oncol. 2015;33(6):550–558. doi:10.1200/JCO.2014.57.9151
17. Reig M, Forner A, Rimola J, et al. BCLC strategy for prognosis prediction and treatment recommendation: the 2022 update. J Hepatol. 2022;76(3):681–693. doi:10.1016/j.jhep.2021.11.018
18. Munir R, Usman H, Hasnain S, Smans K, Kalbacher H, Zaidi N. Atypical plasma lipid profile in cancer patients: cause or consequence? Biochimie. 2014;102:9–18. doi:10.1016/j.biochi.2014.03.010
19. Bian X, Liu R, Meng Y, Xing D, Xu D, Lu Z. Lipid metabolism and cancer. J Exp Med. 2021;218(1). doi:10.1084/jem.20201606
20. Muntoni S, Atzori L, Mereu R, et al. Serum lipoproteins and cancer. Nutr Metab Cardiovasc Dis. 2009;19(3):218–225. doi:10.1016/j.numecd.2008.06.002
21. Benn M, Tybjærg-Hansen A, Stender S, Frikke-Schmidt R, Nordestgaard BG. Low-density lipoprotein cholesterol and the risk of cancer: a mendelian randomization study. J Natl Cancer Inst. 2011;103(6):508–519. doi:10.1093/jnci/djr008
22. Rui L. Energy metabolism in the liver. Compr Physiol. 2014;4(1):177–197. doi:10.1002/j.2040-4603.2014.tb00548.x
23. Acuña M, Cohen DE. Lipid and lipoprotein metabolism in liver disease. In: Feingold KR, Adler RA, Ahmed SF, et al, eds. Endotext. South Dartmouth (MA): MDText.com, Inc. Copyright © 2000-2026, MDText.com, Inc; 2000.
24. Saito N, Sairenchi T, Irie F, et al. Low serum LDL cholesterol levels are associated with elevated mortality from liver cancer in Japan: the Ibaraki Prefectural health study. Tohoku J Exp Med. 2013;229(3):203–211. doi:10.1620/tjem.229.203
25. Deng CF, Zhu N, Zhao TJ, et al. Involvement of LDL and ox-LDL in cancer development and its therapeutical potential. Front Oncol. 2022;12:803473. doi:10.3389/fonc.2022.803473
26. Kuzu OF, Noory MA, Robertson GP. The role of cholesterol in cancer. Cancer Res. 2016;76(8):2063–2070. doi:10.1158/0008-5472.CAN-15-2613
27. Huang C, Freter C. Lipid metabolism, apoptosis and cancer therapy. Int J Mol Sci. 2015;16(1):924–949. doi:10.3390/ijms16010924
28. Magtanong L, Ko PJ, Dixon SJ. Emerging roles for lipids in non-apoptotic cell death. Cell Death Differ. 2016;23(7):1099–1109. doi:10.1038/cdd.2016.25
29. Dixon SJ, Lemberg KM, Lamprecht MR, et al. Ferroptosis: an iron-dependent form of nonapoptotic cell death. Cell. 2012;149(5):1060–1072. doi:10.1016/j.cell.2012.03.042
30. Balachandran VP, Gonen M, Smith JJ, DeMatteo RP. Nomograms in oncology: more than meets the eye. Lancet Oncol. 2015;16(4):e173–180. doi:10.1016/S1470-2045(14)71116-7
31. Liu MM, Chen ZH, Zhao LY, et al. Prognostic value of serum apolipoprotein B to apolipoprotein A-I ratio in hepatocellular carcinoma patients treated with transcatheter arterial chemoembolization: a propensity score-matched analysis. Oncol Res Treat. 2021;44(9):450–468. doi:10.1159/000517735
 © 2026 The Author(s). This work is published and licensed by Dove Medical Press Limited. The
full terms of this license are available at https://www.dovepress.com/terms
and incorporate the Creative Commons Attribution
- Non Commercial (unported, 4.0) License.
By accessing the work you hereby accept the Terms. Non-commercial uses of the work are permitted
without any further permission from Dove Medical Press Limited, provided the work is properly
attributed. For permission for commercial use of this work, please see paragraphs 4.2 and 5 of our Terms.
© 2026 The Author(s). This work is published and licensed by Dove Medical Press Limited. The
full terms of this license are available at https://www.dovepress.com/terms
and incorporate the Creative Commons Attribution
- Non Commercial (unported, 4.0) License.
By accessing the work you hereby accept the Terms. Non-commercial uses of the work are permitted
without any further permission from Dove Medical Press Limited, provided the work is properly
attributed. For permission for commercial use of this work, please see paragraphs 4.2 and 5 of our Terms.
Recommended articles
A Systemic Inflammation Response Score for Prognostic Prediction in Hepatocellular Carcinoma Patients After Hepatectomy
Zhang D, Huo L, Pan Y, Yang Z, Zeng H, Wang X, Chen J, Wang J, Zhang Y, Zhou Z, Chen M, Hu D
Journal of Inflammation Research 2022, 15:6869-6881
Published Date: 29 December 2022
Clinical Analysis and Prognostic Prediction Model for Patients with Uterine Leiomyosarcoma at FIGO Stage I
Chen S, Deng Y, Zhai Y, Zhan Y, Li X, Wang J, Bai H
International Journal of Women's Health 2023, 15:545-557
Published Date: 11 April 2023
Development and Validation of a Novel Prognosis Model Based on a Panel of Three Immunogenic Cell Death-Related Genes for Non-Cirrhotic Hepatocellular Carcinoma
Gong J, Yu R, Hu X, Luo H, Gao Q, Li Y, Tan G, Luo H, Qin B
Journal of Hepatocellular Carcinoma 2023, 10:1609-1628
Published Date: 25 September 2023
Recurrence of Hepatocellular Carcinoma in Patients with Low Albumin-Bilirubin Grade in TACE Combined with Ablation: A Random Forest Cox Predictive Model
Xiong Y, Qiao W, Mei T, Li K, Jin R, Zhang Y
Journal of Hepatocellular Carcinoma 2024, 11:1375-1388
Published Date: 8 July 2024
Development of a Prognostic Nomogram Incorporating the Naples Prognostic Score for Postoperative Oral Squamous Cell Carcinoma Patients
Xu XL, Cheng H
Journal of Inflammation Research 2025, 18:325-345
Published Date: 7 January 2025