Back to Journals » Journal of Hepatocellular Carcinoma » Volume 10
Development and Validation of a Novel Prognosis Model Based on a Panel of Three Immunogenic Cell Death-Related Genes for Non-Cirrhotic Hepatocellular Carcinoma
Authors Gong J, Yu R, Hu X, Luo H, Gao Q, Li Y, Tan G, Luo H, Qin B
Received 6 June 2023
Accepted for publication 20 September 2023
Published 25 September 2023 Volume 2023:10 Pages 1609—1628
DOI https://doi.org/10.2147/JHC.S424545
Checked for plagiarism Yes
Review by Single anonymous peer review
Peer reviewer comments 2
Editor who approved publication: Professor Manal Hassan
Jiaojiao Gong,1,2 Renjie Yu,1 Xiaoxia Hu,1 Huating Luo,1 Qingzhu Gao,3 Yadi Li,1 Guili Tan,1 Haiying Luo,1 Bo Qin1
1Department of Infectious Diseases, Chongqing Key Laboratory of Infectious Diseases and Parasitic Diseases, The First Affiliated Hospital of Chongqing Medical University, Chongqing, People’s Republic of China; 2Department of Nephrology, Bishan Hospital of Chongqing Medical University, Chongqing, People’s Republic of China; 3Department of Infectious Diseases, The Second Affiliated Hospital of Chongqing Medical University, Chongqing, People’s Republic of China
Correspondence: Bo Qin, Department of Infectious Diseases, Chongqing Key Laboratory of Infectious Diseases and Parasitic Diseases, The First Affiliated Hospital of Chongqing Medical University, No. 1 Youyi Road, Yuzhong District, Chongqing, 400016, People’s Republic of China, Email [email protected]
Purpose: The accurate prediction of non-cirrhotic hepatocellular carcinoma (NCHCC) risk facilitates improved surveillance strategy and decreases cancer-related mortality. This study aimed to explore the correlation between immunogenic cell death (ICD) and NCHCC prognosis using The Cancer Genome Atlas (TCGA) datasets, and the potential prognostic value of ICD-related genes in NCHCC.
Methods: Clinical and transcriptomic data of patients with NCHCC patients were retrieved from TCGA database. Weighted gene co-expression network analysis was performed to obtain the NCHCC phenotype-related module genes. Consensus clustering analysis was performed to classify the patients into two clusters based on intersection genes among differentially expressed genes (DEGs) between cancer and adjacent tissues, NCHCC phenotype-related genes, and ICD-related genes. NCHCC-derived tissue microarray was used to evaluate the correlation of the expression levels of key genes with NCHCC prognosis using immunohistochemical staining.
Results: Cox regression analyses were performed to construct a prognostic risk score model comprising three genes (TMC7, GRAMD1C, and GNPDA1) based on DEGs between two clusters. The model stratified patients with NCHCC into two risk groups. The overall survival (OS) of the high-risk group was significantly lower than that of the low-risk group. Univariable and multivariable Cox regression analyses revealed that these signature genes are independent predictors of OS. Functional analysis revealed differential immune status between the two risk groups. Next, a nomogram was constructed, which demonstrated the potent distinguishing ability of the developed model based on receiver operating characteristic curves. In vitro functional validation revealed that the migration and invasion abilities of HepG2 and Huh7 cells were upregulated upon GRAMD1C knockdown but downregulated upon TMC7 knockdown.
Conclusion: This study developed a prognostic model comprising three genes, which can aid in predicting the survival of patients with NCHCC and guide the selection of drugs and molecular markers for NCHCC.
Keywords: immunogenic cell death-related genes, non-cirrhotic hepatocellular carcinoma, risk stratification, nomogram
Introduction
Globally, hepatocellular carcinoma (HCC) is the fifth most common cancer and the second leading cause of cancer-related deaths in men after lung cancer.1 Most HCCs develop in patients with a history of cirrhosis. However, non-cirrhotic HCC (NCHCC) accounts for approximately 20% of all HCC cases.2 Several studies have examined the diagnostic, therapeutic, and prognostic strategies for HCC.3–6 Previous studies have demonstrated that the risk factors, pathogenetic backgrounds, clinical characteristics, tumor development, prognosis, and surveillance indicators vary between patients with cirrhotic HCC and those with NCHCC.7–10 However, limited studies have examined the etiology, treatment, progression, and prognosis of NCHCC.11,12 The diagnosis of NCHCC at an early stage is challenging owing to the lack of surveillance in non-cirrhotic patients, which may lead to delayed treatment.13 Currently, TNM staging is commonly regarded as a basis for formulating treatment strategies and predicting prognosis in NCHCC based on the macroscopic anatomical information of tumor tissues.14 However, TNM staging is inefficient with limited guiding significance as it does not account for molecular heterogeneity in tumors.15 Patients with the same TNM stage were reported to exhibit differential clinical outcomes.16 The landscape changes at the genomic level in tumor tissues can significantly affect the prognosis and therapy response of patients with cancer.17–19 Therefore, there is a need to develop an early warning and prediction tool with molecular signatures to predict the prognosis of patients with cancer and supplement the TNM staging system. In the era of precision treatment, the prognostic factors of patients with NCHCC must be identified to facilitate clinical counseling and individualized prognosis prediction for NCHCC.
Immunogenic cell death (ICD) is a new type of cell death induced by various anticancer treatments, such as radiotherapy and chemotherapy. Additionally, ICD is a type of regulated cell death that occurs in infected and malignant cells and can activate both innate and adaptive immune responses by promoting the release of damage-associated molecular patterns (DAMPs).20 The release of DAMPs can initiate a molecular cascade that induces the maturation of dendritic cells (DCs), which present antigens to cytotoxic T cells, activating tumor-specific CD8+ T lymphocytes to remove adjacent cells and promote immunological memory.21,22 Additionally, DAMPs, such as CALR, TLR4, and HMGB1, which are immunogenic characteristics and biomarkers of ICD, are reported to be correlated with cancer prognosis.23–26 ICD can improve the immunogenicity of tumors, promoting the transformation of cold tumors into hot tumors and potentiating the immunotherapeutic sensitivity of tumors.27–29 Various cancer studies have used ICD-related markers to construct prognostic models for tumors, such as breast cancer and melanoma.30,31 However, the functional role of ICD-related genes in NCHCC and their correlation with prognosis have not been elucidated. This study aimed to examine the functional role of ICDs in NCHCC and their ability to guide the therapeutic response of tumors and predict the prognosis.
This study screened NCHCC disease-related signature gene sets using weighted gene co-expression network analysis (WGCNA) with The Cancer Genome Atlas (TCGA) datasets, identified ICD-related molecular subtypes using the unsupervised clustering algorithm, and established a scoring model to predict the response to chemotherapy and immunotherapy. The ability of the model to predict the prognosis of patients with NCHCC was evaluated. A nomogram was constructed to rapidly evaluate the survival time. Additionally, the effects of GRAMD1C or TMC7 knockdown on the migration, invasion, and proliferation of HepG2 and Huh7 cell lines were examined using the wound healing, transwell, and Cell Counting Kit-8 (CCK8) assays, respectively. Furthermore, the correlation of the expression levels of GRAMD1C and TMC7 with survival in clinical patients was examined.
This study identified ICD-related genes associated with the prognosis of patients with NCHCC and constructed a nomogram to assess prognosis of NCHCC. This will aid clinicians to develop individualized counseling programs and treatments based on risk stratification and enhance the effectiveness of individualized treatment for patients with NCHCC.
Materials and Methods
NCHCC and Corresponding Adjacent Tissue Gene Expression Data Retrieval and ICD-Related Gene Identification
The clinicopathological information and raw RNA sequencing data were downloaded from TCGA database (https://portal.gdc.com (accessed on 10 June 2022)). Only the non-cirrhotic HCC group was selected based on the Ishak score (≤ 5).32 From previous studies, 57 ICD-related genes were rooted.24,33
Identification of Differentially Expressed Genes (DEGs) and Enrichment Analysis
Data were normalized, and the DEGs between cancer and adjacent non-cancerous tissues were analyzed using the limma package in R software. DEGs were identified based on the following criteria: log2 |fold change| > 0.15; adjusted p-value < 0.05. The Volcano plots were constructed to visualize the expression profiles of all DEGs. The top 50 DEGs were visualized using a heatmap. To analyze the underlying functions of potential targets, DEGs were subjected to Gene Ontology (GO) and Kyoto Encyclopedia of Genes and Genomes (KEGG) enrichment analyses using the “ClusterProfiler” and “org.Hs.eg.db” R packages.
Identification of NCHCC Phenotype-Related Module Genes Using WGCNA
WGCNA is a data reduction and unsupervised classification method.34 Based on the expression profile of NCHCC, the co-expression network was constructed using the “WGCNA” R package with the following parameters: corType = “Pearson”, mergeCutHeight = 0.25, minModuleSize = 60. Next, the correlation between the modules and phenotypes was illustrated using a heatmap. Modules with p < 0.05 were considered to be significantly correlated with NCHCC phenotype and included in subsequent analysis. The Venn diagram was used to show the intersecting genes among DEGs, NCHCC phenotype-related genes, and ICD-related genes.
Clustering Analysis of Samples
Based on the expression of these 5 ICD-related biomarkers, 135 NCHCC samples were typed using the ConsensusClusterPlus package. The effect of typing was assessed using principal component analysis. The optimal number of categories was determined according to the change in the area under the cumulative distribution function curve. The k value of the cluster category ranged from 2 to 9. DEGs between clusters were analyzed using the limma package.
Development of a Prognostic Model
All patients with NCHCC were equally randomized into a training set and a validation set. The training set data were subjected to univariable Cox regression analysis to identify the factors affecting the prognosis of patients. The significant factors identified in univariable Cox regression analysis were included in the stepwise variable multivariable Cox regression analysis to construct a risk score model for predicting disease prognosis. The prognostic risk score was calculated based on the regression coefficients (β) in the multivariable Cox regression model and the gene expression levels. A risk score was computed as follows: risk score = ΣiCoefficient genei × expression of genei. The optimal cut-off points of risk score were obtained using X-tile software. Kaplan-Meier survival analysis revealed significant differences in the survival of different subgroups. To validate the accuracy of the model, the “time receiving operating characteristic (ROC)” package was used to calculate the area under the ROC curve (AUC) of patients with 1-year, 2-year, and 3-year overall survival (OS). The AUC values were directly proportional to the predictive performance.
Analysis of Intertumoral Immune Microenvironment
Single-sample gene set enrichment analysis (ssGSEA) algorithm was used to assess the immune function score of each patient using the “GSVA” R package. The ssGSEA enrichment score represents the relative abundance of each immune cell type or function. The unit distribution is normalized from 0 to 1. The expression of immune checkpoints in the two groups was examined. The correlation between risk score and immune checkpoints was evaluated using the “reshape2” R package. The CIBERSORT algorithm, which uses gene expression data to predict the proportions of 22 types of tumor-infiltrating immune cells (TIICs), such as T cells, B cells, macrophages, and natural killer (NK) cells, was used to estimate the differential immune cell infiltration status between the high-risk and low-risk NCHCC-TCGA groups using gene expression data. The RNAseq and maf files for all patients with NCHCC in TCGA cohort were obtained from cBioPortal. The “maftools” package was used to analyze and visualize genomic data. Additionally, the expression levels of HLA-related genes in different risk groups were analyzed.
Prediction of Response to Immunotherapy, Chemotherapy, and Targeted Therapy
The Genomics of Drug Sensitivity in Cancer database, which contains data on the sensitivity of 809 cell lines to 198 chemical compounds, was used to estimate the sensitivity of each patient to chemotherapy drugs. The half-maximal inhibitory concentration (IC50) is inversely proportional to the susceptibility to compounds. The Tumor Immune Dysfunction and Exclusion algorithm was used to evaluate the responses of patients in the two groups to immune checkpoint blockade therapies.
Clinical Value of the Prognostic Signature
To examine the clinical value of the risk score, univariable and multivariable Cox regression analyses were performed to estimate the independent effect of prognostic signatures (risk score, gender, grade, and stage) on the prognosis of TCGA-NCHCC cohort.
Construction of Nomograms
Nomograms were constructed to predict the prognosis of patients with NCHCC based on age, stage, and risk score. The ROC and calibration curves were plotted using the “timeROC” and “rmda” R package, respectively, to assess the diagnostic value of the nomogram.
Immunohistochemical (IHC) and Tissue Microarray (TMA) Analyses
The absence of liver cirrhosis was confirmed after a complete pathological examination of the resected specimen. TMAs comprised 53 NCHCC samples from different cases. Sample collection was approved by the Research Ethics Committee of The First Affiliated Hospital of Chongqing Medical University (Reference number: 2022–K518). The sections were warmed, deparaffinized, rehydrated, subjected to heat-induced antigen retrieval, blocked, and washed. Immunoreactive signals were detected using an Envision/horseradish peroxidase system (Dako-Cytomation, Glostrup, Denmark). All sections were counterstained with hematoxylin and evaluated under a light microscope.
Cell Culture and Transfection
HepG2 and Huh7 cells were purchased from MeisenCTCC (Meisen Chinese Tissue Culture Collections) and cultured in high-glucose Dulbecco’s modified Eagle’s medium (DMEM) (Meilunbio, Dalian, China) supplemented with 10% fetal bovine serum (FBS) (Meiluncell, Dalian, China) and 1% penicillin-streptomycin mixture at 37°C and 5% CO2. Cells were transfected with 50 nM of specific short-interfering RNA (siRNA) or a negative control siRNA using Lipofectamine 2000 (Invitrogen, Carlsbad, CA, USA) in opti-MEM (Meiluncell, Dalian, China). The cells were cultured in high-glucose DMEM supplemented with 10% FBS after transfection.
RNA Extraction and Quantitative Real-Time Polymerase Chain Reaction (qRT-PCR)
Total RNA was extracted from cells using Trizol reagent (Takara, Beijing, China) and reverse-transcribed into complementary DNA using the PrimeScriptTM RT reagent kit with genomic DNA eraser (Takara, Beijing, China), following the manufacturer’s instructions. qRT-PCR analysis was performed with SYBR Green qPCR Master Mix (MedChemExpress, Monmouth Junction, NJ, USA). GAPDH served as the internal reference gene. Various primers were used to perform qRT-PCR analysis. The mRNA levels were determined using the 2−∆∆CT method. Samples were analyzed in triplicates.
Western Blot Analysis
Total proteins were extracted from cells using the radioimmunoprecipitation assay protein extraction reagent (Meilunbio, Dalian, China) at 48 h post-transfection. The proteins were quantified using the bicinchoninic acid protein assay kit (Beyotime, Jiangsu, China). Proteins were subjected to sodium dodecyl sulfate-polyacrylamide gel electrophoresis using a 7.5% gel. The resolved proteins were transferred to a polyvinylidene difluoride membrane (0.22µm, Merck Millipore, Germany). The membrane was blocked, incubated with primary antibodies, washed, and visualized using an enhanced chemiluminescence detection system (Bio-Rad Laboratories). ACTB was used as an internal control. Western blot analyses were performed in triplicate.
Transwell and Wound Healing Assays
Wound healing and transwell assays were performed on day 2 post-transfection. Cells were seeded in a 6-well plate and cultured until they reached 100% confluency and formed a confluent monolayer. A sterile p200 pipette tip was used to scratch the monolayer. Cellular debris was removed by gently washing the monolayer with phosphate-buffered saline. Points near the scratch were marked to serve as reference points. Wound closure was examined under a microscope at 0 and 24 h. The free wound area was measured using the ImageJ software. The migration ability of cells was determined based on the closure of the wound gap.
The polycarbonate filter membrane at the bottom of the transwell chamber was covered with 70 µL Matrigel (Solarbio, Beijing, China), air-dried, and maintained overnight in a laminar flow cabinet. At 24–48 h post-transfection, HepG2 and Huh7 cells were seeded in the upper transwell chamber (pore size, 12 μM; diameter, 8 mm; BIOFIL, Guangzhou, China) at a density of 4×10⁴ cells per chamber. DMEM supplemented with 30% FBS was added to the lower compartment (600 µL per well). After incubation at 37°C and 5% CO2 for 48 h, cells that failed to migrate were gently wiped off. The membrane was fixed with paraformaldehyde for 15 min and stained with 0.5% crystal violet. The number of invading cells in five random fields was counted under an inverted microscope (200×) (OLYMPUS CKX53, Japan). All experiments were performed in triplicate.
CCK8 Assay
HepG2 and Huh7 cells in the logarithmic growth phase were seeded in a 96-well plate (5 ×10³ cells/well) at 8 h post-transfection and cultured for 24, 48, and 72 h. Next, the cells were incubated with 10 μL CCK8 solution (Beyotime Biotechnology, Shanghai, China) for 1 h and processed using the CCK8 kit, following the manufacturer’s instructions. The absorbance of the reaction mixture at 450 nm was recorded using Varioskan Flash (Thermo Scientific, USA).
Statistical Analyses
Bioinformatics analyses were performed using the R project (3.6.3). Risk comparison between unpaired samples was performed using the Mann–Whitney U-test. Spearman correlation test was used for various analyses, such as ssGSVA and CIBERSORT analysis. The hazard ratio and 95% confidence interval were computed using Cox regression analyses. Kaplan-Meier survival curves were compared using the Log rank test. All statistical analyses were performed using the SPSS22.0 statistical software (SPSS Inc., Chicago, IL, USA). Data are expressed as mean ± variance. Means between two groups were compared using the t-test, whereas those between multiple groups were compared using one-way analysis of variance. Enumeration data were compared using the χ2 test. Differences were considered significant at P < 0.05.
Results
Analysis of DEGs in NCHCC
The study workflow is shown in Figure 1. The data of 377 patients with HCC, including RNA sequencing expression profiles and corresponding clinical information, were downloaded from TCGA. Of these, 159 cases were excluded due to the lack of Ishak score information (Figure S1). The remaining 218 cases were screened based on their Ishak scores. The patients with scores ≤ 5 were included in the non-cirrhotic group (n = 133).35 Finally, 133 non-cirrhotic HCC and 29 corresponding adjacent tissue data were examined. The characteristics of the patients and lesions are summarized in Table 1. In this study, 3167 DEGs between cancer and adjacent tissues were identified (1809 upregulated and 1358 downregulated genes) (Figure 2a). Functional enrichment analyses were performed to determine the biological classification, function, and pathway of DEGs. GO analysis (Figure S2a) revealed that in the biological processes category, DEGs were enriched in response to the proteasomal protein catabolic process, mitotic cell cycle phase transition, negative regulation of phosphate metabolic process, negative regulation of phosphorus metabolic process, and regulation of protein catabolic process. Meanwhile, in the cellular component category, DEGs were enriched in cell-substrate junction, nuclear speck, chromosomal region, chromosome, centromeric region, and outer membrane. In the molecular function category, DEGs were enriched in kinase regulator activity, protein kinase regulator oxidoreductase activity, acting on paired donors, with incorporation or reduction of molecular oxygen, iron ion binding, and ribonuclease activity. KEGG pathway analysis (Figure S2b) revealed that DEGs were enriched in cellular senescence, viral carcinogenesis, alcoholism, cell cycle, and TNF signaling pathway.
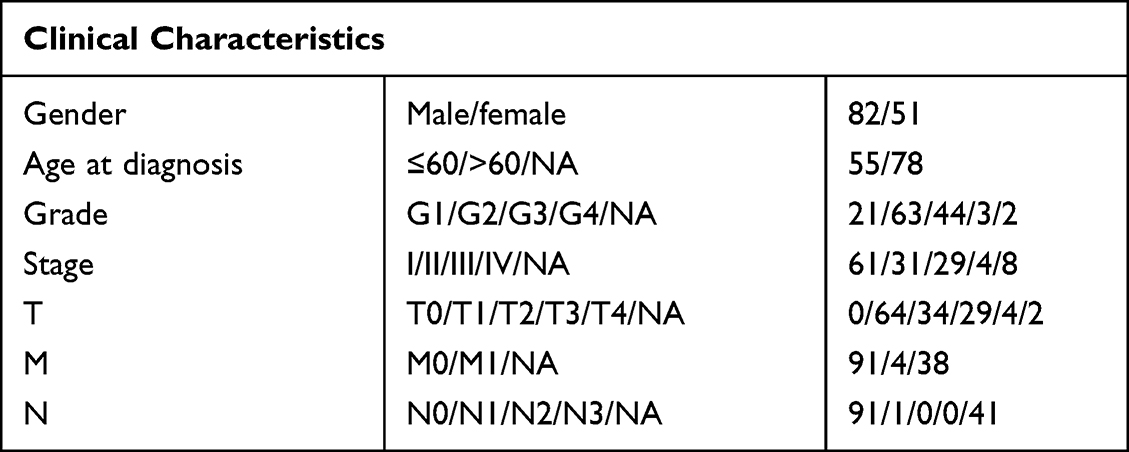 |
Table 1 Characteristics of Patients with Non-Cirrhotic Hepatocellular Carcinoma in the Cancer Genome Atlas Database |
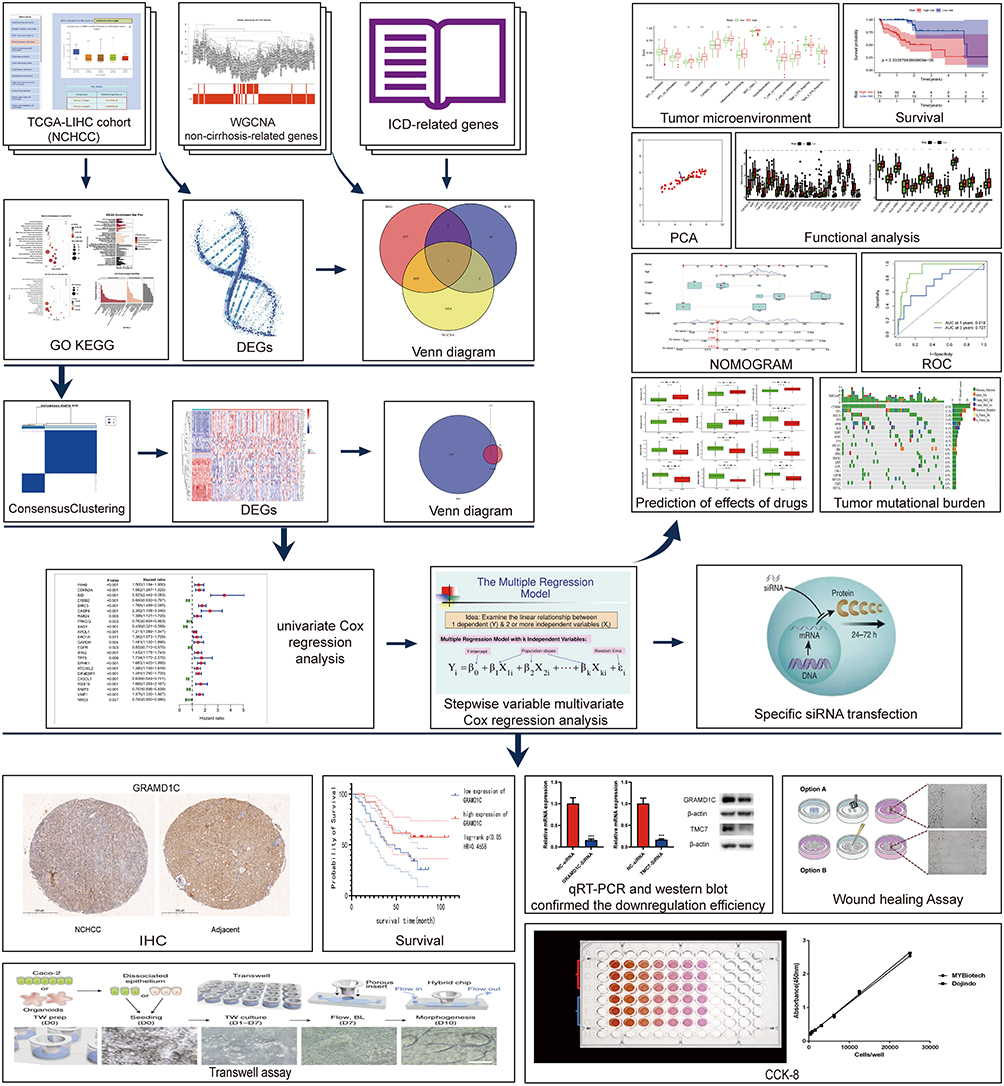 |
Figure 1 The flowchart of the study. |
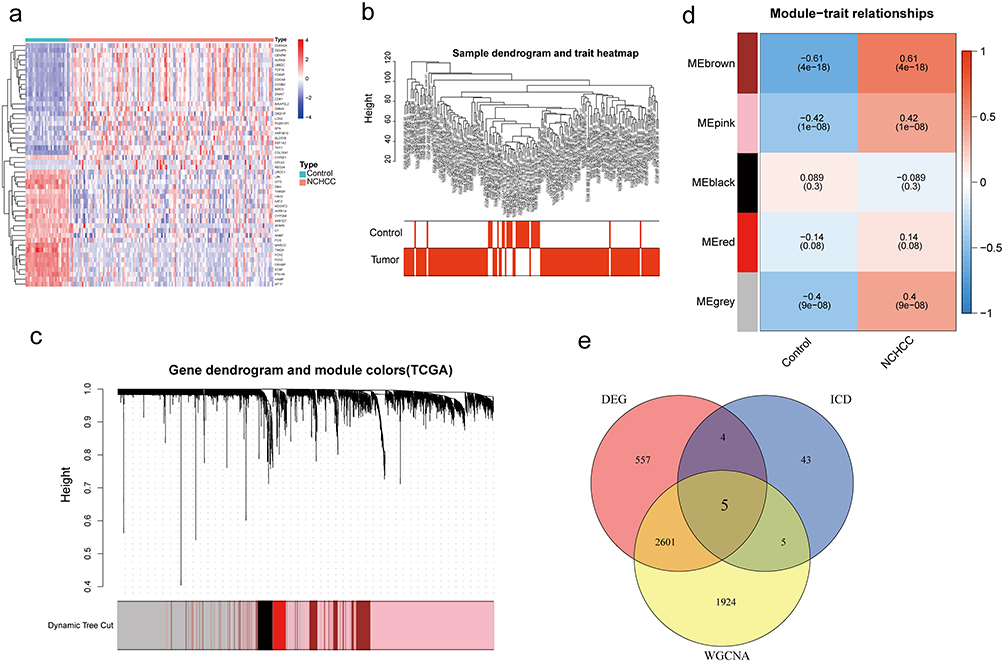 |
Figure 2 Identification of genes associated with ICD and the phenotypic and expression profiles of NHCC. (a) The heatmap of the top 50 differentially expressed genes between the two groups. (b–d) Identification of key gene modules using weighted gene co-expression network analysis. (b) Sample clustering chart. (c) Module clustering dendrogram. (d) Heatmap of the relationship between gene modules and traits (the non-cirrhosis type was used as the phenotype). (e) The Venn diagram of DEGs, ICD-related genes, and key module genes. Abbreviations: ICD, immunogenic cell death; NCHCC, non-cirrhotic hepatocellular carcinoma; DEGs, differently expression genes. |
Screening of modules corresponding to NCHCC phenotype and identification of intersection genes to identify non-cirrhosis-related genes in NCHCC, TCGA-NCHCC dataset was subjected to WGCNA (Figure 2b–d). Genes corresponding to brown, pink, and gray modules were selected for subsequent analysis. After the identification of cancer-related, NCHCC phenotype-related, and ICD-related genes, 5 intersection genes were obtained from the Venn diagram (Figure 2e).
Acquisition of Intersection Genes
ICD-related gene-based clustering analysis, molecular typing, and prognostic assessments consensus clustering analysis was performed with 135 NCHCC cases based on the expression profiles of 5 intersection genes, which revealed the following two subtypes: subtype A (65 cases) and subtype B (68 cases) (Figure 3a). Kaplan-Meier curves revealed that the OS of patients in subtype A was higher than that of patients in subtype B, suggesting that subtype A was associated with improved prognosis (Log rank test, p < 0.001; Figure 3b). Next, 186 DEGs between subtypes A and B were identified using the limma package and the cut-off criteria (Figure 3c). In total, 147 prognosis-related DEGs were screened from the intersection of subtype-related and tissue-related DEGs between cancer and adjacent tissues using the Venn diagram (Figure 3d).
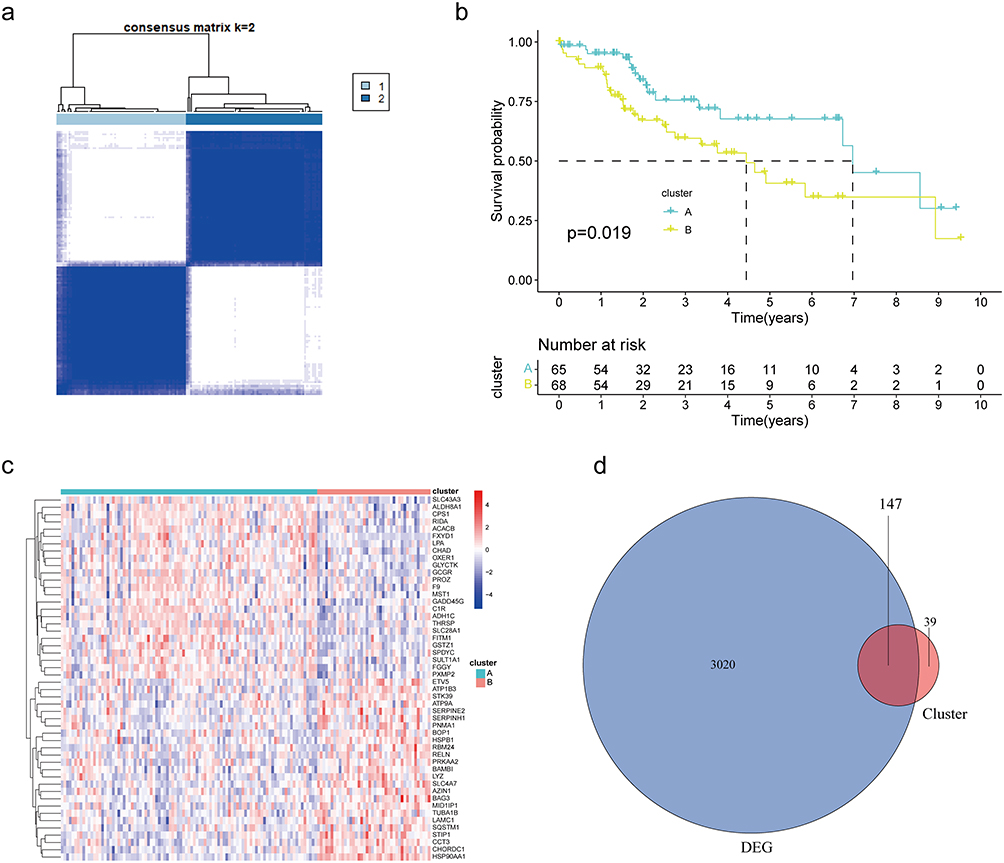 |
Figure 3 ICD-related-gene-based clustering analysis, molecular typing and prognostic assessments. (a) Consensus matrix based on the expression of five genes in the NCHCC cohort at k = 2. (b) K-M survival analysis between two subtypes. (c) The heatmap of the top 50 DEGs between the two subtypes. (d) The Venn diagram of subtypes DEGs and NCHCC DEGs. Abbreviations: ICD, immunogenic cell death; NCHCC, non-cirrhotic hepatocellular carcinoma; DEGs, differentially expressed genes; K-M, Kaplan-Meir. |
Construction and Validation of the Prognosis Model
Univariable and multivariable Cox regression analyses were performed to identify the prognostic factors for OS based on 147 prognosis-related DEGs. Univariable Cox regression analysis revealed 18 prognosis-related factors in NCHCC (Figure 4a). Next, these 18 factors were subjected to stepwise variable multivariable Cox regression analysis to develop a risk score model for predicting prognosis. The panel comprising TMC7, GRAMD1C, and GNPDA1 was a significant predictor of OS in patients with NCHCC. The risk score was calculated as follows: risk score = (1.04 × expression level of TMC7) + (−1.49 × expression level of GRAMD1C) + (2.15 × expression level of GNPDA1). Based on the risk score and optimal cut-off points, the training set was divided into high-risk and low-risk groups. Kaplan-Meier curves revealed that the OS of patients in the low-risk group was higher than that of patients in the high-risk group (Figure 4b and c). The model exhibited good performance in distinguishing the low-risk group from the high-risk group. The AUC values for 1-year, 2-year, and 3-year survival were 0.805, 0.666, and 0.674, respectively. As shown in Figure 4d–g, the performance of the risk score model was good in both the validation set and total TCGA-NCHCC samples.
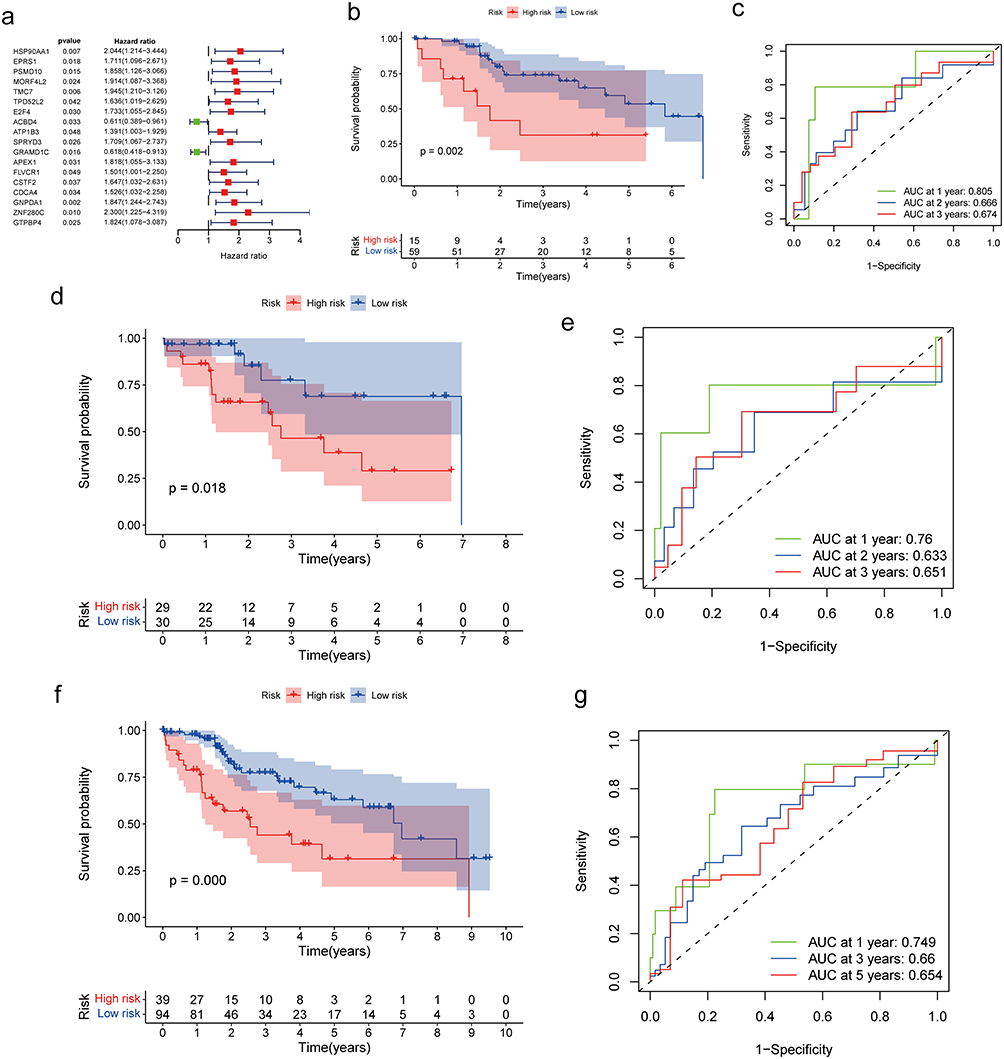 |
Figure 4 Construction and validation of the prognosis model. (a) Forest plot of univariable Cox regression results for the 18 DEGs. Red represents HR>1, green represents HR<1. (b and c) Kaplan-Meier survival curves of the high-risk and low-risk groups in the training set. The survival ROC curve of the training set. (d and e) Kaplan-Meier survival curves for the high-risk and low-risk groups in the validation set. The survival ROC curve of the validation set. (f and g) Kaplan-Meier survival curves of the high-risk and low-risk groups in all sets. The survival ROC curve of all sets. Abbreviations: DEGs, differentially expressed genes; HR, hazard ratio; ROC, receiving operating characteristic. |
Analyses of Tumor Microenvironment in Different Risk Groups
To understand the heterogenicity of the tumor microenvironment of the high-risk and low-risk groups, immune-related analyses, including ssGSEA and CIBERSORT, were performed. ssGSEA revealed that several signaling pathways, such as APC_co_stimulation, check−point, MHC_class_I, and type_II_IFN_reponse were mainly enriched in the high-risk group (Figures 5a and S3a). The CIBERSORT deconvolution approach was used to evaluate the relative abundance of 22 TIICs in the high-risk and low-risk groups. B cells memory, T cells regulatory (Tregs), Dendritic cells resting, Mast cells resting were markedly enriched in the high-score group (Figure 5b). Next, the TIICs enriched with each signature gene in the risk score model were analyzed. The expression of GNPDA1 was positively correlated with the proportion of Mast cells resting. Meanwhile, the expression of TMC7 was positively correlated with the proportion of Tregs and Dendritic cells resting but negatively correlated with the proportion of NK cells activated (Figure 5f). The proportion of Mast cell resting was moderately correlated with the risk score (Figure S3b). Next, the correlation between immune checkpoint expression and risk score was examined. The expression levels of immune checkpoints were significantly upregulated in the high-risk group (Figures 5c and S3c). Additionally, the expression levels of 24 immune checkpoint genes (such as TNFRSF18, NRP1, and CD44) were positively correlated with the risk score.
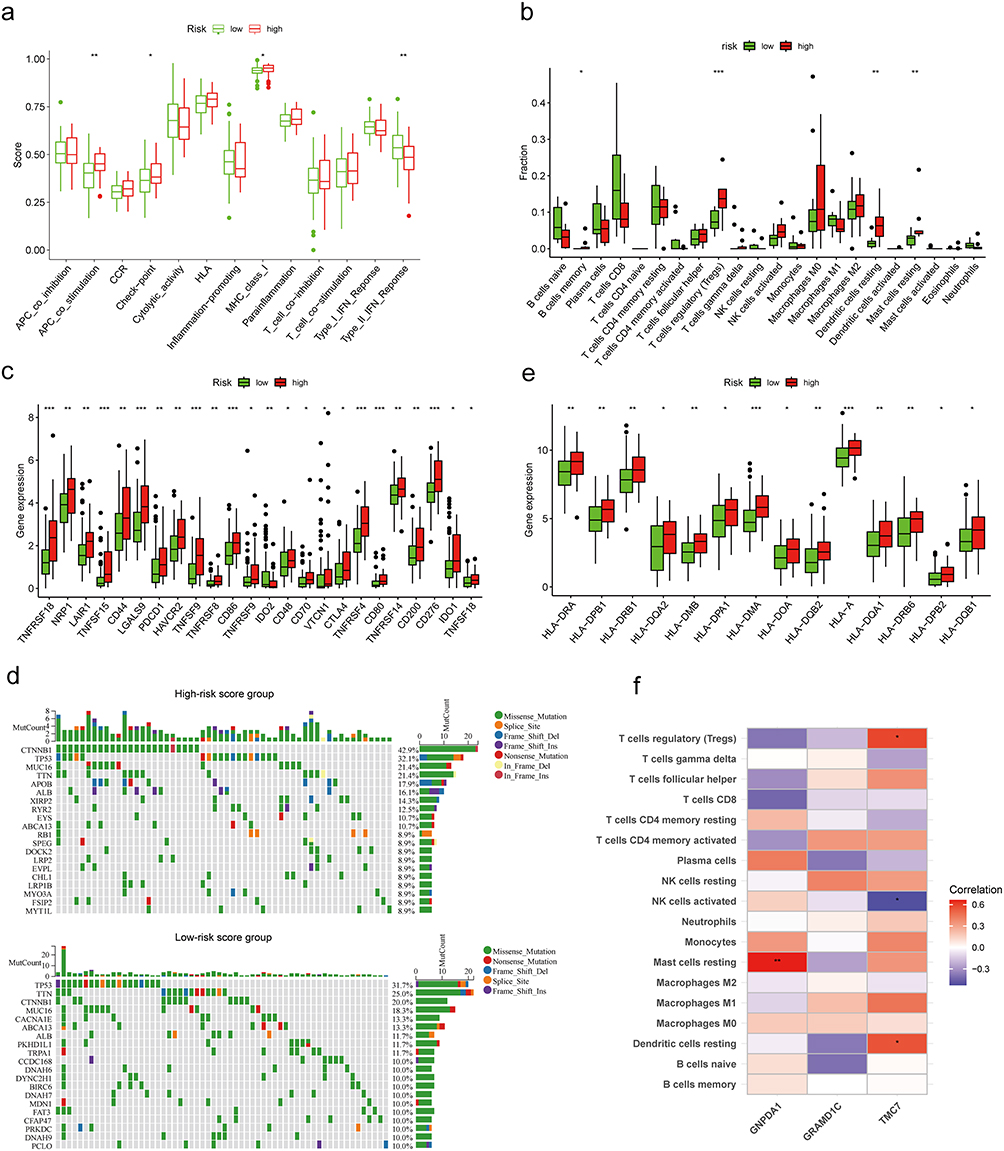 |
Figure 5 Analyses of tumor microenvironment in different risk groups. (a) The fraction of signaling pathways in the high-risk and low-risk groups. (b) The fraction of tumor-infiltrating immune cells in the high-risk and low-risk groups. (c) The expression levels of immune checkpoints in the high-risk and low-risk groups. (d) The waterfall graphs of the most frequently mutated genes in different risk groups. (e) The expression levels of HLA-related genes in the high-risk and low-risk groups. (f) The association between tumor-infiltrating immune cells and biomarker genes. *P < 0.05, **P < 0.01, and ***P < 0.001. |
Tumor mutational burden (TMB) is closely associated with cancer immunotherapy.36 The most common alteration in the high-risk score group was CTNNB1 mutations (42.9%), followed by TP53 (32.1%) and MUC16 and TTN (>20%) mutations. In the low-risk score group, the most common alteration was TP53 mutation (31.7%), followed by TTN (25%) and CTNNB1 (20%) mutations (Figure 5d). The expression levels of HLA-related genes, such as HLA-A, HLA-DMB, HLA-DMA, HLA-DOA, HLA-DPA1, HLA-DPB2, HLA-DPB1, HLA-DQA1, HLA-DQA2, HLA-DQB1, HLA-DQB2, HLA-DRA, HLA-DRB1, and HLA-DRB6 varied between different groups (Figures 5e and S3d).
Prediction of the Drug Sensitivity of NCHCC
The IC50 values of common chemotherapy drugs, small-molecule drugs, or targeted drugs against HCC were analyzed in the high-risk and low-risk groups.37–40 The IC50 values of vinblastine, axitinib, GDC-0449, methotrexate, and docetaxel against tumors in the high-risk group were significantly higher than those against tumors in the low-risk group (Figure 6a–e, p < 0.05). In contrast, the IC50 values of bleomycin, cisplatin, doxorubicin, epothilone B, gemcitabine, mitomycin C, obatoclax, mesylate, and sorafenib against tumors in the high-risk group were lower than those against tumors in the low-risk group, indicating that these prognostic-related genes may influence the therapeutic efficacy of drugs against HCC (Figure 6f–m, p < 0.05).
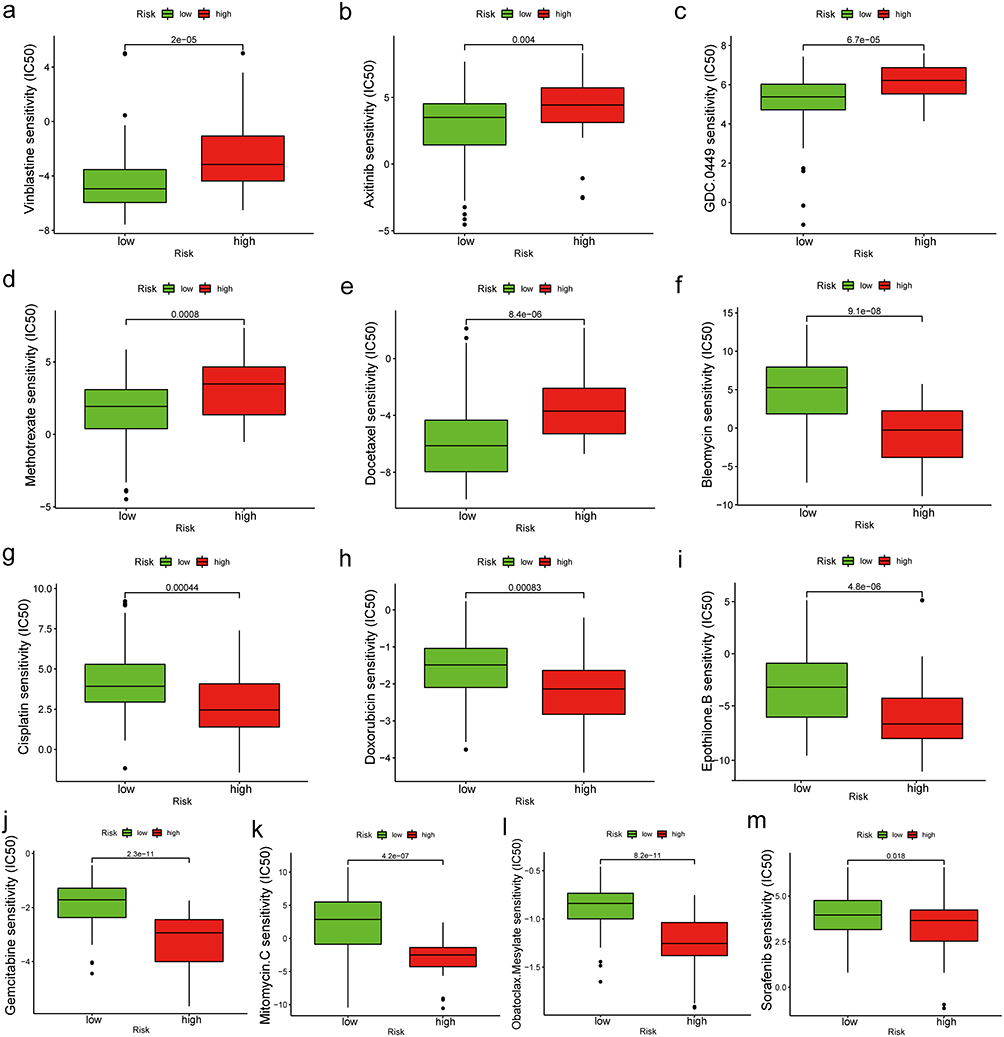 |
Figure 6 (a–m) IC50 values of common chemotherapy drugs, small molecule drugs, or targeted drugs for HCC in different risk groups. Abbreviations: IC50, half-maximal inhibitory concentration; HCC, hepatocellular carcinoma. |
Clinical Value of the Prognostic Signature
The evaluation of the independent prediction ability of the risk signature using univariable and multivariable Cox regression analyses of signature and other common prognostic factors revealed that the risk score and tumor grade were associated with the prognosis of NCHCC in TCGA-NCHCC cohort (Figure 7a and b). Analysis of the distribution of the risk score in different subgroups revealed that the risk score was directly proportional to the grade stage (Figure S3e–f). The Kaplan-Meier curves of the subgroups revealed that the prognosis of the high-risk score group was poor when compared with that of the low-risk score group in the early and middle stages of the disease (Figure 7c–g). Similar patterns were observed with M0, T1, and N0 tumors. These findings indicate that patients with NCHCC of the same clinical stage may exhibit differential prognosis. The risk score model developed in this study should be used to distinguish patients with poor prognoses to optimize treatment plans and consequently achieve an improved prognosis.
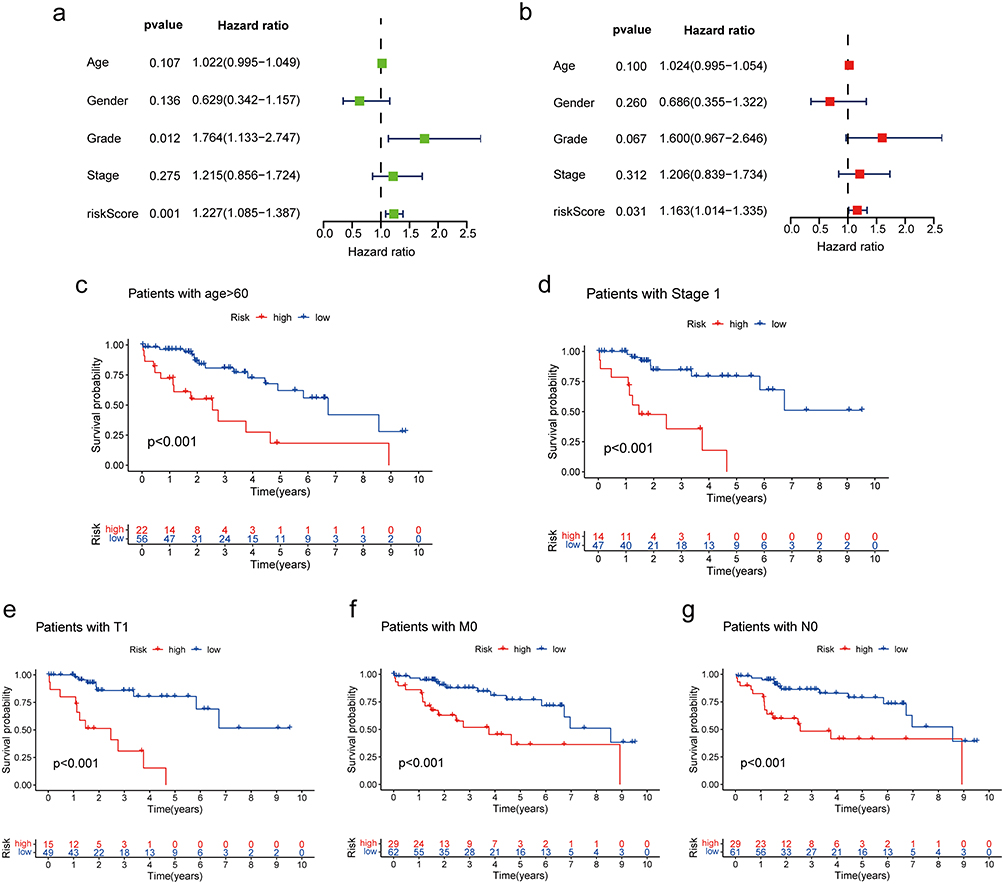 |
Figure 7 Clinical value of the prognostic signature. (a) Forest plot of univariable Cox regression results for 5 prognostic factors. (b) Forest plot of multivariable Cox regression results for 5 prognostic factors. (c–g) Kaplan-Meier survival curves of the high-risk and low-risk groups according to the subgroups. |
To predict the probability of 1-year and 3-year survival, a nomogram was constructed with age, stage, and risk score (Figure 8a). ROC curves were used to evaluate the diagnostic value of the nomogram (Figure 8b). The AUC values of the nomogram for 1-year and 3-year survival were 0.799 and 0.737, respectively. These results along with the calibration curves demonstrated the potent diagnostic value of the nomogram (Figure 8c).
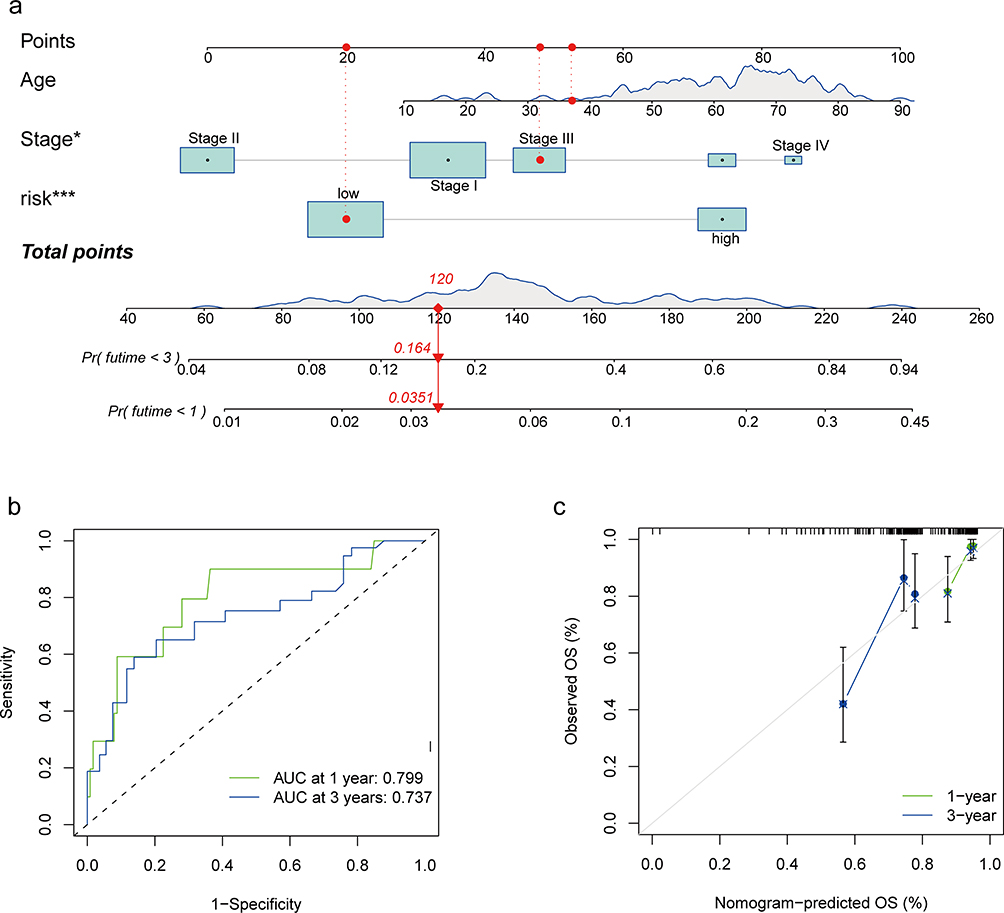 |
Figure 8 Prognosis prediction model for patients with NCHCC. (a) Nomogram for 1-year and 3-year OS rates. (b) Time-dependent ROC curves of the nomogram. (c) Calibration plots of the nomogram. *P < 0.05; ***P < 0.001. Abbreviations: NHCC, non-cirrhotic hepatocellular carcinoma; OS, overall survival; ROC, receiver operating characteristic. |
Effects of TMC7 and GRAMD1C on the Malignant Biological Behavior of Liver Cancer Cells
A previous study demonstrated that GNPDA1 can promote the proliferation, migration, and invasion of HCC cells and inhibit apoptosis.41 To evaluate the role of TMC7 and GRAMD1C in the migration, invasion, and proliferation of liver cancer cells, TMC7 and GRAMD1C were knocked down in HepG2 and Huh7 cell lines using siRNA. The knockdown efficiencies of siRNAs were confirmed using qRT-PCR and Western blotting analyses (Figure 9a–c). The effect of TMC7 and GRAMD1C knockdown on HCC cell malignant behavior was examined using the CCK8, transwell, and wound healing assays. As shown in Figure 9d and e, the migration of TMC7 knockdown HCC cells was significantly downregulated, whereas that of GRAMD1C knockdown HCC cells was significantly upregulated. The results of the transwell assay revealed that tumor cell invasion was significantly suppressed upon TMC7 knockdown but significantly enhanced upon GRAMD1C knockdown (Figure 9f and g). However, the results of the CCK8 assay revealed that the knockdown of TMC7 and GRAMD1C did not affect the proliferation of HepG2 and Huh7 cells (Figure 9h and i).
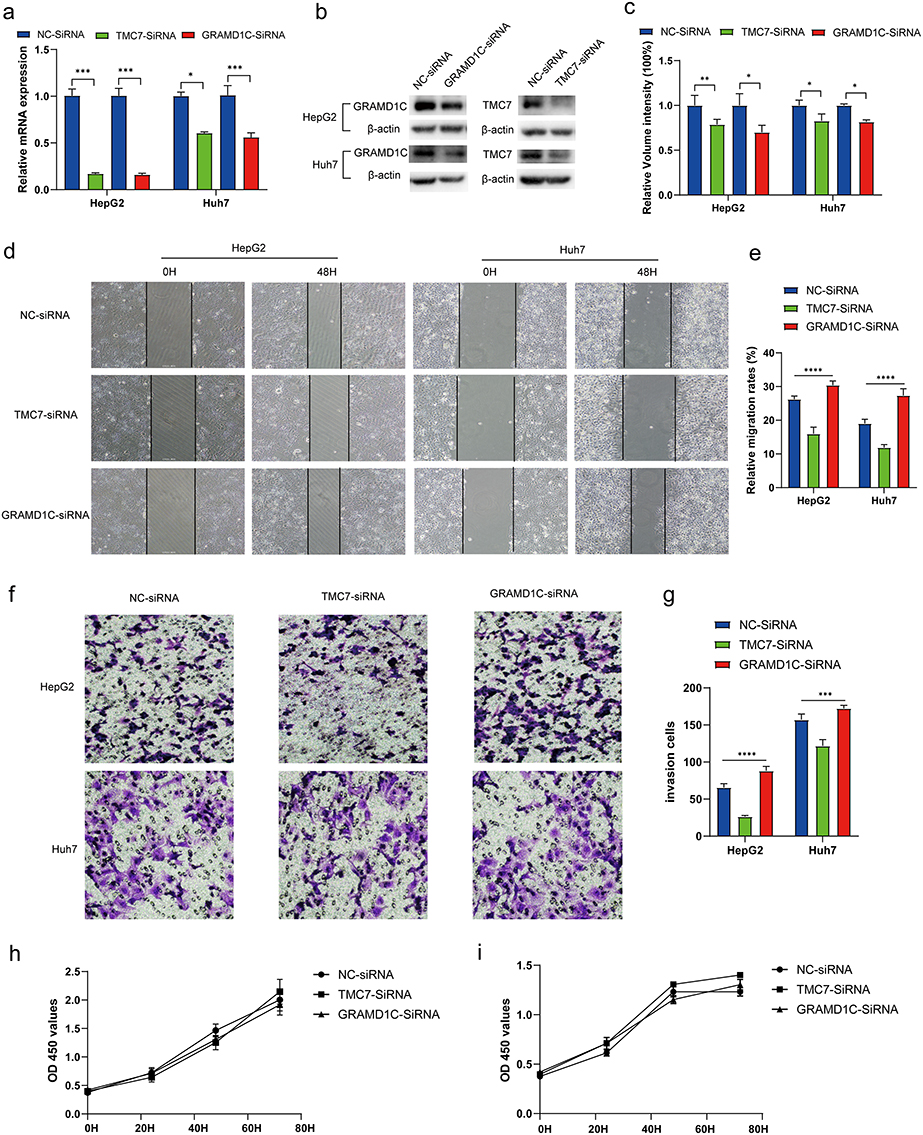 |
Figure 9 TMC7 and GRAMD1C play a key role in cell migration and invasion abilities of HepG2 and Huh7 cells. (a) qRT-PCR analysis revealed that the TMC7 and GRAMD1C mRNA levels in the si-TMC7-transfected and si-GRAMD1C-transfected groups, respectively, were significantly downregulated when compared with those in the si-NC-transfected group. (b and c) Western blotting analysis demonstrated that the TMC7 and GRAMD1C protein levels in the si-TMC7-transfected and si-GRAMD1C-transfected groups, respectively, were significantly downregulated when compared with those in the si-NC group. (d and e) Effect of TMC7 and GRAMD1C knockdown on the migration ability of HepG2 and Huh7 was evaluated using the wound healing assays. (f and g) Effect of TMC7 and GRAMD1C knockdown on the invasion ability of HepG2 and Huh7. (h and i) Effect of TMC7 and GRAMD1C knockdown on the proliferation ability of HepG2 (h) and Huh7 (i) cells was evaluated using the CCK-8 assay. *P < 0.05; **P < 0.01; ***P < 0.001; ****P < 0.0001. Abbreviations: NC, negative control; si, small interfering RNA; qRT-PCR, quantitative real-time polymerase chain reaction; CCK-8, cell counting kit-8. |
The expression levels of TMC7 and GRAMD1C in NCHCC tissues and corresponding tumor-adjacent tissues from the TMA were examined using IHC analysis. Tumor tissues exhibited upregulated TMC7 expression and downregulated GRAMD1C expression (Figure 10a and b). The upregulated expression of TMC7 and the downregulated expression of GRAMD1C predicted poor outcomes in patients with NCHCC (Figure 10c and d).
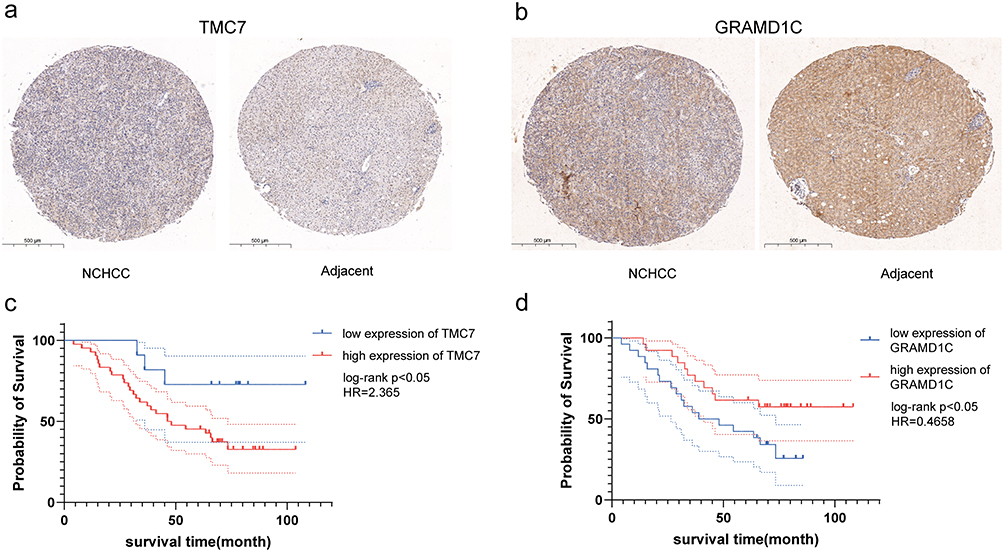 |
Figure 10 Immunohistochemical analysis of two genes in NCHCC tissues and corresponding tumor-adjacent tissues and the Kaplan-Meier curves of patients according to the expression of these two genes. (a and b) Immunohistochemical analysis of two genes in NCHCC tissues and corresponding tumor-adjacent tissues in TMA. (c and d) Kaplan-Meier analysis of overall survival of patients according to the expression of these two genes. Abbreviations: NCHCC, non-cirrhotic hepatocellular carcinoma; TMA, tissue microarray. |
Discussion
In the early stages of ICD, the “do not eat me” and “eat me” signals are mutually restraining. Additionally, tumor cells can be effectively recognized and phagocytosed by DCs and macrophages, triggering antitumor immune responses.42 Therefore, ICD can be an effective pathway to activate the immune response against cancer and can determine the long‐term success of anticancer therapies. In the direct-acting antivirals era, the incidence of non-cirrhotic HCC is increasing, whereas that of cirrhotic HCC is decreasing.43 NCHCC is not diagnosed at early stages as it does not exhibit symptoms during early stages. The pathogenesis of NCHCC is distinct from that of cirrhotic HCC. Thus, HCC therapy may not be the optimal treatment for NCHCC.12 The activation of ICD can improve the immunogenicity of tumors and enhance the immunotherapeutic sensitivity of tumors. The correlation between ICD-related genes and NCHCC prognosis has not been previously examined. Therefore, this study independently examined the prognosis of NCHCC and the prediction of drug therapy based on ICD-related genes.
In this study, the correlation between ICD and NCHCC prognosis was evaluated based on RNA sequencing data from TCGA. NCHCC cases were classified into two subgroups based on key genes associated with ICD, non-cirrhotic phenotype, and cancer tissue using consensus clustering. The prognosis of the two subgroups significantly varied, indicating the presence of two distinct molecular subtypes in NCHCC. A risk score model was constructed for the prediction of NCHCC prognosis using a panel comprising TMC7, GRAMD1C, and GNPDA1. Compared with several other immune-related prognostic models comprising multiple parameters, the risk score model developed in this study comprised 3 independent prognostic genes, which can be clinically useful.
GNPDA1 can catalyze the conversion of glucosamine 6-phosphate to fructose 6-phosphate and consequently provide raw materials for glycolysis, promoting cancer progression.44 Additionally, GNPDA1 plays important roles in cell proliferation, migration, and invasion.41,45,46 The upregulation of GNPDA1 is associated with poor prognosis in patients with HCC.41 TMC7 is a member of a gene family predicted to encode transmembrane proteins.47 The expression of TMC7 is upregulated in pancreatic carcinoma, rectal cancer, and head and neck squamous cell carcinoma, contributing to tumor progression and metastasis.48–50 GRAMD1C, a negative regulator of starvation-induced autophagy, can regulate autophagy initiation and mitochondrial bioenergetics.51 The downregulation of GRAMD1C was associated with advanced clinicopathological characteristics (advanced clinical stage, distant metastasis, and advanced histological grade), poor prognosis, and decreased OS in kidney renal clear cell carcinoma.52 In this study, GNPDA1 and TMC7 were determined to be adverse prognostic factors for NCHCC, whereas GRAMD1C was a favorable prognostic factor, which is consistent with the results of previous studies.
HCC cells reshape the tumor microenvironment through various mechanisms, enabling tumor cells to evade immune surveillance by decreasing the number of T cells and the activity of NK cells, resulting in the upregulation of tumor cell proliferation and metastasis.53 The poor prognosis of patients with HCC was correlated with the increased proportions of Tregs.54 Analysis of immune cell infiltration in cancer tissues revealed that the expression of TMC7 was positively correlated with the proportion of Tregs but negatively correlated with the proportion of activated NK cells. This suggested that the poor prognosis of the high-risk group may be related to immunosuppression.
Patients with NCHCC were classified into high-risk and low-risk groups using the risk score model. The immune microenvironment was significantly different between the groups. A previous study demonstrated that type II IFN (γ-IFN) can mediate immune escape and immunosuppression to promote tumor progression.55 Compared with those in the low-risk group, the immune checkpoint gene expression levels and the enrichment of immune pathways were significantly upregulated and the levels of type II IFN response were significantly downregulated in the high-risk group. This can explain the increased sensitivity of the high-risk group to small-molecule and immunotherapy drugs.
The HLA system mainly comprises the following two classes: major histocompatibility complex (MHC) class I, comprising HLA-A, HLA-B, and HLA-C; MHC class II, comprising HLA-DP, HLA-DQ, and HLA-DR. MHC class I, which is expressed on the surface of all nucleated cell types, is recognized by CD8+ T cells.56,57 Meanwhile, MHC class II is expressed mainly in antigen-presenting cells, including DCs and macrophages, which present exogenous antigens. A previous study reported that the upregulation of MHC class II suppresses tumor-infiltrating lymphocytes and tumor immune response.58 In this study, analysis of HLA-related genes indicated that the expression levels of several MHC class II genes (HLA-DPA1, HLA-DPB2, HLA-DPB1, HLA-DQA1, HLA-DQA2, HLA-DQB1, HLA-DQB2, HLA-DRA, HLA-DRB1, and HLA-DRB6) in the high-risk group were significantly higher than those in the low-risk group. We speculated that the high-risk group may be associated with an immunosuppressive state, which is correlated with poor prognosis. TMB is a predictive biomarker for immunotherapy in multiple cancers.59 In this study, TMB analysis revealed that the mutation frequency of CTNNB1 in the high-risk group was significantly higher than that in the low-risk group. However, the differences in the frequency of other mutations were minimal between the two groups. HCC with a high proportion of CTNNB1 mutation, which is related to the inhibition of immune cells and progression of tumors, is highly likely to be insensitive to immunotherapy.60,61 Drug sensitivity analysis revealed the sensitivity of tumors in the high-risk group to multiple anticancer drugs was distinct from that of tumors in the low-risk groups. Consequently, appropriate anticancer drugs can be selected based on the risk score for patients with NCHCC.
Clinicians often classify and grade patients with tumors according to tumor size, the degree of invasion, lymph node involvement, and distant metastasis (TNM) to decide the treatment strategy.62 However, this study demonstrated that even patients with the same stage tumor may exhibit differential prognostic outcomes. Therefore, patients with the same stage should be further stratified according to the risk score model developed in this study and subjected to aggressive treatment. For early-stage disease, curative intent treatments include surgery, radiofrequency ablation, and liver transplant.63,64 Meanwhile, for advanced-stage disease, conventional cytotoxic chemotherapy is ineffective with limited clinical benefits. Treatment with multikinase inhibitors is expected to enhance the OS of patients with advanced HCC by only a few months.6,64 Accurate risk assessment in the early stage of liver cancer will aid in improving therapeutic response and prognosis. The risk score model developed in this study can assess the risk level in NCHCC at early stages (stage 1, M0, T1, and N0). This strategy will enable clinicians to accurately predict the prognosis of patients, devise treatment plans, and communicate with patients and their families about the treatment plan rather than only evaluating the clinical condition of patients based on rough indicators (such as the TNM stage).
The predictive nomogram integrates the molecular prediction model at the micro level and the staging index of the TNM stage at the macro level and provides a convenient and precise method for clinicians to evaluate the 1-year and 3-year prognosis of patients with NCHCC. The mortality rate and corresponding survival rate within a certain period can be evaluated by scoring three prognostic indicators.
This study further verified the correlation between the expression of variables in the risk model and the malignant biological behavior of HCC cells in vitro. The results of in vitro experiments were consistent with those of bioinformatics analysis. The mechanism of key genes affecting the migration and invasion abilities of liver cancer cells will be analyzed in future studies.
This study has some limitations. First, as the complete Ishak score information was lacking in other public databases, only internal verification was performed based on TCGA datasets. More cases must be used for external validation of the signature genes developed in this study. Second, in histopathological verification of signature gene expression, most of the included cases had a history of hepatitis B, which can be attributed to the high prevalence of hepatitis B in China.65 However, other types of cases will be examined in the future to validate the conclusions of this study. Third, the model developed in this study can be used to predict patient survival. However, the mechanisms through which gene interactions in the model affect tumor progression have not been investigated. We plan to expand our research in metabolomics, proteomics and genomics to provide insight into downstream mechanisms.
In conclusion, bioinformatics analyses were performed to generate a three-gene predictive risk score model to predict the outcomes of patients with NCHCC. A novel nomogram was developed to predict the survival outcomes of these patients. Risk stratification will enable the administration of optimal therapy for patients with NCHCC.
Data Sharing Statement
Data sharing is not applicable to this article as no new data were created or analyzed in this study.
Ethics Committee Approval and Informed Consent
Ethical approval was received from Ethical Review Committee of the First Affiliated Hospital of Chongqing Medical University, Chongqing, China (Reference number: 2022–K518). All ethical rules and regulations were followed while conducting the study and the participants were included in the study based on informed consent.
Author Contributions
All authors made a significant contribution to the work reported, whether that is in the conception, study design, execution, acquisition of data, analysis and interpretation, or in all these areas; took part in drafting, revising or critically reviewing the article; gave final approval of the version to be published; have agreed on the journal to which the article has been submitted; and agree to be accountable for all aspects of the work.
Funding
This study was supported by the General Project of Chongqing Natural Science Foundation of China (030101022020MSXM026).
Disclosure
The authors report no conflicts of interest in this work.
References
1. Asafo-Agyei KO, Samant H. Hepatocellular carcinoma. In: StatPearls. StatPearls Publishing. Copyright © 2022, StatPearls Publishing LLC; 2022.
2. Lee DH, Lee JM. Primary malignant tumours in the non-cirrhotic liver. Eur J Radiol. 2017;95:349–361. doi:10.1016/j.ejrad.2017.08.030
3. Su K, Huang W, Li X, et al. Evaluation of lactate dehydrogenase and alkaline phosphatase as predictive biomarkers in the prognosis of hepatocellular carcinoma and development of a new nomogram. J Hepatocell Carcinoma. 2023;10:69–79. doi:10.2147/JHC.S398632
4. Su K, Liu Y, Wang P, et al. Heat-shock protein 90α is a potential prognostic and predictive biomarker in hepatocellular carcinoma: a large-scale and multicenter study. Hepatol Int. 2022;16(5):1208–1219. doi:10.1007/s12072-022-10391-y
5. Su K, Guo L, He K, et al. PD-L1 expression on circulating tumor cells can be a predictive biomarker to PD-1 inhibitors combined with radiotherapy and antiangiogenic therapy in advanced hepatocellular carcinoma. Front Oncol. 2022;12:873830. doi:10.3389/fonc.2022.873830
6. Li H, Wu Z, Chen J, et al. External radiotherapy combined with sorafenib has better efficacy in unresectable hepatocellular carcinoma: a systematic review and meta-analysis. Clin Exp Med. 2022;23(5):1537–1549. doi:10.1007/s10238-022-00972-4
7. Kumar M, Kumar R, Hissar SS, et al. Risk factors analysis for hepatocellular carcinoma in patients with and without cirrhosis: a case-control study of 213 hepatocellular carcinoma patients from India. J Gastroenterol Hepatol. 2007;22(7):1104–1111. doi:10.1111/j.1440-1746.2007.04908.x
8. Kozbial K, Moser S, Schwarzer R, et al. Unexpected high incidence of hepatocellular carcinoma in cirrhotic patients with sustained virologic response following interferon-free direct-acting antiviral treatment. J Hepatol. 2016;65(4):856–858. doi:10.1016/j.jhep.2016.06.009
9. Pang Q, Zhang JY, Xu XS, et al. The prognostic values of 12 cirrhosis-relative noninvasive models in patients with hepatocellular carcinoma. Scand J Clin Lab Invest. 2015;75(1):73–84. doi:10.3109/00365513.2014.981759
10. Mei Y, You Y, Xia J, Gong JP, Wang YB. Identifying differentially expressed microRNAs between cirrhotic and non-cirrhotic hepatocellular carcinoma and exploring their functions using bioinformatic analysis. Cell Physiol Biochem. 2018;48(4):1443–1456. doi:10.1159/000492254
11. Xie QS, Chen ZX, Zhao YJ, Gu H, Geng XP, Liu FB. Systematic review of outcomes and meta-analysis of risk factors for prognosis after liver resection for hepatocellular carcinoma without cirrhosis. Asian J Surg. 2021;44(1):36–45. doi:10.1016/j.asjsur.2020.08.019
12. Perisetti A, Goyal H, Yendala R, Thandassery RB, Giorgakis E. Non-cirrhotic hepatocellular carcinoma in chronic viral hepatitis: current insights and advancements. World J Gastroenterol. 2021;27(24):3466–3482. doi:10.3748/wjg.v27.i24.3466
13. Yen YH, Cheng YF, Wang JH, Lin CC, Wang CC, Chemin I. Characteristics and etiologies of hepatocellular carcinoma in patients without cirrhosis: when East meets West. PLoS One. 2021;16(1):e0244939. doi:10.1371/journal.pone.0244939
14. Yau T, Tang VY, Yao TJ, Fan ST, Lo CM, Poon RT. Development of Hong Kong Liver Cancer staging system with treatment stratification for patients with hepatocellular carcinoma. Gastroenterology. 2014;146(7):1691–700.e3. doi:10.1053/j.gastro.2014.02.032
15. Jiang Y, Chen S, Wu Y, et al. Establishment and validation of a novel prognostic model for non-virus-related hepatocellular carcinoma. Cancer Cell Int. 2022;22(1):300. doi:10.1186/s12935-022-02725-5
16. Liu MZ, Tang LL, Zong JF, et al. Evaluation of sixth edition of AJCC staging system for nasopharyngeal carcinoma and proposed improvement. Int J Radiat Oncol Biol Phys. 2008;70(4):1115–1123. doi:10.1016/j.ijrobp.2007.07.2353
17. Tharin Z, Richard C, Derangère V, et al. PIK3CA and PIK3R1 tumor mutational landscape in a pan-cancer patient cohort and its association with pathway activation and treatment efficacy. Sci Rep. 2023;13(1):4467. doi:10.1038/s41598-023-31593-w
18. Qi L, Chen F, Wang L, Yang Z, Zhang W, Li ZH. Identification of anoikis-related molecular patterns to define tumor microenvironment and predict immunotherapy response and prognosis in soft-tissue sarcoma. Front Pharmacol. 2023;14:1136184. doi:10.3389/fphar.2023.1136184
19. Lim SY, Shklovskaya E, Lee JH, et al. The molecular and functional landscape of resistance to immune checkpoint blockade in melanoma. Nat Commun. 2023;14(1):1516. doi:10.1038/s41467-023-36979-y
20. Chiaravalli M, Spring A, Agostini A, Piro G, Carbone C, Tortora G. Immunogenic cell death: an emerging target in gastrointestinal cancers. Cells. 2022;11(19). doi:10.3390/cells11193033
21. Galluzzi L, Vitale I, Warren S, et al. Consensus guidelines for the definition, detection and interpretation of immunogenic cell death. J Immunother Cancer. 2020;8(1):e000337. doi:10.1136/jitc-2019-000337
22. Green DR, Ferguson T, Zitvogel L, Kroemer G. Immunogenic and tolerogenic cell death. Nat Rev Immunol. 2009;9(5):353–363. doi:10.1038/nri2545
23. Sprooten J, Garg AD. Type I interferons and endoplasmic reticulum stress in health and disease. Int Rev Cell Mol Biol. 2020;350:63–118. doi:10.1016/bs.ircmb.2019.10.004
24. Garg AD, De Ruysscher D, Agostinis P. Immunological metagene signatures derived from immunogenic cancer cell death associate with improved survival of patients with lung, breast or ovarian malignancies: a large-scale meta-analysis. Oncoimmunology. 2016;5(2):e1069938. doi:10.1080/2162402X.2015.1069938
25. Vacchelli E, Ma Y, Baracco EE, et al. Chemotherapy-induced antitumor immunity requires formyl peptide receptor 1. Science. 2015;350(6263):972–978. doi:10.1126/science.aad0779
26. Zhao X, Yang K, Zhao R, et al. Inducing enhanced immunogenic cell death with nanocarrier-based drug delivery systems for pancreatic cancer therapy. Biomaterials. 2016;102:187–197. doi:10.1016/j.biomaterials.2016.06.032
27. Meng Q, Ding B, Ma P, Lin J. Interrelation between programmed cell death and immunogenic cell death: take antitumor nanodrug as an example. Small Methods. 2023;7(5):e2201406. doi:10.1002/smtd.202201406
28. Lu Y, Wang Y, Liu W, et al. Photothermal “nano-dot” reactivate “immune-hot” for tumor treatment via reprogramming cancer cells metabolism. Biomaterials. 2023;296:122089. doi:10.1016/j.biomaterials.2023.122089
29. Guo B, Qu Y, Sun Y, et al. Co-delivery of gemcitabine and paclitaxel plus NanoCpG empowers chemoimmunotherapy of postoperative “cold” triple-negative breast cancer. Bioact Mater. 2023;25:61–72. doi:10.1016/j.bioactmat.2023.01.014
30. Li Y, Feng J, Wang T, et al. Construction of an immunogenic cell death-based risk score prognosis model in breast cancer. Front Genet. 2022;13:1069921. doi:10.3389/fgene.2022.1069921
31. Han Y, Cai Q, Xie X, Gao S, Fan X. Development and validation of prognostic index based on immunogenic cell death-related genes with melanoma. Front Oncol. 2022;12:1011046. doi:10.3389/fonc.2022.1011046
32. Goodman ZD. Grading and staging systems for inflammation and fibrosis in chronic liver diseases. J Hepatol. 2007;47(4):598–607. doi:10.1016/j.jhep.2007.07.006
33. Xu M, Lu JH, Zhong YZ, et al. Immunogenic cell death-relevant damage-associated molecular patterns and sensing receptors in triple-negative breast cancer molecular subtypes and implications for immunotherapy. Front Oncol. 2022;12:870914. doi:10.3389/fonc.2022.870914
34. Langfelder P, Horvath S. Fast R functions for robust correlations and hierarchical clustering. J Stat Softw. 2012;46(11). doi:10.18637/jss.v046.i11
35. Ding B, Lou W, Liu J, Li R, Chen J, Fan W. In silico analysis excavates potential biomarkers by constructing miRNA-mRNA networks between non-cirrhotic HCC and cirrhotic HCC. Cancer Cell Int. 2019;19(1):186. doi:10.1186/s12935-019-0901-3
36. Chan TA, Yarchoan M, Jaffee E, et al. Development of tumor mutation burden as an immunotherapy biomarker: utility for the oncology clinic. Ann Oncol. 2019;30(1):44–56. doi:10.1093/annonc/mdy495
37. Wang Y, Wang Z, Sun J, Qian Y. Identification of HCC subtypes with different prognosis and metabolic patterns based on mitophagy. Front Cell Dev Biol. 2021;9:799507. doi:10.3389/fcell.2021.799507
38. Guan Q, Pan J, Ren N, Qiao C, Wei M, Li Z. Identification of novel lactate metabolism signatures and molecular subtypes for prognosis in hepatocellular carcinoma. Front Cell Dev Biol. 2022;10:960277. doi:10.3389/fcell.2022.960277
39. Zhang H, Zhang W, Jiang L, Chen Y. Recent advances in systemic therapy for hepatocellular carcinoma. Biomark Res. 2022;10(1):3. doi:10.1186/s40364-021-00350-4
40. Damaskos C, Garmpis N, Dimitroulis D, et al. Targeted therapies for hepatocellular carcinoma treatment: a new era ahead-a systematic review. Int J Mol Sci. 2022;23(22):14117. doi:10.3390/ijms232214117
41. Li D, Cheng X, Zheng W, Chen J. Glucosamine-6-phosphate isomerase 1 promotes tumor progression and indicates poor prognosis in hepatocellular carcinoma. Cancer Manag Res. 2020;12:4923–4935. doi:10.2147/CMAR.S250094
42. Brown GC, Neher JJ. Eaten alive! Cell death by primary phagocytosis: “phagoptosis”. Trends Biochem Sci. 2012;37(8):325–332. doi:10.1016/j.tibs.2012.05.002
43. Mathur K, Mazhar A, Patel M, et al. Changing trends of cirrhotic and noncirrhotic hepatocellular carcinoma in the era of directly-acting antiviral agents. Clin Transl Gastroenterol. 2021;12(11):e00420. doi:10.14309/ctg.0000000000000420
44. Wolosker H, Kline D, Bian Y, et al. Molecularly cloned mammalian glucosamine-6-phosphate deaminase localizes to transporting epithelium and lacks oscillin activity. FASEB j. 1998;12(1):91–99. doi:10.1096/fasebj.12.1.91
45. Oikari S, Makkonen K, Deen AJ, et al. Hexosamine biosynthesis in keratinocytes: roles of GFAT and GNPDA enzymes in the maintenance of UDP-GlcNAc content and hyaluronan synthesis. Glycobiology. 2016;26(7):710–722. doi:10.1093/glycob/cww019
46. Xia R, Tang H, Shen J, et al. Prognostic value of a novel glycolysis-related gene expression signature for gastrointestinal cancer in the Asian population. Cancer Cell Int. 2021;21(1):154. doi:10.1186/s12935-021-01857-4
47. Hahn Y, Kim DS, Pastan IH, Lee B. Anoctamin and transmembrane channel-like proteins are evolutionarily related. Int J Mol Med. 2009;24(1):51–55. doi:10.3892/ijmm_00000205
48. Watanabe T, Kobunai T, Akiyoshi T, Matsuda K, Ishihara S, Nozawa K. Prediction of response to preoperative chemoradiotherapy in rectal cancer by using reverse transcriptase polymerase chain reaction analysis of four genes. Dis Colon Rectum. 2014;57(1):23–31. doi:10.1097/01.dcr.0000437688.33795.9d
49. Cheng Y, Wang K, Geng L, et al. Identification of candidate diagnostic and prognostic biomarkers for pancreatic carcinoma. EBioMedicine. 2019;40:382–393. doi:10.1016/j.ebiom.2019.01.003
50. Guo Y, Pan WK, Wang ZW, et al. Identification of novel biomarkers for predicting prognosis and immunotherapy response in head and neck squamous cell carcinoma based on ceRNA network and immune infiltration analysis. Biomed Res Int. 2021;2021:4532438. doi:10.1155/2021/4532438
51. Myw N, Charsou C, Lapao A, et al. The cholesterol transport protein GRAMD1C regulates autophagy initiation and mitochondrial bioenergetics. Nat Commun. 2022;13(1):6283. doi:10.1038/s41467-022-33933-2
52. Hao H, Wang Z, Ren S, et al. Reduced GRAMD1C expression correlates to poor prognosis and immune infiltrates in kidney renal clear cell carcinoma. PeerJ. 2019;7:e8205. doi:10.7717/peerj.8205
53. Han Q, Zhao H, Jiang Y, Yin C, Zhang J. HCC-derived exosomes: critical player and target for cancer immune escape. Cells. 2019;8(6):558. doi:10.3390/cells8060558
54. Zhang Q, He Y, Luo N, et al. Landscape and dynamics of single immune cells in hepatocellular carcinoma. Cell. 2019;179(4):829–845.e20. doi:10.1016/j.cell.2019.10.003
55. Xie L, Liu M, Cai M, et al. Regorafenib enhances anti-tumor efficacy of immune checkpoint inhibitor by regulating IFN-γ/NSDHL/SREBP1/TGF-β1 axis in hepatocellular carcinoma. Biomed Pharmacother. 2023;159:114254. doi:10.1016/j.biopha.2023.114254
56. Dehn J, Spellman S, Hurley CK, et al. Selection of unrelated donors and cord blood units for hematopoietic cell transplantation: guidelines from the NMDP/CIBMTR. Blood. 2019;134(12):924–934. doi:10.1182/blood.2019001212
57. Fan WL, Shiao MS, Hui RC, et al. HLA association with drug-induced adverse reactions. J Immunol Res. 2017;2017:3186328. doi:10.1155/2017/3186328
58. Li CY, Park HJ, Shin J, Baik JE, Mehrara BJ, Kataru RP. Tumor-associated lymphatics upregulate MHC-II to suppress tumor-infiltrating lymphocytes. Int J Mol Sci. 2022;23(21):13470.
59. Cheng Y, Bu D, Zhang Q, et al. Genomic and transcriptomic profiling indicates the prognosis significance of mutational signature for TMB-high subtype in Chinese patients with gastric cancer. J Adv Res. 2022;51:121–134.
60. Hong T, Su W, Pan Y, Tian C, Lei G. Aging-related features predict prognosis and immunotherapy efficacy in hepatocellular carcinoma. Front Immunol. 2022;13:951459. doi:10.3389/fimmu.2022.951459
61. Dai W, Shen J, Yan J, et al. Glutamine synthetase limits b-catenin-mutated liver cancer growth by maintaining nitrogen homeostasis and suppressing mTORC1. J Clin Invest. 2022;132(24). doi:10.1172/JCI161408
62. Allaire M, Bruix J, Korenjak M, et al. What to do about hepatocellular carcinoma: recommendations for health authorities from the International Liver Cancer Association. JHEP Rep. 2022;4(12):100578. doi:10.1016/j.jhepr.2022.100578
63. Kulik L, El-Serag HB. Epidemiology and management of hepatocellular carcinoma. Gastroenterology. 2019;156(2):477–491.e1. doi:10.1053/j.gastro.2018.08.065
64. Li H, Guo L, Su K, et al. Construction and validation of TACE therapeutic efficacy by ALR score and nomogram: a large, multicenter study. J Hepatocell Carcinoma. 2023;10:1009–1017. doi:10.2147/JHC.S414926
65. Su K, Shen Q, Tong J, et al. Construction and validation of a nomogram for HBV-related hepatocellular carcinoma: a large, multicenter study. Ann Hepatol. 2023;28(4):101109. doi:10.1016/j.aohep.2023.101109
 © 2023 The Author(s). This work is published and licensed by Dove Medical Press Limited. The
full terms of this license are available at https://www.dovepress.com/terms
and incorporate the Creative Commons Attribution
- Non Commercial (unported, 3.0) License.
By accessing the work you hereby accept the Terms. Non-commercial uses of the work are permitted
without any further permission from Dove Medical Press Limited, provided the work is properly
attributed. For permission for commercial use of this work, please see paragraphs 4.2 and 5 of our Terms.
© 2023 The Author(s). This work is published and licensed by Dove Medical Press Limited. The
full terms of this license are available at https://www.dovepress.com/terms
and incorporate the Creative Commons Attribution
- Non Commercial (unported, 3.0) License.
By accessing the work you hereby accept the Terms. Non-commercial uses of the work are permitted
without any further permission from Dove Medical Press Limited, provided the work is properly
attributed. For permission for commercial use of this work, please see paragraphs 4.2 and 5 of our Terms.
Recommended articles
Clinical Analysis and Prognostic Prediction Model for Patients with Uterine Leiomyosarcoma at FIGO Stage I
Chen S, Deng Y, Zhai Y, Zhan Y, Li X, Wang J, Bai H
International Journal of Women's Health 2023, 15:545-557
Published Date: 11 April 2023
Development of a Prognostic Nomogram for Nonneutropenic Invasive Pulmonary Aspergillosis Based on Machine Learning
Du W, Ji W, Luo T, Zhang Y, Guo W, Liang J, Lv Y
Journal of Inflammation Research 2024, 17:9823-9835
Published Date: 26 November 2024
Nomogram Based on Immune-Inflammatory Score and Classical Clinicopathological Parameters for Predicting the Recurrence of Endometrial Carcinoma: A Large, Multi-Center Retrospective Study
Wang Y, Zheng Y, Tian C, Yu J, Rao K, Zeng N, Jiang P
Journal of Inflammation Research 2024, 17:11437-11449
Published Date: 23 December 2024
Development of a Prognostic Nomogram Incorporating the Naples Prognostic Score for Postoperative Oral Squamous Cell Carcinoma Patients
Xu XL, Cheng H
Journal of Inflammation Research 2025, 18:325-345
Published Date: 7 January 2025
Modified Naples Prognostic Score for Postoperative Prognostic Stratification in Patients with Oral Squamous Cell Carcinoma
Ran J, Liu Y, Yi X, Zhang F
Journal of Inflammation Research 2025, 18:11593-11610
Published Date: 24 August 2025