Back to Journals » Journal of Inflammation Research » Volume 15
Skeletal Myosteatosis is Associated with Systemic Inflammation and a Loss of Muscle Bioenergetics in Stable COPD
Authors Persson HL ![]() , Sioutas A, Kentson M, Jacobson P, Lundberg P
, Sioutas A, Kentson M, Jacobson P, Lundberg P ![]() , Dahlqvist Leinhard O, Forsgren MF
, Dahlqvist Leinhard O, Forsgren MF ![]()
Received 12 March 2022
Accepted for publication 5 July 2022
Published 1 August 2022 Volume 2022:15 Pages 4367—4384
DOI https://doi.org/10.2147/JIR.S366204
Checked for plagiarism Yes
Review by Single anonymous peer review
Peer reviewer comments 2
Editor who approved publication: Professor Ning Quan
Hans Lennart Persson,1,2,* Apostolos Sioutas,1,2,* Magnus Kentson,1,3 Petra Jacobson,1,2 Peter Lundberg,1,4,5 Olof Dahlqvist Leinhard,1,5,6 Mikael Fredrik Forsgren1,5,6
1Department of Health, Medicine and Caring Sciences, Linköping University, Linköping, Sweden; 2Department of Respiratory Medicine in Linköping, Linköping University, Linköping, Sweden; 3Department of Pulmonology, Ryhov County Hospital, Jönköping, Sweden; 4Department of Radiation Physics in Linköping, Linköping University, Linköping, Sweden; 5Centre for Medical Image Science and Visualization, Linköping University, Linköping, Sweden; 6AMRA Medical AB, Linköping, Sweden
*These authors contributed equally to this work
Correspondence: Hans Lennart Persson; Apostolos Sioutas, Department of Respiratory Medicine in Linköping, Linköping University, Linköping, SE-581 85, Sweden, Tel +46 0 13 1033621, Email [email protected]; [email protected]
Background: Common features among patients with more advanced chronic obstructive pulmonary disease (COPD) are systemic inflammation and a loss of both muscle mass and normal muscle composition. In the present study, we investigated COPD subjects to better understand how thigh muscle fat infiltration (MFI) and energy metabolism relate to each other and to clinical features of COPD with emphasis on systemic inflammation.
Methods: Thirty-two Caucasians with stable COPD were investigated using questionnaires, lung function tests, blood analysis and magnetic resonance imaging (MRI) for analysis of body- and thigh muscle composition. Bioenergetics in the resting thigh muscle, expressed as the PCr/Pi ratio, were analysed using 31phosphorus magnetic resonance spectroscopy (31P-MRS).
Results: Based on the combination of the MFI adjusted for sex (MFIa) and the thigh fat-tissue free muscle volume, expressed as the deviation from the expected muscle volume of a matched virtual control group (FFMVvcg), all COPD subjects displayed abnormally composed thigh muscles. Clinical features of increased COPD severity, including a decrease of blood oxygenation (r = − 0.44, p < 0.05) and FEV1/FVC ratio, reflecting airway obstruction (r = − 0.53, p < 0.01) and an increase of COPD symptoms (r = 0.37, p < 0.05) and breathing frequency at rest (r = 0.41, p < 0.05), were all associated with a raise of the PCr/Pi ratio in the thigh muscle. Increased MFIa of the thigh muscle correlated positively with markers of systemic inflammation (white blood cell count, r = 0.41, p < 0.05; fibrinogen, r = 0.44, p < 0.05), and negatively with weekly physical activity (r = − 0.40, p < 0.05) and the PCr/Pi ratio in the resting thigh muscle (r = − 0.41, p < 0.05).
Conclusion: The present study implies a link between systemic inflammation, excessive MFI and a loss of bioenergetics in subjects with stable COPD.
Keywords: adiposity, body composition, muscle fat infiltration, magnetic resonance imaging, 31P-MRS, biomarkers
Introduction
Patients with chronic obstructive pulmonary disease (COPD) demonstrate a persistent and progressive airflow limitation.1 COPD is characterised by a chronic inflammation in the airways.1 Loss of muscle mass and deterioration of muscle composition, leading to muscle dysfunction, are common features of COPD.2 Indeed, the thigh muscle mass in COPD is a better prognosis tool for mortality than body mass index (BMI),3,4 and sarcopenia is associated with increased mortality.4,5 Very recently, it was also shown that increased skeletal muscle adiposity in patients with COPD is associated with a higher risk of mortality and increased cardio metabolic risk.6,7 Thus, to combat mortality in COPD, it becomes important to understand the factors behind muscle mass loss and skeletal muscle adiposity. Muscle fat infiltration (MFI) is the definition of skeletal myosteatosis used in the present report.8,9
Sarcopenia is a muscle disease rooted in adverse muscle changes defined by low levels of muscle strength and muscle quantity and quality.2 Multiple factors have been proposed to mediate loss of thigh muscle mass in COPD, such as tobacco smoking, genetics, hypoxia, hypercapnia and acidosis, nutritional abnormalities (including vitamin D deficiency), systemic corticosteroids, exacerbations, systemic inflammation, co-morbidities, reduced physical activity, and aging.2,10 Loss of normal skeletal muscle composition in COPD includes a shift towards a less aerobic phenotype with reduction of type I fibre proportions, mitochondrial function, capillarity, and oxidative enzymes.2,11 Loss of normal muscle composition is more pronounced, when COPD is more severe.2,12 Collectively, loss of muscle mass and normal muscle composition lead to muscle dysfunction, ie, a loss of strength and endurance.2
A combined definition of adverse muscle composition (AMC) was recently suggested as the definition of sarcopenia.4,13,14 AMC is based on the combination of thigh fat-tissue free muscle volume, expressed as the deviation from the expected muscle volume of a matched virtual control group (FFMVvcg), and the MFI adjusted for sex differences (MFIa).4,13,14 Importantly, AMC enabled an objective and improved definition of sarcopenia, which was unaffected by body habitus in a general population.4,13,14 Thus, AMC, assessed with neck-to-knee magnetic resonance imaging (MRI) in up to 40,000 UK Biobank participants, showed a stronger link to physical function, activities of daily living, hospitalization and all-cause mortality, when both aspects of muscle composition, ie, FFMVvcg and MFIa, were considered, compared to only using either MFIa or FFMVvcg.4,13,14 AMC is the definition of altered skeletal muscle composition used in the present report.15
In recent years, MFI in subjects with COPD has attracted increased attention. As COPD becomes more severe, MFI excess becomes more pronounced.16,17 In COPD, MFI excess is associated with loss of muscle mass, impaired muscle functioning, and reduced physical activity.18–21 MFI excess in COPD is also associated with a muscle fibre shift,19 and an ensuing impairment of oxidative muscle metabolism.22 Oxidative muscle metabolism depends on the delivery of oxygen to mitochondria and on mitochondrial function for re-phosphorylation of adenosine diphosphate (ADP) to form adenosine triphosphate (ATP).23 Muscle bioenergetics, created in this process, can be expressed as the ratio between the phosphocreatine and the inorganic phosphates (PCr/Pi), employing 31phosphorus magnetic resonance spectroscopy (31P-MRS).23 Studies using this technique have shown that an anaerobic muscle energy metabolism during exercise is characteristic for COPD subjects.22,24–26
Common features among patients with more advanced COPD are systemic inflammation, loss of muscle mass and normal muscle composition, leading to muscle dysfunction.2,7 Most of the biomarkers [eg, white blood cell count (WBC), high sensitivity C-reactive protein (hs-CRP), interleukin-6 (IL-6) and fibrinogen] present in the circulation, represent, when elevated, an ongoing systemic inflammation, that partly originates from the inflamed airways.7 Due to a leakage of pro-inflammatory cytokines and reactive oxygen species (ROS) from the inflamed airways, peripheral blood leukocytes are activated, which in turn release more cytokines and ROS.7 Deposits of ectopic fat, such as the visceral adipose tissue (VAT)27 and the MFI,28 act as additional sources of pro-inflammatory cytokines, which may maintain the systemic inflammation. Systemic inflammation is known to trigger muscle mass loss and muscle dysfunction in COPD through cytokines and ROS.7,29–31 However, the relationships between systemic inflammation, MFI and bioenergetics in COPD remain to be investigated.
In the present study, the primary aim was to identify the relationship between MFI and bioenergetics in patients with COPD, who all demonstrated a varying degree of AMC, and, secondly, to assess how clinical features of COPD relate to these variables. We were particularly interested in the role that systemic inflammation may play on MFI and bioenergetics. Therefore, we analysed several biomarkers in the plasma, which all are available to us in the ordinary care of patients with COPD. We hypothesised that markers of systemic inflammation would relate differently to thigh muscle composition and bioenergetics.
Materials and Methods
Study Subjects
The present study is a cross-sectional study of patients in a stable phase of COPD. Nearly all patients were recruited at the Department of Respiratory Medicine at the University Hospital in Linköping, Sweden (one was recruited at the Ryhov Hospital in Jönköping, Sweden). The study was approved by the Ethical Committee of Linköping University (dnr: 2015/2-31; 2016/91-31, H.L. Persson) according to the guidelines of the Declaration of Helsinki. Following written consent, 39 Caucasian subjects with COPD were included of which 32 subjects were investigated with MRI. Statistical analyses were based on these 32 subjects. Reasons for not performing MRI and 31P-MRS on 7 subjects were claustrophobia, not previously known, in 2 cases, technical problems with the 31P-coil or analysis problems due to implants in 3 cases and late subject refusal in 2 cases.
The inclusion criteria were smokers or ex-smokers with at least 10 pack-years, age >50 years, confirmed COPD diagnosis (defined as FEV1/FVC <0.7 after bronchodilator inhalation and symptoms present typical for COPD), and FEV1% of predicted after bronchodilation <100%. Exclusion criteria were mental inability, unwillingness or language difficulties that would cause difficulties in participating in the study, recent COPD exacerbation or infection (treated with antibiotics and/or oral cortisone) two weeks before the intended inclusion date. Contraindications to MRI were metal fragments in the body, metal implants, claustrophobia, or inability to perform MRI during time required by the study protocol (approximately 1 h).
Study Procedure
Total study duration was a maximum of 4 weeks (which was the maximum time between study visit one for inclusion and study visit two). Participants were scheduled for an appointment at the outpatient department. When the patient had signed an informed consent, the research person was included in the study and received a study ID. Study participation did not entail any change of ongoing medication. A case record form (CRF) was established, and an initial review of inclusion and exclusion criteria was performed. A special MR questionnaire was performed to identify contraindications to conduct MRI. The signed questionnaire was submitted to the MRI unit. A final review of inclusion and exclusion criteria was performed by the investigator. If all inclusion criteria were fulfilled and exclusion criteria were missing, the subject was included. Those who could not participate in the study were registered as “screening failures”.
Personal data was collected including information on age, sex, and smoking status. History of disease, current COPD- and non-COPD-related symptoms (from all organ systems including the musculoskeletal system) and medication were documented. Physical examination was followed by registration of vital parameters and body measurements. The assessments, at visit one, were performed in a standardised order; spirometry, maximum inspiratory pressure (MIP), nasal inspiratory pressure (SNIP), collection of blood samples and questionnaires. Within four weeks, visit two was performed. Initial sampling for arterial blood gases was performed and thereafter investigation with MRI and 31P-MRS.
Matched Controls
By leveraging MR-based body composition data from the UK Biobank resource (project ID 6569) ten matched controls for each subject were selected with same sex, age, and BMI as well as an FEV1/FVC ≥70%. These matched Caucasian controls were all unique, that is, no subject could share matched controls. The selection method has been described previously.13 This procedure allowed us to have a normative virtual control group (VCG). Data utilized in this study are from the UK Biobank and are publicly available through the UK Biobank resource (Category 149, abdominal composition). Body composition measurements were comparable across different MR-platforms.32
Assessment of Clinical Features of COPD
Blood Analyses and Dynamic Spirometry
Venous blood was analysed for markers of systemic inflammation (WBC, hs-CRP, IL-6, and fibrinogen). Arterial blood gases were analysed on air breathing at rest. Hypoxemia due to respiratory failure was defined as PaO2 <8.0 kPa. Vitamin D status was assessed using the stable metabolite 25(OH)D in serum. Deficiency, defined as serum-25(OH)D <50 nmol/L, is associated with insufficient outdoor activities and dietary intake, and reflects COPD severity as previously shown.33
To measure FEV1 and FVC and to calculate the ratio of these volumes, dynamic spirometry was performed before and after bronchodilatation (spirometry was repeated ≥15 min after inhalation of salbutamol 0.6 mg) using Hedenström as a reference.34,35 COPD was staged by airway obstruction, that is, FEV1% predicted 80–100%=GOLD stage I, 50–79%=stage II, 30–49%=stage III, and <30%=stage IV.1 COPD was also defined as group A, B, C and D by COPD-related symptoms (CAT and mMRC; see next section for details) and episodes of worsening, ie, annual number of exacerbations.1 Groups C and D are characterized by frequent exacerbations, defined as either one severe exacerbation, demanding hospitalisation, or at least 2 moderate exacerbations per year.
Questionnaires to Assess COPD Symptoms, Physical Activity, and Co-Morbidities
The modified British Medical Research Council (mMRC), a 5-graded questionnaire (0–4), was used for the assessment of dyspnoea,1 while COPD symptoms were scored with the 8-item unidimensional COPD Assessment Test (CAT; 0–40).1 MRC 0–1 and CAT <10 defines subjects with COPD and low symptom burden, thus, COPD groups A and C.1
Weekly physical activity and daytime inactivity were measured by “International Physical Activity Questionnaire – Short” (IPAQ‐S).36 IPAQ‐S consists of four items. It identifies the frequency and time (in minutes) engaged in walking and moderate and intense physical activity during the previous 7 days. Only activity sessions lasting 10 minutes or more were counted, but all types of physical activity were included.
Comorbidities were graded using the “Charlson Comorbidity Index” (CCI).37
Inspiratory Breathing Muscle Strength and Respiratory Rate
For assessment of the strength of the inspiratory breathing muscles, we measured MIP and SNIP after bronchodilatation (inhalation with 0.6 mg salbutamol). Both were measured as cm H2O. The best value of 5 measurements was recorded. Respiratory rate at rest was also recorded.
Assessment of Body Composition
Body Mass Index
BMI was calculated (weight in kg divided by the height in m2). Underweight was defined as BMI <18.5 kg/m2, normal weight as 18.5 ≤ BMI < 25 kg/m2, overweight as 25 ≤ BMI < 30 kg/m2 and obesity as BMI ≥30 kg/m2.38
Body Composition Profiling Using MRI
Body composition was analysed using MRI. The participants were scanned in a Philips Ingenia 3 T MRI scanner (Philips Healthcare, the Netherlands) using a 6-minute dual-echo Dixon protocol, providing water and fat separated volumetric data covering a region from the neck to the knees. Body composition profiling39 was performed using AMRA® Researcher (AMRA Medical AB, Linköping, Sweden). The analysis consisted of the following steps: 1) automatic image calibration, 2) automatic labelling and registration of fat and muscle regions to the acquired image volumes, 3) quality control of anatomical regions and MR-data performed by trained analysis engineers at AMRA Medical, and 4) quantification of fat and muscle volumes based on the calibrated images.40–43 The measurements included the volumes of VAT, “abdominal subcutaneous adipose tissue” (ASAT), and the sum of these, that is, the “total abdominal adipose tissue” (TAAT). The volumetric adipose tissue measurements were normalised for height (ASATi, VATi and TAATi) and expressed as L/m2. The “total thigh fat-free muscle volume” (FFMV) and mean anterior thigh MFI were also measured, and the assessments of those measurements are described in the following sections.
Assessment of Thigh Muscle Composition and Bioenergetics
Thigh Muscle Composition Profiling Using MRI
FFMV was normalised for height (FFMVi; L/m2). For each subject, a matched VCG was created to calculate a personalised muscle volume z-score based on the FFMV (FFMVvcg). This muscle volume z-score measures how many standard deviations each subject deviate from the mean muscle volume of their matched group, which presents the same sex and similar body size. AMC was defined by low muscle volume coupled with high muscle fat. Low muscle volume was defined as the <25th percentile of a reference population (FFMVvcg <-0.68, both sexes) and high muscle fat as >75th percentile of a reference population (MFI >8.82 and 7.69%, females and males, respectively). Normal muscle composition was defined as those who had high FFMVvcg and low MFI as described previously.12,13 To remove the known sex association with MFI, the MFI was adjusted by removing the sex-specific median MFI and expressed in % (denoted MFIa).12,13 In the present study, thigh muscle myosteatosis was assessed as the MFI. The technique used to assess MFI is sensitive to all types of fat in the muscle tissue; triglycerides in adipocytes (extramyocellular lipids; EMCLs) and triglyceride droplets inside myocytes (intramyocellular lipids; IMCLs) are included as well as triglycerides in adipocytes present inside the muscle fascia. Note that macroscopic fat replacement and intermuscular adipose tissue are excluded from the MFI measurement. Body- and thigh muscle variables are summarised and explained in Table 1.
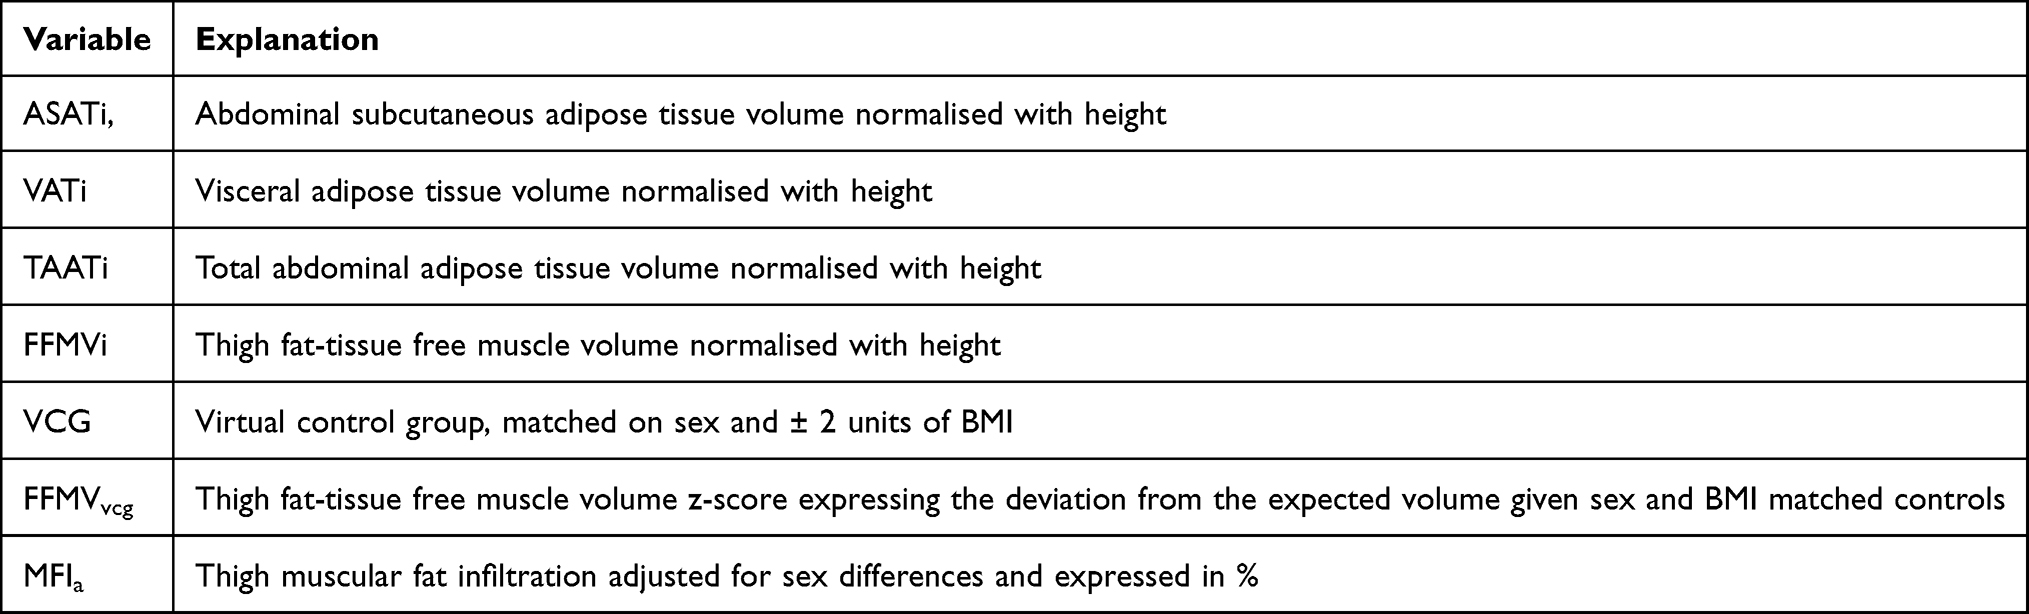 |
Table 1 A Summary of Body- and Thigh Muscle Variables Used in the Study |
31P-MRS to Assess the Energy Metabolism of the Resting Thigh Muscle
Muscle energy metabolism was assessed in the resting thigh muscle using 31P-MRS. 31P-MRS was acquired, using the same MR-scanner as the body composition, and as described above. A 31P transmit-receive surface coil with a diameter of 14 cm (Philips Healthcare, the Netherlands) was used for the spectroscopic data acquisition. Spectra were acquired using a 42° block pulse for the spin excitation, 15s repetition time (TR), 153.4 µs echo time (TE), 3 kHz bandwidth, 2048 datapoints, 16 averages, 2 dummy scans. Attached to the 31P coil was a cylindrical (r = 50 mm, h = 80 mm) external reference filled with dimethyl methylphosphonate (DMMP) c. 85.00 mM.44
For post-processing of the 31P-MRS data, jMRUI43 was used with the AMARES algorithm in combination with prior knowledge46,47 for relative quantification of the resonances. The PCr resonance was used as a chemical-shift reference (assigned to −2.35 ppm, based on the chemical shift reference standard 85% H3PO4) with other assignments obtained from literature, as previously described,45 and as illustrated in Figure 1. The main resonances, used in this study, were Pi and PCr, which were both defined as singlets, calculated as concentrations, and then expressed as the ratio of PCr to Pi. Additionally, the spectral processing model included, phosphomonoesters (PME) was assigned to the combined pools of phosphoethanolamine (PE) and phosphocholine (PC); the phosphodiester (PDE) resonance was assigned to the combined pools of glycerophosphoethanolamine (GPE) and glycerophosphocholine (GPC); a resonance corresponding to nicotinamide adenine dinucleotide [NAD(H)] was also observed; the Mg2+ complexed nucleotide triphosphate (NTP-Mg, mainly ATP) resonances were assigned and interpreted as α-, β-, and γ-NTP as previously reported.44
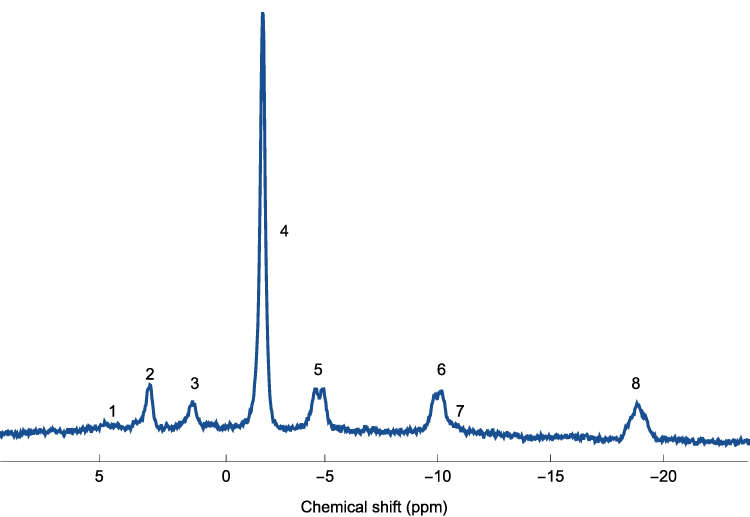 |
Figure 1 A representative example of a 31P-MRS for a subject in the cohort. Abbreviations: ATP, adenosine triphosphate; NAD(H), nicotinamide adenine dinucleotide; PCr, phosphocreatine; Pi, inorganic phosphate; 31P-MRS, 31phosphorus magnetic resonance spectroscopy. Notes: The resonances in the spectrum correspond to; (1) Phosphomonoesters, (2) Pi, (3) Phosphodiesters, (4) PCr, (5,6,8) α-, β-, and γ-nucleotide triphosphate (mainly ATP), (7) NAD(H). |
Patient and Public Involvement
Patients and the public were not involved in the design or conduct or reporting of the present research. Results were not disseminated to study participants.
Statistical Analysis
Data are presented as means ± 1 S.D. for continuous variables and percentage for categorical variables. Correlations were calculated with Pearson’s correlation coefficient (r) when variables fulfilled the normality criterium; otherwise, Spearman’s Rank Test (ρ) was used. The level of significance was 0.05, and all p-values were two-tailed. All analyses were undertaken using IBM SPSS Statistics, vs 27.0.0.0 (IBM SPSS, Chicago, IL, USA) or Mathematica, vs 12.0.0.0 (Wolfram Research Inc, Champaign, IL, USA).
Results
Body- and Thigh Muscle Composition Profiling
Body and thigh muscle composition data for the subjects with COPD, compared to matched controls from the “UK Biobank resource” (VCG), is presented in Table 2 and Figure 2. Compared to the VCG, the COPD group exhibited significantly greater VAT and MFI, while FFMV was significantly less. Subjects with COPD were presented with significantly higher prevalence of AMC (68%) than the VCG did (15%). In the COPD group, none had normal muscle composition, that is, the combination of high FFMVvcg and low MFIa, compared to 48% in the matched controls (Table 2).
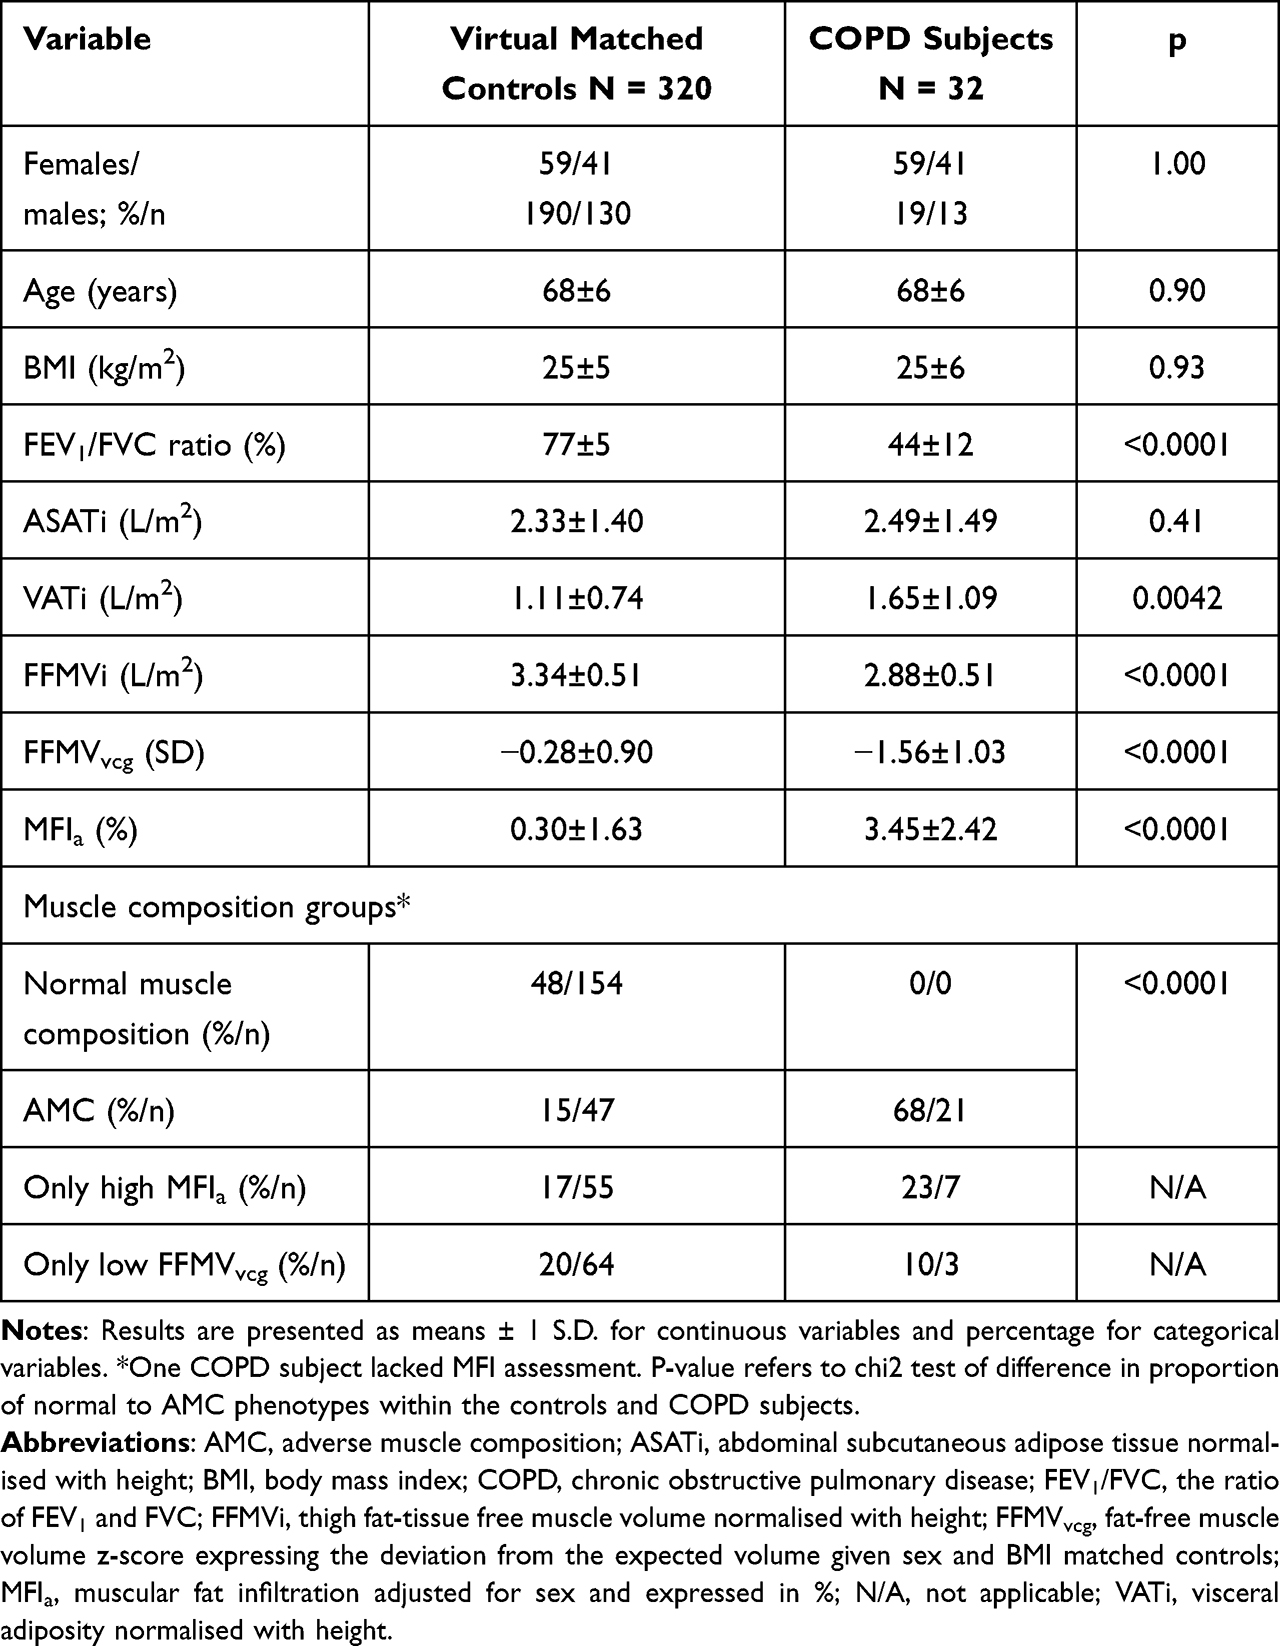 |
Table 2 Body Composition Data Using Sex and BMI Matched Controls without COPD from UK Biobank Data as Reference |
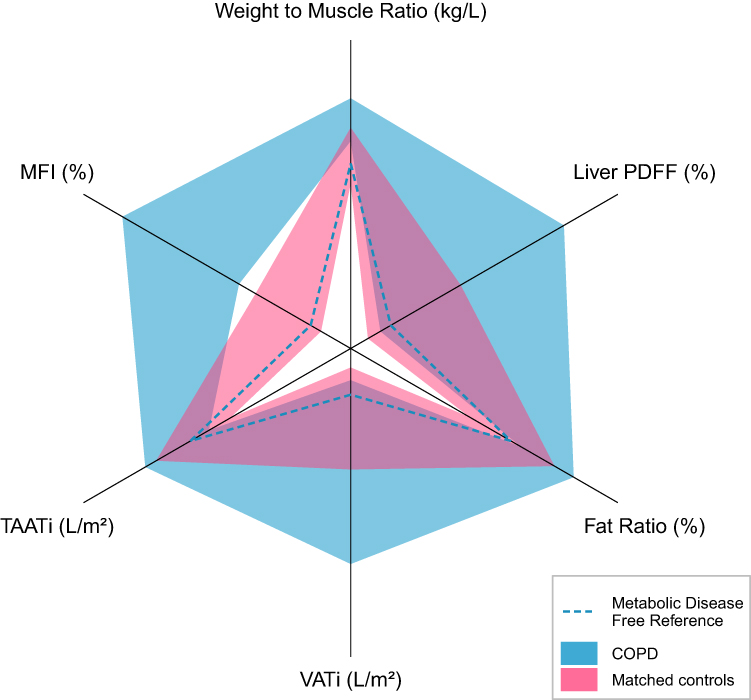 |
Figure 2 The body composition plot is shown for the two groups. Abbreviations: COPD, chronic obstructive pulmonary disease; MFI, muscular fat infiltration expressed in %; PDFF, Proton Density Fat Fraction; TAATi, total abdominal adipose tissue normalised with height; VATi, visceral adiposity normalised with height. Notes: The coloured areas correspond to the 25th to 75th percentiles of the two groups. In addition, for reference, a metabolic disease-free body composition is presented as a dashed blue line. |
Figure 2 shows the body composition plot for the two groups in relation to a metabolic disease-free reference.39 Figure 3 is a plot of the muscle composition of the patients with COPD, which is based on the FFMVvcg and the MFIa, thus, defining AMC of subjects with COPD and different GOLD stages (I–IV).4,13,15
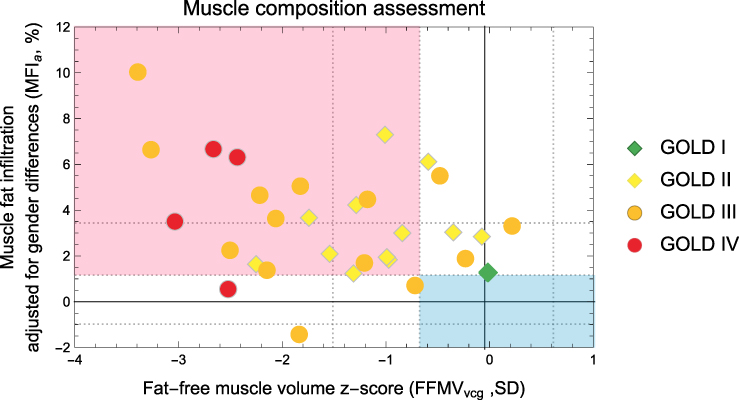 |
Figure 3 Muscle composition assessment of the COPD subjects by GOLD stage. Abbreviations: FEV1(% of predicted), forced expiratory volume in one second expressed as % of predicted; FFMVvcg, thigh fat-free muscle volume z-score based on a sex and BMI matched virtual control group; GOLD, global initiative for chronic obstructive lung disease; MFIa, muscular fat infiltration adjusted for sex and expressed in %. Notes: The red area defines adverse muscle composition (high MFIa and low FFMVvcg) and the blue area defines normal muscle composition (low MFIa and high FFMVvcg). Reference lines from the UKBB resource indicate population median (solid lines) as well as 95th, 75th, 25th, and 5th percentiles (dashed lines). The GOLD stage of each subject is indicated. For subjects presenting with GOLD stage I, II, III and IV the FEV1(% of predicted) is ≥80%, 50–79%, 30–49% and 0–29%, respectively. |
Clinical Features of the Subjects with COPD
The clinical features of the included subjects with COPD are summarised in Table 3. Most subjects presented with advanced stage of airway obstruction, 59% was stage III or IV, and most subjects were frequent exacerbators; thus, 62% belonged to group C or D.
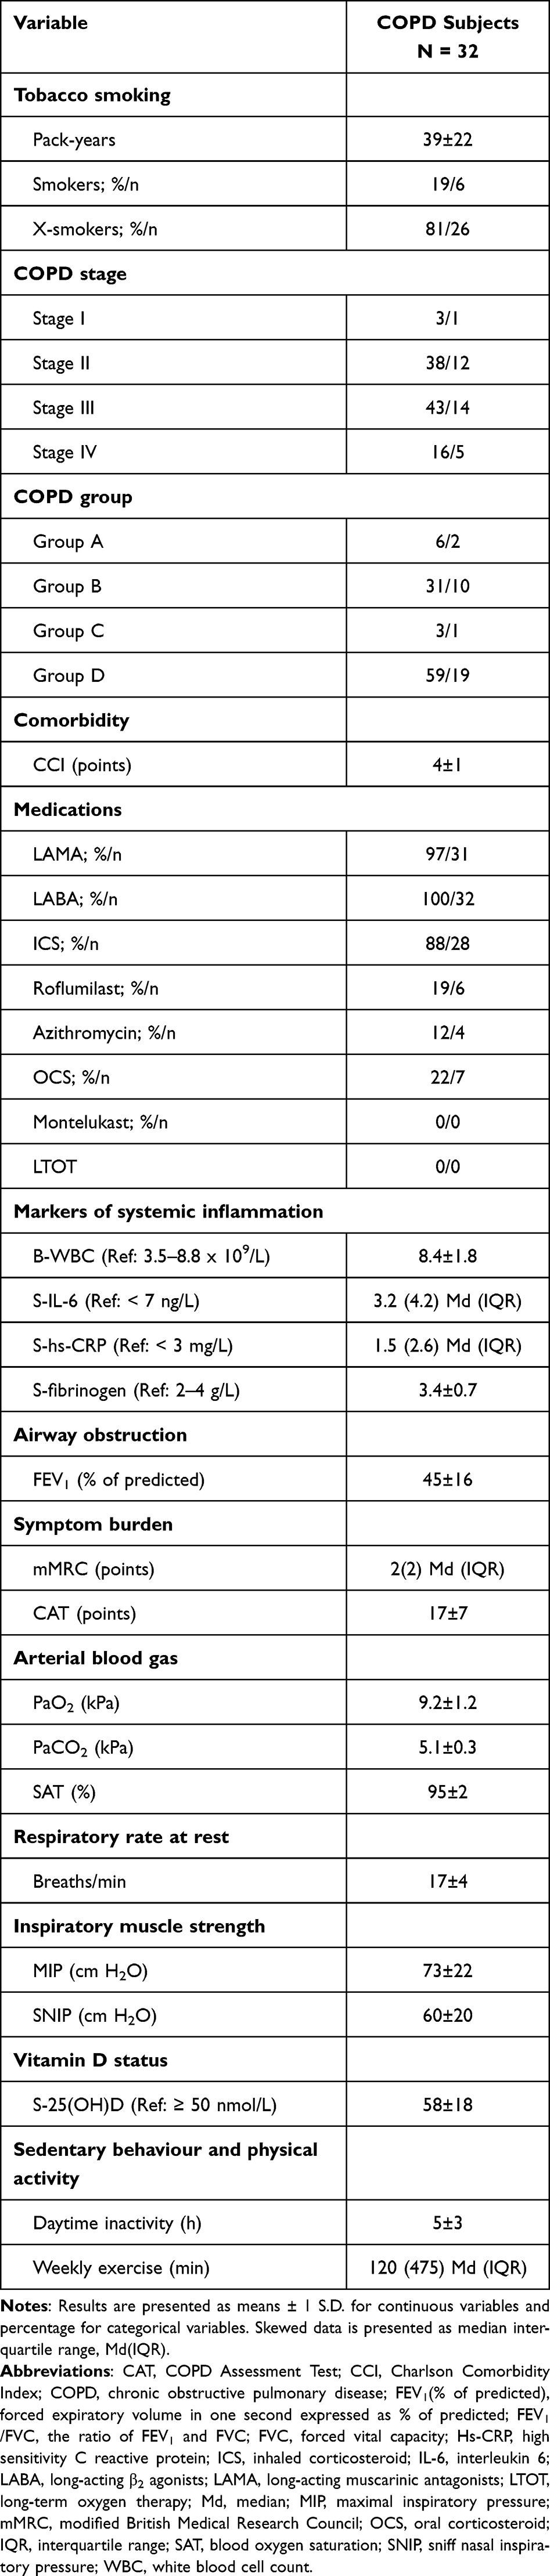 |
Table 3 Clinical Features of the COPD Subjects |
Most subjects, 88%, were on triple inhalation therapy, ie, a combination of LAMA and LABA and ICS. Systemic therapy for COPD included oral corticosteroids (OCS; 22%), roflumilast (19%), and azithromycin (12%). None of the subjects medicated with Montelukast, an anti-inflammatory drug used for asthmatics. None of the subjects required “long-term oxygen therapy” (LTOT) in their homes.
Most subjects demonstrated inflammatory markers within references: WBC 66%, IL-6 75%, hs-CRP 72% and fibrinogen 81%. None of the subjects presenting with a single raise of WBC were on OCS. Ninety % of the subjects demonstrated a significant burden of COPD-related symptoms as assessed by mMRC and CAT.
Clinical COPD Features in Relation to Muscle Bioenergetics
Table 4 shows the clinical features of COPD that demonstrated significant relationships to bioenergetics, that is the PCr/Pi ratio. Notably, features associated with bioenergetics showed no association with MFIa. As COPD becomes more severe – collectively demonstrated by hypoxemia (decreased PaO2), an increase of airway obstruction [decreased FEV1 (% predicted) and decreased FEV1/FVC], increased symptom burden (raised CAT points), and increased respiratory rate at rest – the PCr/Pi ratio rises.
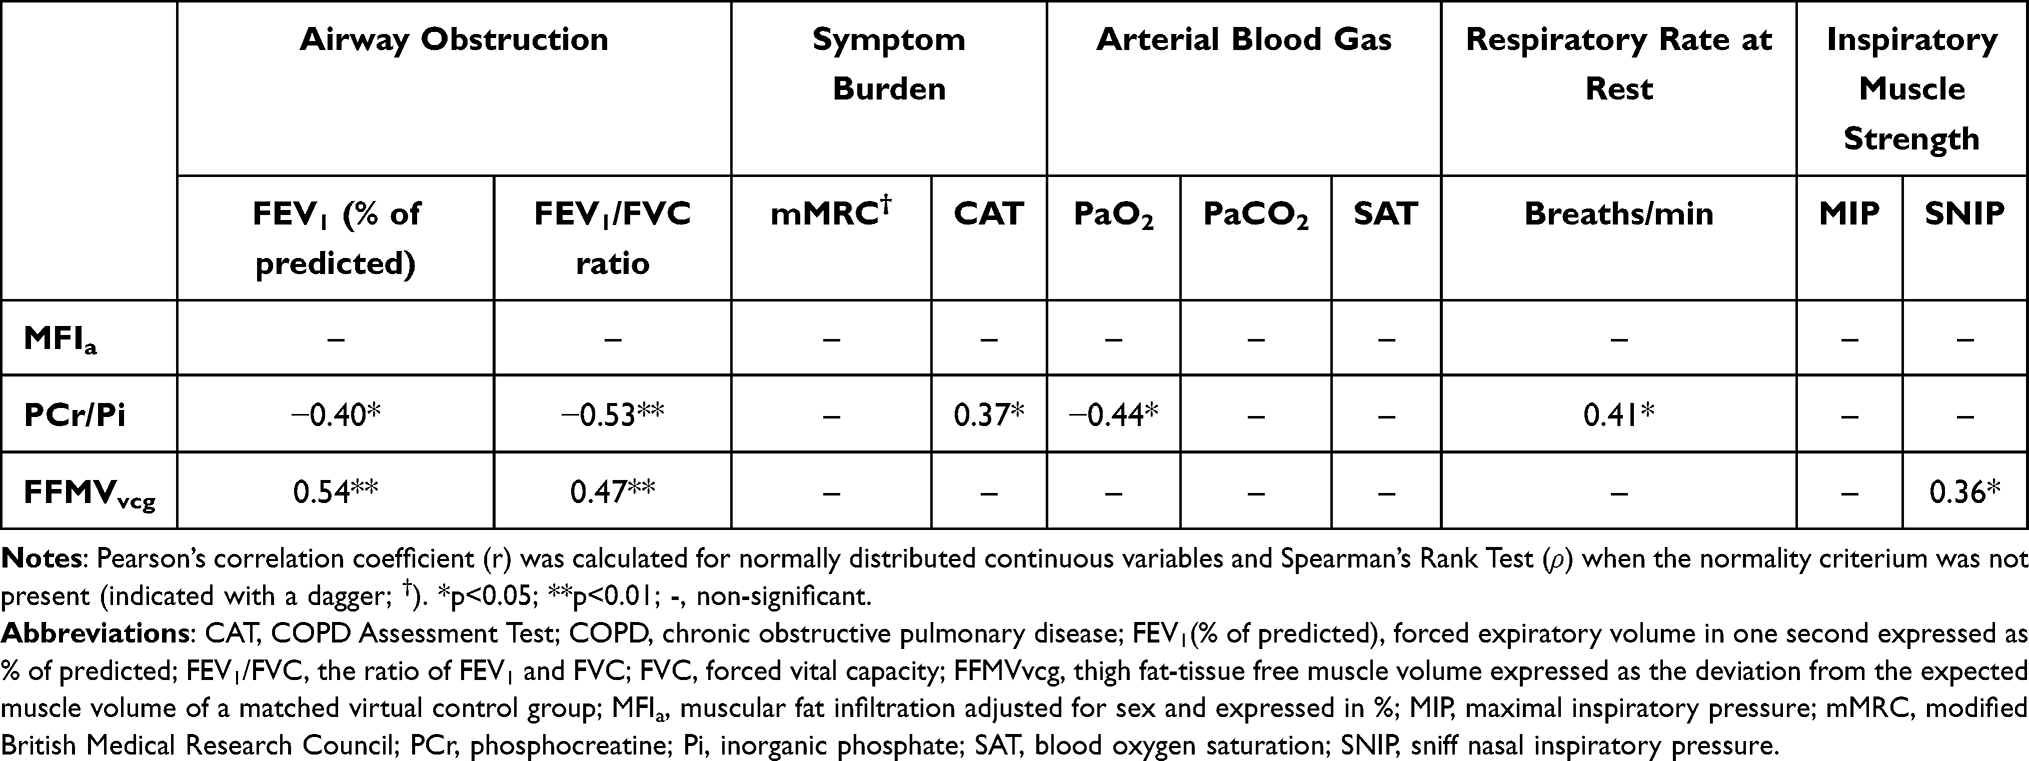 |
Table 4 Significant Correlations of Clinical COPD Features and Thigh Muscle Variables |
Less advanced airway obstruction, demonstrated by an increase of FEV1 (% predicted) and FEV1/FVC-ratio, and strong inspiratory muscles, reflected by increased SNIP, were both associated with increased FFMVvcg (Table 4).
Clinical COPD Features in Relation to MFI
Table 5 demonstrates the clinical features of COPD that significantly correlated with MFIa. Features associated with MFIa did not correlate significantly with bioenergetics (the PCr/Pi ratio). Systemic inflammation, represented by an elevation of WBC and fibrinogen in plasma, and reduced weekly physical activity were both associated with an increase of MFIa.
 |
Table 5 Significant Correlations of Markers of Systemic Inflammation, Weekly Physical Activity, and Body- and Thigh Muscle Variables |
Most markers of systemic inflammation correlated positively to deposits of body fat. WBC correlated negatively with FFMVvcg (Table 5).
MFI in Relation to Muscle Bioenergetics and Visceral Fat
Increased MFIa was associated with decreased PCr/Pi ratio (r = −0.41, p = 0.028; Figure 4A) and increased VAT (r = 0.43, p = 0.015; Figure 4B).
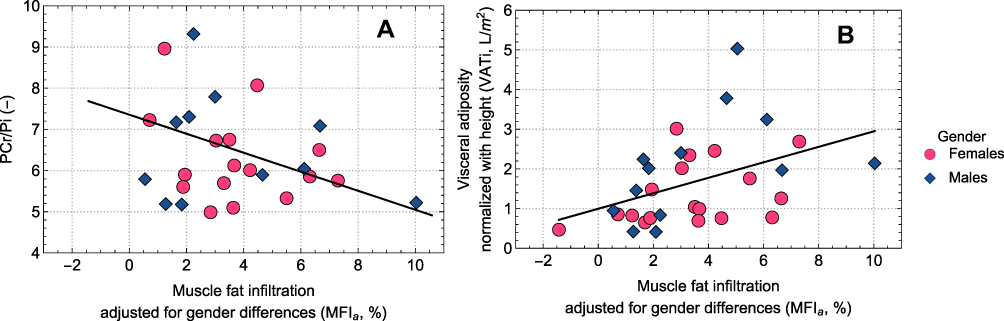 |
Figure 4 Correlations of MFIa and (A) thigh muscle bioenergetics, expressed as the PCr/Pi ratio, and (B) VATi (L/m2). Abbreviations: MFIa, muscular fat infiltration adjusted for sex and expressed in %; PCr, phosphocreatine; Pi, inorganic phosphate; VATi, visceral adiposity normalised with height. |
Discussion
In the present study, we report our findings from investigations on subjects with COPD, who all presented with abnormally composed thigh muscles (Table 2). For the first time, it was possible to assess the relationship between MFI and content of bioenergetics of the resting thigh muscle, and the relationships of these two to clinical COPD features associated with abnormally composed thigh muscles (Table 3).2,7 The major novel findings of the present study were the observations that (i) a raised PCr/Pi ratio correlated to features of more advanced COPD (Table 4), (ii) increased MFIa was associated with biomarkers of ongoing systemic inflammation (WBC and fibrinogen; Table 5), and (iii) increased MFIa related significantly to a loss of bioenergetics (low PCr/Pi ratio) in the resting thigh muscle (Figure 4A). These relationships may indeed represent a central role in mechanistic events that involve systemic inflammation, and they result in the observed thigh muscle abnormality in COPD.7,19–21,29–31
In the present study, the COPD group displayed 18% less FFMVvcg than the VCG group did (Table 2). Muscle strength and endurance depend strongly on both muscle mass and muscle composition, which may be lost because of muscle fibre atrophy, replacement of muscle fibres by fat tissue, and a switch of muscle fibre types.2 Type I fibres express myosin heavy chain (MyHC) type I, which are slow-twitch fibres, which have a predominantly oxidative metabolism; they are also more fatigue resistant than type II fibers.2 Type II fibres express MyHC type II; they are fast-twitch fibres and depend more on anaerobic metabolism, thus they are more fatigable.2 COPD is a condition known to promote an excess of anaerobic type II fibres.12 In addition, reduction in capillary density and capillary muscle fibre contacts with reduced aerobic enzyme activity leads to a greater dependence on glycolysis in subjects with COPD and an early lactate accumulation during exercise, the latter limits muscle activity to a great extent.2,11
Not only COPD but also a sedentary lifestyle is known to promote an excess of type II fibres.48 In a previous study, 7 males with a sedentary lifestyle demonstrated a higher PCr/Pi ratio at rest than 7 endurance-trained males did.48 As already said, as COPD becomes more severe, the thigh muscle becomes more dependent on glycolysis.11 Thus, the fuel preference within the skeletal muscle of COPD patients is glycolysis, on the expense of fat oxidation.18,49 When this is compensated for, a rise of the PCr/Pi ratio at rest will follow. As expected, clinical features of increased COPD severity (hypoxemia, an increase of airway obstruction, COPD symptom burden, and respiratory rate at rest) were all associated with an increased PCr/Pi ratio (Table 4). The exact mechanisms for the increase of MFI in subjects with COPD remain largely unknown. Possibly, a reduced oxidative capacity and a predominance of glycolytic metabolism might compromise the ability to utilise intramuscular tricylglycerols, and thereby cause a concomitant increase of MFI.18,49
In the present study, we did not find any significant correlation between the markers of systemic inflammation used and bioenergetics in the thigh muscle (Table 5). However, we observed significant correlations between WBC and fibrinogen, and an increase of MFIa (Table 5). A previous study demonstrated an association between abnormal bioenergetics in the thigh muscle during exercise-induced anaerobic metabolism and excessive MFI.22 In agreement with this,22 we found that an excess of MFI also correlated significantly to alterations of bioenergetics, which in the present study was expressed as a reduction of the PCr/Pi ratio in the thigh muscle (Figure 4A). This observation may simply be explained by a loss of muscle mass, as less viable bioenergetics would be the result in a muscle in which muscle mass are replaced by fat. The conclusion may be that the adverse effect of excessive MFI on bioenergetics is mediated by additional factors, possibly involving systemic inflammation.
Deposits of body fat, such as VAT and MFI, are important additional sources of a systemic inflammation.27,28 Like previous observations, we found an excess of VATi21,27 and MFIa16–22 in the COPD subjects compared to the VCG (as is described in Table 2) and a relationship between VATi and MFIa (Figure 4B).16,21 In line with earlier observations showing elevated concentrations of inflammatory biomarkers in subjects with COPD and presenting with visceral obesity,27 VAT excess was in the present study associated with elevated concentrations of IL-6 and hs-CRP (Table 5). Moreover, the present study is the first report of a relationship between increased MFIa and markers of systemic inflammation in subjects with COPD (Table 5). Whether or not thigh muscle abnormalities in subjects with COPD also include local inflammation in the muscle is still a matter of debate.7 One report suggests that increased MFI triggers IL-expression in skeletal muscles, but this finding applies to older and physically inactive subjects and has not yet been found to be relevant for subjects with COPD.28
The reported numbers for sarcopenia in the general population vary widely from 4.4% to 27.5%.50 In the present study, 15% of the VCGs displayed sarcopenia according to the definition applied. The figures vary widely depending upon the particular definition used for sarcopenia and the cohort investigated. The reported prevalence ranges from 8% in community-based populations to 63% in nursing-home populations.51 The prevalence of sarcopenia among patients with COPD is known to be higher than the general population.51,52 In the present study, we used a two-dimensional definition of sarcopenia based on FFMVvcg and MFIa. This is based on the results from a recent study on 10,000 subjects from the general population, which showed that body size correction of muscle mass, as proposed by the “European Working Group on Sarcopenia in Older People” (EWGSOP),53 is ineffective and likely to a large extent underdiagnoses sarcopenia in both overweight and obese subjects.13
The COPD cohort investigated in the present study represents severely diseased patients, destined for secondary care at Respiratory Clinics. The rehabilitation therapy of such patients includes the objective to improve muscle functioning by physical training supervised by a physiotherapist. Consequently, most of the study subjects were frequent exacerbators (group C/D status, 62%), presented signs of a sedentary lifestyle (day-time physical inactivity 59%) or displayed elevation of one or more markers of systemic inflammation (43%). Thus, it is not a surprise that the COPD cohort displayed abnormally composed thigh muscles (Table 2) and many subjects demonstrated signs of systemic inflammation as well (Table 3).
In the present study, 68% of the subjects with COPD was classified as having sarcopenia according to the definition applied (Table 2). The prevalence of sarcopenia is known to increase in parallel to increased airway obstruction52 and frequent exacerbations.54 In the elderly and patients with COPD, physical inactivity is a key factor in the development of sarcopenia and a predictor of mortality and disability.55 As physical inactivity results in further deterioration of muscle function, it can consequently be considered both a cause and a consequence of sarcopenia.56 In the present study, reduced physical activity, assessed by a questionnaire only (IPAQ-S), was the only clinical feature of COPD, except markers of systemic inflammation, that correlated significantly with increased MFIa (Table 5). Likewise, increased airway obstruction, possibly hampering physical activity by dyspnoea on exertion, correlated with decreased FFMVvcg (Table 4). Hypoxemia, independent of age and particularly in combination with inactivity, is known to aggravate muscle wasting.57 In contrast, the present study did not show any correlation between PaO2 and FFMVvcg and/or MIFa (Table 4), probably because 88% of the subjects did not display hypoxemia.
In earlier reports, systemic inflammation is described as a cause behind sarcopenia in patients with COPD.10,31 In the present study, elevated markers of systemic inflammation were associated with both variables of sarcopenia; thus, a decrease of FFMVvcg was related to WBC, and an increase of MFIa was related to both WBC and fibrinogen (Table 5). Ongoing anti-inflammatory treatment with OCS is known to raise the level of WBC by recruiting neutrophilic leucocytes from the bone marrow. However, none of the subjects on OCS (n = 7; 22%) demonstrated a rise of WBC above reference. The possible influence of episodic OCS therapy (steroid medication during exacerbations only) on systemic inflammation and body- and thigh muscle composition was not analysed in the present study. Proximal myopathy is a well-known consequence of OCS in COPD,58 and 4 subjects on OCS demonstrated sarcopenia according to the definition applied.
To what extent low-grade systemic inflammation contributes to muscle mass loss in stable COPD is still contradictory. The hypothesis that systemic inflammation contributes to skeletal muscle dysfunction in patients with COPD is supported by the fact that many pro-inflammatory cytokines can adversely influence skeletal muscle.10 Increased levels of tumour necrosis factor-α (TNF-α), CRP, IL-1 and IL-6 have been shown to stimulate muscle protein degradation, inhibit protein synthesis as well as myogenesis in preclinical models of COPD pathology.10 The exact origin of these circulating cytokines is unclear. It might include the overspill of systemic inflammation into the muscle, MFI acting as a source of inflammatory mediators or by activated inflammatory cells in the skeletal muscle itself.10,28 The exposure to ROS will trigger damage on myocytes, which in turn will start reparative mechanisms.59 Oxidatively damaged proteins are degraded by the ubiquitin proteasome system, and long-lived proteins and cell organelles are autophagocytosed by lysosomes.59,60 Thus, the lysosomes digest oxidatively damaged mitochondria for re-utilization of micronutrients,60 but this process will also sensitise cells to further oxidative damage by a lysosomal accumulation of redox-active elements.61 Consequently, muscle fatigue in COPD includes skeletal muscle myocytes that exhibit signs of an up-regulated autophagic activity.62
Oxidative damage on mitochondria and an increased mitochondrial breakdown by lysosomes,59,60 so called mitophagy, lead to a loss of mitochondrial function as well as mitochondrial bulk, loss of oxidative capacity, ultimately making the muscle less energy efficient.63 As already mentioned, the oxidative capacity of the muscles is further reduced by a proportional shift from oxidative type I to glycolytic type II muscle fibres, and a reduction of oxidative enzyme activity.2,11 Interestingly, sarcopenic COPD subjects exhibit a more pronounced loss of type I fibres than non-sarcopenic COPD patients do.64 Moreover, the remaining type II fibres are generally more sensitive to atrophy-related triggers.64 These observations imply a link between a loss of bioenergetics and muscle mass and a possible acceleration of muscle wasting by the loss of oxidative capacity.64 Notably, a reduced oxidative capacity of the skeletal muscles of COPD patients has been associated with reduced muscle endurance and increased muscle fatigue.2
Previous research reports on body- and thigh muscle composition and the association to metabolic syndrome and comorbidities.16,21,65 The mechanisms for ectopic fat accumulation in COPD have been associated with insulin resistance.65 Thus, the probability of having Diabetes Type 2 increases in parallel with VAT accumulation,16,21,66 while MFI excess increases the probability of cardiovascular comorbidities.16,21 In contrast, a population-based cohort found no difference in the metabolic phenotype, including VAT, between COPD and controls.67 These discrepancies between studies, whether COPD is a risk factor for metabolic abnormalities or not, are best explained by differences in COPD phenotype or disease severity of the study populations. Figure 2 summarises the metabolic profile of the COPD cohort studied and the VCGs in the present study. Thus, most of the subjects with COPD were far from the limit defining “Metabolic Disease-Free Reference” (Figure 2), which, together with a significant burden of co-morbidities, expressed as CCI-points (Table 3), clearly showed that the subjects studied were severely ill.
The present study has some limitations. Firstly, it is a single centre study and as such the investigated subjects were highly selected. The investigated cohort represents severely ill patients with COPD destined to specialist care carried out by a multidisciplinary pulmonary rehabilitation team. Although the Swedish subjects with COPD as well as the UK control subjects were all Caucasians, there may be influential environmental factors that differ between Sweden and the UK, which we were unable to match for. As pointed out, assessments of skeletal muscle function, either as thigh muscle strength or endurance, were not performed in the present study nor was assessment of physical capacity carried out. We assessed the strength of the inspiratory muscles, employing MIP and SNIP. Although a positive correlation was observed between SNIP and FFMVvcg in the present study (Table 4), SNIP cannot be used as a substitute for tests evaluating skeletal muscle performance. Moreover, we did not monitor episodic use of OCS.
Conclusion
The clinical features of COPD can be classified into two categories: 1) those that directly influence thigh muscle bioenergetics (hypoxemia and increase of airway obstruction, symptom burden, and respiratory rate at rest), and 2) those that influence MFIa, and, possibly through MFIa, indirectly thigh muscle bioenergetics (markers of systemic inflammation and physical inactivity). The present study shows for the first time that excessive MFIa is associated both with signs of systemic inflammation and a loss of thigh muscle bioenergetics. This implies a link between systemic inflammation and muscle fatigue, mediated by excessive MFIa and loss of bioenergetics.
Abbreviations
AMC, adverse muscle composition; ASATi, abdominal subcutaneous adipose tissue normalised with height; ATP, adenosine triphosphate; BMI, body mass index; CAT, COPD Assessment Test; CRF, case record form; CCI, Charlson Comorbidity Index; COPD, chronic obstructive pulmonary disease; EWGSOP, European Working Group on Sarcopenia in Older People; EMCLs, extramyocellular lipids; FEV1(% of predicted), forced expiratory volume in one second expressed as % of predicted; FEV1/FVC, the ratio of FEV1 and FVC; FVC, forced vital capacity; FFMVi, thigh fat-tissue free muscle volume normalised with height; FFMVvcg, thigh fat-tissue free muscle volume expressed as the deviation from the expected muscle volume of a matched virtual control group; GOLD, global initiative for chronic obstructive lung disease; Hs-CRP, high-sensitivity C reactive protein; IMCLs, intramyocellular lipids; ICS, inhaled corticosteroids; IQR, interquartile range; IL-6, interleukin 6; IPAQ‐S, International Physical Activity Questionnaire-Short; LABA, long-acting beta-2-agonists; LAMA, long-acting muscarinic antagonists; LTOT, long-term oxygen therapy; Md, median; MFIa, muscular fat infiltration adjusted for sex differences and expressed in %; MIP, maximal inspiratory pressure; mMRC, modified British Medical Research Council questionnaire; MRI, magnetic resonance imaging; MyHC, myosin heavy chain; MVZ, muscle volume z-score expressing the deviation from the expected volume given sex and BMI matched controls; N/A, not applicable; NAD(H), nicotinamide adenine dinucleotide; NTP, nucleotide triphosphate; OCS, oral corticosteroid; PCr, phosphocreatine; PDE, phosphodiesters; PDFF, Proton Density Fat Fraction; Pi, inorganic phosphate; 31P-MRS, 31phosphorus magnetic resonance spectroscopy; PME, phosphomonoesters; SAT, blood oxygen saturation; SNIP, sniff nasal inspiratory pressure; TAATi, total abdominal adipose tissue normalised with height; VATi, visceral adiposity normalised with height; VCG, virtual control group; WBC, white blood cell count; UK, United Kingdom.
Data Sharing Statement
The data upon which this analysis was based are available from Professor Hans Lennart Persson in anonymised form, upon receipt of a reasonable request. Data from the UK Biobank utilised in this study are publicly available through the UK Biobank resource (Category 149, abdominal composition).
Acknowledgments
The authors thank all the patients in this study for their committed participation in this research.
Author Contributions
All authors made a significant contribution to the work reported, whether that is in the conception, study design, execution, acquisition of data, analysis, and interpretation, or in all these areas; took part in drafting, revising or critically reviewing the article; gave final approval of the version to be published; have agreed on the journal to which the article has been submitted; and agree to be accountable for all aspects of the work. This study was performed at the Department of Respiratory Medicine at the University Hospital in Linköping, Sweden.
Funding
This work was supported by grants to H.L.P. from the County Council of Östergötland (Region Östergötland, ALF), Sweden (Grant No. LIO-275901, LIO-355741, LIO-432861, LIO-534761, LIO-601911 and LIO-697521), the Medical Research Council of Southeast Sweden (FORSS) (Grant No. FORSS-308331, FORSS-559931 and FORSS-751411), the Linköping University Hospital Foundation for Medical Research, Sweden (Grant No. LIO-475131), the Heart and Lung Foundation, Sweden (Grant No. 20140245 and 20140330), and the Swedish Society of Medicine (Grant no. SLS-368431) and to M.K. from the County Council of Jönköping (Futurum), Sweden (Grant No. FUTURUM-342821, FUTURUM-489691, FUTURUM-608651, FUTURUM-712082, FUTURUM-712181 and FUTURUM-868961). The study sponsors had no role in study design, data collection, analysis, and interpretation; in the writing of the manuscript; nor in the decision to submit the manuscript for publication.
Disclosure
HLP reports honoraria for advisory boards/lectures from AstraZeneca, Boehringer Ingelheim, GlaxoSmithCline, InterMune and Roche. ODL is a board-member, employee, and stockholder of AMRA Medical AB. ODL also has patents issued and pending to AMRA MEDICAL AB. MFF is an employee of AMRA Medical AB. PL is a stockholder of AMRA Medical AB.
References
1. Global initiative for chronic obstructive lung disease, 2021 report. Available from: https://goldcopd.org/wp-content/uploads/2020/11/GOLD-REPORT-2021-v1.1-25Nov20_WMV.pdf.
2. Maltais F, Decramer M, Casaburi R, et al. An official American Thoracic Society/European Respiratory Society statement: update on limb muscle dysfunction in chronic obstructive pulmonary disease. Am J Respir Crit Care Med. 2014;189(9):e15–62. doi:10.1164/rccm.201402-0373ST
3. Marquis K, Debigaré R, Lacasse Y, et al. Midthigh muscle cross-sectional area is a better predictor of mortality than body mass index in patients with chronic obstructive pulmonary disease. Am J Respir Crit Care Med. 2002;166(6):809–813. doi:10.1164/rccm.2107031
4. Linge J, Petersson M, Forsgren MF, et al. Adverse muscle composition predicts all-cause mortality in the UK Biobank imaging study. J Cachexia Sarcopenia Muscle. 2021;12(6):1513–1526. doi:10.1002/jcsm.12834
5. McDonald MN, Wouters EFM, Rutten E, et al. It’s more than low BMI: prevalence of cachexia and associated mortality in COPD. Respir Res. 2019;20(1):100. doi:10.1186/s12931-019-1073-3
6. Pishgar F, Shabani M, Silva TQ, et al. Quantitative analysis of adipose depots by using chest CT and associations with all-cause mortality in Chronic Obstructive Pulmonary Disease: longitudinal analysis from MESArthritis ancillary study. Radiology. 2021;299(3):703–711. doi:10.1148/radiol.2021203959
7. Vivodtzev I, Moncharmont L, Tamisier R, et al. Quadriceps muscle fat infiltration is associated with cardiometabolic risk in COPD. Clin Physiol Funct Imaging. 2018;38(5):788–797. doi:10.1111/cpf.12481
8. Niklasson E, Borga M, Dahlqvist Leinhard O, et al. Assessment of anterior thigh muscle size and fat infiltration using single-slice CT imaging versus automated MRI analysis in adults. Br J Radiol. 2022;23(1133):20211094. doi:10.1259/bjr.20211094
9. Karlsson A, Peolsson A, Romu T, et al. The effect on precision and T1 bias comparing two flip angles when estimating muscle fat infiltration using fat-referenced chemical shift-encoded imaging. NMR Biomed. 2021;34(11):e4581. doi:10.1002/nbm.4581
10. Dalle S, Koppo K. Is inflammatory signaling involved in disease-related muscle wasting? Evidence from osteoarthritis, chronic obstructive pulmonary disease and type II diabetes. Exp Gerontol. 2020;137:110964. doi:10.1016/j.exger.2020.110964
11. Jakobsson P, Jorfeldt L, Henriksson J. Metabolic enzyme activity in the quadriceps femoris muscle in patients with severe chronic obstructive pulmonary disease. Am J Respir Crit Care Med. 1995;151(2):374–377. doi:10.1164/ajrccm.151.2.7842194
12. Gosker HR, Zeegers MP, Wouters EF, Schols AM. Muscle fiber type shifting in the vastus lateralis of patients with COPD is associated with disease severity: a systematic review and meta-analysis. Thorax. 2007;62(11):944–949. doi:10.1136/thx.2007.078980
13. Linge J, Heymsfield SB, Dahlqvist Leinhard O. On the definition of sarcopenia in the presence of aging and obesity - initial results from UK Biobank. J Gerontol A Biol Sci Med Sci. 2020;75(7):1309–1316. doi:10.1093/gerona/glz229
14. Linge J, Ekstedt M, Dahlqvist Leinhard O. Adverse muscle composition is linked to poor functional performance and metabolic comorbidities in patients with NAFLD. JHEP Rep. 2020;3(1). doi:10.1016/j.jhepr.2020.100197
15. Lee K, Shin Y, Huh J, et al. Recent issues on body composition imaging for sarcopenia evaluation. Korean J Radiol. 2019;20(2):205–217. doi:10.3348/kjr.2018.0479
16. Coats V, Després J-P, Alméras N, et al. Ectopic adiposity and cardiometabolic health in COPD. Int J Chron Obstruct Pulmon Dis. 2018;13:3331–3340. doi:10.2147/COPD.S168963
17. Jeon Y-J, Han S, Park G-M, et al. Intramuscular and intermuscular abdominal fat infiltration in COPD. A propensity score matched study. Int J Chron Obstruct Pulmon Dis. 2021;16:1989–1999. doi:10.2147/COPD.S312888
18. Roig M, Eng JJ, MacIntyre DL, et al. Deficits in muscle strength, mass, quality, and mobility in people with chronic obstructive pulmonary disease. J Cardiopulm Rehabil Prev. 2011;31(2):120–124. doi:10.1097/HCR.0b013e3181f68ae4
19. Maddocks M, Shrikrishna D, Vitoriano S, et al. Skeletal muscle adiposity is associated with physical activity, exercise capacity and fibre shift in COPD. Eur Respir J. 2014;44(5):1188–1198. doi:10.1183/09031936.00066414
20. Robles PG, Sussman MS, Naraghi A, et al. Intramuscular fat infiltration contributes to impaired muscle function in COPD. Med Sci Sports Exerc. 2015;47(7):1334–1341. doi:10.1249/MSS.0000000000000556
21. Martin M, Almeras N, Després J-P, et al. Ectopic fat accumulation in patients with COPD: an ECLIPSE substudy. Int J Chron Obstruct Pulmon Dis. 2017;12:451–460. doi:10.2147/COPD.S124750
22. Shields GS, Coissi GS, Jimenez-Royo P, et al. Bioenergetics and intermuscular fat in chronic obstructive pulmonary disease-associated quadriceps weakness. Muscle Nerve. 2015;51(2):214–221. doi:10.1002/mus.24289
23. Valkovič L, Chmelík M, Krššák M. In-vivo 31P-MRS of skeletal muscle and liver: a way for non-invasive assessment of their metabolism. Anal Biochem. 2017;529:193–215. doi:10.1016/j.ab.2017.01.018
24. Wuyam B, Payen JF, Levy P, et al. Metabolism and aerobic capacity of skeletal muscle in chronic respiratory failure related to chronic obstructive pulmonary disease. Eur Respir J. 1992;5(2):157–162.
25. Mannix ET, Boska MD, Galassetti P, et al. Modulation of ATP production by oxygen in obstructive lung disease as assessed by 31P-MRS. J Appl Physiol. 1995;78(6):2218–2227. doi:10.1152/jappl.1995.78.6.2218
26. Lévy P, Wuyam B, Pépin JL, et al. Skeletal muscle abnormalities in chronic obstructive lung disease with respiratory insufficiency. Value of P31 magnetic resonance spectroscopy. Rev Mal Respir. 1997;14(3):183–191.
27. van den Borst B, Gosker HR, Koster A, et al. The influence of abdominal visceral fat on inflammatory pathways and mortality risk in obstructive lung disease. Am J Clin Nutr. 2012;96(3):516–526. doi:10.3945/ajcn.112.040774
28. Addison O, Drummond MJ, LaStayo PC, et al. Intramuscular fat and inflammation differ in older adults: the impact of frailty and inactivity. J Nutr Health Aging. 2014;18(5):532–538. doi:10.1007/s12603-014-0019-1
29. Yende S, Waterer GW, Tolley EA, et al. Inflammatory markers are associated with ventilatory limitation and muscle dysfunction in obstructive lung disease in well functioning elderly subjects. Thorax. 2006;61(1):10–16. doi:10.1136/thx.2004.034181
30. Ferrari R, Caram LMO, Faganello MM, et al. Relation between systemic inflammatory markers, peripheral muscle mass, and strength in limb muscles in stable COPD patients. Int J Chron Obstruct Pulmon Dis. 2015;10:1553–1558. doi:10.2147/COPD.S85954
31. Byun MK, Cho EN, Chang J, et al. Sarcopenia correlates with systemic inflammation in COPD. Int J Chron Obstruct Pulmon Dis. 2017;12:669–675. doi:10.2147/COPD.S130790
32. Borga M, Ahlgren A, Romu T, et al. Reproducibility and repeatability of MRI-based body composition analysis. Magn Reson Med. 2020;10. doi:10.1002/mrm.28360
33. Kentson M, Leanderson P, Jacobson P, et al. The influence of disease severity and lifestyle factors on the peak annual 25(OH)D value of COPD patients. Int J Chron Obstruct Pulmon Dis. 2018;13:1389–1398. doi:10.2147/COPD.S156121
34. Hedenström H, Malmberg P, Agarwal K. Reference values for lung function tests in females. regression equations with smoking variables. Bull Eur Physiopathol Respir. 1985;21(6):551–557.
35. Hedenström H, Malmberg P, Fridriksson H. Reference values for lung function tests in men: regression equations with smoking variables. Ups J Med Sci. 1986;91(3):299–310. doi:10.3109/03009738609178670
36. Ekelund U, Sepp H, Brage S, et al. Criterion‐related validity of the last 7‐day, short form of the international physical activity questionnaire in Swedish adults. Public Health Nutr. 2006;9(2):258–265. doi:10.1079/phn2005840
37. Charlson ME, Pompei P, Ales KL, et al. A new method of classifying prognostic comorbidity in longitudinal studies: development and validation. J Chronic Dis. 1987;40(5):373–383. doi:10.1016/0021-9681(87)90171-8
38. Available from: https://www.euro.who.int/en/health-topics/disease-prevention/nutrition/a-healthy-lifestyle/body-mass-index-bmi.
39. Linge J, Borga M, West J, et al. Body composition profiling in the UK Biobank Imaging Study. Obesity. 2018;26(11):1785–1795. doi:10.1002/oby.22210
40. Borga M, Thomas EL, Romu T, et al. Validation of a fast method for quantification of intra‐abdominal and subcutaneous adipose tissue for large scale human studies. NMR Biomed. 2015;28(12):1747–1753. doi:10.1002/nbm.3432
41. Karlsson A, Rosander J, Romu T, et al. Automatic and quantitative assessment of regional muscle volume by multi‐atlas segmentation using whole‐body water-fat MRI. J Magn Reson Imaging. 2015;41(6):1558–1569. doi:10.1002/jmri.24726
42. West J, Dahlqvist Leinhard O, Romu T, et al. Feasibility of MR-based body composition analysis in large scale population studies. PLoS One. 2016;11(9):e0163332. doi:10.1371/journal.pone.0163332
43. West J, Romu T, Thorell S, et al. Precision of MRI‐based body composition measurements of postmenopausal women. PLoS One. 2018;13(2):e0192495. doi:10.1371/journal.pone.0192495
44. Gerdle B, Forsgren MF, Bengtsson A, et al. Decreased muscle concentrations of ATP and PCr in the quadriceps muscle of fibromyalgia patients–a 31P-MRS study. Eur J Pain. 2013;17:1205–1215. doi:10.1002/j.1532-2149.2013.00284.x
45. Naressi A, Couturier C, Devos JM, et al. Java-based graphical user interface for the MRUI quantitation package. MAGMA. 2001;12(2–3):141–152. doi:10.1007/BF02668096
46. Vanhamme L, van den Boogaart A, Van Huffel S. Improved method for accurate and efficient quantification of MRS data with use of prior knowledge. J Magn Reson. 1997;129(1):35–43. doi:10.1006/jmre.1997.1244
47. Weibel ER, Hoppeler H. Exercise-induced maximal metabolic rate scales with muscle aerobic capacity. J Exp Biol. 2005;208(9):1635–1644. doi:10.1242/jeb.01548
48. Guthrie BM, Frostick SP, Mikulis J, et al. Endurance-trained and untrained skeletal muscle bioenergetics observed with magnetic resonance spectroscopy. Can J Appl Physiol. 1996;21:251–263. doi:10.1139/h96-022
49. Goodpaster BH, Chomentowski P, Ward BK, et al. Effects of physical activity on strength and skeletal muscle fat infiltration in older adults: a randomized controlled trial. J Appl Physiol. 2008;105(5):1498–1503. doi:10.1152/japplphysiol.90425.2008
50. Trajanoska K, Schoufour JD, Darweesh SK, et al. Sarcopenia and its clinical correlates in the general population: the Rotterdam study. J Bone Miner Res. 2018;33(7):1209–1218. doi:10.1002/jbmr.3416
51. Benz E, Trajanoska K, Lahousse L, et al. Sarcopenia in COPD: a systematic review and meta-analysis. Eur Respir Rev. 2019;28(154):190049. doi:10.1183/16000617.0049-20195
52. Sepulveda-Loyola W, Osadnik C, Phu S, et al. Diagnosis, prevalence, and clinical impact of sarcopenia in COPD: a systematic review and meta-analysis. J Cachexia Sarcopenia Muscle. 2020;11(5):1164–1176. doi:10.1002/jcsm.12600
53. Cruz-Jentoft AJ, Bahat G, Bauer J, et al. Sarcopenia: revised European consensus on definition and diagnosis. Age Ageing. 2019;48(1):16–31. doi:10.1093/ageing/afy169
54. Perrot L, Greil A, Boirie Y, et al. Prevalence of sarcopenia and malnutrition during acute exacerbation of COPD and after 6 months recovery. Eur J Clin Nutr. 2020;74(11):1556–1564. doi:10.1038/s41430-020-0623-636
55. Steiner MC. Sarcopaenia in chronic obstructive pulmonary disease. Thorax. 2007;62(2):101–103. doi:10.1136/thx.2006.067009
56. Dhillon RJ, Hasni S. Pathogenesis and management of sarcopenia. Clin Geriatr Med. 2017;33(1):17–26. doi:10.1016/j.cger.2016.08.00233
57. Debevec T, Ganse B, Mittag U, et al. Hypoxia aggravates inactivity-related muscle wasting. Front Physiol. 2018;9:494. doi:10.3389/fphys.2018.00494
58. Decramer M, de Bock V, Dom R. Functional and histologic picture of steroid-induced myopathy in chronic obstructive pulmonary disease. Am J Respir Crit Care Med. 1996;153(6):1958–1964. doi:10.1164/ajrccm.153.6.8665061
59. Haberecht-Müller S, Krüger E, Fielitz J. Out of control: the role of the ubiquitin proteasome system in skeletal muscle during inflammation. Biomolecules. 2021;11(9):1327. doi:10.3390/biom11091327
60. Sioutas A, Vainikka LK, Kentson M, et al. Oxidant-induced autophagy and ferritin degradation contribute to epithelial-mesenchymal transition through lysosomal iron. J Inflamm Res. 2017;10:29–39. doi:10.2147/JIR.S128292
61. Persson HL, Sioutas A, Jacobson P, et al. Human lung macrophages challenged to oxidants ex vivo: lysosomal membrane sensitization is associated with inflammation and chronic airflow limitation. J Inflamm Res. 2020;13:925–932. doi:10.2147/JIR.S280419
62. Constantin-Teodosiu D, Constantin D. Molecular mechanisms of muscle fatigue. Int J Mol Sci. 2021;22(21):11587. doi:10.3390/ijms222111587
63. Leermakers PA, Gosker HR. Skeletal muscle mitophagy in chronic disease: implications for muscle oxidative capacity? Curr Opin Clin Nutr Metab Care. 2016;19(6):427–433. doi:10.1097/MCO.0000000000000319
64. van de Bool C, Gosker HR, van den Borst B, et al. Muscle quality is more impaired in sarcopenic patients with chronic obstructive pulmonary disease. J Am Med Dir Assoc. 2016;17(5):415–420. doi:10.1016/j.jamda.2015.12.094
65. Goodpaster BH, Thaete FL, Simoneau JA, et al. Subcutaneous abdominal fat and thigh muscle composition predict insulin sensitivity independently of visceral fat. Diabetes. 1997;46(10):1579–1585. doi:10.2337/diacare.46.10.1579
66. Tejani S, McCoy C, Ayers CR, et al. Cardiometabolic health outcomes associated with discordant visceral and liver fat phenotypes: insights from the Dallas Heart Study and UK Biobank. Mayo Clin Proc. 2022;97(2):225–237. doi:10.1016/j.mayocp.2021.08.021
67. Viglino D, Martin M, Piché M-E, et al. Metabolic profiles among COPD and controls in the CanCOLD population-based cohort. PLoS One. 2020;154(4):e0231072. doi:10.1371/journal.pone.0231072
 © 2022 The Author(s). This work is published and licensed by Dove Medical Press Limited. The
full terms of this license are available at https://www.dovepress.com/terms
and incorporate the Creative Commons Attribution
- Non Commercial (unported, 3.0) License.
By accessing the work you hereby accept the Terms. Non-commercial uses of the work are permitted
without any further permission from Dove Medical Press Limited, provided the work is properly
attributed. For permission for commercial use of this work, please see paragraphs 4.2 and 5 of our Terms.
© 2022 The Author(s). This work is published and licensed by Dove Medical Press Limited. The
full terms of this license are available at https://www.dovepress.com/terms
and incorporate the Creative Commons Attribution
- Non Commercial (unported, 3.0) License.
By accessing the work you hereby accept the Terms. Non-commercial uses of the work are permitted
without any further permission from Dove Medical Press Limited, provided the work is properly
attributed. For permission for commercial use of this work, please see paragraphs 4.2 and 5 of our Terms.
Recommended articles
Fibromyalgia: Associations Between Fat Infiltration, Physical Capacity, and Clinical Variables
Gerdle B, Dahlqvist Leinhard O, Lund E, Bengtsson A, Lundberg P, Ghafouri B, Forsgren MF
Journal of Pain Research 2022, 15:2517-2535
Published Date: 27 August 2022
From COPD to Lung Cancer: Mechanisms Linking, Diagnosis, Treatment, and Prognosis

Qi C, Sun SW, Xiong XZ
International Journal of Chronic Obstructive Pulmonary Disease 2022, 17:2603-2621
Published Date: 17 October 2022
CC16 as an Inflammatory Biomarker in Induced Sputum Reflects Chronic Obstructive Pulmonary Disease (COPD) Severity
Chen M, Xu K, He Y, Jin J, Mao R, Gao L, Zhang Y, Wang G, Gao P, Xie M, Liu C, Chen Z
International Journal of Chronic Obstructive Pulmonary Disease 2023, 18:705-717
Published Date: 27 April 2023
Sputum Biomarkers in Wood and Tobacco Smoke Etiotypes of Chronic Obstructive Pulmonary Disease
Giraldo-Montoya ÁM, Torres-Duque CA, Giraldo-Cadavid LF, Laucho-Contreras ME, González-Flórez A, Santos AM, Tuta-Quintero EA, Celli BR, González-García M
International Journal of Chronic Obstructive Pulmonary Disease 2024, 19:1-10
Published Date: 30 December 2023
Lack of Evidence Regarding Markers Identifying Acute Heart Failure in Patients with COPD: An AI-Supported Systematic Review
van Dijk SHB, Brusse-Keizer MGJ, Bucsán CC, Ploumen EH, van Beurden WJC, van der Palen J, Doggen CJM, Lenferink A
International Journal of Chronic Obstructive Pulmonary Disease 2024, 19:531-541
Published Date: 23 February 2024