Back to Journals » Clinical Interventions in Aging » Volume 21
Rethinking Low Handgrip Strength: Normative Values, Diagnostic Thresholds, and Sarcopenia Risk in Malaysian Older Adults
Authors Ooi TC ![]() , Rivan NFM
, Rivan NFM ![]() , Shahar S, Ibrahim AM, Singh DKA
, Shahar S, Ibrahim AM, Singh DKA ![]()
Received 10 February 2026
Accepted for publication 27 May 2026
Published 15 June 2026 Volume 2026:21 594695
DOI https://doi.org/10.2147/CIA.S594695
Checked for plagiarism Yes
Review by Single anonymous peer review
Peer reviewer comments 3
Editor who approved publication: Dr Zhi-Ying Wu
Theng Choon Ooi,1,2 Nurul Fatin Malek Rivan,1 Suzana Shahar,1 Azianah Mohamad Ibrahim,1 Devinder Kaur Ajit Singh1
1Centre for Healthy Ageing and Wellness, Faculty of Health Sciences, Universiti Kebangsaan Malaysia, Jalan Raja Muda Abdul Aziz, Kuala Lumpur, Wilayah Persekutuan, Malaysia; 2Premier Integrated Labs Sdn Bhd, Kuala Lumpur, Malaysia
Correspondence: Devinder Kaur Ajit Singh, Email [email protected]
Aim: To establish normative reference values for handgrip strength (HGS) in Malaysian older adults using cross-sectional data from the LRGS-TUA cohort study.
Methods: We analyzed data from 2180 community-dwelling adults aged ≥ 60 years enrolled in the LRGS-TUA longitudinal study. Sex-specific percentile curves and age-specific normative reference values for absolute and body weight-normalized HGS were generated using the lambda-mu-sigma (LMS) method. We compared the prevalence of low HGS using the Asian Working Group for Sarcopenia (AWGS) 2019 cutoffs versus lowest quintile thresholds and assessed their associations with sarcopenia-related outcomes.
Results: Peak mean absolute HGS occurred at age 60– 64 years for both men (30.9 ± 6.6 kg) and women (19.7 ± 4.8 kg). Peak normalized HGS was observed at 65– 69 years for men (0.47 ± 0.11 kgf/kg) and at 60– 64 years for women (0.33 ± 0.09 kgf/kg), with women maintaining stable values through 70– 74 years. The AWGS 2019 criteria identified substantially higher prevalence of low HGS (men: 46.2%; women: 48.7%) compared to lowest quintile thresholds (men: 19.6%; women: 20.1%). Both definitions demonstrated significant correlations with sarcopenia-related outcomes.
Conclusion: Low handgrip strength prevalence was higher using AWGS 2019 criteria, though both definitions showed similar associations with sarcopenia-related outcomes. Their relative clinical utility requires confirmation through longitudinal validation.
Keywords: handgrip strength, normative reference value, older adults, sarcopenia
Introduction
Muscle weakness is a pervasive and clinically significant condition in older adults, with far-reaching consequences for functional independence, health outcomes, and quality of life.1 Central to this process is sarcopenia, the age-related decline in skeletal muscle mass and function, which contributes to progressive reductions in muscle strength and power.2 Collectively, these changes impair the capacity to perform activities of daily living and increase vulnerability to mobility limitations, falls, disability, and institutionalisation.1 Beyond functional decline, reduced muscle strength has been consistently associated with a higher risk of chronic conditions, including cardiovascular disease and osteoporosis, as well as adverse metabolic outcomes through its influence on glucose regulation, insulin sensitivity, and energy expenditure.3,4 As such, preserving muscle strength represents a critical target for promoting healthy ageing, maintaining independence, and reducing healthcare burden.
Handgrip strength (HGS) has emerged as a simple, non-invasive, and reliable proxy of overall muscle strength, with strong prognostic value across diverse populations.5 Declines in HGS reflect the combined effects of ageing, sarcopenia, chronic disease, and modifiable lifestyle factors such as physical inactivity and suboptimal nutrition.2 A substantial body of evidence demonstrates that low HGS is independently associated with functional limitations, increased risk of falls and fractures, and all-cause mortality.6–8 Consequently, HGS assessment is increasingly integrated into geriatric screening and research as a practical tool for risk stratification and early identification of individuals at risk of adverse health outcomes.
Accurate interpretation of HGS, however, depends on the availability of appropriate normative reference values. Population-specific benchmarks are essential to distinguish between normal age-related variation and clinically meaningful muscle weakness, enabling more precise identification of at-risk individuals and informing intervention strategies. Although normative HGS values have been established in several populations, their generalizability to Malaysia is limited due to substantial heterogeneity in genetic background, ethnicity, lifestyle, and sociocultural factors.9,10 This emphasize the need for locally derived reference standards. Therefore, in this study, we aim to establish normative HGS values among Malaysian older adults using data from the LRGS-TUA cohort, and to provide contextually relevant benchmarks to support screening, clinical decision-making, and future research in ageing populations.
Methods
Participants and Inclusion/Exclusion Criteria
This study is based on baseline data from the Longitudinal Research Grant Scheme – Towards Useful Ageing (LRGS-TUA), a large community-based cohort of older adults in Malaysia. For the present analysis, cross-sectional data collected between May 2012 and February 2013 were used. The overall study design, sampling procedures, and eligibility criteria have been described in detail in earlier publications.11,12 In brief, community-dwelling individuals aged 60 years and above were recruited. Participants with documented major psychiatric disorders or mental illnesses were excluded, as were those with moderate to severe cognitive impairment, defined by a Mini-Mental State Examination (MMSE) score of 14 or below. Of the 2322 participants enrolled at baseline, 2180 individuals with complete dominant handgrip strength measurements were included in this analysis.
Data Collection
Data collection followed standardised protocols implemented across the LRGS-TUA cohort and was carried out by trained enumerators. Key procedures relevant to the current analysis are summarized below for clarity.12
Sociodemographics and Medical History
Sociodemographic information, including age, sex, ethnicity, and educational level, was obtained through structured face-to-face interviews. Participants were also asked to recall any falls experienced during the previous 12 months and were classified as non-fallers, single fallers (one fall), or recurrent fallers (two or more falls) based on self-reported frequency.13 Medical history was collected using self-report and included common chronic conditions including hypertension, hyperlipidemia, diabetes mellitus, stroke, osteoarthritis, cardiovascular disease, cataract or glaucoma, renal disease, asthma, chronic obstructive pulmonary disease, tuberculosis, gout, hip fracture, thyroid disorders, and cancer. Multimorbidity was defined as the presence of two or more chronic conditions in an individual.14
Physical Measurement and Muscle Strength
Anthropometric measurements were obtained using standardized equipment and procedures. Body height was measured with a Leicester Height Measure (CMS Weighing Equipment, UK), and body weight was recorded using a Tanita HD319 digital scale (Tanita Corporation of America, IL, USA), with values recorded to the nearest 0.1 cm and 0.1 kg, respectively. Body mass index (BMI) was calculated as weight (kg) divided by height squared (m2) and categorized as underweight (<22 kg/m2), normal (22–27 kg/m2), or overweight/obese (>27 kg/m2). These specific cut-offs were adopted as better reflecting health risks and protective factors against functional decline in older Asian cohorts compared to standard WHO classifications. Body composition was assessed using bioelectrical impedance analysis (InBody S10, Biospace, Seoul, Korea) in accordance with the manufacturer’s recommendations. Skeletal muscle mass was adjusted for height and expressed as kg/m2. Low skeletal muscle mass was defined as <7.0 kg/m2 for men and <5.7 kg/m2 for women, based on the Asian Working Group for Sarcopenia (AWGS) 2019 criteria.15
Dominant handgrip strength (HGS) was assessed using a calibrated handgrip dynamometer (Jamar Plus+ Hand Dynamometer, SI Instruments Pty Ltd, SA, Australia).12 Participants were instructed to exert maximal effort during two trials, performed with the shoulder in adduction and neutral rotation, the elbow flexed at 90°, the forearm in a neutral position, and the wrist maintained between 0° and 15° of ulnar deviation. The highest value obtained (kg) was taken as the participant’s absolute dominant HGS. Given the well-recognized influence of body size on muscle strength, absolute HGS values were additionally normalized to body weight. Normalized HGS (kgf/body mass in kg) was calculated by dividing absolute HGS (kgf) by body mass (kg).
Physical Function
Functional mobility was evaluated using the Timed Up and Go (TUG) test. Participants were asked to rise from a standard armless chair (seat height 46 cm), walk a distance of 3 m at a comfortable pace, turn, return to the chair, and sit down. The test was performed twice in succession, and the mean of the two trials was used for analysis. Participants were allowed to use their usual walking aids (walking stick, tripod, or quadripod) if required. To examine sarcopenia-related functional outcomes associated with low HGS, a cut-off value of ≥11.18 seconds was applied. This threshold was previously established in the same cohort and has been shown to indicate an increased risk of falls.16 Functional independence was evaluated using the Instrumental Activities of Daily Living (IADL) scale, which assessed participants’ ability to perform tasks such as using the telephone, shopping, food preparation, housekeeping, transportation, medication management, and financial handling. IADL scores were categorised as no impairment (14), minimal impairment (10–13), or moderate to severe impairment (<10). Disability was assessed using the 12-item World Health Organization Disability Assessment Schedule 2.0 (WHODAS 2.0), with responses rated on a five-point Likert scale from 0 (no difficulty) to 4 (very severe difficulty). WHODAS 2.0 scores were categorised as no disability (0), mild (1–4), moderate (5–9), or severe disability (10–48).
Cognition
Cognitive function was evaluated using a battery of standardized neurocognitive assessments, including the Mini-Mental State Examination (MMSE), Digit Span Test, and Rey Auditory Verbal Learning Test (RAVLT), which assessed global cognition, working memory, and short-term verbal memory, respectively. The administration protocols for these assessments have been described previously.12 Participants were subsequently classified as cognitively normal or having mild cognitive impairment (MCI) in accordance with established criteria.17,18 MCI was defined by the presence of subjective memory complaints (reported by participants or caregivers) and/or objective memory impairment, indicated by performance at least 1.5 standard deviations below the mean on the Digit Span Test or RAVLT. Additional criteria included preserved global cognitive function (MMSE score ≥19), minimal or no functional limitations in daily activities, and the absence of clinically diagnosed dementia.
Lifestyle
Lifestyle engagement, disability, and functional status were assessed using validated instruments employed within the LRGS-TUA cohort.12 Lifestyle activities were measured using an adapted 26-item Activity Lifestyle Questionnaire encompassing physical, mental, and social domains. Results in Table S1 are presented in quartiles (Q1 representing the highest activity and Q4 the lowest).
Statistical Analysis
Statistical analysis was conducted using IBM SPSS Statistics version 25.0 (IBM Corp, Armonk, New York, USA), with statistical significance considered at p < 0.05. Descriptive analysis was conducted to study baseline parameters in male and female participants, and univariate comparisons between groups were performed using Independent T-test and Chi-square test for continuous and categorical data, respectively. Then, absolute and normalized HGS were stratified based on sex and participant characteristics, including age group, BMI categories, cognitive status, medical history, falls history, lifestyle activities, disability, and functional status. Between-group comparisons of absolute and normalized HGS were carried out using independent T-tests or one-way analysis of variance (ANOVA) for characteristics with two groups or ≥3 groups, respectively. A two-way ANOVA test was employed to examine whether sex and age group should be used to stratify absolute and normalized HGS measurements. The analysis was adjusted for potential confounding factors, including BMI categories, cognitive status, medical history, falls history, lifestyle activities, disability, and functional status.
Subsequently, normative reference values for absolute and normalized HGS, including percentiles, means, and standard deviations (SD), were calculated, stratified by sex and age groups. Sex-specific percentile curves for absolute and normalized HGS were generated using the lambda-mu-sigma (LMS) statistical method from the generalized additive model for location, scale, and shape (GAMLSS) package in R statistical software version 4.2.3.19 Age-specific normative reference values for males and females, ranging from 60 to 90 years old, were extrapolated based on the fitted LMS model.
Following the Asian Working Group for Sarcopenia (AWGS) recommendation from 2014, the cut-off value for low muscle strength was set at the lower 20th percentile of HGS in the study.20 After considering the cohort data from eight Asian older populations aged 65 and above, the AWGS 2019 recommended cut-offs for low HGS were <28.0 kg for Asian males and <18.0 kg for Asian females.17 Then, we calculated and compared the sex-specific prevalence of low HGS for the study populations based on the different cut-off values derived from the aforementioned definitions. Additionally, the association between sarcopenic-related outcomes and the prevalence of low HGS derived from different definitions was investigated using multiple binary logistic regression in both unadjusted and adjusted models (controlling for age, sex, BMI, and multimorbidity status) to determine which definition performed better in defining low HGS in the Malaysian older population.
Results
Baseline Characteristics of the Participants
Table 1 presents the baseline characteristics of the participants. Generally, men were older, had higher education levels, body weight, height, and BMI (p < 0.05). Regarding medical history, men were more likely (p < 0.05) to have cardiovascular diseases and gout, while women were more likely to have hypertension, hypercholesterolemia, and joint pain. Women also exhibited a higher prevalence of falls compared to men. Meanwhile, men were found to have less disability (with a lower WHODAS 2.0 score and a higher IADL score) and had higher lifestyle activities than women (p < 0.05). The absolute (28.4 ± 6.8 vs. 18.2 ± 5.1) and normalized HGS (0.45 ± 0.11 vs. 0.33 ± 0.10) of men were significantly higher than those of women in the Malaysian older adults (p < 0.001).
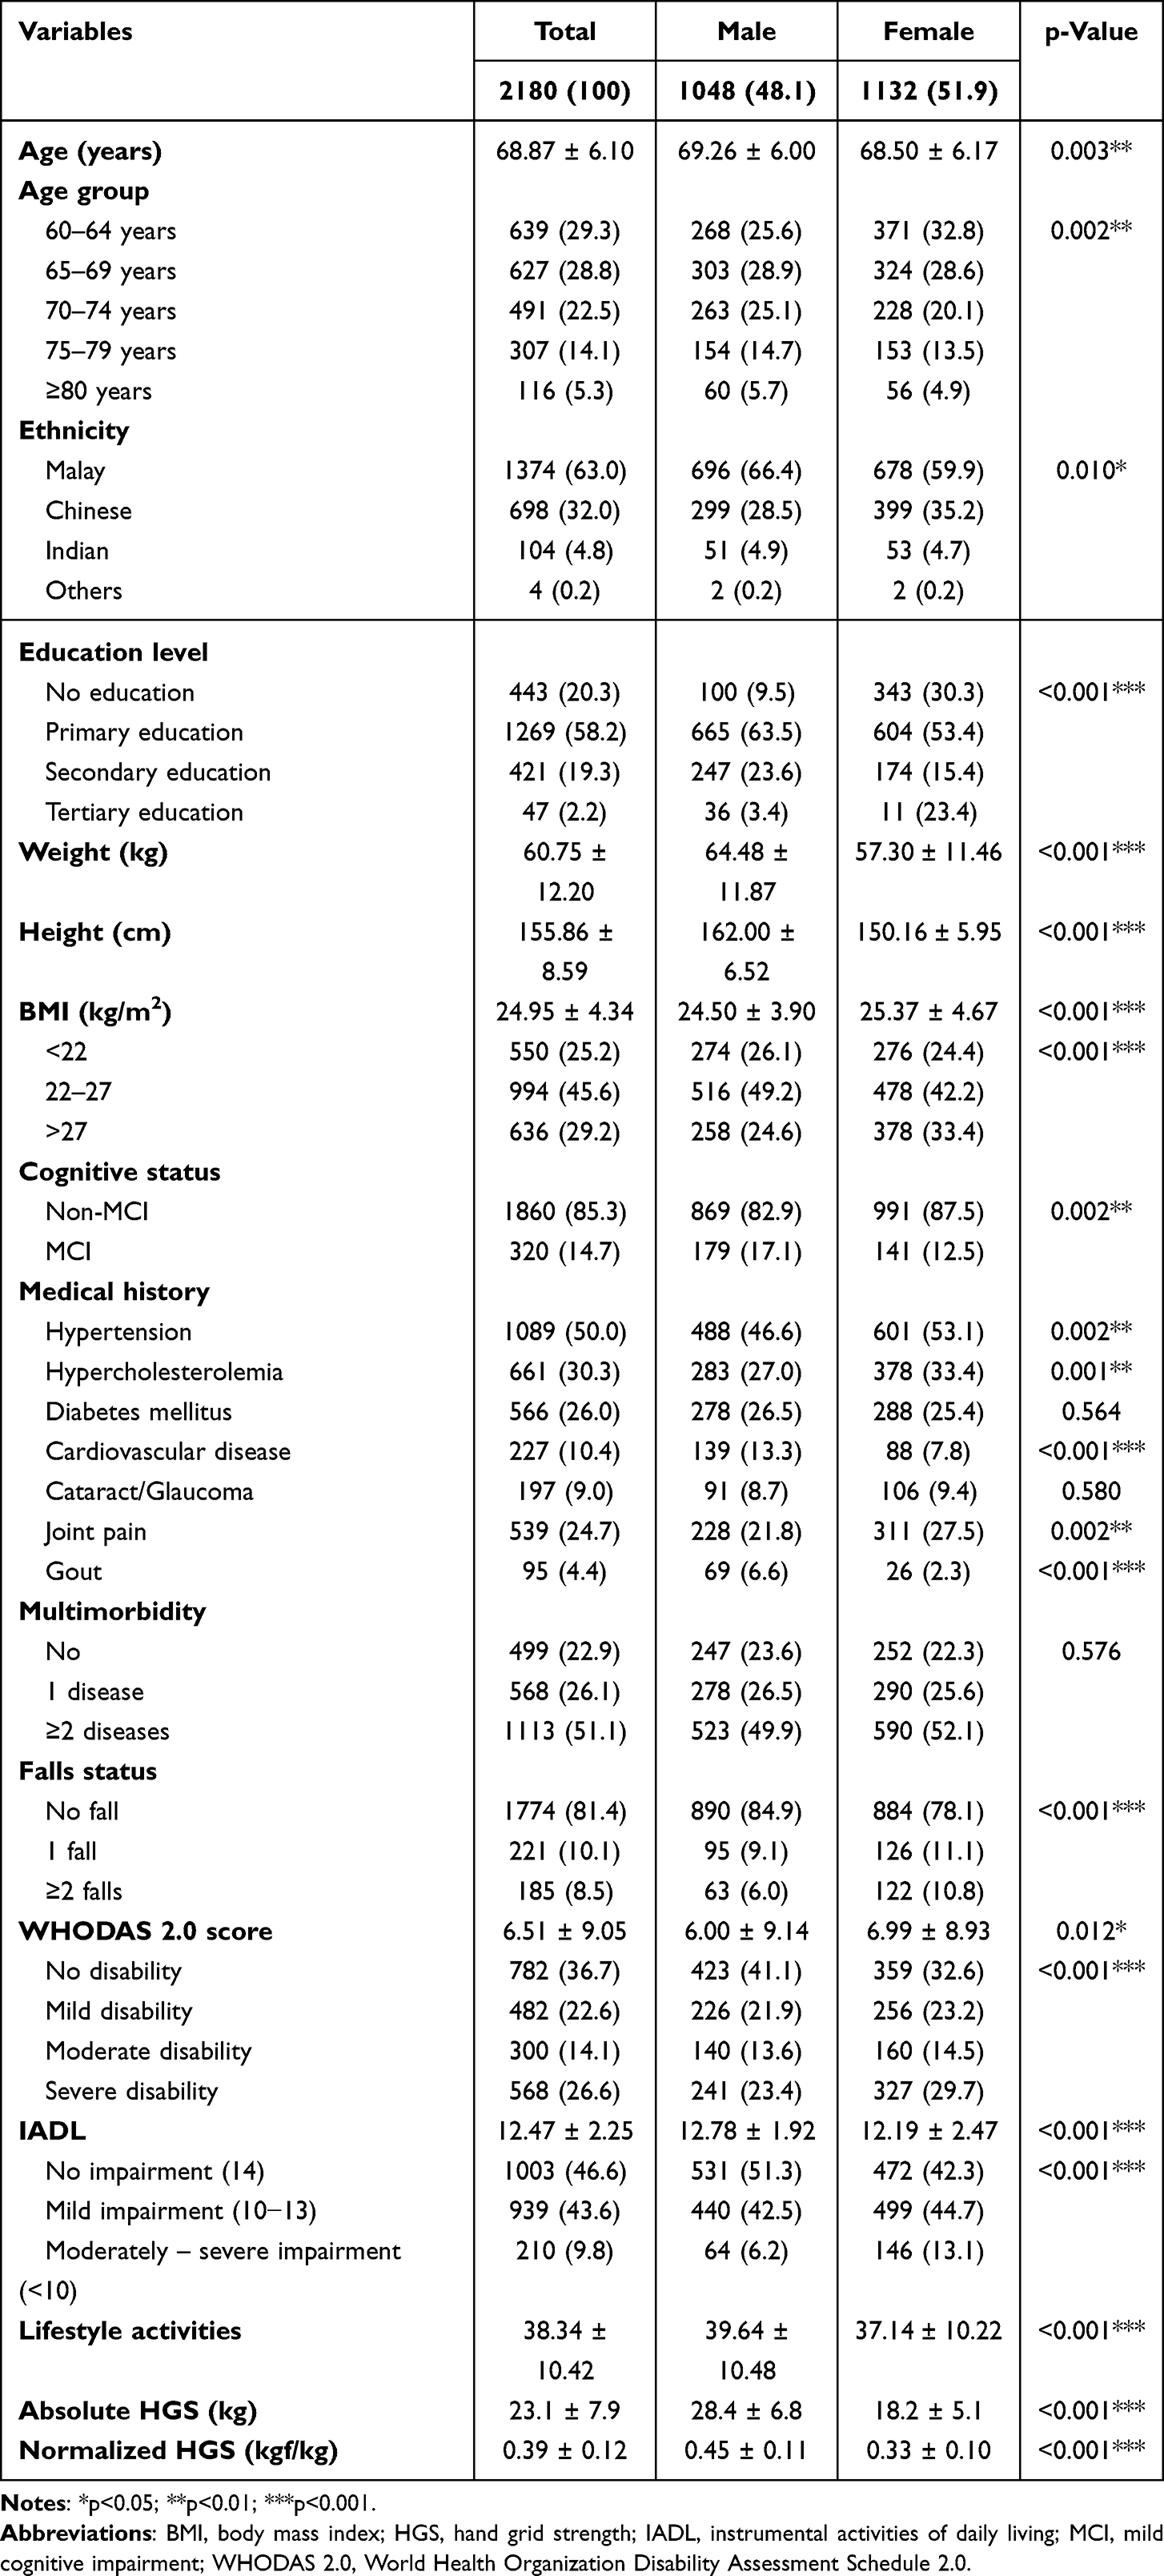 |
Table 1 The Characteristics of the Participants in Total and by Sex |
Absolute and Normalized HGS Stratified by Sex and Other Characteristics of the Participants
Table S1 depicts the comparisons of absolute and normalized HGS measurements based on participants’ characteristics. Generally, men and women in higher age groups, with higher disability levels, greater functional impairment, and lower levels of lifestyle activities, were found to have lower absolute HGS measurements. Regarding BMI categories, the highest absolute HGS measurement was observed in BMI 22–27 for men and BMI >27 for women, respectively.
In addition to age group, BMI categories, disability levels, functional impairment, and lifestyle activities, normalized HGS was also found to be lower (p < 0.05) in men who self-reported hypertension, hypercholesterolemia, diabetes mellitus, cardiovascular diseases, cataract/glaucoma, joint pain, gout, and multimorbidity. In contrast, normalized HGS was lower (p < 0.05) in women who self-reported hypertension, hypercholesterolemia, diabetes mellitus, joint pain, and multimorbidity. Additionally, men with a history of falls were reported to have lower (p < 0.05) normalized HGS, but this association was not observed in women.
Subsequently, a two-way ANOVA statistical test was conducted to examine if sex and age group should be used to stratify absolute and normalized HGS measurements (Table S2). Our current findings demonstrated that, in the unadjusted model, sex and age group were independent variables that affected absolute and normalized HGS, with no interaction effects between sex and age group detected. After adjusting for potential confounding factors, absolute and normalized HGS still differed significantly by sex and age group. However, there was a statistically significant interaction between the effects of sex and age group on absolute HGS measurements, but not on normalized HGS. Our current findings suggest that sex and age group could be used to stratify absolute HGS measurements.
Normative Reference Values for Absolute and Normalized HGS Measurements
The mean values and percentiles for absolute and normalized HGS measurements, stratified by sex and age group, are summarized in Table 2. The peak mean absolute HGS value was 30.9 ± 6.6 kg for men and 19.7 ± 4.8 kg for women in the 60–64 years age group. As age increased, the mean absolute HGS values for both men and women gradually decreased, and this trend was consistent across all percentiles. In contrast, the peak mean normalized HGS value was 0.47 ± 0.11 kgf/kg for men in the 65–69 years age group. Surprisingly, normalized HGS values peaked at the 60–64 years age group (0.33 ± 0.09) for women and remained constant at 65–69 years (0.33 ± 0.09) and 70–74 years (0.33 ± 0.11) age groups, suggesting that older women are more resistant to deterioration in HGS after accounting for changes in body mass.
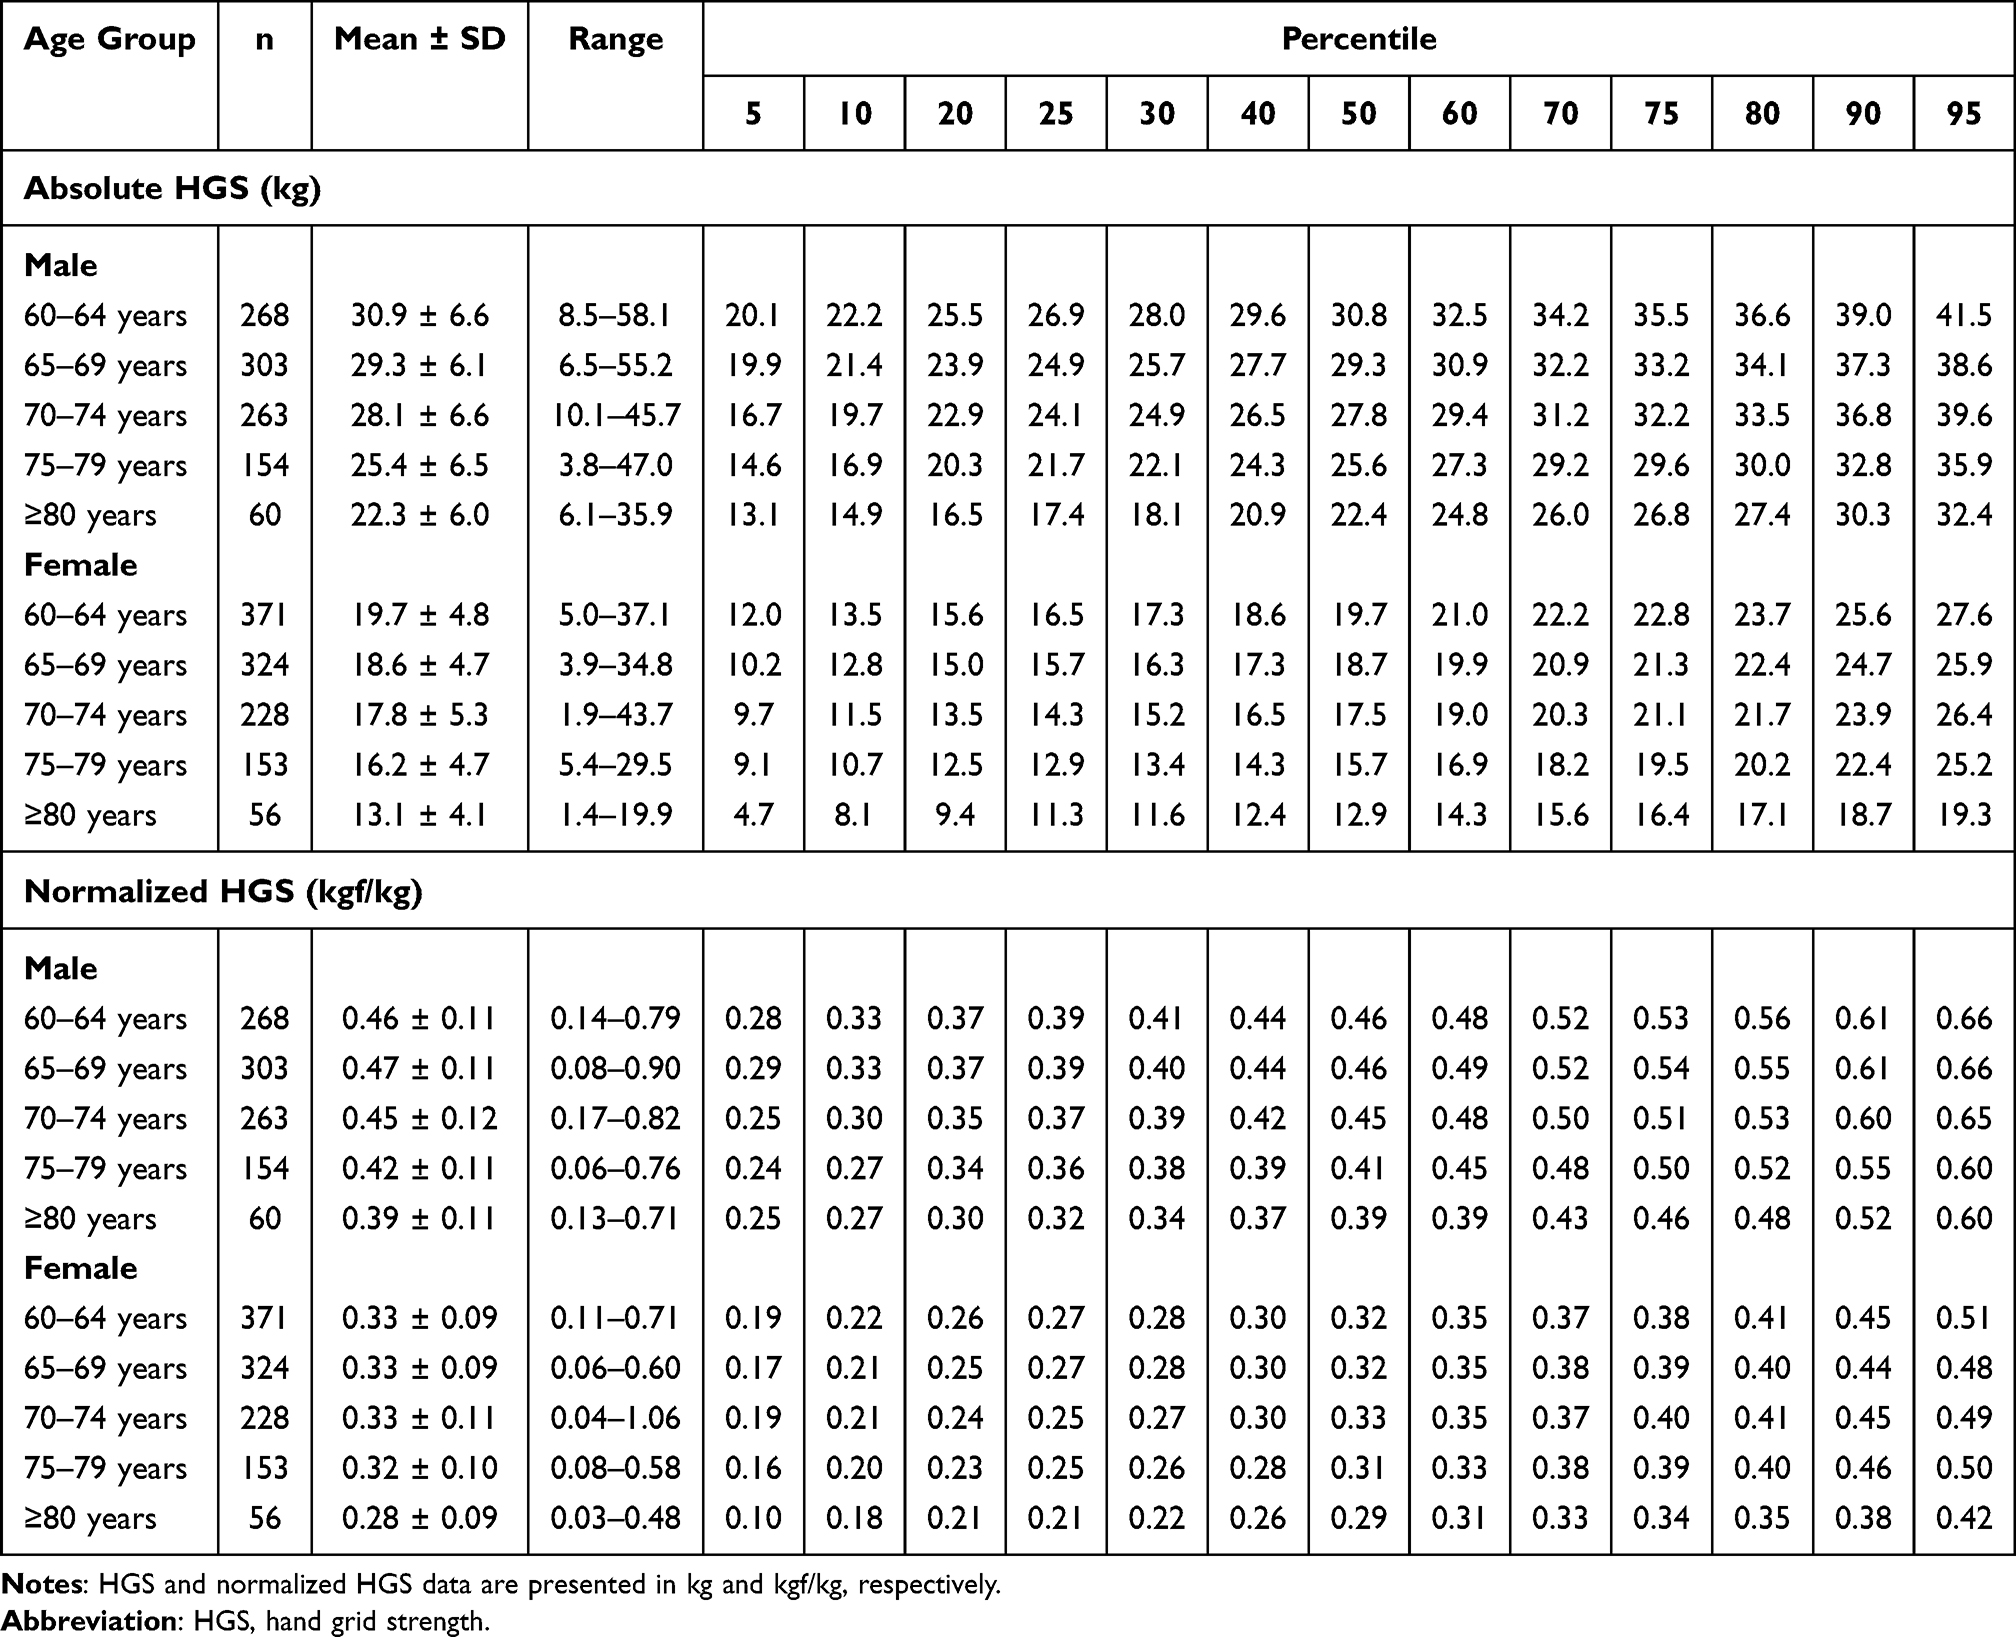 |
Table 2 Normative Reference Values for Absolute and Normalized HGS Data by Percentile in Malaysian Older Adults, Stratified by Sex and Age Group |
The percentile curves depicted in Figure 1 were generated using the LMS statistical model. These curves illustrated a gradual decline in absolute HGS with increasing age for both men (Figure 1A) and women (Figure 1B), with a more pronounced decline in men. The normalized HGS curves for men (Figure 1C) also showed a gradual decline starting at age 60. In contrast, the normalized HGS curves for women (Figure 1D) were generally flatter, remaining plateaued before experiencing a decline in the early years of the seventh decade of life. Estimated normative reference values for absolute and normalized HGS among the Malaysian older adults were extrapolated from the fitted LMS models and presented in Tables S3 and S4, respectively.
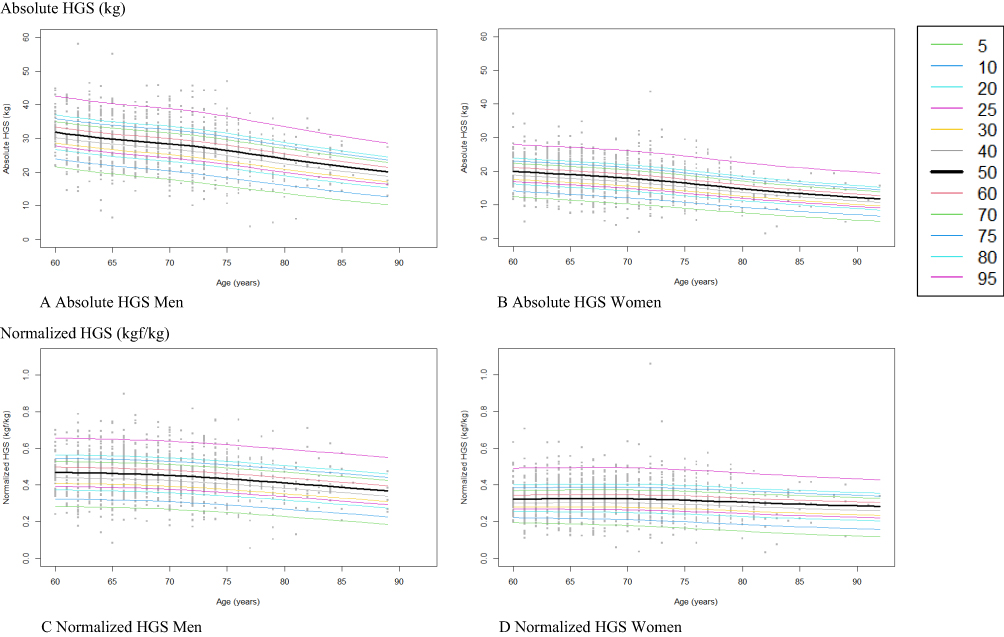 |
Figure 1 The estimated reference percentile curves of absolute HGS and normalized HGS performance in Malaysian male and female older adults using the LMS method. (A) Absolute HGS for Men, (B) Absolute HGS for Women, (C) Normalized HGS for Men, (D) Normalized HGS for Women. |
The Comparison of Low HGS Prevalence Based on Different Cut-off Values
The prevalence of low HGS was determined using different cutoff values derived from 1) the AWGS 2019 definition and 2) the lowest quintile of HGS in the study population (<22.8 kg for men and <13.8 kg for women), as shown in Table 3. Overall, the prevalence of low HGS was higher for cutoff values derived from the AWGS 2019 definition (46.2% in men and 48.7% in women) compared to the lowest quintile definition (19.6% in men and 20.1% in women). Additionally, the prevalence of low HGS was higher in women than in men across all age groups using the AWGS 2019 cutoff values. However, based on cutoff values derived from the lowest quintile definition, the prevalence of low HGS was higher in men before the age of 70, and vice versa after the age of 70.
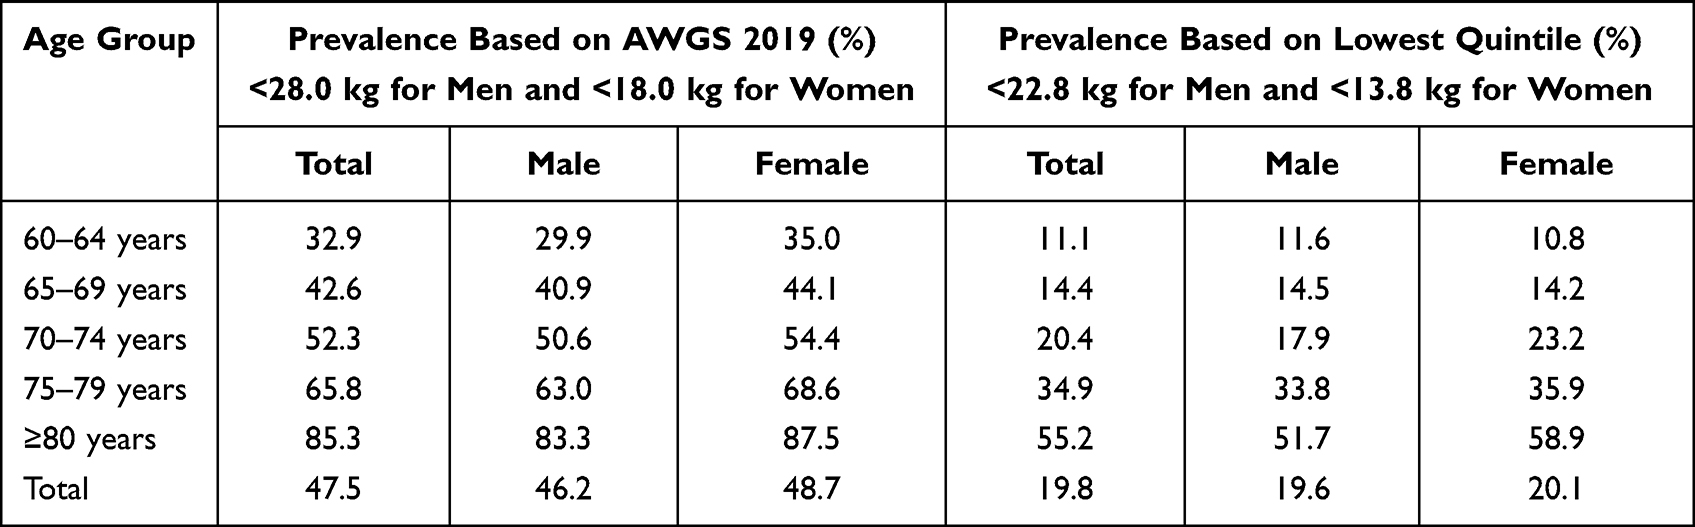 |
Table 3 Prevalence Comparison Among Cut-off Values Derived from Different Definition for Low HGS in the Malaysian Older Population |
The Relationships of Sarcopenic-Related Outcomes with Low HGS Defined by Various Definitions
The sarcopenic-related outcome measurements, stratified by the prevalence of low HGS derived from AWGS 2019 and the lowest quintile definition, are presented in Table 4. Based on the findings from the multiple binary logistic regression (Table 5), both AWGS 2019 and the lowest quintile definitions did not associate with falls history in both adjusted and unadjusted models. However, both definitions appeared to be significantly (p < 0.05) associated with moderate/severe disability, moderate/severe functional impairment, lower lifestyle activities, lower mobility, and lower muscle mass in the unadjusted model. After adjusting for potential confounding factors, the lowest quintile definition still remained associated (p < 0.05) with all the aforementioned outcomes. However, when low HGS was defined using the AWGS 2019-suggested cut-off, low HGS was significantly (p < 0.05) associated with disability, functional impairment, lifestyle activities, and mobility outcomes, but not with low muscle mass outcomes. Overall, the prevalence of low HGS was higher using the AWGS 2019 definition than the lowest quintile definition, and both definitions were well-associated with the sarcopenic-related outcomes.
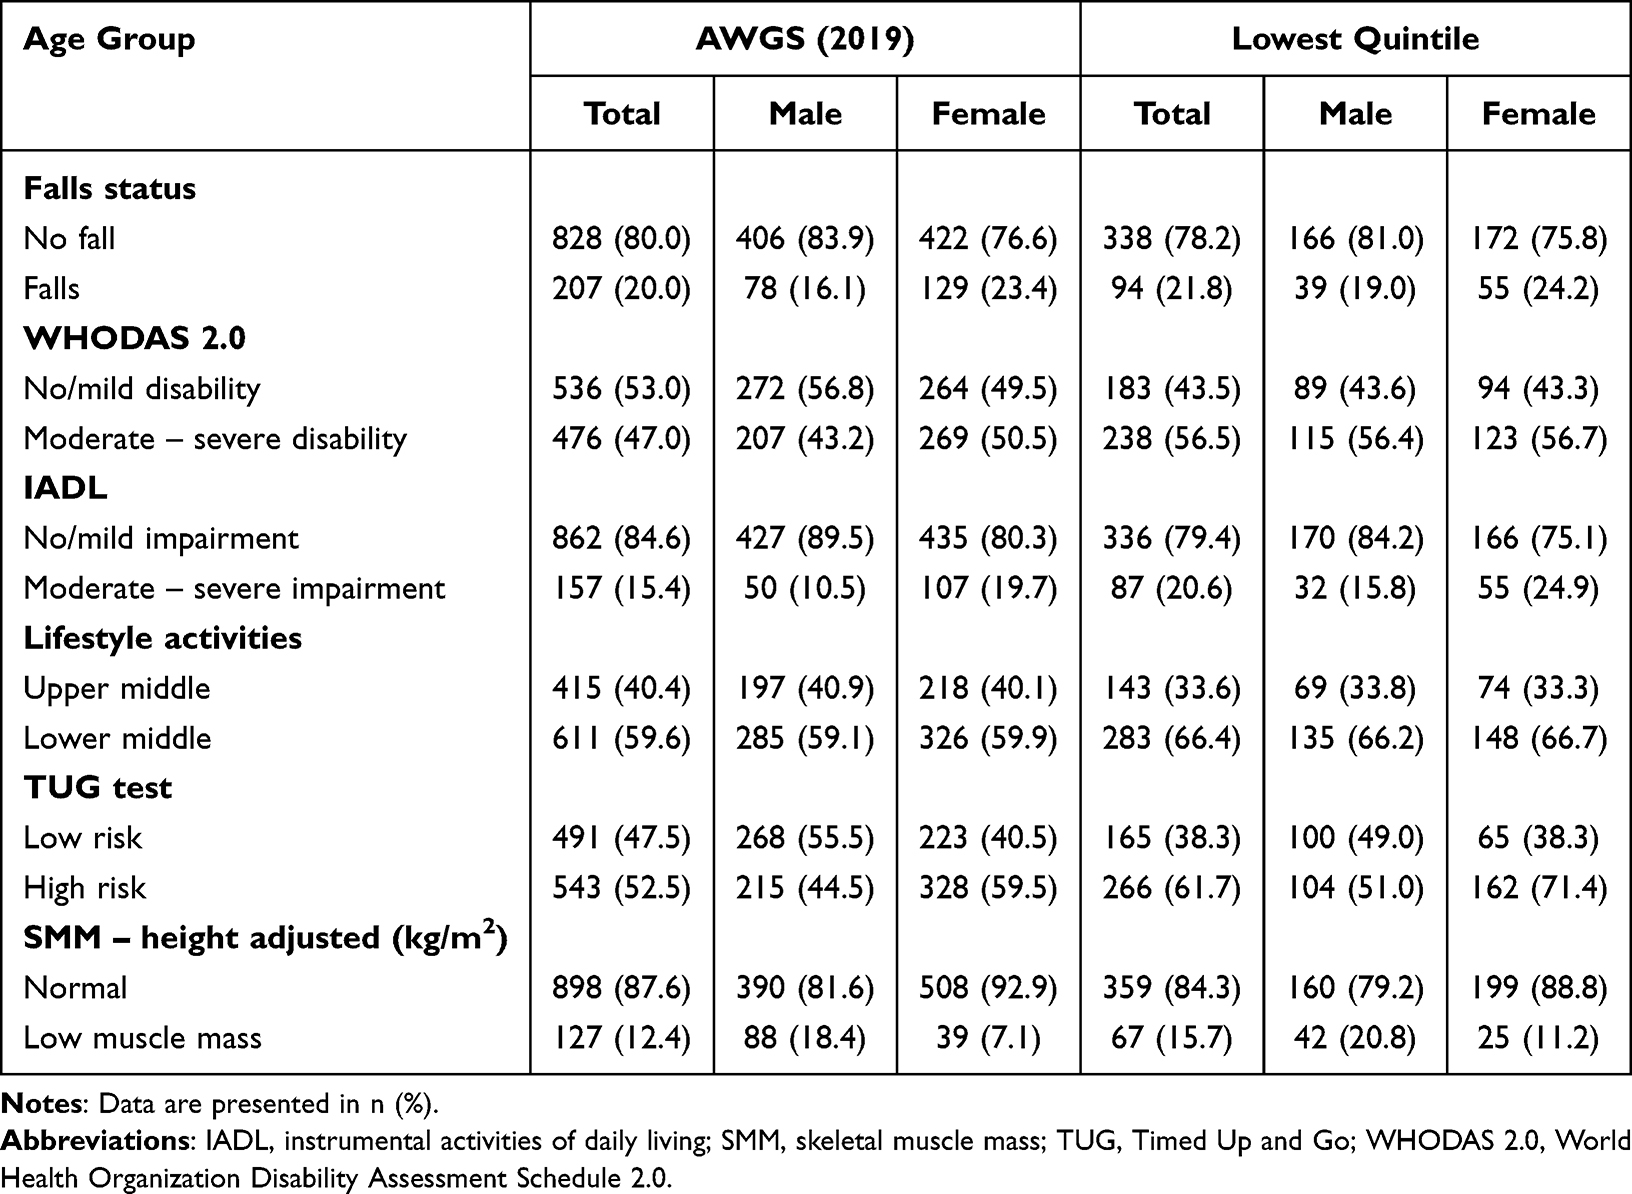 |
Table 4 The Outcome Measurements Associated with the Prevalence of Low HGS Derived from Different Definitions |
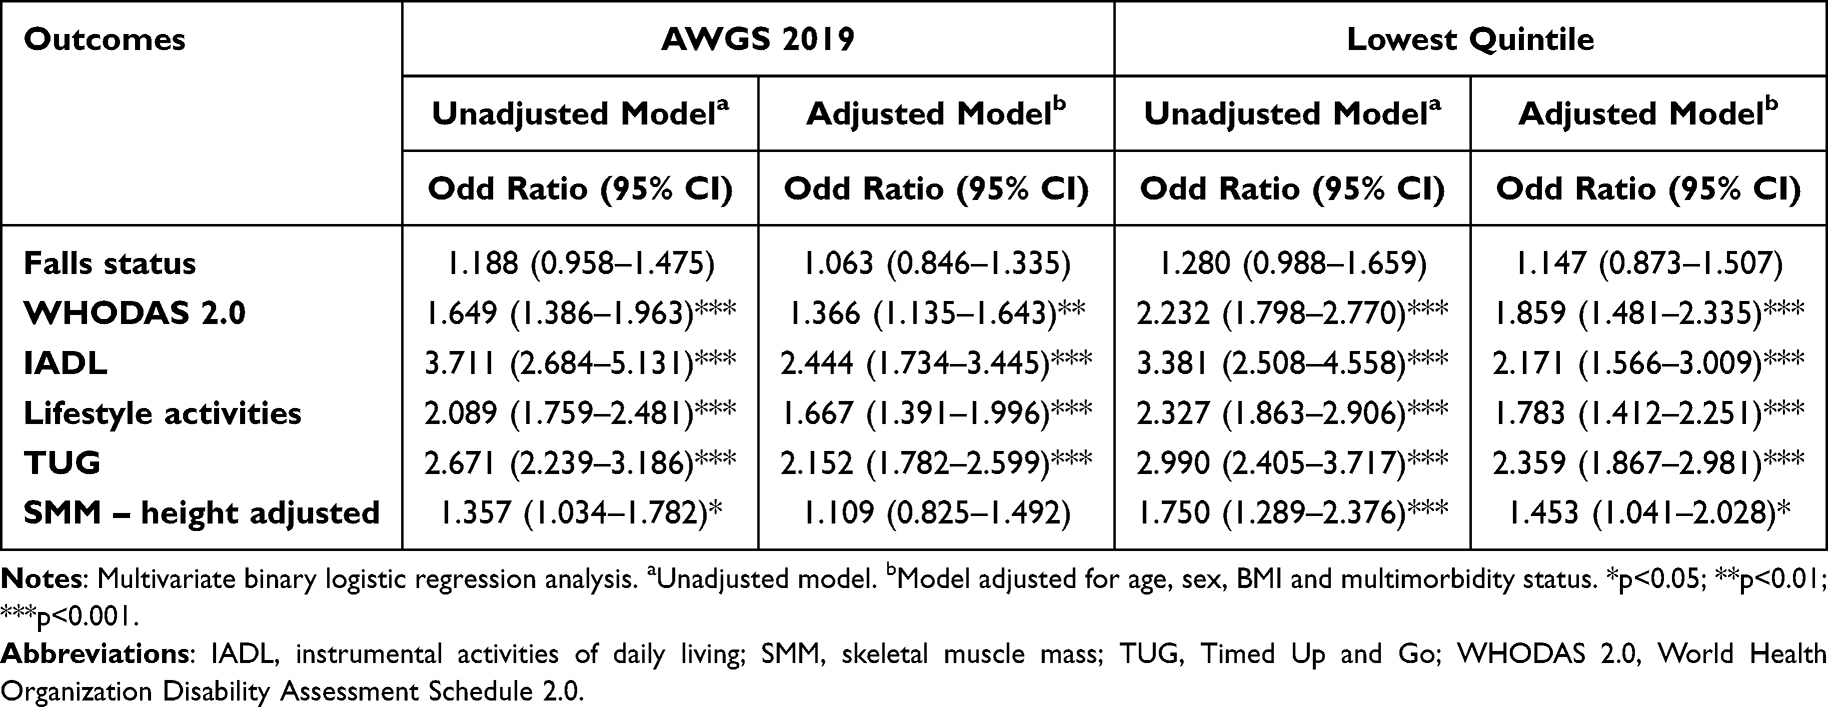 |
Table 5 The Associations Between Various Sarcopenic Related Outcomes with Low HGS as Derived Using the AWGS 2019 and Lowest Quintile Definition |
Discussion
Handgrip strength (HGS) is a well-established indicator of overall muscle strength and functional capacity in older adults. Although Malaysian reference values have been previously reported12,21 their generalizability is limited by restricted age ranges, ethnic homogeneity, and small, locality-specific samples.21,22 The present study addresses these gaps by providing age- and sex-specific percentile reference values for both absolute and body weight-normalized HGS derived from a large, nationally representative cohort of Malaysian adults aged ≥60 years. These data offer robust population-specific benchmarks to support early identification of muscle weakness and enable meaningful cross-national comparisons.
Consistent with existing evidence, we observed a progressive decline in absolute HGS with advancing age in both sexes, reflecting the combined effects of sarcopenia, neuromuscular degeneration, chronic disease burden, and lifestyle factors.1,2,23–27 Normalized HGS demonstrated a distinct trajectory, peaking at 65–69 years in men and remaining relatively stable between 60–74 years in women, suggesting that early declines in absolute strength may partly reflect reductions in body mass. Subsequent declines in normalized HGS likely indicate compounded effects of comorbidities and neuromuscular dysfunction, supported by our finding that individuals with chronic conditions and poorer functional status exhibited lower HGS.1,25 However, causal directionality cannot be established within this cross-sectional design.
Sex differences were pronounced, with men demonstrating consistently higher absolute and normalized HGS across all age groups, likely reflecting differences in muscle mass, hormonal profiles, and physical activity patterns.28–32 Notably, the rate of decline was steeper in men, consistent with evidence of accelerated age-related muscle loss and testosterone decline, whereas women exhibit a more stabilized trajectory post-menopause.33–36 These findings highlight important sex-specific ageing patterns that should inform interpretation of HGS and related risk stratification.
The prevalence of low HGS was substantially higher when applying AWGS 2019 criteria (47.5%) compared to population-specific thresholds (19.8%). Regionally, Malaysian HGS values were lower than those reported in several East Asian populations but comparable to Singapore and China and higher than some Southeast Asian countries, reflecting underlying differences in socioeconomic, lifestyle, and health factors.9,37–48 Population-specific cutoffs derived from the lowest quintile (<22.8 kg for men; <13.8 kg for women) were markedly lower than AWGS 2019 thresholds. While both definitions were associated with sarcopenia-related outcomes, including disability and reduced mobility, AWGS criteria did not retain association with low muscle mass after adjustment. These findings suggest that AWGS 2019 may enhance sensitivity for case detection, whereas population-specific thresholds may better reflect local distributions of strength. However, their relative clinical utility remains to be established.
Strengths of this study include its large, nationally representative sample and the application of LMS methodology to generate robust normative curves. Limitations include the cross-sectional design, which precludes causal inference and assessment of predictive validity, and the absence of ethnic-specific analyses in a multiethnic population. Future longitudinal and stratified studies are needed to refine these reference standards and determine their prognostic relevance.
In summary, HGS declines with age among Malaysian older adults, with marked sex differences and substantial variation depending on the definition of low strength. The normative values presented here provide important context-specific benchmarks for identifying individuals at risk of functional decline. However, the application of international versus population-specific cutoffs should be interpreted cautiously, pending longitudinal validation of their predictive and clinical utility.
Data Sharing Statement
The data that support the findings of this study are available from the corresponding author upon reasonable request.
Ethics Approval and Informed Consent
Ethical approval was obtained from the Medical Research and Ethics Committee of Universiti Kebangsaan Malaysia (UKM 1.5.3.5/244/NN-060-2013), and the study was conducted in accordance with the Declaration of Helsinki. Eligible participants who agreed to participate signed the informed consent form.
Acknowledgments
Reproduced by special permission of the Publisher, Psychological Assessment Resources, Inc., 16204 North Florida Avenue, Lutz, Florida 33549, from the Mini Mental State Examination, by Marshal Folstein and Susan Folstein, Copyright 1975, 1998, 2001 by Mini Mental LLC, Inc. Published 2001 by Psychological Assessment Resources, Inc. Further reproduction is prohibited without permission of PAR, Inc. The MMSE can be purchased from PAR, Inc. by calling +1 (813) 968-3003.
Author Contributions
All authors made a significant contribution to the work reported, whether that is in the conception, study design, execution, acquisition of data, analysis and interpretation, or in all these areas; took part in drafting, revising, or critically reviewing the article; gave final approval of the version to be published; agreed on the journal to which the article has been submitted; and agree to be accountable for all aspects of the work.
Funding
This work was supported by the Long-term Research Grant Scheme provided by the Ministry of Higher Education Malaysia (LRGS/1/2019/UM-UKM/1/4 and LRGS/BU/2012/UKM-UKM/K/01).
Disclosure
The authors declare no conflicts of interest in this work.
References
1. Papadopoulou SK. Sarcopenia: a contemporary health problem among older adult populations. Nutrients. 2020;12(5):1293. doi:10.3390/nu12051293
2. Larsson L, Degens H, Li M, et al. Sarcopenia: ageing-related loss of muscle mass and function. Physiol Rev. 2019;99(1):427–12. doi:10.1152/physrev.00061.2017
3. Damluji AA, Alfaraidhy M, AlHajri N, et al. Sarcopenia and cardiovascular diseases. Circulation. 2023;147(20):1534–1553. doi:10.1161/CIRCULATIONAHA.123.064071
4. Hunter GR, Singh H, Carter SJ, Bryan DR, Fisher G. Sarcopenia and its implications for metabolic health. J Obes. 2019;2019:8031705. doi:10.1155/2019/8031705
5. Bohannon RW. Grip strength: an indispensable biomarker for older adults. Clin Interv Aging. 2019;14:1681–1691. doi:10.2147/CIA.S194543
6. Jeong W, Moon JY, Kim JH. Association of absolute and relative hand grip strength with all-cause mortality. BMC Geriatr. 2023;23(1):321. doi:10.1186/s12877-023-04008-8
7. McGrath R, Johnson N, Klawitter L, et al. Association patterns between handgrip strength and adverse health conditions. SAGE Open Med. 2020;8:2050312120910358. doi:10.1177/2050312120910358
8. Yeung SSY, Reijnierse EM, Pham VK, et al. Sarcopenia and its association with falls and fractures: a systematic review and meta-analysis. J Cachexia, Sarcopenia Muscle. 2019;10(3):485–500. doi:10.1002/jcsm.12411
9. Auyeung TW, Arai H, Chen LK, Woo J. Normative data of handgrip strength in 26,344 older adults: a pooled dataset from eight cohorts in Asia. J Nutr Health Aging. 2020;24(1):125–126. doi:10.1007/s12603-019-1287-6
10. Leong DP, Teo KK, Rangarajan S, et al. Reference ranges of handgrip strength from 125,462 healthy adults in 21 countries (PURE study). J Cachexia, Sarcopenia Muscle. 2016;7(5):535–546. doi:10.1002/jcsm.12112
11. Lau H, Shahar S, Hussin N, et al. Methodological approaches and challenges in a population-based longitudinal study of a neuroprotective model for healthy longevity. Geriatr Gerontol Int. 2019;19(3):233–239. doi:10.1111/ggi.13598
12. Shahar S, Omar A, Vanoh D, et al. Methodological approaches in a population-based longitudinal study of healthy longevity among Malaysian older adults. Ageing Clin Exp Res. 2016;28(6):1089–1104. doi:10.1007/s40520-015-0511-4
13. Ooi TC, Singh DKA, Shahar S, et al. Incidence and multidimensional predictors of occasional and recurrent falls among Malaysian community-dwelling older persons. BMC Geriatr. 2021;21(1):154. doi:10.1186/s12877-021-02103-2
14. Hussin NM, Shahar S, Din NC, et al. Incidence and predictors of multimorbidity among a multiethnic population in Malaysia: a community-based longitudinal study. Ageing Clin Exp Res. 2019;31(2):215–224. doi:10.1007/s40520-018-1007-9
15. Chen LK, Woo J, Assantachai P, et al. Asian Working Group for Sarcopenia: 2019 consensus update on sarcopenia diagnosis and treatment. J Am Med Dir Assoc. 2020;21(3):300–307.e2. doi:10.1016/j.jamda.2019.12.012
16. Ibrahim A, Singh DKA, Shahar S, Omar A. Timed up and go test combined with self-rated multifactorial questionnaire predicts falls better than the timed up and go test alone. J Multidiscip Healthc. 2017;10:409–416. doi:10.2147/JMDH.S142520
17. Petersen RC, Caracciolo B, Brayne C, et al. Mild cognitive impairment: a concept in evolution. J Intern Med. 2014;275(3):214–228. doi:10.1111/joim.12190
18. Lee LK, Shahar S, Chin AV, Mohd yusoff NA, Rajab N, Aziz SA. Prevalence of gender disparities and predictors affecting the occurrence of mild cognitive impairment. Arch Gerontol Geriatr. 2012;54(1):185–191. doi:10.1016/j.archger.2011.03.015
19. Rigby RA, Stasinopoulos DM. Automatic smoothing parameter selection in GAMLSS with an application to centile estimation. Stat Methods Med Res. 2014;23(4):318–332. doi:10.1177/0962280212473302
20. Chen LK, Liu LK, Woo J, et al. Sarcopenia in Asia: consensus report of the Asian Working Group for Sarcopenia. J Am Med Dir Assoc. 2014;15(2):95–101. doi:10.1016/j.jamda.2013.11.025
21. Lam N, Goh HT, Kamaruzzaman S, et al. Normative data for handgrip strength and key pinch strength in a multi-ethnic Asian population. Singapore Med J. 2016;57(10):1–21. doi:10.11622/smedj.2015164
22. Jaafar MH, Ismail R, Ismail NH, et al. Normative reference values and predicting factors of handgrip strength among healthy Malay adults in Malaysia. BMC Musculoskelet Disord. 2023;24(1):74. doi:10.1186/s12891-023-06181-8
23. Wilkinson DJ, Piasecki M, Atherton PJ. Age-related loss of skeletal muscle mass and function. Ageing Res Rev. 2018;47:123–132. doi:10.1016/j.arr.2018.07.005
24. Miljkovic N, Lim JY, Miljkovic I, Frontera WR. Ageing of skeletal muscle fibers. Ann Rehabil Med. 2015;39(2):155–162. doi:10.5535/arm.2015.39.2.155
25. Hunter SK, Pereira HM, Keenan KG. The ageing neuromuscular system and motor performance. J Appl Physiol. 2016;121(4):982–995. doi:10.1152/japplphysiol.00475.2016
26. Ganapathy A, Nieves JW. Nutrition and sarcopenia—what do we know? Nutrients. 2020;12(6):1755. doi:10.3390/nu12061755
27. Meier NF, Lee D. Physical activity and sarcopenia in older adults. Ageing Clin Exp Res. 2020;32(9):1675–1687. doi:10.1007/s40520-019-01371-8
28. Haizlip KM, Harrison BC, Leinwand LA. Sex-based differences in skeletal muscle kinetics and fiber-type composition. Physiology. 2015;30(1):30–39. doi:10.1152/physiol.00024.2014
29. Nuzzo JL, Freitas TT, Franquesa X, Enrich E, Mallol M, Alcaraz PE. Narrative review of sex differences in muscle strength, endurance, activation, size, fiber type, and strength training participation. J Strength Cond Res. 2023;37(2):e1–e18. doi:10.1519/JSC.0000000000004296
30. Chiu HT, Shih MT, Chen WL. Examining the association between grip strength and testosterone. Ageing Male. 2020;23(5):915–922. doi:10.1080/13685538.2019.1632282
31. JdeJ R, Fonseca-Sanchez MA, Rodriguez P, et al. Physical activity protects men but not women for sarcopenia development. Gerontol Geriatr Med. 2016;2:2333721416667879. doi:10.1177/2333721416667879
32. Ramsey KA, Rojer AGM, D’Andrea L, et al. Physical activity and sedentary behavior in relation to muscle strength in older adults: a systematic review and meta-analysis. Ageing Res Rev. 2021;67:101266. doi:10.1016/j.arr.2021.101266
33. Du Y, Wang X, Xie H, et al. Sex differences in the prevalence and adverse outcomes of sarcopenia and sarcopenic obesity in community-dwelling elderly in East China using the AWGS criteria. BMC Endocr Disord. 2019;19(1):109. doi:10.1186/s12902-019-0432-x
34. Mitchell W, Atherton P, Williams J, et al. Sarcopenia, dynapenia, and the impact of advancing age on human skeletal muscle size and strength: a quantitative review. Front Physiol. 2012;3:260. doi:10.3389/fphys.2012.00260
35. Priego T, Martín AI, González-Hedström D, Granado M, López-Calderón A. Role of hormones in sarcopenia. In Vitamins and Hormones. Litwack G editor. Academic Press; 2021;Vol. 115:535–570. doi:10.1016/bs.vh.2020.12.021
36. Jiang J, Chen S, Chen J, et al. Serum IGF-1 levels are associated with sarcopenia in elderly men but not women. Ageing Clin Exp Res. 2022;34(10):2465–2471. doi:10.1007/s40520-022-02180-2
37. Auyeung TW, Lee SWJ, Leung J, Kwok T, Woo J. Age-associated decline of muscle mass, grip strength and gait speed: a 4-year longitudinal study of 3018 community-dwelling older Chinese. Geriatr Gerontol Int. 2014;14(Suppl 1):76–84. doi:10.1111/ggi.12213
38. Chan J, Lu YC, Yao MMS, Kosik RO. Correlation between hand grip strength and regional muscle mass in older Asian adults: an observational study. BMC Geriatr. 2022;22(1):206. doi:10.1186/s12877-022-02898-8
39. Chung PK, Zhao Y, Liu JD, Quach B. Functional fitness norms for community-dwelling older adults in Hong Kong. Arch Gerontol Geriatr. 2016;65:54–62. doi:10.1016/j.archger.2016.03.006
40. Lee YL, Lee BH, Lee SY. Handgrip strength in the Korean population: normative data and cutoff values. Ann Geriatr Med Res. 2019;23(2):53–60. doi:10.4235/agmr.19.0004
41. Pan PJ, Lin CH, Yang NP, et al. Normative data and associated factors of hand grip strength among elderly individuals: the Yilan Study, Taiwan. Sci Rep. 2020;10(1):6611. doi:10.1038/s41598-020-63713-1
42. Seino S, Shinkai S, Fujiwara Y, et al. Reference values and age and sex differences in physical performance measures for community-dwelling older Japanese. PLoS One. 2014;9(6):e99487. doi:10.1371/journal.pone.0099487
43. Afable SB, Cruz G, Saito Y, Malhotra R. Normative values of hand grip strength of older Filipinos aged 60 to 85 years. Ageing Health Res. 2022;2(4):100108. doi:10.1016/j.ahr.2022.100108
44. Pengpid S, Peltzer K. Hand grip strength and its sociodemographic and health correlates among older adults in Indonesia. Curr Gerontol Geriatr Res. 2018;2018:3265041. doi:10.1155/2018/3265041
45. He H, Pan L, Wang D, et al. Normative values of hand grip strength in a large unselected Chinese population: evidence from the China National Health Survey. J Cachexia, Sarcopenia Muscle. 2023;14(3):1312–1321. doi:10.1002/jcsm.13223
46. Malhotra R, Ang S, Jc AJ, et al. Normative values of hand grip strength for elderly Singaporeans aged 60–89 years. J Am Med Dir Assoc. 2016;17(9):864.e1–864.e7. doi:10.1016/j.jamda.2016.06.013
47. Ong HL, Abdin E, Chua BY, et al. Hand-grip strength among older adults in Singapore: comparison with international norms and associative factors. BMC Geriatr. 2017;17(1):176. doi:10.1186/s12877-017-0565-6
48. Yu R, Ong S, Cheung O, Leung J, Woo J. Reference values of grip strength and prevalence of low grip strength in Chinese adults. J Am Med Dir Assoc. 2017;18(6):551.e9–551.e16. doi:10.1016/j.jamda.2017.03.006
 © 2026 The Author(s). This work is published and licensed by Dove Medical Press Limited. The
full terms of this license are available at https://www.dovepress.com/terms
and incorporate the Creative Commons Attribution
- Non Commercial (unported, 4.0) License.
By accessing the work you hereby accept the Terms. Non-commercial uses of the work are permitted
without any further permission from Dove Medical Press Limited, provided the work is properly
attributed. For permission for commercial use of this work, please see paragraphs 4.2 and 5 of our Terms.
© 2026 The Author(s). This work is published and licensed by Dove Medical Press Limited. The
full terms of this license are available at https://www.dovepress.com/terms
and incorporate the Creative Commons Attribution
- Non Commercial (unported, 4.0) License.
By accessing the work you hereby accept the Terms. Non-commercial uses of the work are permitted
without any further permission from Dove Medical Press Limited, provided the work is properly
attributed. For permission for commercial use of this work, please see paragraphs 4.2 and 5 of our Terms.
Recommended articles
Factors Associated with Handgrip Strength Among Older Adults in Malaysia
Shah SA, Safian N, Mohammad Z, Nurumal SR, Wan Ibadullah WAH, Mansor J, Ahmad S, Hassan MR, Shobugawa Y
Journal of Multidisciplinary Healthcare 2022, 15:1023-1034
Published Date: 10 May 2022
Physical Activity Mediates the Relationship Between Sarcopenia and Cognitive Function Among Older Adults in Nursing Homes
Yao X, Liu B, Hua N, Huang J, Zhao X
Clinical Interventions in Aging 2023, 18:1863-1871
Published Date: 13 November 2023
Imaging of Sarcopenia in Type 2 Diabetes Mellitus
Wang D, Zhang G, Yu Y, Zhang Z
Clinical Interventions in Aging 2024, 19:141-151
Published Date: 26 January 2024
Four-Step Co-Designing of the Reablement Strategies Targeting Sarcopenia (ReStart-S): An Exercise-Based Multicomponent Program for Older Adults Residing in Long-Term Care Settings
Kumar P, Umakanth S, Marzetti E, Kalra S, N G
Journal of Multidisciplinary Healthcare 2024, 17:1415-1433
Published Date: 28 March 2024
Semaglutide Therapy and Accelerated Sarcopenia in Older Adults with Type 2 Diabetes: A 24-Month Retrospective Cohort Study
Ren Q, Zhi L, Liu H
Drug Design, Development and Therapy 2025, 19:5645-5652
Published Date: 3 July 2025