Back to Journals » Journal of Multidisciplinary Healthcare » Volume 15
Factors Associated with Handgrip Strength Among Older Adults in Malaysia
Authors Shah SA, Safian N, Mohammad Z ![]() , Nurumal SR, Wan Ibadullah WAH, Mansor J, Ahmad S
, Nurumal SR, Wan Ibadullah WAH, Mansor J, Ahmad S ![]() , Hassan MR, Shobugawa Y
, Hassan MR, Shobugawa Y ![]()
Received 14 March 2022
Accepted for publication 28 April 2022
Published 10 May 2022 Volume 2022:15 Pages 1023—1034
DOI https://doi.org/10.2147/JMDH.S363421
Checked for plagiarism Yes
Review by Single anonymous peer review
Peer reviewer comments 2
Editor who approved publication: Dr Scott Fraser
Shamsul Azhar Shah,1 Nazarudin Safian,1 Zulkefley Mohammad,1 Siti Rohani Nurumal,1 Wan Abdul Hannan Wan Ibadullah,1 Juliana Mansor,1 Saharuddin Ahmad,2 Mohd Rohaizat Hassan,1 Yugo Shobugawa3
1Department of Community Health, Faculty of Medicine, Universiti Kebangsaan Malaysia, Cheras, Kuala Lumpur, 56000, Malaysia; 2Department of Family Medicine, Faculty of Medicine, Universiti Kebangsaan Malaysia, Cheras, Kuala Lumpur, 56000, Malaysia; 3Department of Active Aging, Niigata University Graduate School of Medical and Dental Sciences, Niigata, 951-8510, Japan
Correspondence: Shamsul Azhar Shah, Department of Community Health, Faculty of Medicine, Universiti Kebangsaan Malaysia, Cheras, Kuala Lumpur, 56000, Malaysia, Tel +60 3-9145 8787, Fax +60 3-91456670, Email [email protected]
Purpose: Handgrip strength (HGS) is indicative of overall physical health among older adults. A decrease in HGS may be associated with an increased risk of disease. The aim of this study is to determine the factors associated with HGS among older adults in Malaysia.
Patients and Methods: One thousand two hundred four (1204) participants from urban and rural areas in Selangor state, Malaysia, were recruited. Sociodemographic and health-related conditions were gathered through a comprehensive face-to-face interview, followed by HGS assessments by a handgrip dynamometer. Subsequently, multiple linear regression was used to test the main association with the HGS.
Results: A total of 691 participants (57.4%) were male, and 513 (42.6%) were female. Males had a mean HGS of 30.0 (SD 7.53) kg, and females had a mean HGS of 19.4 (SD 5.28) kg. Males’ handgrip strength was significantly reduced with increasing age, physically inactive, and diabetes (all at the level p< 0.001) after adjusting for social-demographic characteristics and health-related variables. Meanwhile, for females, the HGS was significantly decreased with age (p< 0.001), physically inactive (p< 0.001) and hypertension (p=0.03). However, female HGS was positively related to BMI (p< 0.001).
Conclusion: The study contributed to a better understanding of factors associated with HGS, and thus, the HGS is recommended as a section in the health evaluation among high-risk older adults as the strategy of disease control and prevention.
Keywords: handgrip strength, elderly, risk factors
Introduction
Muscle strength is an essential determinant of healthy ageing, and it has a significant association with the development of disability and mortality risk.1 Men’s muscle strength appears to be greater than women’s due to larger fibres.2 Meanwhile, muscle weakness typically develops first in older women due to loss of muscle strength, which starts in middle age.3 In general, a decrease in muscle strength has been shown to impair normal bodily function. Muscle deterioration occurs as a result of the ageing process, physical inactivity, and malnutrition in older adults. In contrast, if older adults were empowered with knowledge and education regarding a healthy diet and regular physical activity, reduced muscle strength could be counteracted and improved despite the physiological ageing process.4 A study has shown that improved physical activity and resistance exercise enhance older adults’ muscle strength and function, even if they are burdened with severe disability.5
Currently, one of the simplest and most accessible methods of determining muscle strength is the handgrip strength (HGS) test. Numerous scientific studies have established a significant correlation between handgrip strength and other muscle strength in both healthy individuals and older adults with some form of pathology. For example, a study among 70 years older adults showed handgrip is a valid method for lower limb muscle strength.6 Therefore, this practical measurement of handgrip strength is widely used as a single indicator of overall muscle strength, especially in older adults.7,8 At the same time, the link was established between HGS and health, including non-communicable diseases (NCDs). According to a recent study conducted in 17 countries with 139,691 participants shown, 2% of patients (3379) died in the median follow up of 4.0 years. The result showed that the HGS level was inversely related to all-cause mortality, myocardial infarction, and stroke. It also mentioned that all causes and cardiovascular mortality are better predictors of HGS than systolic blood pressure.9 Furthermore, the disease status among 5271 respondents aged more than 45 years old in previous literature mentioned that those having higher HGS had a lower risk of hypertension and dyslipidemia in males while dyslipidemia among females.10 In terms of sociodemographic such as age study in Sri Lanka among 999 respondents had shown the lower HGS associated with older adult age in both genders more than 60 years old.11 On the other hand, a physically active lifestyle increases HGS measurement and acts as a predictor of physical functioning and for a better quality of life among the older adult.12
Handgrip dynamometers are widely used to measure maximum isometric HGS with excellent intertester and test-retest reliability.13 Low HGS is commonly indicative of weak upper extremity strength and lower extremity function.14 In the older adults’ population, weak muscle strength is usually observed as reduced mobility and increased dependency in their activities of daily living and is predictive of body function and mortality.15 Indeed, HGS is considered a reliable measure of physical decline and future outcomes among the older adults’ population.15
Not many studies have been conducted on HGS as a general health measurement among Malaysia’s older adults’ population. Indirectly, this may result from a lack of usage of handgrip measurements in clinical practice. Previous studies involving a small sample of Malaysian older adults showed that men were significantly stronger than women in HGS.16–18 The HGS was positively associated with body mass index (BMI) and functional ability while negatively associated with depression for both sexes.17 Since gender is the known associated factor with HGS, therefore, this study was carried out to determine the factors associated with HGS in a large older adults’ population coinciding with the gender differences. This is important as the approach later in public health intervention among male and female older adults pertaining to their related factors. As a result of this study, we expect that HGS will be integrated into older adults’ assessments in the clinical setting.
Materials and Methods
Study Design
A cross-sectional study design was conducted in Selangor, Malaysia, from 1 December 2018 until 30 April 2020. The study’s design, sampling method and questionnaire used were identical to those described by Shah et al.19 Selangor is located on Peninsular Malaysia’s west coast and was chosen as the study location because it is Malaysia’s most populous state. Following that, two districts within Selangor, Hulu Langat and Kuala Selangor, were chosen to represent urban and rural areas, respectively. We sampled participants using a multistage cluster sampling technique. The primary sampling unit is the district, and the secondary sampling unit is the sub-district. Six sub-districts from Hulu Langat (which has seven sub-districts) and Kuala Selangor (which has nine subdistricts) were selected. At the third sampling stage, ten towns/villages were randomly selected from each sub-district.
The household ledgers for the selected areas were obtained and were used as the sampling frame for households and individuals. Subsequently, a random sampling of households with an older person from the selected areas was conducted. The sample size was calculated using a Kish formula  where Z is the level of confidence, p is the prevalence of “good health” among older persons, and e is the margin of error. Using Z = 1.96, p = 0.3 (estimate obtained from a previous study conducted on older adults in Japan),20 and e = 0.05, the initial calculation for sample size was 322. This initial sample size was then multiplied by the 1.5 design effect and the two groups of estimates desired for the survey results (urban and rural), yielding a final figure of 966. Finally, 966 was divided by 0.80 to account for a 20% non–response rate. The final sample size calculation resulted in a total sample size of 1207. The inclusion criteria for the participants were: (1) aged 60 and over; (2) the ability to converse in Malay or English; (3) able to understand the research and agrees to cooperate; (4) registered residents of Malaysia (as household ledgers were used as the sampling frame); and (5) living at home.
The Research Ethics Committee of the National University of Malaysia has approved this study (FF-2018-532). The study was conducted in accordance with the principles of the Declaration of Helsinki, whereby participation was entirely at the discretion of the individuals involved. First, an explanation of the study and information sheets were given to each respondent. Then, once the respondents understood and gave consent, trained research assistants conducted face-to-face interviews.
Handgrip Strength
Handgrip strength (HGS) was measured in kilograms (kg) using a handgrip dynamometer model T.K.K. 5001 GRIP-A from Takei Scientific Instrument Co. Ltd. (Japan). The respondents were standing with their hands at their sides in a neutral position. The inner lever of the dynamometer was adjusted to fit the hand, and the respondents were instructed to squeeze the dynamometer as hard as possible for a few seconds. According to studies, a standing position with a straight elbow produces the highest grip strength readings.21,22 The trained research assistants measured the HGS twice in each respondent’s dominant hand, taking the mean for data analysis. The mean was calculated like the study conducted on the older Malaysian population.16
Independent Variables
Demographic variables included age, sex, marital status, household composition and education level. The household income was categorized into three groups based on the 2019 income structure of the Department of Statistics of Malaysia. The lower-income group earn less than RM4850 monthly, while middle-income group make between RM4851 and RM10,959. Lastly, higher-income group earn more than RM10,959.23
The study included smoking, alcohol consumption, and physical activity as lifestyle factors. Smoking and alcohol consumption were categorized into dichotomous variables, ie, “yes” forever smoking/alcohol consumption and “no” for never smoking/consuming alcohol. Physical activity for older adults was evaluated through three questions that assessed the intensity of the physical activities, including strenuous, moderate, and light physical activities. Each question has six options of answers to evaluate the frequency of the activities. A participant who achieved the following requirement were categorized as physically active; (1) Once a week of strenuous activities such as running, swimming, cycling, tennis, exercise at the gym, mountain climbing, or (2) Two to three times a week of moderate physical activities such as brisk pace walking, dancing, gymnastics, golf, farming, gardening, car washing; or (3) four or more times a week of light physical activities such as stretching/callisthenics workout, bowling, walking to shops or the station, or doing laundry. The questions have been adopted from the Bahasa Malaysia version of the Japan Gerontological Evaluation Study (BM-JAGES) questionnaire.24
The body mass index (BMI) was calculated using measurements of weight and height. The Malaysian BMI classification was used as a reference,25 whereby the cut of points for obese is 27.5kg/m2. Thus, we categorized the BMI into two groups that were non-obese (<27.5 kg/m2) and obese (≥27.5 kg/m2). Respondents have also been asked if they had hypertension, diabetes, dyslipidemia, heart disease, stroke, or cancer. The answer was either yes or no, and it was solely dependent on the respondent’s reply. Additionally, we assessed depressive symptoms in older adults using the 15-item Geriatric Depression Scale (GDS). The GDS score is a numeric value between 0 and 15, with a higher value indicating more severe symptoms. A score of fewer than 5 points indicates no depression.26
Data Analyses
First, we checked the continuous data for normality using Kolmogorov–Smirnov (K-S) test. Then, the mean difference of HGS between groups of categorical variables was analyzed using the independent sample t-test or one-way analysis of variance (ANOVA). Post hoc Bonferroni tests were used for the ANOVA test when homogeneity of variance assumptions was met. Meanwhile, a value from Welch’s ANOVA test was used for any violation of homogeneity of variance. Subsequently, post hoc Tamhane’s test was used for within-group comparison.
Meanwhile, analysis of covariance (ANCOVA) was used to measure age-adjusted HGS. Age-adjusted was used to get relative HGS measurement when comparing the HGS between sex and other independent variables. Simple linear regression was used to estimate the relationship between two quantitative variables. The BMI was included as a continuous variable. Meanwhile, household income was a categorical variable as it was not normally distributed.
Multiple linear regression was used for multivariable analysis to test the main association with the HGS. The variables included in the regression model were age (as continuous data), sex, sociodemographic (marital status and education level), socioeconomic (employment status and household income), health-related behaviors (smoking status, alcohol consumption status, betel chewing status and physical activity), and NCDs (BMI, hypertension, diabetes and depression). The enter method of linear regression was used for multivariable analysis. In addition, we check interaction and multicollinearity. Variation inflation factor (VIF) was used for multicollinearity checking, whereby residual plot was used to check model assumption. A P-value of less than 0.05 was considered to indicate significance in all tests. Analyses were performed using IBM SPSS version 21.0 (IBM Corp., Armonk, NY, USA).
Results
Sociodemographic Characteristics
The majority of participants (83.2%) were Malay, followed by Indians (9.0%), Chinese (7.5%), and others (0.3%). The participants ranged in age from 60 to 91 years, with a mean of 68.7 (SD 6.36) years. Age was further classified into three age groups, and the overall older age group was significantly associated with lower handgrip strength (HGS) (p<0.001). Males (57.4%) outnumbered females (42.6%) slightly. There was a significant difference in mean HGS between males (30.0 kg (SD 7.5)) and females (19.4 kg (SD 5.28)) (p<0.001). After controlling for age, the mean HGS for males was 29.8 kg (95% CI; 29.31, 30.20). Meanwhile, the mean HGS for females was 19.6 kg (95% CI: 19.08, 20.12). The age-adjusted mean difference of HGS between males and females was 10.2 kg (95% CI:9.48, 10.84; p<0.001). Most participants were married and lived with their spouses (65.6%). Meanwhile, the number of married respondents who lived separately was too small [n=12, (1.0%)]. Thus, we have combined the two groups into one category, ie, married. Our study discovered that higher HGS among older people was significantly associated with marital status (p<0.001). Married respondents have significantly higher HGS than unmarried, widowed, or divorced respondents. Most participants lived with family members (94.7%), and high HGS was significantly associated with living with family members over living alone (p<0.001). However, the within-sex analysis revealed no significant relationship between HGS and household composition. Regarding educational level, 10% of participants had no formal education, 45.2% had a primary school education, 35.4% had a secondary school education, and 9.4% had studied at the tertiary level, including university and college. Those who studied at the tertiary level had a significantly higher HGS than those who had no school, primary and secondary level (p<0.001). A significant proportion of participants (86.0%) were unemployed, including pensioners and those who have never had a job. Those who were employed had a significantly higher HGS than those who were unemployed (p<0.001). Finally, when it comes to household income, most older adults (90.9%) fall into the low-income category. Those in the lower-income group had a significantly lower HGS than those in the middle income (p<0.001). However, there was no significant difference when comparing the HGS in the income group by sex. Table 1 shows the overall sociodemographic characteristics and health-related behaviours of the respondents, including the differences according to sex.
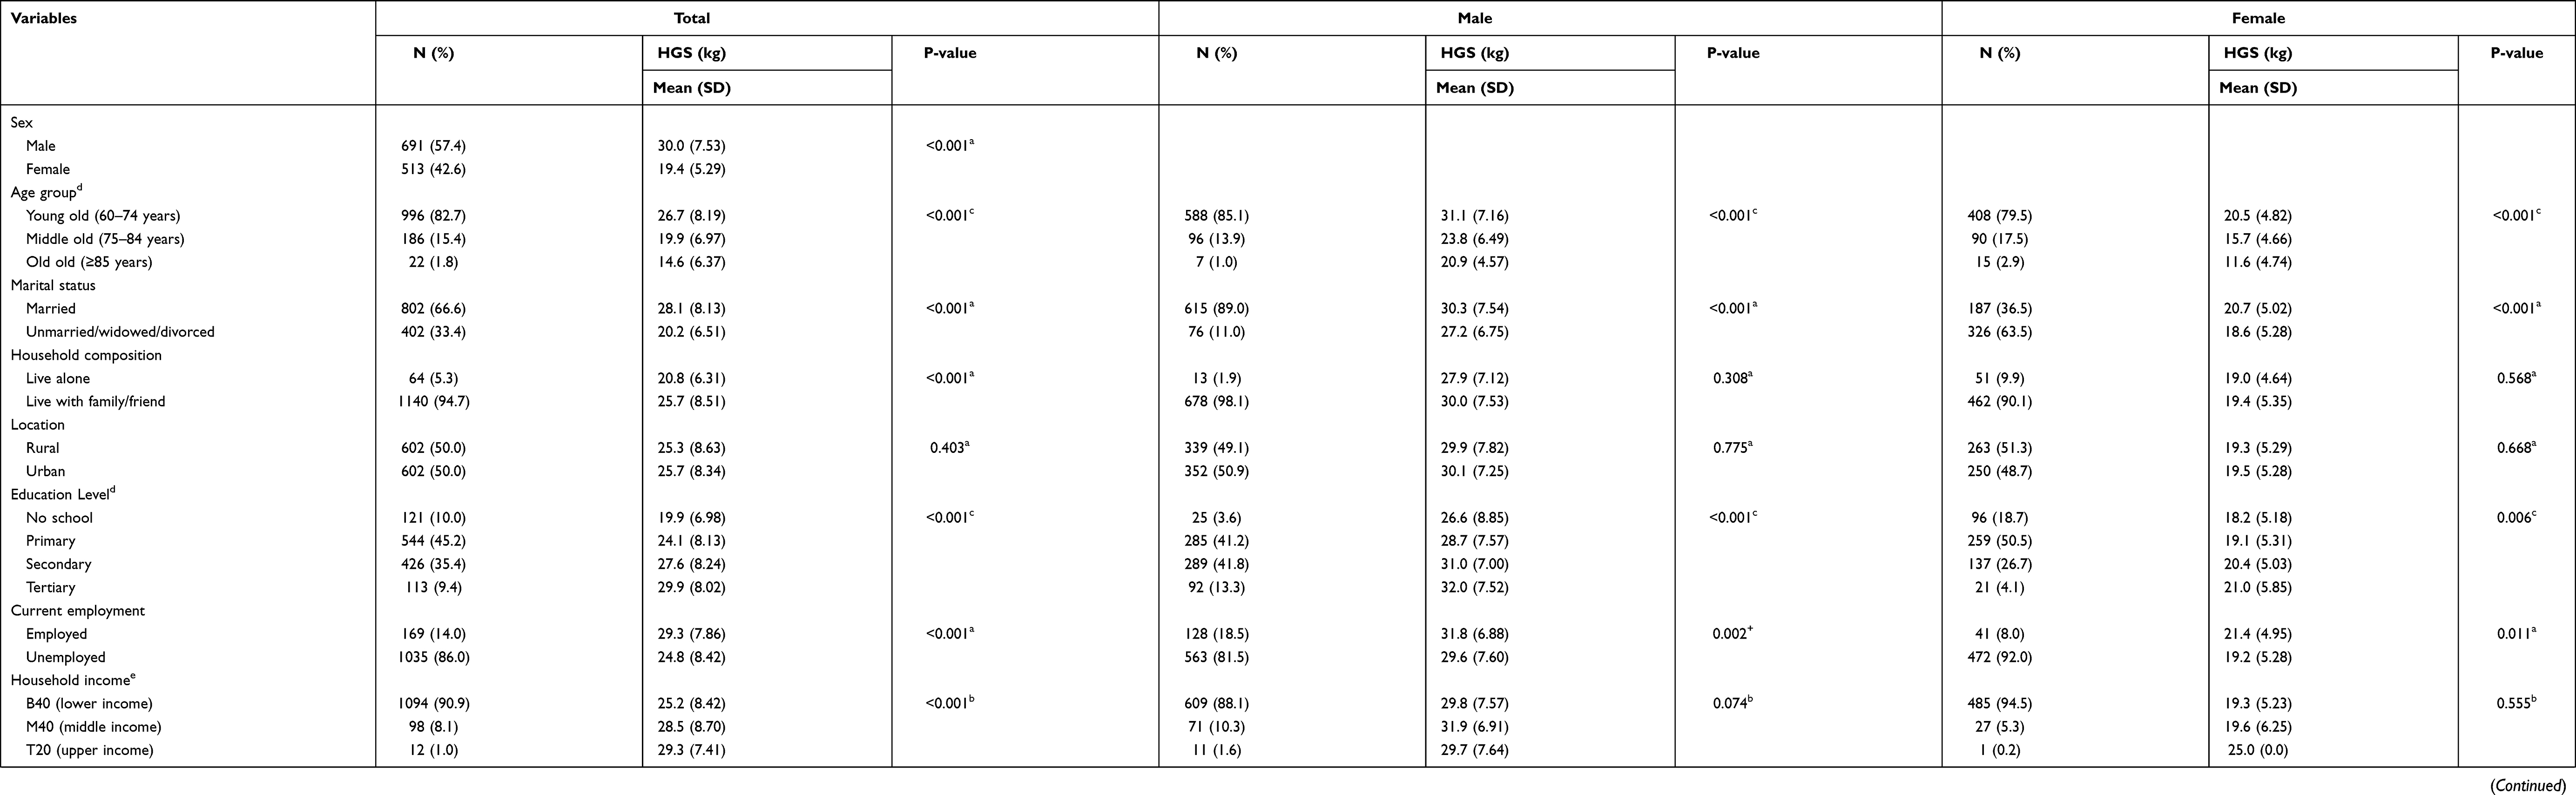 |
Table 1 Demographic, Socioeconomic Characteristics, and the Behavioral Lifestyles of Respondents |
Association of HGS with the Health-Related Conditions
HGS was significantly associated with smoking status and alcohol consumption with p-values of <0.001 in both groups, whereby respondents with positive exposure to smoking and alcohol have higher HGS. However, analysis of sex, the HGS was not significantly associated with smoking and alcohol consumption in both sexes. Physical activity was also associated with HGS. Overall, older adults who performed a minimum of light activity four or more times weekly had a significantly higher HGS than those who less exercised (p<0.001). Analysis of sex groups also supported the association.
The presence of hypertension, diabetes mellitus, cancer and depression were also significantly associated with a reduction of HGS with a p-value of <0.001, <0.001, 0.009 and 0.011, respectively. However, only diabetes was significantly associated with HGS for males after controlling for age, while obesity was associated with HGS among females. The mean HGS for diabetes males was 28.5 kg (95% CI; 27.65, 29.33). Meanwhile, the mean HGS for non-diabetes males was 30.8 kg (95% CI: 30.99, 31.42). The age-adjusted mean difference of HGS between diabetes and non-diabetes male participants was 2.3 kg (95% CI: 1.27, 3.36; p<0.001). The mean HGS for obese females was 19.8 kg (95% CI; 19.24, 20.42). Meanwhile, the mean HGS for non-obese females was 18.9 kg (95% CI: 18.4, 19.5). Thus, the age-adjusted mean difference of HGS between obese and non-obese female participants was 0.9 kg (95% CI: 0.08, 1.71; p=0.032). The values of unadjusted mean HGS and age-adjusted mean HGS for selected NCDs are shown in Table 2.
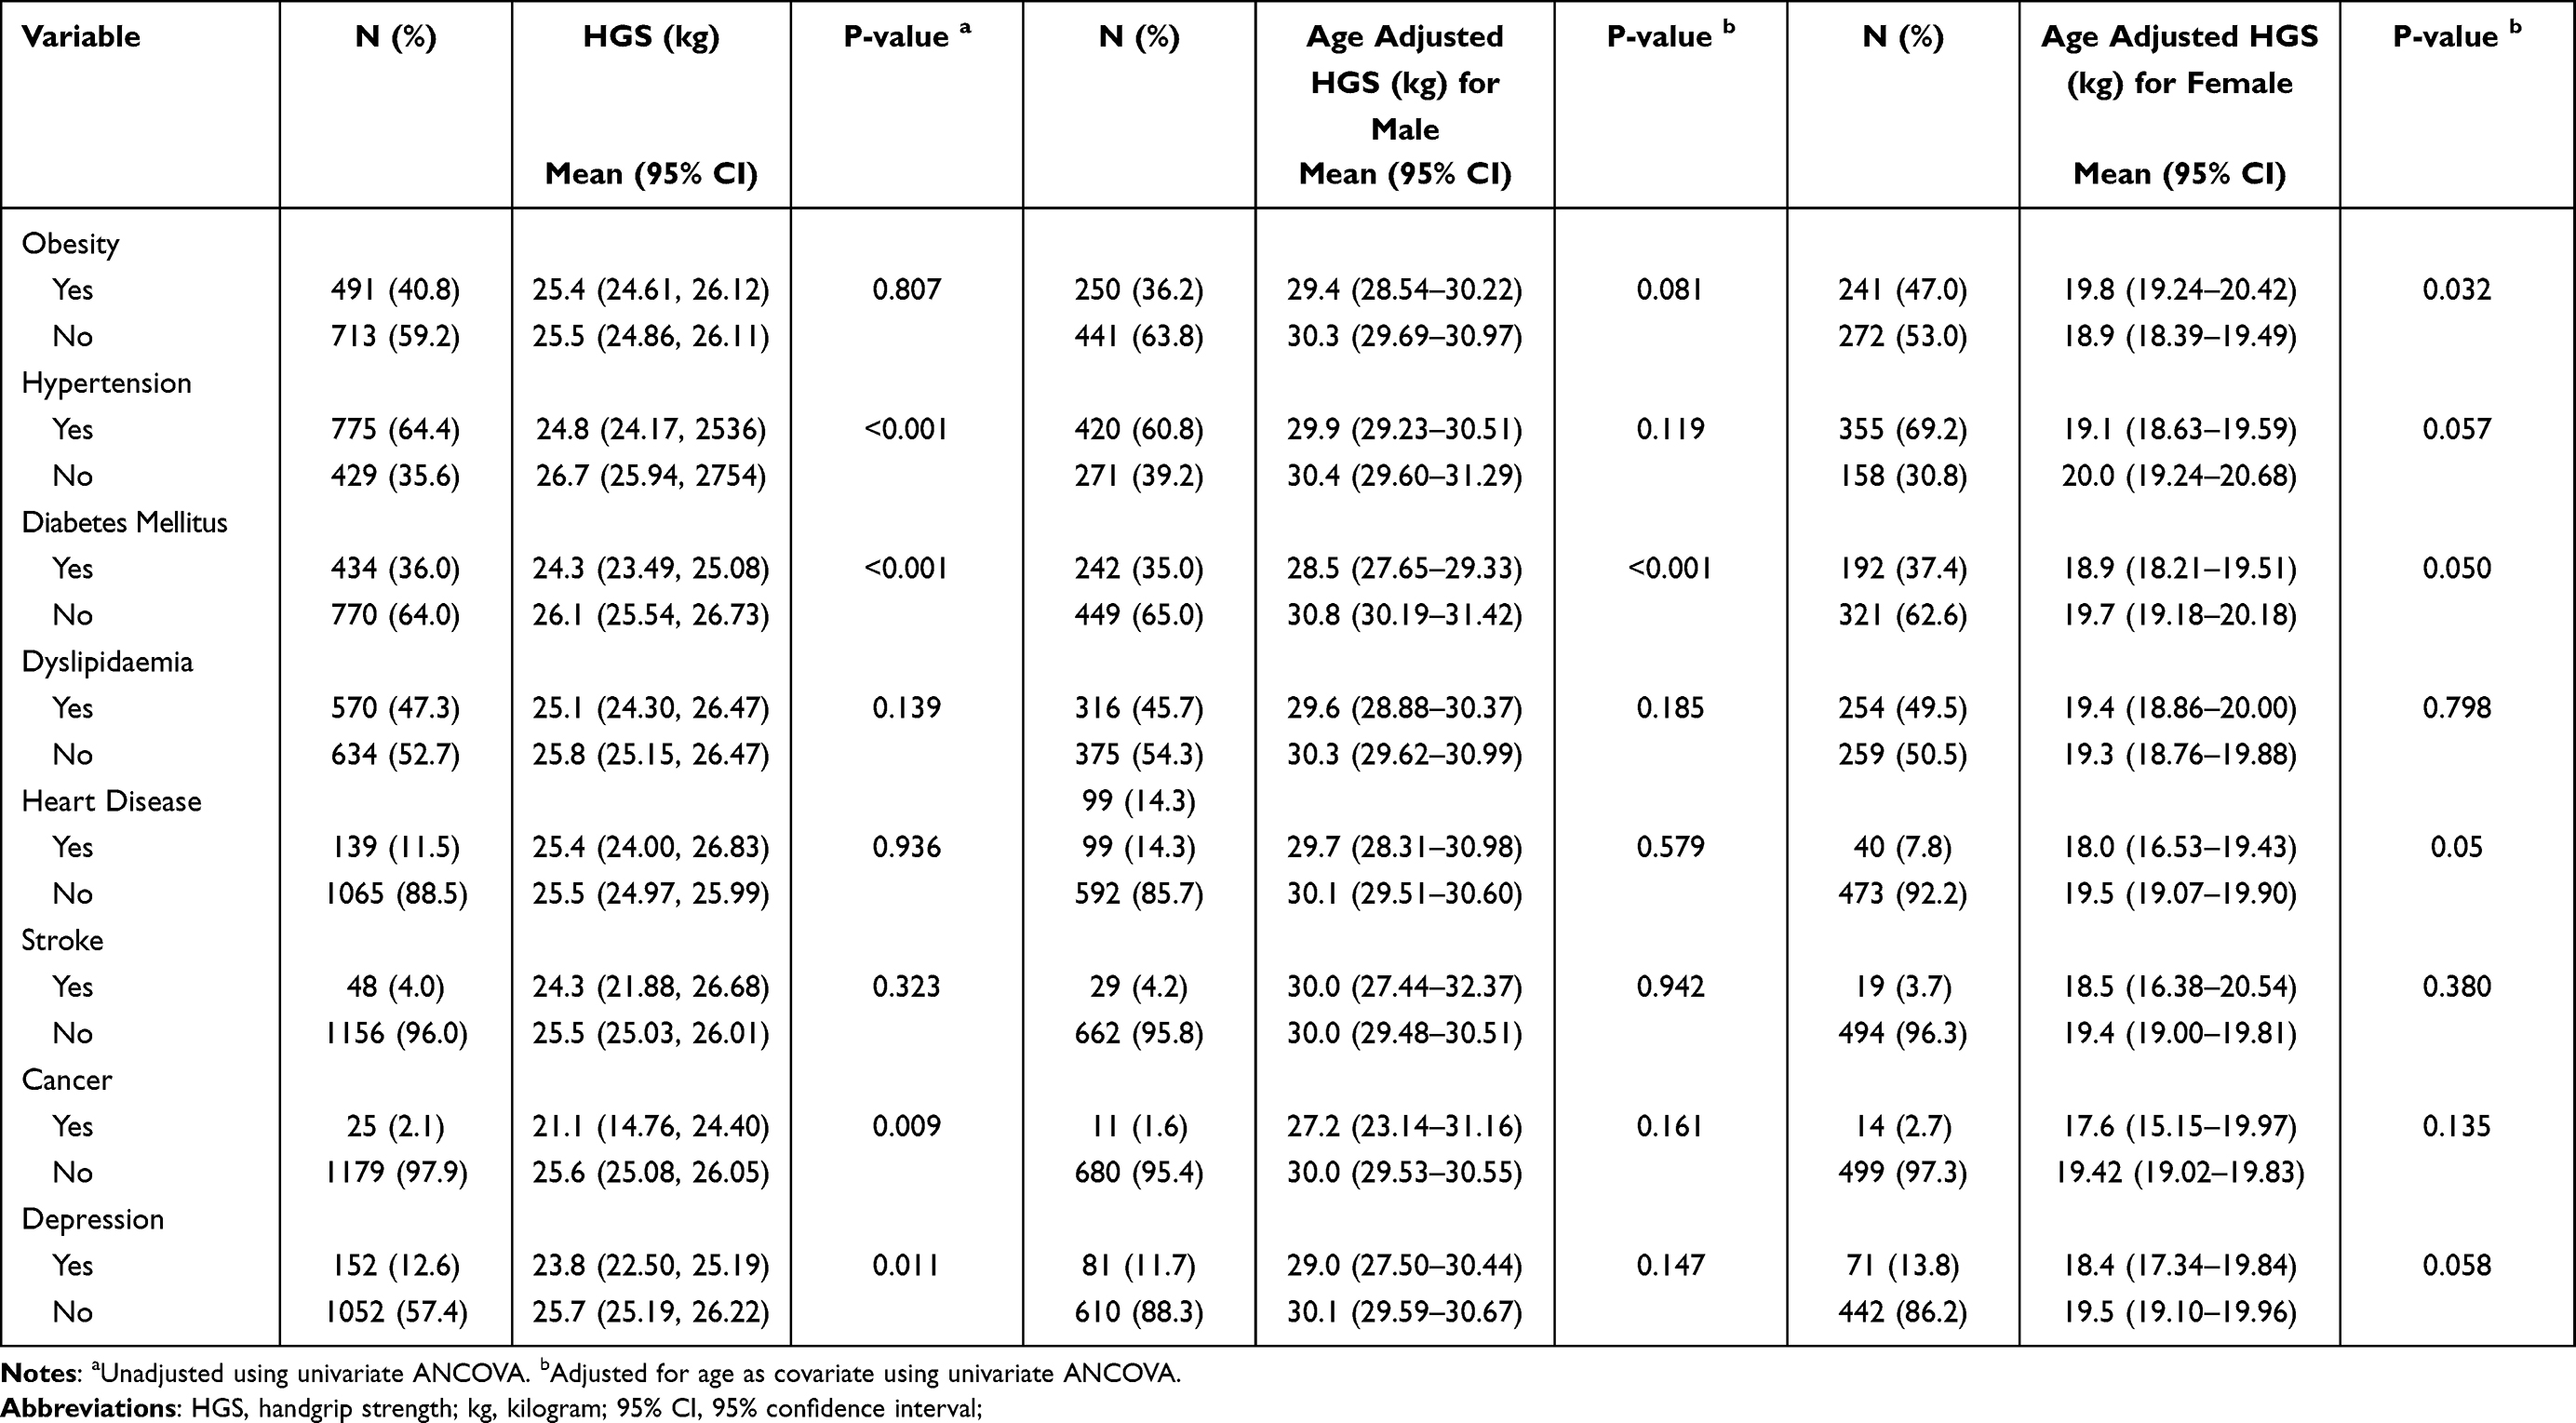 |
Table 2 Values of Handgrip Strength (HGS) According to the Selected Noncommunicable Diseases (NCDs) |
Multivariable Analysis
Finally, the multivariable analysis revealed that increasing age, inactivity, and diabetes were all associated with a decrease in HGS in males. Meanwhile, the HGS was significantly reduced with age, physically inactive, and hypertension for females. However, female handgrip strength was positively related to the BMI (Table 3). Neither interaction nor collinearity was present. The model explains 25.6% and 29.0% of the variation of an HGS value in males and females. We do not include five significant independent variables of univariate analysis in the multivariable analysis as the number of samples was too small. These independent variables include household composition, alcohol, betel chewing, cancer and stroke.
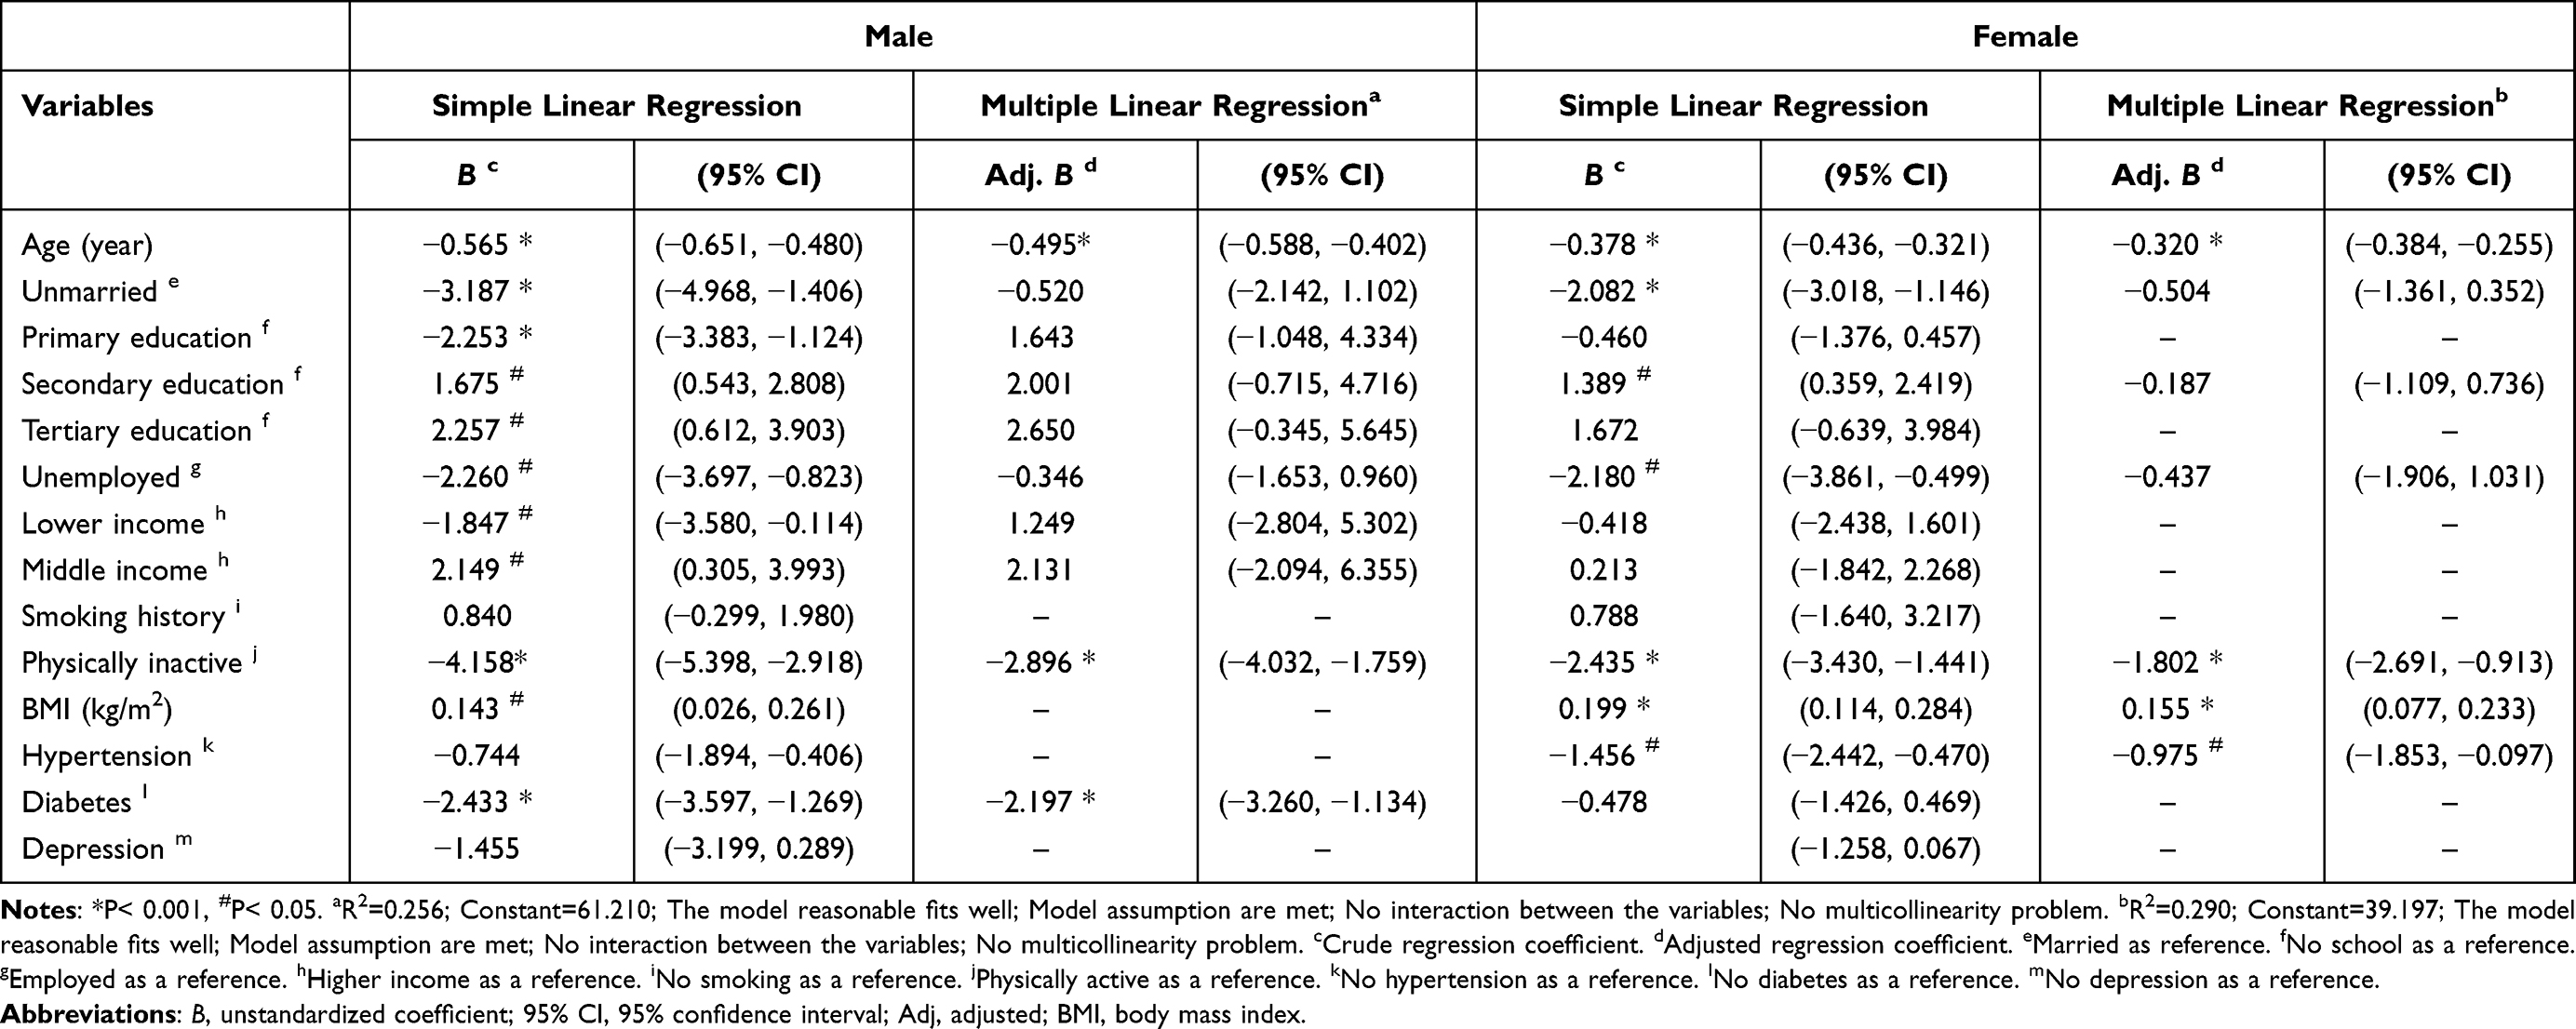 |
Table 3 Factors Associated with Handgrip Strength (Kg) Among the Study Population |
Discussion
The present study provided a better understanding of the HGS and related risk factors, as intended with the aim of the study. The HGS is part of functional assessment, and a previous study showed that functional evaluation might give an insight into multimorbidity and mortality risk, especially for older adults.27 Thus, in our study, the value of HGS declined with increasing age, physical inactivity, diabetes for males and hypertension for females.
The value of HGS declined with increasing age and was higher among males were well understood as it is related to normal physiological changes. Therefore, we will not discuss the differences due to age and gender in depth. However, we would like to highlight a study that used a sex hormone to increase muscle mass that reported exogenous testosterone improved HGS in older men.28 However, hormone therapy did not appear to enhance handgrip ability among older females. A recent study showed that among premenopausal females, testosterone was not associated with lean body mass or HGS.29
In this study, many sociodemographic factors were not associated with HGS. There was no significant relationship between HGS and older adults’ location, whether they lived in urban or rural areas. The same is true for educational attainment and household income. This is probably because their sociodemographic characteristics are nearly identical. However, research conducted in Indonesia indicates that rural-dwelling older females have a lower HGS.30 Additionally, the study discovered that older males with a higher level of education and a middle-class economic background had a significantly higher HGS.30
For health-related behavior, we found that being physically active have a linear association with HGS. The finding was supported by a study measuring the pre- and post-HGS after a regular physical activity intervention among older individuals.12 A similar result was noted by Yasunaga et al.31 Muscle strength and function can be improved through physical activity and resistance exercise.5 Physical activity directly stimulates skeletal muscle and subsequently leads to improved muscle mass and higher HGS,32 which reduce the likelihood of sarcopenia. Reduction of muscle mass related to defective mitochondrial energetics. Exercises or physical activity improves mitochondrial respiration, hence mitigating muscle mass losses.33 Meanwhile, in the bivariate analysis, we found that smoking and drinking alcohol were positive associated with HGS. It is contrary to the existing evidence that smoking and alcohol cause a lack of skeletal muscle strength.34,35 However, in this study, respondents who smoked and drank alcohol were younger, which resulted in their HGS values being higher than those who never smoked and drank alcohol. Nonetheless, a study conducted in Japan discovered that HGS levels increased significantly with increased daily alcohol consumption.36
In terms of HGS and comorbidities, diabetes was associated with low HGS among older males. It was consistent with a study conducted in China as the HGS level decreased from normoglycemia to prediabetes and diabetes mellitus.37 Furthermore, the same finding was seen in the study, whereby the HGS was not statistically significant in diabetic females. The result was explained with a high-sensitivity C-reactive protein (hsCRP) level, inversely associated with the HGS. The males have a higher level of hsCRP, leading to muscle strength loss and declining HGS levels than females.38
Meanwhile, older females with hypertension were significantly associated with reducing HGS. A possible explanation for this effect includes improvements in skeletal muscle mass, and muscle contraction may also improve the autonomic regulation of heart rate and blood pressure.39 However, some studies with a large sample showed positive effects on hypertension with HGS.40
On the other hand, this study revealed that BMI was associated with HGS for females but not males. A similar finding was observed in a few studies, which showed obesity was associated with higher HGS.30,41–43 Furthermore, the ageing process and low muscle mass contribute to low muscle strength and vice versa.44 Subsequently, it affects HGS measurement among older adults. Nonetheless, few studies have found contradictory results regarding central obesity and HGS.45,46 Moreover, evidence showed that high BMI is associated with a higher risk of disability, and lower BMI has better individuals’ daily functionality.47
This study has some limitations as the variables were self-reported and no supportive data such as health reports to confirm them. Secondly, the study did not capture other factors related to HGS, such as nutritional status and muscle mass. The study also does not include the older adults living in the institution or nursing home. However, since most older adults in Malaysia live outside the nursing home, the number of older adults in a nursing home is negligible. Besides that, given the cross-sectional design of the study, the factors cannot be said as the true cause that affects the gender differences in the HGS. Nevertheless, the study is a population-based study and managed to cover a good proportion of the older population and was similar to the demographics of the older adults in Malaysia. However, a cautious interpretation is necessary as the study may not represent older Malaysian adults.
Conclusion
Based on our aim, we have uncovered slight differences between male and female older adults in the factors associated with HGS. Overall, increasing age and being physically inactive were associated with a reduction in HGS. Diabetes was associated with HGS in males, whereas hypertension was associated with HGS in females. In addition, BMI was positively related to HGS for older females. Therefore, the routine use of handgrip measurement to assess older adults with chronic diseases should be more involved in clinical practice.
Acknowledgments
We would like to express our gratitude to everyone at the Department of Community Health, Faculty of Medicine, Universiti Kebangsaan Malaysia, who assisted with the survey. Additionally, we appreciate the cooperation and assistance of the heads of the respective residential areas in Selangor.
Disclosure
The study is funded by the World Health Organization Centre for Health Development (WHO Kobe Centre – WKC), grant number 2018/863819-1. The funders had no role in the study’s design, in the collection, analyses, or interpretation of data, in the writing of the manuscript, or in the decision to publish the results. The authors declare that they have no conflicts of interest in relation to this work.
References
1. McLeod M, Breen L, Hamilton DL, Philp A. Live strong and prosper: the importance of skeletal muscle strength for healthy ageing. Biogerontology. 2016;17(3):497–510. doi:10.1007/s10522-015-9631-7
2. Miller AEJ, Macdougall JD, Tarnopolsky MA, Sale DG. Gender differences in strength and muscle fiber characteristics. Eur J Appl Physiol Occup Physiol. 1993;66(3):254–262. doi:10.1007/BF00235103
3. Alexandre TDS, Corona LP, Brito TRP, Santos JLF, Duarte YAO, Lebrão ML. Gender differences in the incidence and determinants of components of the frailty phenotype among older adults: findings from the SABE study. J Aging Health. 2018;30(2):190–212. doi:10.1177/0898264316671228
4. Manini TM, Clark BC. Dynapenia and aging: an update. J Gerontol A Biol Sci Med Sci. 2012;67(1):28–40. doi:10.1093/gerona/glr010
5. de Souto Barreto P, Morley JE, Chodzko-Zajko W, et al. Recommendations on physical activity and exercise for older adults living in long-term care facilities: a taskforce report. J Am Med Dir Assoc. 2016;17(5):381–392. doi:10.1016/j.jamda.2016.01.021
6. Strandkvist V, Larsson A, Pauelsen M, et al. Handgrip strength is strongly associated with lower limb strength but only weakly with postural control in community-dwelling older adults. Arch Gerontol Geriatr. 2021;94:104345. doi:10.1016/j.archger.2021.104345
7. Brogårdh C, Ekstrand E, Lexell J. Isokinetic and isometric muscle strength measurements in the upper extremity can be reliably measured in persons with chronic stroke. Physiotherapy. 2015;101:e177–e178. doi:10.1016/j.physio.2015.03.334
8. Takahashi J, Nishiyama T, Matsushima Y. Does grip strength on the unaffected side of patients with hemiparetic stroke reflect the strength of other ipsilateral muscles? J Phys Ther Sci. 2017;29(1):64–66. doi:10.1589/jpts.29.64
9. Leong DP, Teo KK, Rangarajan S, et al. Prognostic value of grip strength: findings from the Prospective Urban Rural Epidemiology (PURE) study. Lancet. 2015;386(9990):266–273. doi:10.1016/S0140-6736(14)62000-6
10. Hao G, Chen H, Ying Y, Wu M, Yang G, Jing C. The relative handgrip strength and risk of cardiometabolic disorders: a prospective study. Front Physiol. 2020;11:719. doi:10.3389/fphys.2020.00719
11. Damayanthi HD, Moy F-M, Abdullah KL, Dharmaratne SD. Handgrip strength and its associated factors among community-dwelling elderly in Sri Lanka: a cross-sectional study. Asian Nurs Res. 2018;12(3):231–236. doi:10.1016/j.anr.2018.08.008
12. Bilajac L, Juraga D, Žuljević H, Glavić MM, Vasiljev V, Rukavina T. The influence of physical Activity on handgrip strength of elderly. Arch Gerontol Geriatr Res. 2019;4(1):020–024. doi:10.17352/aggr.000011
13. Mathiowetz V, Weber K, Volland G, Kashman N. Reliability and validity of grip and pinch strength evaluations. J Hand Surg Am. 1984;9(2):222–226. doi:10.1016/S0363-5023(84)80146-X
14. Fragala MS, Alley DE, Shardell MD, et al. Comparison of handgrip and leg extension strength in predicting slow gait speed in older adults. J Am Geriatr Soc. 2016;64(1):144–150. doi:10.1111/jgs.13871
15. World Health Organization. Integrated care for older people: guidelines on community-level interventions to manage declines in intrinsic capacity; 2017.
16. Lam N, Goh H, Kamaruzzaman S, Chin A, Poi P, Tan M. Normative data for handgrip strength and key pinch strength, stratified by age and gender for a multiethnic Asian population. Singapore Med J. 2016;57(10):578–584. doi:10.11622/smedj.2015164
17. Moy F, Chang E, Kee K. Predictors of handgrip strength among the free-living elderly in rural Pahang, Malaysia. Iran J Public Health. 2011;40(4):44.
18. Moy F-M, Darus A, Hairi NN. Predictors of handgrip strength among adults of a rural community in Malaysia. Asia Pac J Public Health. 2015;27(2):176–184. doi:10.1177/1010539513510555
19. Shah SA, Safian N, Ahmad S, et al. Unmet healthcare needs among elderly Malaysians. J Multidiscip Healthc. 2021;14:3061–3062. doi:10.2147/JMDH.S346308
20. Nishi A, Kondo K, Hirai H, Kawachi I. Cohort profile: the ages 2003 cohort study in Aichi, Japan. J Epidemiol. 2011;21(2):151–157. doi:10.2188/jea.JE20100135
21. Balogun JA, Akomolafe CT, Amusa LO. Grip strength: effects of testing posture and elbow position. Arch Phys Med Rehabil. 1991;72(5):280–283.
22. Su C-Y, Lin J-H, Chien T-H, Cheng K-F, Sung Y-T. Grip strength in different positions of elbow and shoulder. Arch Phys Med Rehabil. 1994;75(7):812–815. doi:10.1016/0003-9993(94)90142-2
23. Household income & basic amenities survey report 2019. Department of Statistics Malaysia; 2019. Available from: https://www.dosm.gov.my/v1/index.php?r=column/cthemeByCat&cat=120&bul_id=TU00TmRhQ1N5TUxHVWN0T2VjbXJYZz09&menu_id=amVoWU54UTl0a21NWmdhMjFMMWcyZz09#.
24. Kondo K. Progress in aging epidemiology in Japan: the JAGES project. J Epidemiol. 2016:JE20160093. doi:10.2188/jea.JE20160093
25. Alamuddin N, Bakizada Z, Wadden TA. Management of obesity. J Clin Oncol. 2016;34(35):4295–4305. doi:10.1200/JCO.2016.66.8806
26. Misawa J, Kondo K. Social factors relating to depression among older people in Japan: analysis of longitudinal panel data from the AGES project. Aging Ment Health. 2019;23(10):1423–1432. doi:10.1080/13607863.2018.1496225
27. Bahat G, Tufan F, Bahat Z, et al. Observational cohort study on correlates of mortality in older community‐dwelling outpatients: the value of functional assessment. Geriatr Gerontol Int. 2015;15(11):1219–1226. doi:10.1111/ggi.12422
28. Page ST, Amory JK, Bowman FD, et al. Exogenous testosterone (T) alone or with finasteride increases physical performance, grip strength, and lean body mass in older men with low serum T. J Clin Endocrinol Metab. 2005;90(3):1502–1510. doi:10.1210/jc.2004-1933
29. Alexander SE, Abbott G, Aisbett B, Wadley GD, Hnatiuk JA, Lamon S. Total testosterone is not associated with lean mass or handgrip strength in premenopausal females. Sci Rep. 2021;11(1):1. doi:10.1038/s41598-021-89232-1
30. Pengpid S, Peltzer K. Hand grip strength and its sociodemographic and health correlates among older adult men and women (50 years and older) in Indonesia. Curr Gerontol Geriatr Res. 2018:2018. doi:10.1155/2018/3265041
31. Yasunaga A, Shibata A, Ishii K, et al. Associations of sedentary behavior and physical activity with older adults’ physical function: an isotemporal substitution approach. BMC Geriatr. 2017;17(1):1–7. doi:10.1186/s12877-017-0675-1
32. Adedoyin RA, Ogundapo FA, Mbada CE, et al. Reference values for handgrip strength among healthy adults in Nigeria. Hong Kong Physiother J. 2009;27(1):21–29. doi:10.1016/S1013-7025(10)70005-1
33. Cartee GD, Hepple RT, Bamman MM, Zierath JR. Exercise promotes healthy aging of skeletal muscle. Cell Metab. 2016;23(6):1034–1047. doi:10.1016/j.cmet.2016.05.007
34. Al-Obaidi S, Al-Sayegh N, Nadar M. Smoking impact on grip strength and fatigue resistance: implications for exercise and hand therapy practice. J Phys Act Health. 2014;11(5):1025–1031. doi:10.1123/jpah.2011-0357
35. Kimball SR, Lang CH. Mechanisms underlying muscle protein imbalance induced by alcohol. Annu Rev Nutr. 2018;38(1):197–217. doi:10.1146/annurev-nutr-071816-064642
36. Kawamoto R, Ninomiya D, Senzaki K, Kumagi T. Alcohol consumption is positively associated with handgrip strength among Japanese community-dwelling middle-aged and elderly persons. Int J Gerontol. 2018;12(4):294–298. doi:10.1016/j.ijge.2018.03.005
37. Liang X, Jiang CQ, Zhang WS, et al. Glycaemia and handgrip strength in aging people: guangzhou biobank cohort study. BMC Geriatr. 2020;20(1):1–10. doi:10.1186/s12877-020-01808-0
38. Chong H, Choi YE, Kong JY, et al. Association of hand grip strength and cardiometabolic markers in korean adult population: the Korea national health and nutrition examination survey 2015–2016. Korean J Fam Med. 2020;41(5):291–298. doi:10.4082/kjfm.18.0129
39. Millar PJ, McGowan CL, Cornelissen VA, Araujo CG, Swaine IL. Evidence for the role of isometric exercise training in reducing blood pressure: potential mechanisms and future directions. Sports Med. 2014;44(3):345–356. doi:10.1007/s40279-013-0118-x
40. Ji C, Zheng L, Zhang R, Wu Q, Zhao Y. Handgrip strength is positively related to blood pressure and hypertension risk: results from the National Health and nutrition examination survey. Lipids Health Dis. 2018;17(1). doi:10.1186/s12944-018-0734-4
41. Cederholm T, Bosaeus I, Barazzoni R, et al. Diagnostic criteria for malnutrition–an ESPEN consensus statement. Clin Nutr. 2015;34(3):335–340. doi:10.1016/j.clnu.2015.03.001
42. Mendes J, Amaral TF, Borges N, et al. Handgrip strength values of Portuguese older adults: a population-based study. BMC Geriatr. 2017;17(1):1–12. doi:10.1186/s12877-017-0590-5
43. Ramlagan S, Peltzer K, Phaswana-Mafuya N. Handgrip strength and associated factors in non-institutionalized men and women 50 years and older in South Africa. BMC Res Notes. 2014;7(1):1–7. doi:10.1186/1756-0500-7-8
44. Silveira TMG, Sousa JBD, Stringhini MLF, Freitas ATV, Melo PG. Nutritional assessment and hand grip strength of candidates for surgery of the gastrointestinal tract. Arq Bras Cir Dig. 2014;27(2):104–108. doi:10.1590/S0102-67202014000200005
45. de Lima TR, Silva DAS, de Castro JAC, Christofaro DGD. Handgrip strength and associated sociodemographic and lifestyle factors: a systematic review of the adult population. J Bodyw Mov Ther. 2017;21(2):401–413. doi:10.1016/j.jbmt.2016.08.017
46. Ong HL, Abdin E, Chua BY, et al. Hand-grip strength among older adults in Singapore: a comparison with international norms and associative factors. BMC Geriatr. 2017;17(1). doi:10.1186/s12877-017-0565-6.
47. Bahat G, Muratlı S, Ilhan B, et al. Body mass index and functional status in community-dwelling older Turkish males. Aging Male. 2015;18(4):228–232. doi:10.3109/13685538.2015.1061493
 © 2022 The Author(s). This work is published and licensed by Dove Medical Press Limited. The
full terms of this license are available at https://www.dovepress.com/terms
and incorporate the Creative Commons Attribution
- Non Commercial (unported, 3.0) License.
By accessing the work you hereby accept the Terms. Non-commercial uses of the work are permitted
without any further permission from Dove Medical Press Limited, provided the work is properly
attributed. For permission for commercial use of this work, please see paragraphs 4.2 and 5 of our Terms.
© 2022 The Author(s). This work is published and licensed by Dove Medical Press Limited. The
full terms of this license are available at https://www.dovepress.com/terms
and incorporate the Creative Commons Attribution
- Non Commercial (unported, 3.0) License.
By accessing the work you hereby accept the Terms. Non-commercial uses of the work are permitted
without any further permission from Dove Medical Press Limited, provided the work is properly
attributed. For permission for commercial use of this work, please see paragraphs 4.2 and 5 of our Terms.
Recommended articles
Rethinking Low Handgrip Strength: Normative Values, Diagnostic Thresholds, and Sarcopenia Risk in Malaysian Older Adults
Ooi TC, Rivan NFM, Shahar S, Ibrahim AM, Singh DKA
Clinical Interventions in Aging 2026, 21:594695
Published Date: 15 June 2026