Back to Journals » International Journal of Chronic Obstructive Pulmonary Disease » Volume 21
Respiratory Muscle Strength and Imaging Parameters in Smokers: A Prospective Observational Study
Authors Matsuo Y ![]() , Ogawa E
, Ogawa E ![]() , Iriyama T
, Iriyama T ![]() , Tsunoda Y, Yamazaki A, Uchida Y, Nakagawa H
, Tsunoda Y, Yamazaki A, Uchida Y, Nakagawa H ![]() , Kinose D
, Kinose D ![]() , Yamaguchi M
, Yamaguchi M ![]() , Nakano Y
, Nakano Y ![]()
Received 25 September 2025
Accepted for publication 17 February 2026
Published 6 March 2026 Volume 2026:21 570205
DOI https://doi.org/10.2147/COPD.S570205
Checked for plagiarism Yes
Review by Single anonymous peer review
Peer reviewer comments 2
Editor who approved publication: Prof. Dr. Richard Russell
Yumiko Matsuo,1 Emiko Ogawa,1,2 Tomoko Iriyama,1 Yoko Tsunoda,1 Akio Yamazaki,1 Yasuki Uchida,1 Hiroaki Nakagawa,1 Daisuke Kinose,1 Masafumi Yamaguchi,1 Yasutaka Nakano1
1Division of Respiratory Medicine, Department of Internal Medicine, Shiga University of Medical Science, Otsu, Shiga, Japan; 2Health Administration Center, Shiga University of Medical Science, Otsu, Shiga, Japan
Correspondence: Emiko Ogawa, Health Administration Center, Shiga University of Medical Science, Seta Tsukinowa-cho, Otsu, Shiga, 520-2192, Japan, Tel/Fax +81-77-548-2212, Email [email protected]
Purpose: Respiratory muscle strength tests are commonly used in respiratory rehabilitation as an indicator of training in patients with chronic obstructive pulmonary disease (COPD). Although respiratory muscle strength tests are associated with lung function, their relationship with imaging parameters has not been fully investigated. Therefore, we aimed to reveal the relationship between imaging parameters and respiratory muscle strength and determine the usefulness of respiratory muscle strength tests as an indicator of the pathophysiology of dynamic pulmonary hyperinflation in smokers.
Patients and Methods: In this single-center prospective observational study conducted in Japan, 48 patients with COPD and 10 non-COPD smokers were included in the final analysis. Most of the participants were men and the median age was 77 [interquartile range 70.8– 80.1]. Respiratory muscle strength tests, pulmonary function tests, and inspiratory and expiratory chest computed tomography were performed. Quantitative imaging parameters of gas trapping and emphysema were measured using the disease probability measure (DPM), a voxel-wise image analysis.
Results: Maximal inspiratory and expiratory pressures (PImax and PEmax) were negatively correlated with residual volume/total lung capacity (Spearman’s rank correlation coefficient (r): − 0.37, − 0.40, respectively and p-value (p): < 0.01), but not with forced expiratory volume in 1 s. PImax and PEmax were negatively correlated with gas-trapping lesions recognized by DPM (DPMGasTrap) in the single correlation analysis (r: − 0.31, − 0.37 and p: < 0.05, < 0.01, respectively), and the values for DPMGasTrap significantly differed between the high and low PImax and PEmax groups.
Conclusion: Respiratory muscle strength reflects the degree of gas trapping, not the degree of obstructive airflow limitation in smokers. It proves particularly valuable, especially during the initial phases of COPD, before emphysematous changes manifest.
Keywords: PImax, PEmax, COPD, disease probability measure, gas trapping, emphysema
Introduction
In chronic obstructive pulmonary disease (COPD), dynamic lung hyperinflation due to airflow limitation leads to reduced exercise tolerance and poor prognosis. Thus, establishing a simple monitoring index that reflects the pathophysiology of dynamic pulmonary hyperinflation is important. Recently, the disease probability measure (DPM),1,2 a voxel-wise image analysis using co-registered inspiration and expiration computed tomography (CT) scans, has been developed to quantitatively distinguish functional airway diseases with gas trapping from emphysematous lesions. However, the number of institutions for which DPM measurement is available is limited.
Respiratory muscle strength tests are commonly used in respiratory rehabilitation as an indicator of training;3,4 however, the relationship between imaging parameters and respiratory muscle strength tests has not been fully investigated. In patients with COPD, inspiratory muscle strength is significantly lower than expiratory muscle strength, reflecting diaphragm flattening due to lung hyperinflation and reduced inspiratory muscle strength.
Herein, we hypothesized that respiratory muscle weakness and quantitative gas-trapping imaging parameters are related, as they both reflect lung hyperinflation in the pathophysiology. Therefore, this study aimed to determine the usefulness of respiratory muscle strength tests in smokers.
Materials and Methods
Patients with stable COPD and non-COPD smokers who visited the respiratory outpatient clinic of Shiga University of Medical Science (SUMS) Hospital between October 2021 and December 2022 were recruited for this prospective cohort study. The eligibility criteria were as follows: (1) smoking history of > 10 pack-years, (2) no COPD exacerbation within 4 weeks prior to enrollment, and (3) no uncontrolled comorbidities, such as severe heart failure, malignant diseases, or other chronic lung diseases. The recruited patients underwent respiratory muscle strength tests, spirometry, forced oscillation technique (FOT), and inspiratory and expiratory CT.
COPD was diagnosed using a post-bronchodilator ratio of forced expiratory volume in 1 s (FEV1)/forced vital capacity < 0.70 according to the Global Initiative for Chronic Obstructive Lung Disease (GOLD) recommendations.5
This study was approved by the Ethics Committee of SUMS (registration number: R2021-026) and conformed to the tenets of the Declaration of Helsinki, and all participants provided written informed consent prior to their participation.
Respiratory Muscle Strength Tests
Respiratory muscle strength tests were performed using a portable handheld mouth pressure meter, IOP-01 (Kobata, Osaka, Japan). The tests were performed in a sitting position by experienced operators to prevent air leakage around the flanged thermoplastic elastomer mouthpiece. Maximal inspiratory pressure (PImax) and maximal expiratory pressure (PEmax) were measured according to the American Thoracic Society (ATS)/European Respiratory Society (ERS) Statement on Respiratory Muscle Testing6 at residual volume (RV) and total lung capacity (TLC), respectively. Predicted values were calculated from age, height, and weight for each sex in accordance with the guidelines of the Japanese Respiratory Society.7,8 The median values of PImax and PEmax were used to divide the 58 participants into two groups (high or low PImax and PEmax groups) according to respiratory muscle strength values.
Pulmonary Function Tests and Forced Oscillation Technique
Pulmonary function and FOT parameters were measured after the inhalation of 20 µg procaterol in a sitting position. Spirometry was performed using a FUDAC77 spirometer (Fukuda Denshi, Tokyo, Japan), according to the ATS/ERS guidelines.9 The carbon monoxide diffusing capacity was measured using the single-breath washout technique. Predicted spirometry values were calculated according to the Japanese Respiratory Society guidelines.10 Indices of the FOT were measured after the inhalation of 20 μg procaterol using MostGraph-01 (Chest M.I., Inc., Tokyo, Japan.11 The FOT indices at each oscillatory frequency (4–35 Hz), such as respiratory resistance, respiratory reactance (Xrs) at 5 or 20 Hz (R5, R20, and X5), resonant frequency (Fres), and low-frequency reactance (ALX), were automatically calculated using fast Fourier transformation methods.
Computed Tomography Imaging Parameters
Volumetric non-contrast chest CT was performed in the supine position using a 320-detector row CT scanner (Aquilion ONE, Canon Medical Systems Corporation, Tochigi, Japan) with either full inspiration or expiration after the inhalation of 20 μg procaterol. The CT images were reconstructed with a 1.0-mm slice thickness at 0.5-mm intervals.
The percentage of low attenuation volume (LAV%), which is a characteristic parameter of emphysematous lesions, were defined as voxels with CT attenuation less than −950 Hounsfield units, and the square root of the wall area of a hypothetical airway with an internal perimeter of 10 mm (√Aaw at Pi10),12 which is an index reflecting airway lesions, were quantitatively measured using the Apollo software (VIDA, Coralville, IA, USA), as previously described.13,14
The inspiratory and expiratory CT images were aligned, and a DPM image analysis1 was performed. The DPM classifies each voxel as normal (DPMNormal), emphysematous (DPMEmph), or gas trapping (DPMGasTrap), which is referred to as functional small airway disease, by combining the probability of gas trapping and emphysema, as calculated by the inspiratory-to-expiratory intensity differences. DPM analyses were performed using VIDA, as previously described.1
Statistical Methods
First, the relationship between respiratory muscle strength and imaging parameters was investigated. Correlations were evaluated using the Spearman rank correlation coefficient. Wilcoxon’s rank-sum test was used to detect statistically significant differences between DPM parameters with high or low respiratory muscle strength. Second, the relationship between respiratory muscle strength and functional COPD parameters was investigated using the Spearman rank correlation coefficient. A p-value of < 0.05 was considered significant. All statistical analyses were performed using JMP Pro 17 (SAS Institute, Cary, NC, USA).
Results
During this study, two patients with COPD were excluded because they had missing data on respiratory muscle strength resulting from failure to follow the measurement instructions. Therefore, 48 patients with COPD and 10 non-COPD smokers were included in the final analysis. Table 1 shows the characteristics of participants. Most of the participants were men. Most individuals had relatively mild degrees of airflow obstruction, up to GOLD 2.
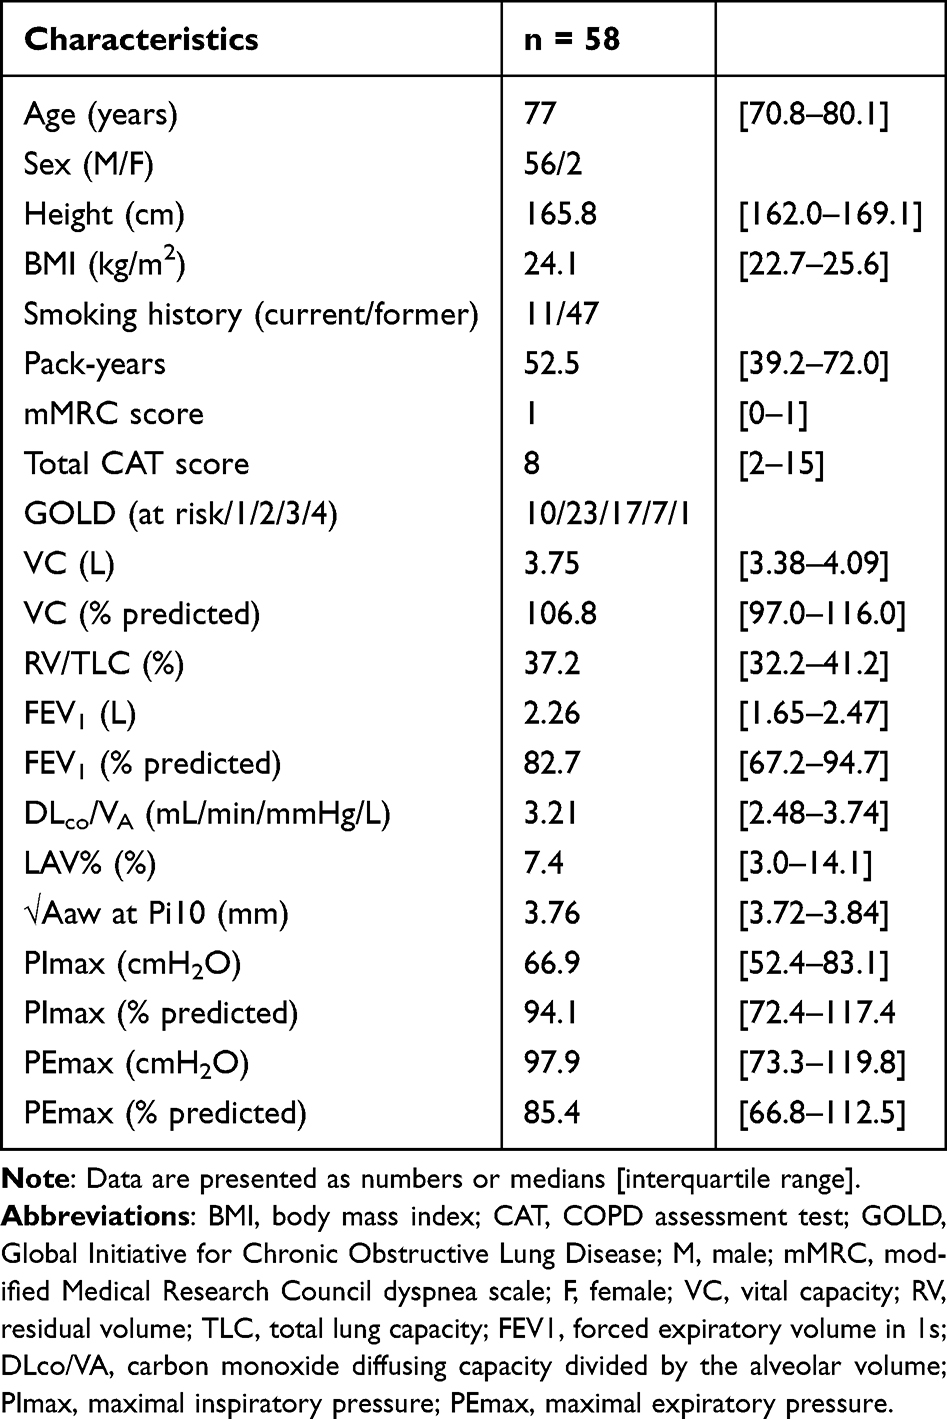 |
Table 1 Characteristics of Participants |
The relationship between respiratory muscle strength and imaging parameters is shown in Table 2 and Figure 1. PImax and PEmax were negatively correlated with gas-trapping lesions recognized by the DPM (DPMGasTrap) in the single correlation analysis (Table 2). The values for DPMGasTrap were significantly different between the high and low groups for PImax and PEmax (Figure 1). The quantitative imaging parameters of the emphysematous lesions (LAV% and DPMEmph) did not correlate with any of the respiratory muscle strength parameters. Similarly, there was no correlation between Pi10 and respiratory muscle strength.
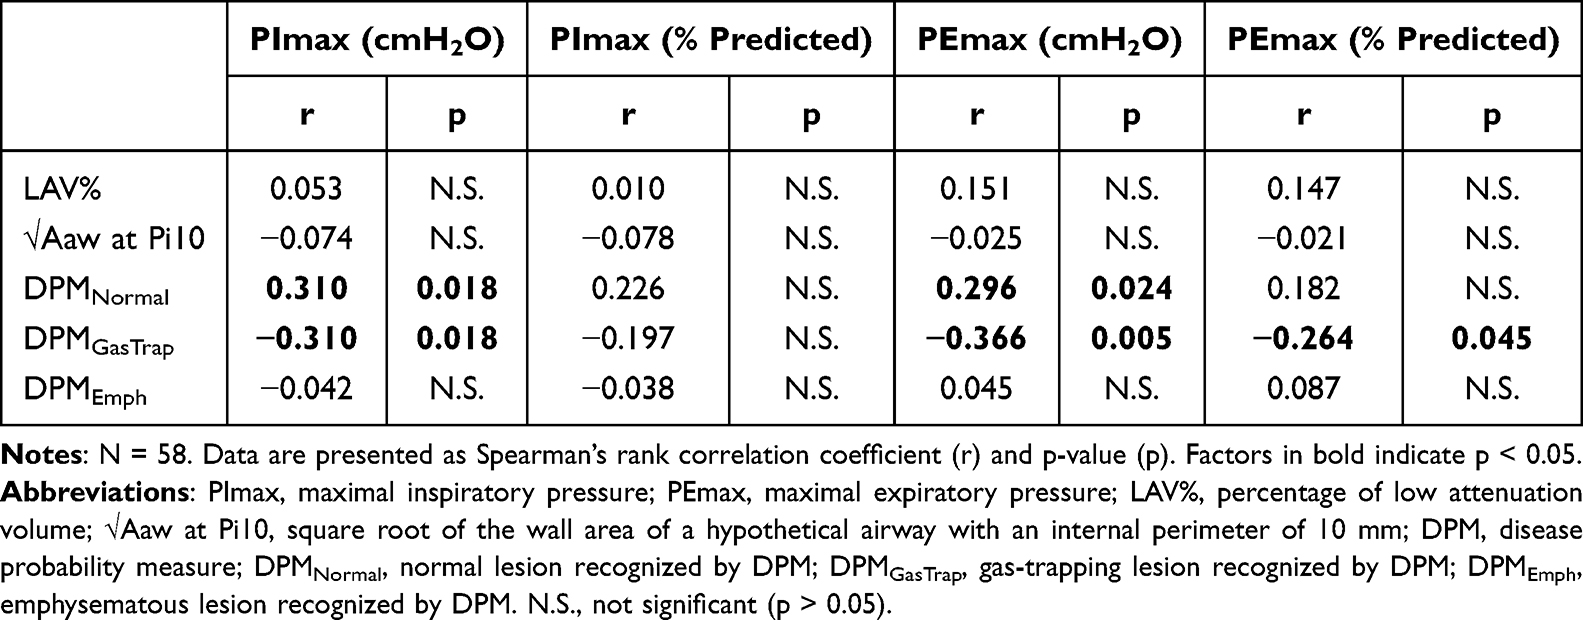 |
Table 2 Relationship Between Respiratory Muscle Strength and Imaging Parameters |
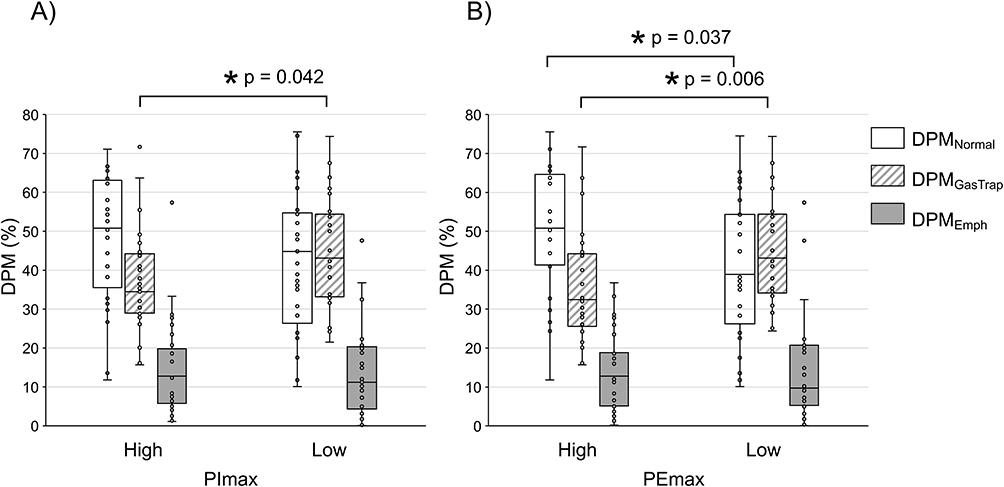 |
Figure 1 Comparison of DPM parameters among the high or low group in PImax (A) and PEmax (B). Box plots of the percentage of the DPM parameters, DPMNormal (white), DPMGasTrap (shaded), and DPMEmph (grey), between the high and low groups in a) PImax and b) PEmax. There are 29 participants in each group. Small circle points show individual data. The Wilcoxon rank-sum test was used to compare the DPM parameters between the two groups. *p < 0.05. Abbreviations: PImax, maximal inspiratory pressure; PEmax, maximal expiratory pressure; DPM, disease probability measure; DPMNormal, normal lesion recognized by DPM; DPMGasTrap, gas-trapping lesion recognized by DPM; DPMEmph, emphysematous lesion recognized by DPM. |
Table 3 shows the relationship between respiratory muscle strength and pulmonary function. Both PImax and PEmax negatively correlated with RV/TLC using Spearman’s rank correlation test. However, RV/TLC did not correlate with predicted %PImax. The predicted vital capacity was positively correlated with PEmax and %PEmax, but not with PImax or %PImax. The FEV1 or DLco/VA did not correlate with any respiratory muscle strength value.
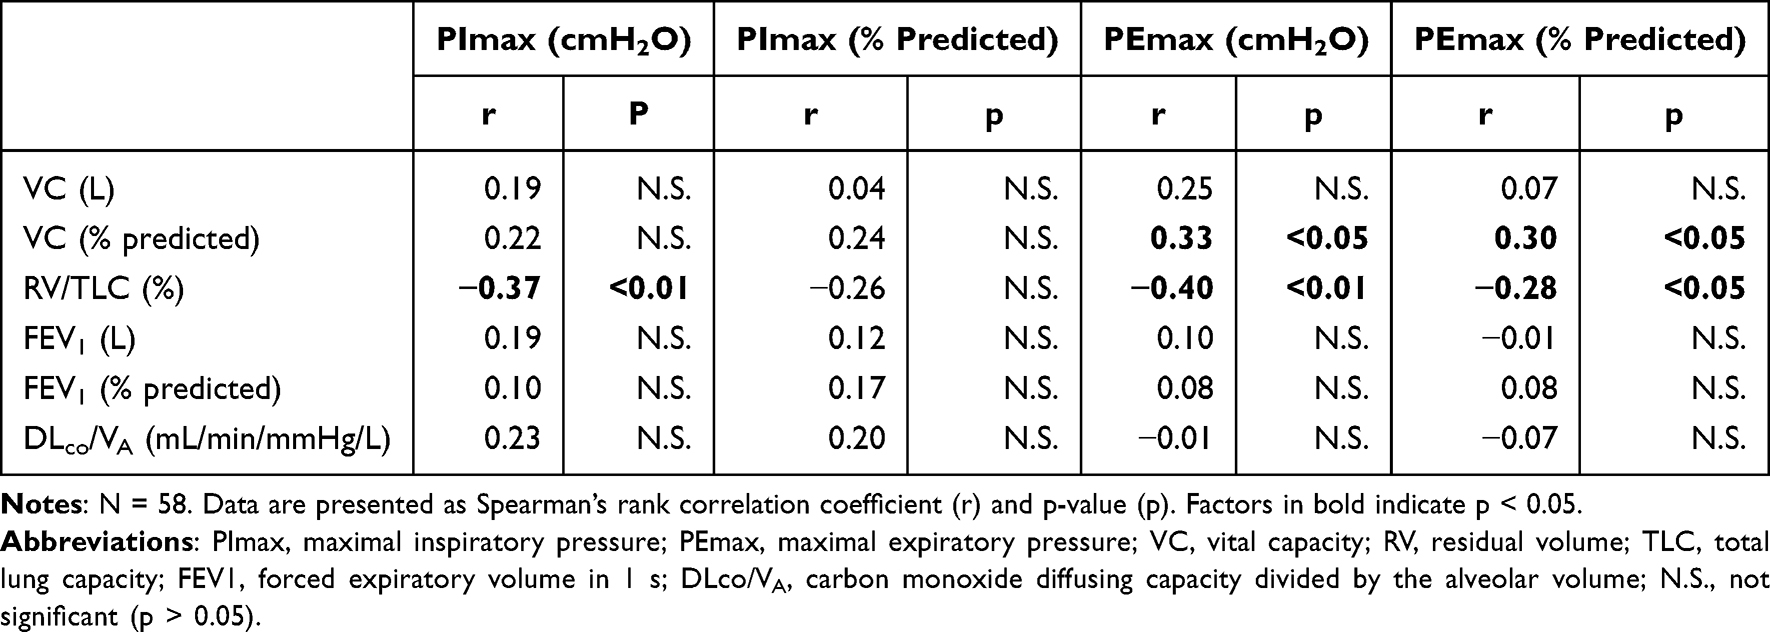 |
Table 3 Relationship Between Respiratory Muscle Strength and Pulmonary Function |
Table 4 shows the relationship between respiratory muscle strength and FOT parameters. Inspiratory respiratory muscle strength (PImax) did not correlate with any FOT parameters. Expiratory muscle strength (PEmax) correlated only with R20, but not with other FOT parameters.
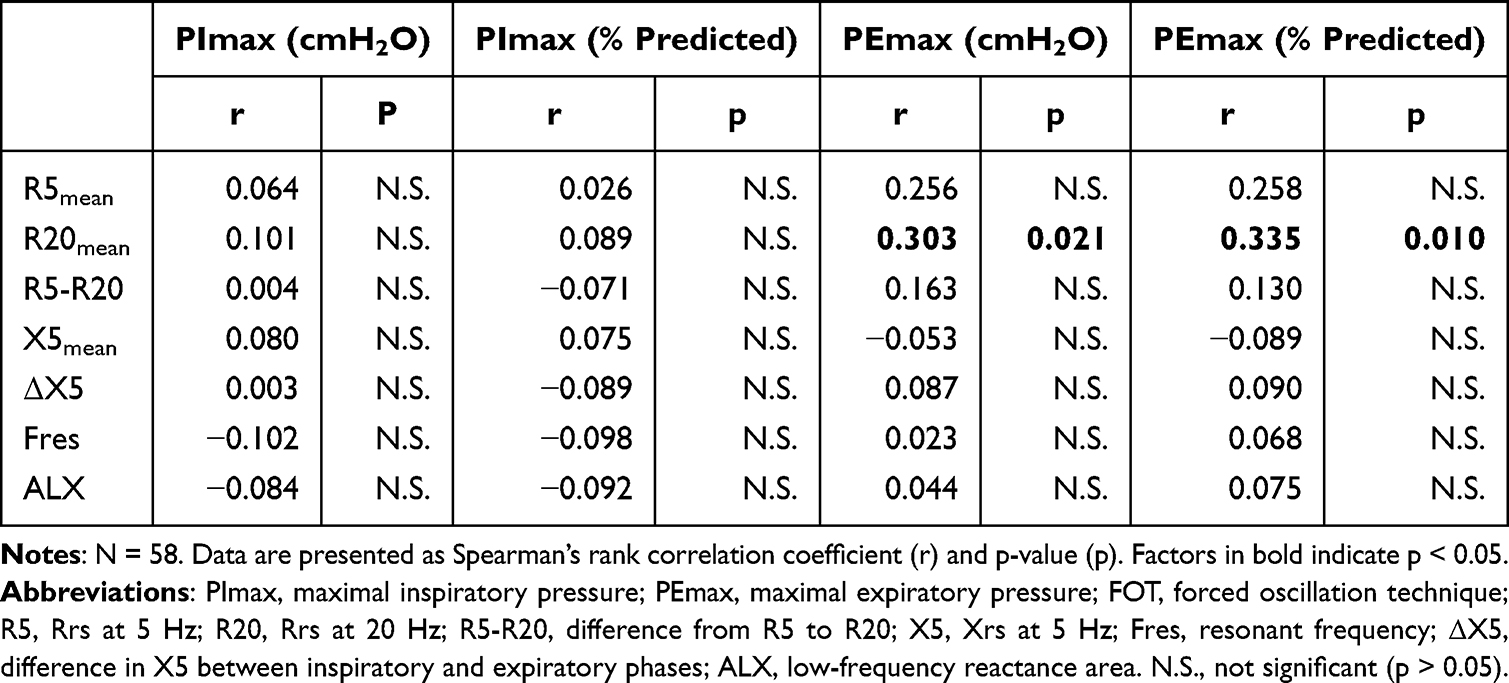 |
Table 4 Relationship Between Respiratory Muscle Strength and FOT Parameters |
Discussion
We found that both inspiratory and expiratory muscle strengths (PImax and PEmax, respectively) reflected the pathophysiology of gas trapping in smokers. Respiratory muscle strength is useful, especially in the early stages of COPD, before emphysematous changes become apparent.
This is the first study to demonstrate that respiratory muscle weakness reflects gas trapping by showing its association with quantitative gas-trapping imaging (Table 2 and Figure 1). Emphysematous changes gradually increase and are delayed by an increase in gas-trapping areas.15 It may precede the presence of emphysematous lesions on CT in patients with COPD. Therefore, the results of this study do not confirm the relationship between emphysema and respiratory muscle strength (Table 2).
When dealing with predicted values of respiratory muscle strength, it is important to note that no globally standardized calculation method exists. Most predictive equations are corrected for age, height, and weight in each sex.16 However, as Souto-Miranda et al pointed out, the measurement methods used in the development of these standards might not comply with the ATS/ERS guideline.16 In Japan, the criteria found by Suzuki et al7 and used in this study are generally applied8 but have not been standardized, as their description has been removed from the latest Japanese COPD guidelines.17 In patients with COPD, different phenotypes have different body shapes (ectomorphic or obese), and racial differences exist.13,18,19 The traditional “pink puffers” phenotype, which has more emphysema, has a lower body mass index than the “blue bloaters” phenotype, which has mainly bronchitis.20 Racial differences have also been noted; Japanese patients with COPD are thinner, older, and more emphysematous than Western patients.18 Body weight is influenced by disease and race, and changes over time with disease progression. The inclusion of body weight in the calculation of reference values for respiratory muscle strength leads to the paradox that the reference values themselves are affected by the disease. Therefore, the predicted values may be considered high or low. We believe it is important to assess the values in absolute terms.
Parameters in pulmonary function tests reflect pathophysiology in smokers (eg, patients with COPD). Expiratory airflow limitation results in an increase in the RV/TLC and pulmonary hyperinflation. Thus, as the RV/TLC increases, the diaphragm becomes flattened, the fiber length of the inspiratory muscles shortens, and PImax decreases. In addition, as emphysematous changes progress, lung compliance increases, and PImax significantly decreases. Similar to PImax, PEmax also varies significantly with lung volume.21 The negative correlation between RV/TLC and PImax and PEmax reflects the pathophysiology mentioned earlier (Table 3). Although FEV1 sensitively reflects the restriction of expiratory airflow due to small airway obstruction, PEmax, which measures only the maximal pressure during expiration, does not adequately capture the degree of small airway obstruction. Similarly, there was no correlation between Pi10 and respiratory muscle strength (Table 2). We believe that PEmax is not an indicator of small airway status in smokers.
The relationship between respiratory muscle strength and lung function in patients with COPD has been reported in several studies, some of which reported results different from ours. Terzano et al reported that FEV1 was positively correlated with both maximal inspiratory pressure (MIP) and maximal expiratory pressure (MEP), identical to PImax and PEmax, respectively.22 However, they reported that RV and RV/TLC ratio did not correlate with either MIP or MEP. Nishimura et al23 reported similar results. First, the measurement position differed (standing in Terzano’s study vs sitting in our study, with Nishimura et al’s study being unclear about the measurement position). PEmax is lower in the standing position than in the sitting position.24 In fact, in Terzano’s study, MEP was approximately 10 cmH2O higher than MIP, whereas in our study, the difference was approximately 30 cmH2O (Table 1). Second, the characteristics of COPD severity differed among participants. Nishimura et al’s study included patients with severe COPD and weight loss, who also had significantly lower measurements of respiratory muscle strength than those in the present study. In contrast, Terzano et al included healthy participants and those with GOLD 1–4. They predicted that patients with COPD could have a decrease in tension produced by inspiratory muscle shortening. However, they concluded that the lack of correlation with RV/TLC was due to the varying degrees of air trapping among patients. Our study is novel and important for two reasons: first, because the measurements followed the ATS/ERS guidelines, and second, because it measured both quantitative imaging parameters and lung function. As this study was conducted on stable outpatients, a relatively large number of patients with mild COPD were included. This allowed us to establish a relationship with gas trapping and clarify the importance of measuring respiratory muscle strength at an early stage. We believe that respiratory muscle strength is a useful indicator that reflects the degree of air trapping (gas trapping), and not the degree of obstructive airflow limitation.
This is the first study to determine the relationship between respiratory muscle strength and the FOT parameters. The FOT was performed during tidal breathing; thus, the FOT parameters were independent of respiratory muscle strength. In addition, Xrs (X5, Fres, and ALX) were associated with a combination of gas trapping and emphysematous change.15 PImax and PEmax were affected by gas trapping but were not good indicators of the extent of emphysematous lesions (Table 4). Therefore, they were not considered related to Xrs. In patients with COPD, changes in R5 occur early in the disease, and the gas-trapping area starts to increase slightly.25 Respiratory muscle weakness is possibly more pronounced after gas trapping becomes apparent. Therefore, R5 and respiratory muscle strength should be independently evaluated.
This study has some limitations. First, this is cross-sectional study with a small sample size. Thus, further studies with a large sample size are warranted to definitively determine the differences between patients with and without COPD and sex differences. Second, this study was conducted at a single institution, and all participants were Japanese. Nevertheless, this study demonstrated the relationship between respiratory muscle strength and functional and imaging parameters in smokers.
Conclusion
Both inspiratory and expiratory muscle strength (PImax and PEmax, respectively) could reflect the pathophysiology of gas trapping in smokers. Respiratory muscle strength proves particularly valuable, especially during the initial phases of COPD, before emphysematous changes manifest. In the future, obtaining long-term results from a large number of cases is expected to reinforce this idea further and lead to highly significant clinical research.
Data Sharing Statement
The data that support the findings of this study are available from the corresponding author upon reasonable request.
Ethics Approval and Informed Consent
This study was approved by the Ethics Committee of SUMS (registration number: R2021-026) and conformed to the tenets of the Declaration of Helsinki, and all participants provided written informed consent prior to their participation.
Acknowledgments
The authors would like to thank Yoko Naito, Yasutaka Horii, Makoto Yamasaki, and Fuko Kikuchi for their assistance throughout this study.
Author Contributions
All authors made a significant contribution to the work reported, whether that is in the conception, study design, execution, acquisition of data, analysis and interpretation, or in all these areas; took part in drafting, revising or critically reviewing the article; gave final approval of the version to be published; have agreed on the journal to which the article has been submitted; and agree to be accountable for all aspects of the work.
Funding
This work was supported by JSPS KAKENHI Grant Number JP 22K16189.
Disclosure
Prof. Dr. Yasutaka Nakano reports grants and/or personal fees from AstraZeneca, GSK, Boehringer Ingelheim, Fukuda Lifetech, Clairvo Technologies, Teijin Pharma, and Pulmonx Japan, outside the submitted work. The authors report no other conflicts of interest in this work.
References
1. Kirby M, Yin Y, Tschirren J, et al. A novel method of estimating small airway disease using inspiratory-to-expiratory computed tomography. Respiration. 2017;94(4):336–8. doi:10.1159/000478865
2. Bhatt SP, Soler X, Wang X, et al. Association between functional small airway disease and FEV1 decline in chronic obstructive pulmonary disease. Am J Respir Crit Care Med. 2016;194(2):178–184. doi:10.1164/rccm.201511-2219OC
3. Ueki J, Kozu R, Ohdaira T, et al. Pulmonary rehabilitation in Japan: a position statement from the Japan society for respiratory care and rehabilitation. J Japan Soc Respiratory Care Rehab. 2018;27(2):95–114. doi:10.15032/jsrcr.27.2_95
4. Neves LF, Reis MH, Plentz RD, Matte DL, Coronel CC, Sbruzzi G. Expiratory and expiratory plus inspiratory muscle training improves respiratory muscle strength in subjects with COPD: systematic review. Respir Care. 2014;59(9):1381–1388. doi:10.4187/respcare.02793
5. Global Initiative for Chronic Obstructive Lung Disease. Global strategy for the diagnosis, management, and prevention of chronic obstructive lung disease, 2023 report.
6. American Thoracic Society/European Respiratory Society. ATS/ERS Statement on respiratory muscle testing. Am J Respir Crit Care Med. 2002;166(4):518–624. doi:10.1164/rccm.166.4.518
7. Suzuki M, Teramoto S, Sudo E, et al. Age-related changes in static maximal inspiratory and expiratory pressures. Nihon Kokyuki Gakkai Zasshi. 1997;35(12):1305–1311.
8. Japanese Respiratory Society. The JRS guidelines for the management of chronic obstructive pulmonary disease. 2018:67
9. Miller MR, Hankinson J, Brusasco V, et al. Standardisation of spirometry. Eur Respir J. 2005;26(2):319–338. doi:10.1183/09031936.05.00034805
10. Sasaki H, Nakamura M, Kida K, Kambe M, Takahashi K, Fujimura M et al. Reference values for spirogram and blood gas analysis in Japanese adults. J Jpn Respir Soc. 2001;39(5):1–17. doi:10.11389/jjars.39050S11
11. Ohishi J, Kurosawa H, Ogawa H, Irokawa T, Hida W, Kohzuki M. Application of impulse oscillometry for within-breath analysis in patients with chronic obstructive pulmonary disease: pilot study. BMJ Open. 2011;1(2):e000184. doi:10.1136/bmjopen-2011-000184
12. Nakano Y, Wong JC, de Jong PA, et al. The prediction of small airway dimensions using computed tomography. Am J Respir Crit Care Med. 2005;171(2):142–146. doi:10.1164/rccm.200407-874OC
13. Van Tho N, Ogawa E, Trang Le TH, et al. A mixed phenotype of airway wall thickening and emphysema is associated with dyspnea and hospitalization for chronic obstructive pulmonary disease. Ann Am Thorac Soc. 2015;12(7):988–996. doi:10.1513/AnnalsATS.201411-501OC
14. Tho NV, Ryujin Y, Ogawa E, et al. Relative contributions of emphysema and airway remodelling to airflow limitation in COPD: consistent results from two cohorts. Respirology. 2015;20(4):594–601. doi:10.1111/resp.12505
15. Matsuo Y, Ogawa E, Tsunoda Y, et al. Inspiratory and expiratory computed tomography imaging clusters reflect functional characteristics in chronic obstructive pulmonary disease. Int J Chron Obstruct Pulmon Dis. 2023;18:1047–1055. doi:10.2147/copd.s405845
16. Souto-Miranda S, Jácome C, Alves A, et al. Predictive equations of maximum respiratory mouth pressures: a systematic review. Pulmonology. 2021;27(3):219–239. doi:10.1016/j.pulmoe.2020.03.003
17. Garbacz SA, Kaul M, Zahn M, Godfrey E, Flack C. The JRS guidelines for the management of chronic obstructive pulmonary disease. New Direct Child Adolesc Develop. 2022;2022(183–184):71. doi:10.1002/cad.20481
18. Takahashi S, Betsuyaku T. The chronic obstructive pulmonary disease comorbidity spectrum in Japan differs from that in western countries. Respir Investig. 2015;53(6):259–270. doi:10.1016/j.resinv.2015.05.005
19. Ogawa E, Nakano Y, Ohara T, et al. Body mass index in male patients with COPD: correlation with low attenuation areas on CT. Thorax. 2009;64(1):20–25. doi:10.1136/thx.2008.097543
20. Filley GF, Beckwitt HJ, Reeves JT, Mitchell RS. Chronic obstructive bronchopulmonary disease. II. Oxygen transport in two clinical types. Am J Med. 1968;44(1):26–38. doi:10.1016/0002-9343(68)90234-9
21. Black LF, Hyatt RE. Maximal static respiratory pressures in generalized neuromuscular disease. Am Rev Respir Dis. 1971;103(5):641–650. doi:10.1164/arrd.1971.103.5.641
22. Terzano C, Ceccarelli D, Conti V, Graziani E, Ricci A, Petroianni A. Maximal respiratory static pressures in patients with different stages of COPD severity. Respir Res. 2008;9(1):8. doi:10.1186/1465-9921-9-8
23. Nishimura Y, Tsutsumi M, Nakata H, Tsunenari T, Maeda H, Yokoyama M. Relationship between respiratory muscle strength and lean body mass in men with COPD. Chest. 1995;107(5):1232–1236. doi:10.1378/chest.107.5.1232
24. Kera T, Maruyama H. Study of influence factor on maximal mouth pressure part I. Influence of posture. J Phys Ther Sci. 2001;13(2):153–160. doi:10.1589/jpts.13.153
25. Matsuo Y, Ogawa E, Seto-Yukimura R, et al. Novel respiratory impedance-based phenotypes reflect different pathophysiologies in chronic obstructive pulmonary disease patients. Int J Chron Obstruct Pulmon Dis. 2019;14:2971–2977. doi:10.2147/copd.s224902
 © 2026 The Author(s). This work is published and licensed by Dove Medical Press Limited. The
full terms of this license are available at https://www.dovepress.com/terms
and incorporate the Creative Commons Attribution
- Non Commercial (unported, 4.0) License.
By accessing the work you hereby accept the Terms. Non-commercial uses of the work are permitted
without any further permission from Dove Medical Press Limited, provided the work is properly
attributed. For permission for commercial use of this work, please see paragraphs 4.2 and 5 of our Terms.
© 2026 The Author(s). This work is published and licensed by Dove Medical Press Limited. The
full terms of this license are available at https://www.dovepress.com/terms
and incorporate the Creative Commons Attribution
- Non Commercial (unported, 4.0) License.
By accessing the work you hereby accept the Terms. Non-commercial uses of the work are permitted
without any further permission from Dove Medical Press Limited, provided the work is properly
attributed. For permission for commercial use of this work, please see paragraphs 4.2 and 5 of our Terms.
Recommended articles
Phenotyping COPD Patients with Emphysema Distribution Using Quantitative CT Measurement; More Severe Airway Involvement in Lower Dominant Emphysema
Park J, Kim EK, Lee SH, Kim MA, Kim JH, Lee SM, Lee JS, Oh YM, Lee SD, Lee JH
International Journal of Chronic Obstructive Pulmonary Disease 2022, 17:2013-2025
Published Date: 31 August 2022
Association Between Empirical Anti-Pseudomonal Antibiotics for Recurrent Lower Respiratory Tract Infections and Mortality: A Retrospective Cohort Study
Shiroshita A, Yamamoto S, Anan K, Suzuki H, Takeshita M, Kataoka Y
International Journal of Chronic Obstructive Pulmonary Disease 2022, 17:2919-2929
Published Date: 17 November 2022
Impact of Interstitial Lung Abnormalities on Disease Expression and Outcomes in COPD or Emphysema: A Systematic Review
Liu Y, Tang J, Sun Y
International Journal of Chronic Obstructive Pulmonary Disease 2023, 18:189-206
Published Date: 2 March 2023
MicroRNA Let-7 Induces M2 Macrophage Polarization in COPD Emphysema Through the IL-6/STAT3 Pathway
Liu T, Zhang Z, Shen W, Wu Y, Bian T
International Journal of Chronic Obstructive Pulmonary Disease 2023, 18:575-591
Published Date: 13 April 2023
Inspiratory and Expiratory Computed Tomography Imaging Clusters Reflect Functional Characteristics in Chronic Obstructive Pulmonary Disease
Matsuo Y, Ogawa E, Tsunoda Y, Yamazaki A, Kawashima S, Uchida Y, Nakagawa H, Kinose D, Yamaguchi M, Nakano Y
International Journal of Chronic Obstructive Pulmonary Disease 2023, 18:1047-1055
Published Date: 6 June 2023