Back to Journals » International Journal of Chronic Obstructive Pulmonary Disease » Volume 18
Inspiratory and Expiratory Computed Tomography Imaging Clusters Reflect Functional Characteristics in Chronic Obstructive Pulmonary Disease
Authors Matsuo Y ![]() , Ogawa E
, Ogawa E ![]() , Tsunoda Y, Yamazaki A, Kawashima S, Uchida Y, Nakagawa H
, Tsunoda Y, Yamazaki A, Kawashima S, Uchida Y, Nakagawa H ![]() , Kinose D
, Kinose D ![]() , Yamaguchi M
, Yamaguchi M ![]() , Nakano Y
, Nakano Y ![]()
Received 31 January 2023
Accepted for publication 28 May 2023
Published 6 June 2023 Volume 2023:18 Pages 1047—1055
DOI https://doi.org/10.2147/COPD.S405845
Checked for plagiarism Yes
Review by Single anonymous peer review
Peer reviewer comments 2
Editor who approved publication: Professor Min Zhang
Yumiko Matsuo,1,2 Emiko Ogawa,1,2 Yoko Tsunoda,1 Akio Yamazaki,1 Satoru Kawashima,1 Yasuki Uchida,1 Hiroaki Nakagawa,1 Daisuke Kinose,1 Masafumi Yamaguchi,1 Yasutaka Nakano1
1Division of Respiratory Medicine, Department of Internal Medicine, Shiga University of Medical Science, Otsu, Shiga, Japan; 2Health Administration Center, Shiga University of Medical Science, Otsu, Shiga, Japan
Correspondence: Emiko Ogawa, Health Administration Center, Shiga University of Medical Science, Seta Tsukinowa-cho, Otsu, Shiga, 520-2192, Japan, Tel/Fax +81-77-548-2212, Email [email protected]
Purpose: Disease probability measure (DPM) is a useful voxel-wise imaging assessment of gas-trapping and emphysematous lesions in patients with chronic obstructive pulmonary disease (COPD). To elucidate the progression of COPD, we performed a cluster analysis using the following DPM parameters: normal (DPMNormal), gas-trapping (DPMGasTrap), and emphysematous lesions (DPMEmph). Our findings revealed the characteristics of each cluster and the 3-year disease progression using imaging parameters.
Patients and Methods: Inspiratory and expiratory chest computed tomography (CT) images of 131 patients with COPD were examined, of which 84 were followed up for 3 years. The percentage of low attenuation volume (LAV%) and the square root of the wall area of a hypothetical airway with an internal perimeter of 10 mm (√Aaw at Pi10) were quantitatively measured using inspiratory chest CT. A hierarchical cluster analysis was performed using the DPM parameters at baseline. Five clusters were named according to the dominant DPM parameters: normal (NL), normal-GasTrap (NL-GT), GasTrap (GT), GasTrap-Emphysema (GT-EM), and Emphysema (EM).
Results: Women were predominantly diagnosed with GT. Forced expiratory volume in 1 s gradually decreased in the following order: NL, NL-GT, GT, GT-EM, and EM. DPMEmph correlated well with LAV%. Four clusters other than NL showed significantly higher values of √Aaw at Pi10 than NL; however, no significant differences were observed among them. In all clusters, DPMEmph increased after 3 years. DPMNormal only increased in the GT cluster.
Conclusion: Clusters using DPM parameters may reflect the characteristics of COPD and help understand the pathophysiology of the disease.
Keywords: cluster analysis, computed tomography, COPD, DPM, gas-trapping, emphysema
Introduction
Chronic obstructive pulmonary disease (COPD) is a progressive disease characterized by small airway disease and parenchymal destruction.1,2 This pathophysiology is mixed in various ratios and increases at various rates.3
Recently, voxel-wise image analysis using co-registered inspiration and expiration computed tomography (CT) scans has been developed to quantitatively distinguish functional airway diseases with air trapping from emphysematous lesions. Such analyses include parametric response mapping (PRM)4 and disease probability measure (DPM),5 which were applied to this method. With the progression of COPD, the destruction of the lung parenchyma leads to the loss of bronchiolar-alveolar attachments, which, in turn, causes gas-trapping and emphysematous changes.3 This pathophysiology is reflected by DPM and PRM parameters.4,5
We hypothesized that the imaging clusters that were analyzed based on the quantitative DPM parameters would be useful in considering progressive imaging changes. In this study, we revealed a better understanding of the relationship between DPM analysis and other COPD parameters.
Materials and Methods
Study Population
A total of 131 patients with COPD who visited the respiratory outpatient clinic of the Shiga University of Medical Science (SUMS) Hospital between August 2013 and November 2016 were enrolled in the SUMS COPD Cohort Study. The eligibility criteria included: 1) smoking history of more than 10 pack-years or long-term biomass exposure; 2) no COPD exacerbation within 4 weeks prior to enrollment; and 3) no uncontrolled comorbidities, such as severe heart failure, malignant diseases, or other chronic lung diseases. Treatments differed among the study population according to the clinical judgment of the treating physician. COPD was diagnosed using a post-bronchodilator ratio of forced expiratory volume in 1 s (FEV1)/forced vital capacity (FVC) < 0.70 according to the Global Initiative for Chronic Obstructive Lung Disease (GOLD) recommendations.3,6
This study was approved by the Ethics Committee of SUMS (registration number: 27–11) and conformed to the tenets of the Declaration of Helsinki, and all participants provided written informed consent prior to their participation.
Pulmonary Function Tests and Fractional Exhaled Nitric Oxide (FeNO)
Spirometry was performed after inhalation of 20 µg procaterol using a FUDAC77 spirometer (Fukuda Denshi, Tokyo, Japan), according to the American Thoracic Society/European Respiratory Society guidelines.7 Carbon monoxide diffusing capacity was measured using the single-breath washout technique. Predicted spirometry values were calculated in accordance with the guidelines of the Japanese Respiratory Society.8 FeNO was measured before inhalation of procaterol using NIOX (Circassia AB, Uppsala, Sweden).
Forced Oscillation Technique (FOT)
Indices of the FOT were measured after inhalation of 20 μg procaterol using MostGraph-01 (Chest M.I., Inc., Tokyo, Japan).9 The FOT indices at each oscillatory frequency (4–35 Hz), such as the respiratory resistance (Rrs), respiratory reactance (Xrs) at 5 or 20 Hz (R5, R20, and X5), resonant frequency (Fres), and low-frequency reactance (ALX), were calculated automatically using fast Fourier transformation methods. Each oscillatory index was expressed as the mean value of the five respiratory cycles.
Inspiratory and Expiratory Chest CT
Volumetric non-contrast chest CT was performed in the supine position using a 320-detector row CT scanner (Aquilion ONE, Canon Medical Systems Corporation, Tochigi, Japan) with either full inspiration or expiration after inhalation of 20 μg procaterol. The CT images were reconstructed with a 1.0-mm slice thickness at 0.5-mm intervals using the FC03 (mediastinal kernel) algorithm.
The percentage of low attenuation volume (LAV%), which is a characteristic parameter of emphysematous lesions, and the square root of the wall area of a hypothetical airway with an internal perimeter of 10 mm (√Aaw at Pi10),10 which is an index reflecting airway lesions, were quantitatively measured using Apollo software (VIDA, Coralville, IA, USA), as previously described.1,11
Disease Probability Measure (DPM)
DPM is a quantitative measure of voxel analysis based on the registration of paired inspiration and expiration CT scans, as previously reported by Kirby et al.5 Briefly, DPM classifies each voxel as normal (DPMNormal), emphysematous (DPMEmph), or gas trapping (DPMGasTrap), which is referred to as functional small airway disease by combining the probability of gas trapping and emphysema, as calculated by inspiratory-to-expiratory intensity differences. The DPM analyses were performed using VIDA, as described previously.5
For 84 participants, DPM analyses were performed using CT follow-up data after 3 years. There was no consistent treatment intervention during the three years; changes in treatment were at the discretion of the clinician.
Cluster Analysis and Other Statistical Methods
First, the DPM parameters (DPMNormal, DPMGasTrap, and DPMEmph) were used to identify the clusters. Hierarchical cluster analysis was performed using Ward’s method.12 The number of clusters was set to five. Second, comparisons among each cluster of characteristics, functional parameters, and imaging biomarkers were evaluated using the Wilcoxon rank-sum test. All statistical analyses were performed using JMP software v.11 (SAS Institute, Cary, NC, USA).
Results
Characteristics of Imaging Clusters
Figure 1 shows the ratio of each DPM parameter. The clusters (x axis) were named as follows, based on the dominance of the three DPM parameters (y axis): Normal (NL), Normal-GasTrap (NL-GT), GasTrap (GT), GasTrap-Emphysema (GT-EM), and Emphysema (EM). The number of patients in the NL, NL-GT, GT, GT-EM, and EM clusters were 32, 20, 33, 32, and 14, respectively.
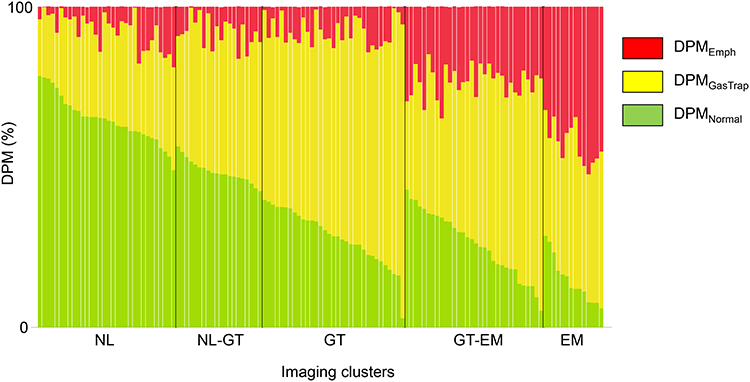 |
Figure 1 The percentage of three DPM parameters for the five imaging clusters in 131 subjects. Bars show the percentage of DPMNormal (green), DPMGasTrap (yellow), and DPMEmph (red). The number of subjects comprised 32, 20, 33, 32, and 14 in the NL, NL-GT, GT, GT-EM, and EM clusters, respectively. Abbreviations: DPM, disease probability measure; DPMNormal, normal lesion recognized by DPM; DPMGasTrap, gas-trapping lesion recognized by DPM; DPMEmph, emphysematous lesion recognized by DPM; NL, normal cluster; NL-GT, Normal-GasTrap cluster; GT, GasTrap cluster; GT-EM, GasTrap-Emphysema cluster; EM, emphysema cluster. |
Table 1 presents the characteristics of the imaging clusters. Patients in the NL group tended to be younger and smoked fewer cigarettes than the others. Body mass index (BMI) was low in the GT-EM and EM groups and markedly lower in the EM group. The EM group showed significantly higher scores on the modified Medical Research Council dyspnea scale than the other cluster groups. Regarding treatment, patients without inhalants were mainly present in the NL and NL-GT groups (37.5% of the NL and 45% of the NL-GT groups). Monotherapy, long-acting muscarinic receptor antagonists (LAMA) or long-acting β2 agonists (LABA) were prominent in the NL, NL-GT, and GT groups, whereas combination therapy (LAMA + LABA) was administered in the GT-EM and EM groups. Approximately one-third of the patients with EM were treated with triple therapy (inhaled corticosteroid + LAMA + LABA).
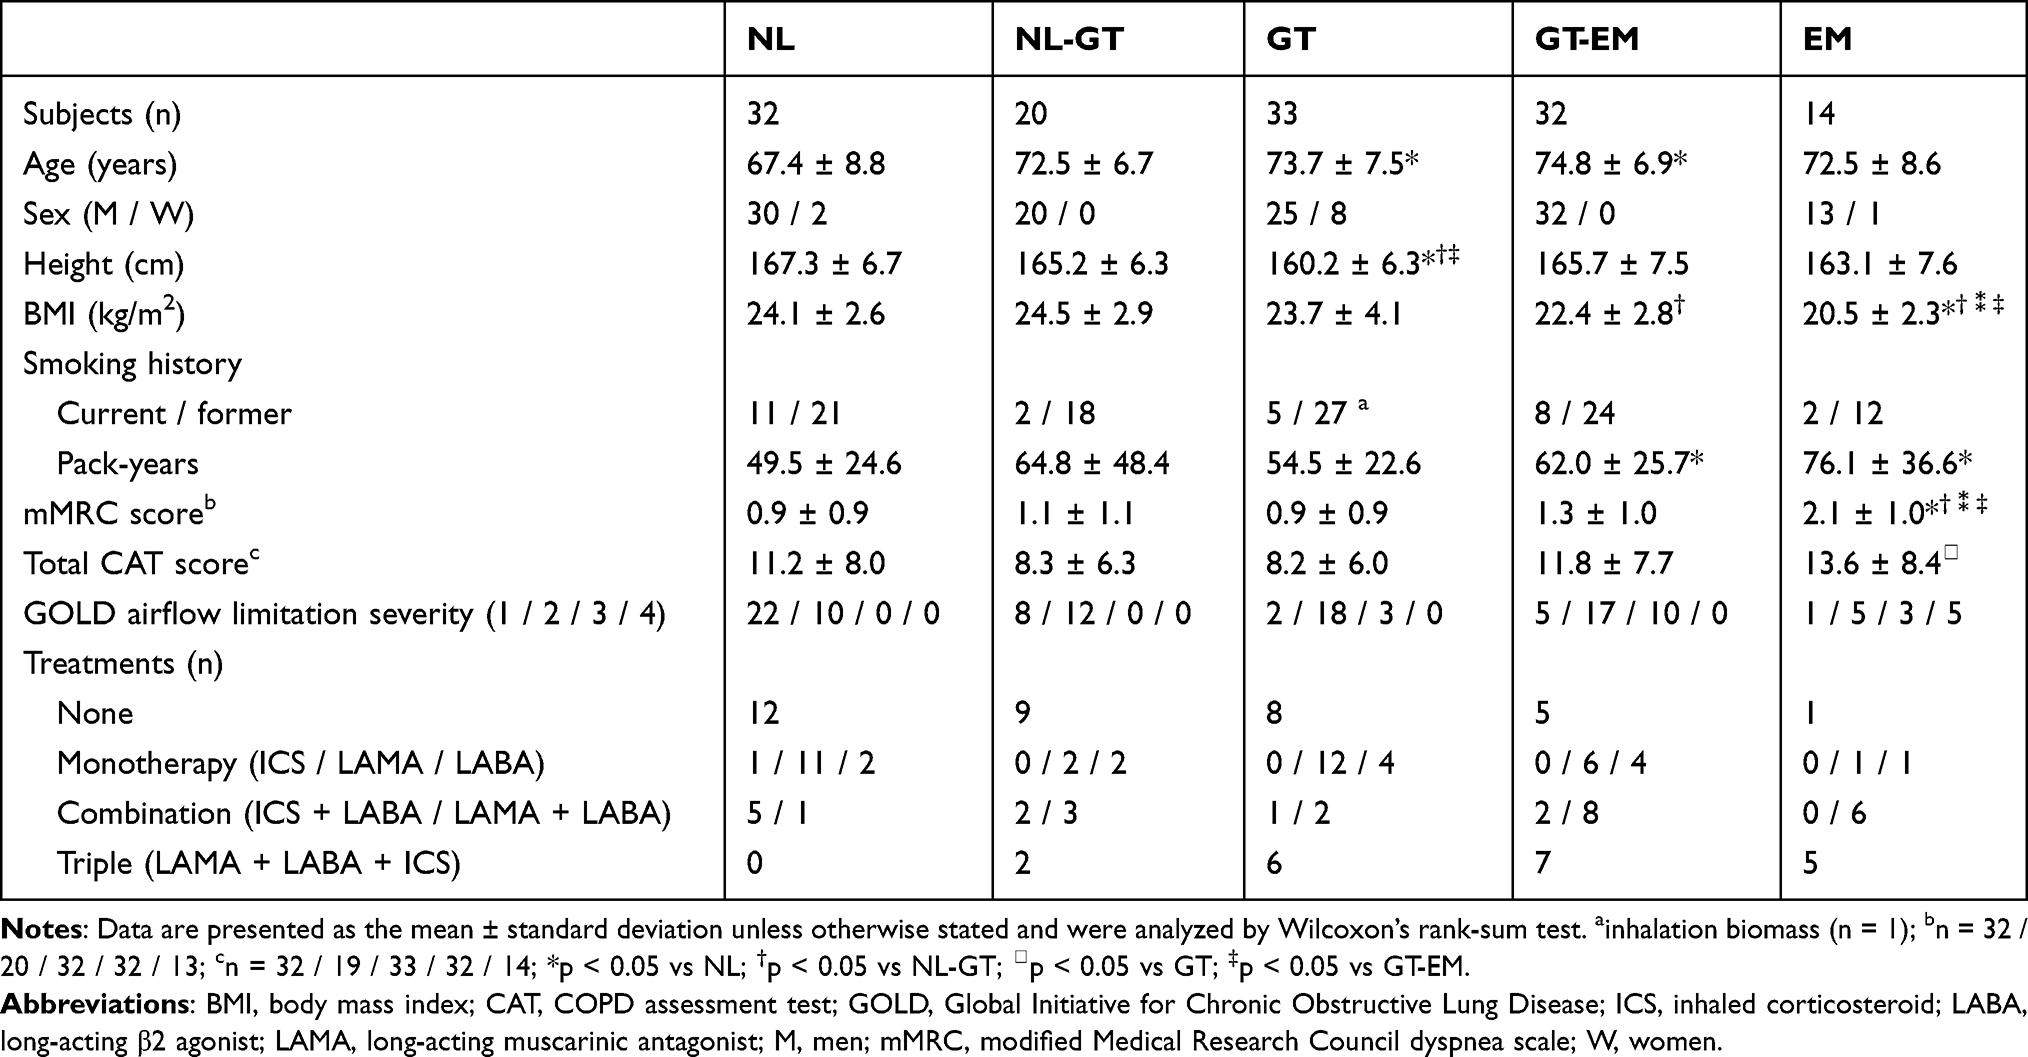 |
Table 1 Characteristics of the Five Imaging Clusters |
Pulmonary Functions and FeNO of Imaging Clusters
Table 2 shows the comparison of pulmonary function and FeNO values among the imaging clusters. The EM group showed significantly lower VC (% predicted) and FVC (% predicted) and the highest residual volume/total lung capacity (RV/TLC) value. Although no significant difference in FEV1 (% predicted) was detected between NL and NL-GT, the FEV1 (% predicted) tended to be lower in the NL-GT group than in the NL group. In the GT group, the FEV1 (% predicted) was significantly lower than in the NL group. The GT-EM group showed a significantly lower FEV1 (% predicted) than the NL, NL-GT, and GT groups; in addition, the EM group showed lower values than the other clusters. The DLco/VA value was significantly lower in the GT-EM group than in the NL, NL-GT, and GT groups, and it was lowest in the EM group. The FeNO values were not significantly different among the clusters.
 |
Table 2 Pulmonary Functions and FeNO Among the Five Imaging Clusters |
FOT Parameters of Imaging Clusters
Table 3 shows comparisons of the FOT indices among the imaging clusters. Although no significant differences in the FOT indices were detected between the NL and NL-GT groups, Rrs (R5, R20), frequency dependence (R5-R20), Fres, and ALX tended to be higher, whereas X5 tended to be lower in the NL-GT group. Rrs and R5-R20 were significantly higher in the GT, GT-EM, and EM groups than in the NL group. Fres and ALX were significantly higher and X5 was significantly lower in the GT, GT-EM, and EM groups than in the NL and NL-GT groups. The EM group showed the highest Rrs, R5-R20, Fres, and ALX and the lowest X5 among the five groups.
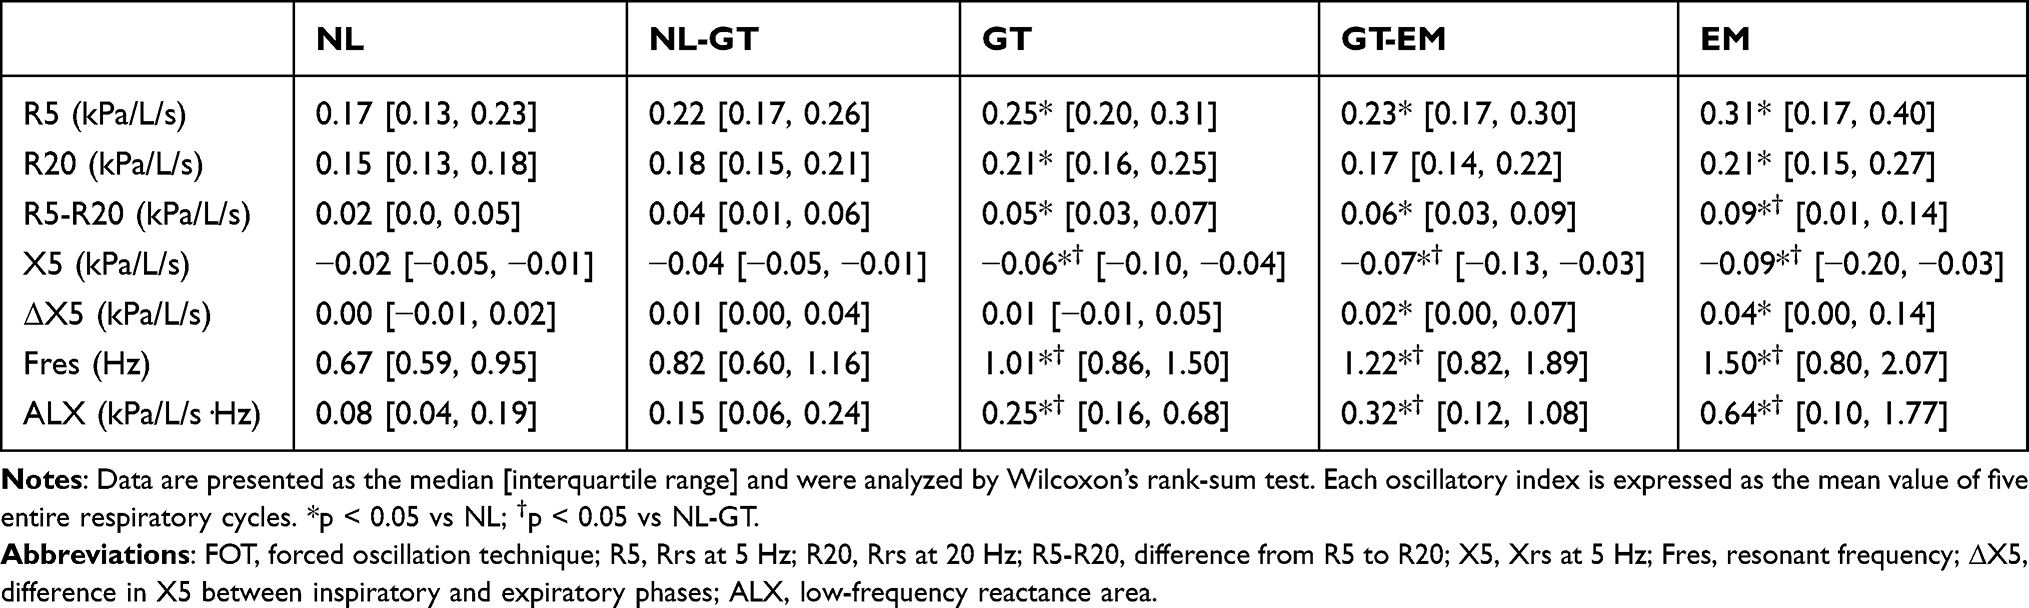 |
Table 3 FOT Parameters Among the Five Imaging Clusters |
CT Imaging Biomarkers of Imaging Clusters
Figure 2 shows CT imaging biomarkers among the five clusters. The LAV% was significantly higher in the GT-EM group than in the NL, NL-GT, and GT groups. It was also significantly higher in the EM than in the GT-EM group. Four clusters other than the NL group showed significantly higher values of √Aaw at Pi10, but no significant differences were observed among the four clusters.
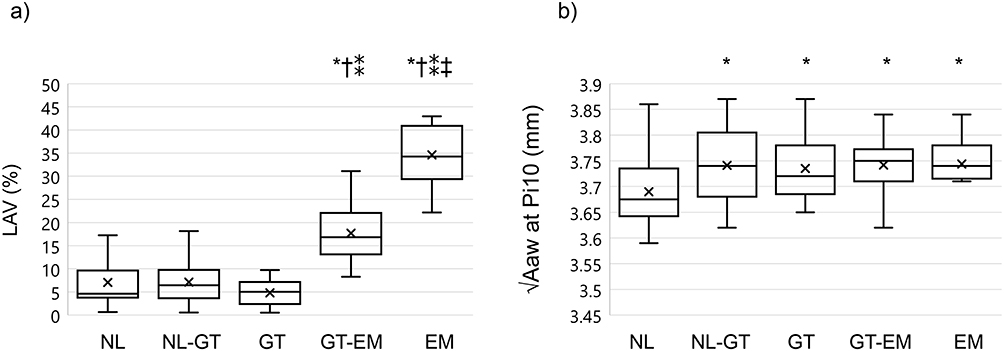 |
Figure 2 Comparison of computed tomography imaging biomarkers among the imaging clusters. Box plot of (a) LAV% and (b) √Aaw at Pi10 according to imaging clusters. The x mark shows the mean value. The Wilcoxon rank-sum test was used to compare computed tomography imaging biomarkers among clusters. *p < 0.05 compared with NL; †p < 0.05 compared with NL-GT; ⁑p < 0.05 compared with GT; ‡p < 0.05 compared with GT-EM. Abbreviations: LAV%, percentage of low attenuation volume; √Aaw at Pi10, square root of the wall area of a hypothetical airway with an internal perimeter of 10 mm; NL, normal cluster; NL-GT, Normal-GasTrap cluster; GT, GasTrap cluster; GT-EM, GasTrap-emphysema cluster; EM, emphysema cluster. |
Longitudinal Changes of DPM Parameters by Imaging Clusters
Figure 3 shows the change in DPM after 3 years for each cluster. The numbers of subjects in the NL, NL-GT, GT, GT-EM, and EM clusters were 19, 14, 23, 20, and 8, respectively. In all clusters, DPMEmph increased during the follow-up period. Except for GT, DPMNormal decreased, and DPMGasTrap increased. During the 3 years, one former smoker in the NL group and one in the NL-GT group resumed smoking. On the other hand, two current smokers in the NL group, one in the GT group, and one in the EM group quit smoking. Six participants had pneumonia, but none of them had imaging changes after pneumonia. Treatment was changed at the discretion of the clinician; this included a change from no treatment to monotherapy or a change from monotherapy to combination therapy, among others (Supplementary Table 1). Only one person in the EM group received rehabilitation.
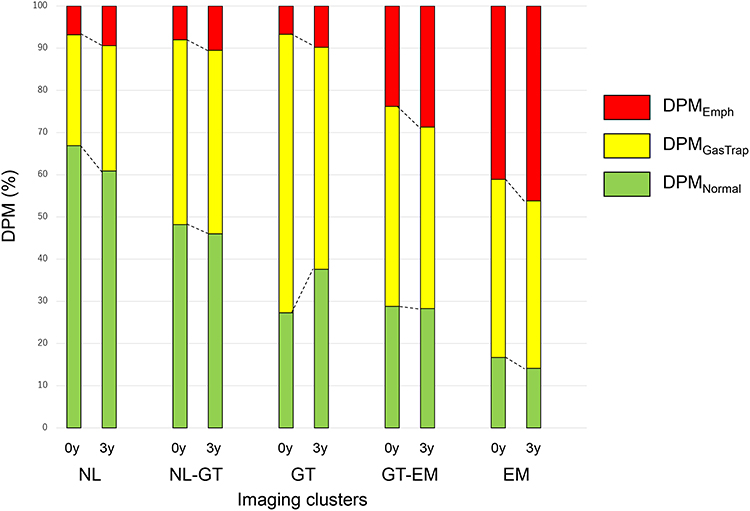 |
Figure 3 Longitudinal changes in DPM parameters of the imaging clusters. The baseline data and the 3-year follow-up data of 84 subjects are shown side-by-side. Bars show the mean percentage data of DPMNormal (green), DPMGasTrap (yellow), and DPMEmph (red). The number of subjects comprised 19, 14, 23, 20, and 8 in the NL, NL-GT, GT, GT-EM, and EM clusters, respectively. Abbreviations: DPM, disease probability measure; DPMNormal, normal lesion recognized by DPM; DPMGasTrap, gas-trapping lesion recognized by DPM; DPMEmph, emphysematous lesion recognized by DPM; NL, normal cluster; NL-GT, Normal-GasTrap cluster; GT, GasTrap cluster; GT-EM, GasTrap-Emphysema cluster; EM, emphysema cluster. |
Discussion
We proposed that analyzing imaging clusters using DPM parameters would reveal the features of each cluster and the relationship between the imaging parameters and functional indicators. This is the first study to evaluate the progress of DPM parameters by demonstrating the longitudinal image changes for each cluster.
Both gas-trapping and emphysematous lesions increase with COPD progression.13–16 It has been reported that the gas-trapping area was predominant in the early stages of COPD, namely GOLD stages 1 and 2, while emphysema gradually increased and eventually became predominant.15 The imaging clusters and follow-up data after 3 years in the current study demonstrate the gradual progression of DPM parameters (Figure 3). When we focused on the NL and NL-GT groups, we found that the replacement of the normal area by gas-trapping area markedly proceeded and the emphysematous area gradually increased. Contrastingly, in the GT cluster, some gas-trapping areas were found to revert to normal. In the GT-EM and EM groups, the replacement of the gas-trapping area with emphysematous lesions became more remarkable. Regarding the longitudinal changes in DPM parameters, while emphysematous lesions are irreversible, it appears that reversibility to normal is possible for gas-trapping lesions.
Correlations between the inspiratory-expiratory CT imaging parameters and the pulmonary function and FOT values have been reported previously.14,17 The DPMGasTrap value is expected to initially increase and then gradually decrease thereafter with COPD progression. In this study, the NL-GT and GT-EM clusters (equivalent DPMGasTrap values) were divided into different types to evaluate the characteristics that cannot be determined by the absolute values of DPMGasTrap alone.
Women were predominantly represented in the GT cluster (Table 1). This may mean that female patients with COPD may have fewer emphysematous lesions than men.18 In the GT-EM and EM groups, BMI was lower than in the other clusters and showed a marked decrease in the EM group. This reflects the finding of a low BMI in association with emphysema in patients with COPD.19
The relationship between treatments and DPM parameters has not yet been elucidated. Although we expected that the attending physicians would have prescribed inhaled corticosteroids together with bronchodilators to patients with prominent gas-trapping lesions, we found no such association between the prescription of inhaled corticosteroids and gas trapping (Table 1). The treatments were selected by a pulmonologist based on the severity of pulmonary function and symptoms. Therefore, the prescription of inhaled corticosteroids could be related to a history of exacerbations and seasonal changes in symptoms. Moreover, FeNO appears to be unrelated to gas trapping (Table 2). Furthermore, these clusters may not identify eosinophilic inflammation or asthmatic components.
Notably, we found that imaging changes consistent with emphysema or gas-trapping over time were significantly associated with decreases in FEV1 and FEV1 (% predicted) (Table 2). Further, RV increases because of the loss of bronchiolar-alveolar attachments caused by the destruction of the lung parenchyma and limitation of expiratory flow in COPD. In the GT, GT-EM, and EM clusters, an increase in both the gas-trapping area and emphysematous lesions led to an increase in RV/TLC. We propose that RV might be derived from both gas-trapping areas and emphysematous changes, not just from emphysema. Conversely, reduced DLCO may primarily be due to alveolar destruction caused by emphysematous changes.
Previously, we reported that X5 may reflect both the gas-trapping area and airway lesions, which eventually develop into emphysema.20 Furthermore, Xrs (X5, Fres, and ALX) was associated with a combination of gas-trapping and emphysematous changes on imaging in this study (Table 3), which is consistent with our previous report.20 The difference between the inspiratory and expiratory phases of X5 (ΔX5) reflects the expiratory flow limitation (EFL).21 As already reported by Mikamo et al,22 EFL is dependent on the degree of emphysema; in the present study, the degree of emphysematous lesions, and not gas-trapping lesions, may have a significant influence on ΔX5 values. R5-R20 is an indicator of frequency dependence, which is related to airway obstruction.21 Therefore, based on the findings presented in Table 2, a correlation was found between R5-R20 and the gradual changes in the imaging clusters.
We performed CT-based phenotyping (airway-dominant, emphysema-dominant, and mixed phenotypes) using LAV% and √Aaw at Pi10 as indicators.11,23 DPMEmph correlates well with LAV% (Figure 2). In contrast, there was no significant difference in √Aaw at Pi10 between the four clusters, except for the NL cluster. Airway lesions, unlike emphysema, are present to various degrees, which is independent of the severity of COPD. The fact that Rrs was not noticeably different among the clusters other than NL suggests that it is related to the same pathophysiology present in the other clusters. Gas-trapping assessed by DPM reflects air trapping that is temporarily produced by EFL, rather than an organic and irreversible airway thickening. Therefore, DPMGasTrap may be useful as a reversibility indicator to monitor pharmaceutical effects.
This study had several limitations. First, it was a retrospective cohort study conducted at a single institution. Second, the number of subjects is insufficient to definitively determine the relationship between treatment and imaging assessment. Third, this study was aimed at COPD patients, and the women were too few for reliable comparison with men. We believe that gender differences are an important consideration. Further studies are needed to clarify this. Finally, changes in the DPM over time were evaluated for the whole lung; hence, we could not confirm the changes of each voxel.
Conclusion
Cluster analysis using DPM parameters may reflect the characteristics of COPD and help us understand its pathophysiology.
Abbreviations
√Aaw at Pi10, square root of the wall area of a hypothetical airway with an internal perimeter of 10 mm; ALX, low-frequency reactance; CT, computed tomography; COPD, chronic obstructive pulmonary disease; DPM, disease probability measure; EM, Emphysema cluster; FEV1, forced expiratory volume in 1s; FOT, forced oscillation technique; Fres, resonant frequency; FVC, forced vital capacity; GOLD, Global Initiative for Chronic Obstructive Lung Disease; GT, GasTrap cluster; GT-EM, GasTrap-Emphysema cluster; LABA, long-acting β2 agonist; LAV%, low attenuation volume; LAMA, long-acting muscarinic antagonist; NL, normal cluster; NL-GT, Normal-GasTrap cluster; PRM, parametric response mapping; Rrs, respiratory system resistance; Xrs, respiratory system reactance.
Data Sharing Statement
The data that support the findings of this study are available from the corresponding author upon reasonable request.
Ethics Approval and Informed Consent
This study was approved by the Ethics Committee of SUMS (registration number: 27-11) and conformed to the tenets of the Declaration of Helsinki, and all participants provided written informed consent prior to their participation.
Acknowledgments
The authors would like to thank Yoko Naito, Yukie Miyatake, Yasutaka Horii, Makoto Yamasaki, and Fuko Kikuchi for their continued help throughout the study.
Author Contributions
YM and EO conceived the idea of the study. All authors made a significant contribution to the work reported, whether that is in the conception, study design, execution, acquisition of data, analysis and interpretation, or in all these areas; took part in drafting, revising or critically reviewing the article; gave final approval of the version to be published; have agreed on the journal to which the article has been submitted; and agree to be accountable for all aspects of the work.
Funding
This work was supported by JSPS KAKENHI Grant Number JP 22K16189.
Disclosure
The authors report no conflicts of interest in this work.
References
1. Van Tho N, Ryujin Y, Ogawa E, et al. Relative contributions of emphysema and airway remodelling to airflow limitation in COPD: consistent results from two cohorts. Respirology. 2015;20(4):594–601. doi:10.1111/resp.12505
2. Nakano Y, Muro S, Sakai H, et al. Computed tomographic measurements of airway dimensions and emphysema in smokers. Correlation with lung function. Am J Respir Crit Care Med. 2000;162(3 Pt 1):1102–1108. doi:10.1164/ajrccm.162.3.9907120
3. Global Initiative for Chronic Obstructive Lung Disease. Global strategy for the diagnosis, management, and prevention of Chronic Obstructive Lung Disease, 2022 report; 2022. Available from: https://goldcopd.org/2022-gold-reports-2/.
4. Galbán CJ, Han MK, Boes JL, et al. Computed tomography-based biomarker provides unique signature for diagnosis of COPD phenotypes and disease progression. Nat Med. 2012;18(11):1711–1715. doi:10.1038/nm.2971
5. Kirby M, Yin Y, Tschirren J, et al. A novel method of estimating small airway disease using inspiratory-to-expiratory computed tomography. Respiration. 2017;94(4):336–345. doi:10.1159/000478865
6. Mirza S, Clay RD, Koslow MA, Scanlon PD. COPD Guidelines: a review of the 2018 GOLD report. Mayo Clin Proc. 2018;93(10):1488–1502. doi:10.1016/j.mayocp.2018.05.026
7. Miller MR, Hankinson J, Brusasco V, et al. Standardisation of spirometry. Eur Respir J. 2005;26(2):319–338. doi:10.1183/09031936.05.00034805
8. Sasaki H, Nakamura M, Kida K, Kambe M, Takahashi K, Fujimura M. Reference values for spirogram and blood gas analysis in Japanese adults. J Jpn Respir Soc. 2001;39(5):S1–S17.
9. Ohishi J, Kurosawa H, Ogawa H, Irokawa T, Hida W, Kohzuki M. Application of impulse oscillometry for within-breath analysis in patients with chronic obstructive pulmonary disease: pilot study. BMJ Open. 2011;1(2):e000184. doi:10.1136/bmjopen-2011-000184
10. Nakano Y, Wong JC, de Jong PA, et al. The prediction of small airway dimensions using computed tomography. Am J Respir Crit Care Med. 2005;171(2):142–146. doi:10.1164/rccm.200407-874OC
11. Van Tho N, Ogawa E, Trangle TH, et al. A mixed phenotype of airway wall thickening and emphysema is associated with dyspnea and hospitalization for chronic obstructive pulmonary disease. Ann Am Thorac Soc. 2015;12(7):988–996. doi:10.1513/AnnalsATS.201411-501OC
12. Ward JH. Hierarchical grouping to optimize an objective function. J Am Stat Assoc. 1963;58(301):236–244. doi:10.1080/01621459.1963.10500845
13. Boes JL, Bule M, Hoff BA, et al. The impact of sources of variability on parametric response mapping of lung CT scans. Tomography. 2015;1(1):69–77. doi:10.18383/j.tom.2015.00148
14. Pompe E, Galbán CJ, Ross BD, et al. Parametric response mapping on chest computed tomography associates with clinical and functional parameters in chronic obstructive pulmonary disease. Respir Med. 2017;123:48–55. doi:10.1016/j.rmed.2016.11.021
15. Bhatt SP, Soler X, Wang X, et al. Association between functional small airway disease and FEV1 decline in chronic obstructive pulmonary disease. Am J Respir Crit Care Med. 2016;194(2):178–184. doi:10.1164/rccm.201511-2219OC
16. Boes JL, Hoff BA, Bule M, et al. Parametric response mapping monitors temporal changes on lung CT scans in the subpopulations and intermediate outcome measures in COPD Study (SPIROMICS). Acad Radiol. 2015;22(2):186–194. doi:10.1016/j.acra.2014.08.015
17. Ostridge K, Gove K, Paas KHW, et al. Using novel computed tomography analysis to describe the contribution and distribution of emphysema and small airways disease in chronic obstructive pulmonary disease. Ann Am Thorac Soc. 2019;16(8):990–997. doi:10.1513/AnnalsATS.201810-669OC
18. Martinez FJ, Curtis JL, Sciurba F, et al. Sex differences in severe pulmonary emphysema. Am J Respir Crit Care Med. 2007;176(3):243–252. doi:10.1164/rccm.200606-828OC
19. Ogawa E, Nakano Y, Ohara T, et al. Body mass index in male patients with COPD: correlation with low attenuation areas on CT. Thorax. 2009;64(1):20–25. doi:10.1136/thx.2008.097543
20. Matsuo Y, Ogawa E, Seto-Yukimura R, et al. Novel respiratory impedance-based phenotypes reflect different pathophysiologies in chronic obstructive pulmonary disease patients. Int J Chron Obstruct Pulmon Dis. 2019;14:2971–2977. doi:10.2147/COPD.S224902
21. Shirai T, Kurosawa H. Clinical application of the forced oscillation technique. Intern Med. 2016;55(6):559–566. doi:10.2169/internalmedicine.55.5876
22. Mikamo M, Shirai T, Mori K, et al. Predictors of expiratory flow limitation measured by forced oscillation technique in COPD. BMC Pulm Med. 2014;14:23. doi:10.1186/1471-2466-14-23
23. Higami Y, Ogawa E, Ryujin Y, et al. Increased epicardial adipose tissue is associated with the airway dominant phenotype of chronic obstructive pulmonary disease. PLoS One. 2016;11(2):e0148794. doi:10.1371/journal.pone.0148794
 © 2023 The Author(s). This work is published and licensed by Dove Medical Press Limited. The
full terms of this license are available at https://www.dovepress.com/terms
and incorporate the Creative Commons Attribution
- Non Commercial (unported, 3.0) License.
By accessing the work you hereby accept the Terms. Non-commercial uses of the work are permitted
without any further permission from Dove Medical Press Limited, provided the work is properly
attributed. For permission for commercial use of this work, please see paragraphs 4.2 and 5 of our Terms.
© 2023 The Author(s). This work is published and licensed by Dove Medical Press Limited. The
full terms of this license are available at https://www.dovepress.com/terms
and incorporate the Creative Commons Attribution
- Non Commercial (unported, 3.0) License.
By accessing the work you hereby accept the Terms. Non-commercial uses of the work are permitted
without any further permission from Dove Medical Press Limited, provided the work is properly
attributed. For permission for commercial use of this work, please see paragraphs 4.2 and 5 of our Terms.
Recommended articles
Phenotyping COPD Patients with Emphysema Distribution Using Quantitative CT Measurement; More Severe Airway Involvement in Lower Dominant Emphysema
Park J, Kim EK, Lee SH, Kim MA, Kim JH, Lee SM, Lee JS, Oh YM, Lee SD, Lee JH
International Journal of Chronic Obstructive Pulmonary Disease 2022, 17:2013-2025
Published Date: 31 August 2022
Association Between Empirical Anti-Pseudomonal Antibiotics for Recurrent Lower Respiratory Tract Infections and Mortality: A Retrospective Cohort Study
Shiroshita A, Yamamoto S, Anan K, Suzuki H, Takeshita M, Kataoka Y
International Journal of Chronic Obstructive Pulmonary Disease 2022, 17:2919-2929
Published Date: 17 November 2022
Impact of Interstitial Lung Abnormalities on Disease Expression and Outcomes in COPD or Emphysema: A Systematic Review
Liu Y, Tang J, Sun Y
International Journal of Chronic Obstructive Pulmonary Disease 2023, 18:189-206
Published Date: 2 March 2023
MicroRNA Let-7 Induces M2 Macrophage Polarization in COPD Emphysema Through the IL-6/STAT3 Pathway
Liu T, Zhang Z, Shen W, Wu Y, Bian T
International Journal of Chronic Obstructive Pulmonary Disease 2023, 18:575-591
Published Date: 13 April 2023
Respiratory Muscle Strength and Imaging Parameters in Smokers: A Prospective Observational Study
Matsuo Y, Ogawa E, Iriyama T, Tsunoda Y, Yamazaki A, Uchida Y, Nakagawa H, Kinose D, Yamaguchi M, Nakano Y
International Journal of Chronic Obstructive Pulmonary Disease 2026, 21:570205
Published Date: 6 March 2026