
Back to Journals » Journal of Multidisciplinary Healthcare » Volume 19
Rapid Detection and Diagnosis of Patients with Plantar Fasciitis Based on Integrated YOLOv12n and ResNet34 Framework Using Magnetic Resonance Imaging
Authors Du X, Wang C, Liu Y, Wang J, Shen K  , Zhao H
Received 26 November 2025
Accepted for publication 17 March 2026
Published 27 March 2026 Volume 2026:19 584650
DOI https://doi.org/10.2147/JMDH.S584650
Checked for plagiarism Yes
Review by Single anonymous peer review
Peer reviewer comments 3
Editor who approved publication: Dr Jagdish Khubchandani
Xiangyi Du,1 Chenhui Wang,2 Yifan Liu,2 Junmei Wang,2 Kun Shen,2 Haitao Zhao3
1Department of Rehabilitation, The Third Hospital of Hebei Medical University, Shijiazhuang, Hebei, 050051, People’s Republic of China; 2Department of Medical Imaging, The Third Hospital of Hebei Medical University, Shijiazhuang, Hebei, 050051, People’s Republic of China; 3Department of Foot and Ankle Surgery, The Third Hospital of Hebei Medical University, Shijiazhuang, Hebei, 050051, People’s Republic of China
Correspondence: Xiangyi Du, Department of Rehabilitation, The Third Hospital of Hebei Medical University, No. 139 Ziqiang Road, Shijiazhuang, Hebei, 050051, People’s Republic of China, Email [email protected]
Background: Plantar fasciitis (PF) is the primary cause of heel pain. We aimed to develop a fully automated, computationally efficient deep learning-based system for the PF identification using magnetic resonance imaging (MRI) images.
Methods: A dataset of MRI images from 123 PF patients and 150 controls was collected. Data augmentation methods were applied during training. Four YOLO algorithms (YOLOv8n, YOLOv11n, YOLOv12n, and YOLOv13n) were applied to train object detection models for locating relevant anatomical structures in MRI images. The convolutional neural network, ResNet14, ResNet18, ResNet34, and ResNet50 were used for classification model construction. The optimal models were integrated to form an intelligent diagnostic pipeline.
Results: For object detection models, YOLOv12n model presented the best performance, achieving a mAP50 of 0.907. The YOLOv13n, YOLOv11n and YOLOv8n models achieved mAP50 of 0.904, 0.896 and 0.887, respectively. For classification models, the ResNet34 model outperformed the others with the highest accuracy of 0.9740. Then, YOLOv12n model, as the object detection model, and ResNet34 model, as the classification model, were integrated to construct the intelligent diagnostic process for the automatic identification of PF.
Conclusion: In this study, we innovatively propose an automatic detection process integrating YOLOv12n and ResNet34 to efficiently and automatically identify PF, which demonstrates high potential for streamlining the diagnostic workflow and supporting clinical decision-making. However, the single-center nature of the dataset warrants further external validation in multi-center cohorts to confirm the generalizability of our model.
Keywords: plantar fasciitis, magnetic resonance imaging, you only look once, deep learning, ResNet
Introduction
Plantar fasciitis (PF) stands as the most frequent cause of heel pain among adults.1 The characteristic discomfort, localized in the medial plantar region of the heel, typically manifests upon arising in the morning or taking the initial step after an extended period of inactivity, significantly impairing patients’ quality of life.2 Biomechanical risk factors contributing to this condition encompass prolonged standing, excessive walking or running, obesity, unsuitable footwear, and foot mechanics issues such as high arches or flat feet.3,4 Diagnosis is typically clinical, based on patient history and physical examination, and sometimes involves radiological imaging to exclude other causes of heel pain.5 In most cases, clinical findings are sufficient to diagnose PF. However, imaging may help determine whether an alternate diagnosis is present in patients with pain that lasts longer than three months and does not respond to therapy.6 Imaging is of great help in ensuring accurate diagnosis, facilitating appropriate treatment and aiding in the determination of prognosis.
Magnetic resonance imaging (MRI), renowned for its high soft-tissue resolution, offers a more objective and precise evaluation of morphological changes related to PF, and helps eliminate heel pain for other reasons.7 As the gold standard for diagnosing PF, MRI is particularly valuable when clinical assessment is atypical or when differential diagnosis for heel pain is required.8 However, despite its clinical utility, existing manual MRI assessment methods for PF face significant limitations. Current manual evaluation of plantar fascia thickness is highly operator-dependent, with measurements varying substantially based on individual experience and subjective judgment. The process of manual segmentation and thickness measurement from MRI images is labor-intensive and time-consuming, which limits its feasibility for high-throughput clinical workflows. Critical anatomical considerations further complicate manual assessment, often leading to many missed diagnoses and incorrect diagnoses.9 These challenges underscore the urgent need for the development of automated assessment frameworks.
The deep learning technique is a sophisticated machine learning approach that is widely applied in various fields, such as predicting the mechanism of ligament fatigue failure risk, real-time reconstruction of the temperature field of the HIFU focus, and achieving human gait pattern recognition.10–13 In the realm of image comprehension, it has achieved a remarkable breakthrough, facilitating the identification, classification, and quantification of patterns within medical images, including X-rays, computed tomography (CT) scans, MRI, and pathology slides.14–16 You Only Look Once (YOLO), a revolutionary deep learning approach for object detection, was initially proposed by Joseph Redmon and Andrew Farhadi in 2015.17 It divides the image into grids and performs efficient, end-to-end object detection through a single forward pass, predicting bounding boxes and class probabilities.18 Convolutional neural networks (CNNs) excel in image processing and analysis, but it is characterized by high computational complexity, overfitting to small datasets, and sensitivity to hyperparameters.19 Despite these challenges, CNNs possess the capability to autonomously learn and extract pertinent features directly from input images, eliminating the necessity for manual feature engineering, making it exceptionally well-suited for handing complex and high-dimensional data such as medical images.20
Overall, the continuous iterative refinement and optimization of deep learning algorithms are steadily expanding the horizons of machine learning in medical image analysis. Notably, there are no existing studies that have employed deep learning for the identification of PF. Against this backdrop, our objective is to devise a fully automated, computationally efficient deep learning-based diagnostic system using MRI images to realize accurate and rapid identification of PF, and provide a reliable auxiliary tool for clinical imaging diagnosis.
Material and Methods
Patients
This single-center, retrospective study was approved by the institutional review boards at the Third Hospital of Hebei Medical University (W2020-069-1) and was conducted in accordance with the tenets of the Declaration of Helsinki. Written informed consent was obtained from each participant. Inclusion criteria were age from 18 to 75 years old. Clinical diagnostic criteria of PF: Patients present with fixed heel pain, which is aggravated after morning rise, prolonged and strenuous activity, and can relieve with rest; physical examination shows sharp tenderness at the calcaneus insertion. The patients without PF diseases (such as ankle sprain/burn, ankle fracture, healthy individuals undergoing physical examination, etc.) that had undergone MRI examination were included in this study as normal subjects. Patients with flat foot, Baxter syndrome, rheumatoid disease, ankle tunnel syndrome, diabetic foot disease, fat pad atrophy, heel pad contusion, Achilles tendon disease, calcaneal bursitis, posterior tibial tendinitis and infection or tumor at the heel were excluded.
In total, 273 MRI (sagittal fat-suppressed-proton density weighted imaging [fs-PDWI]) images from 123 patients with PF and 150 controls were included between January 2024 to July 2025 in this study. Magnetic resonance imaging was performed on a Ingenia 3.0T CX (PHILIPS) scanner using a sagittal fs-PDWI [repetition time (TR) = 2810 ms; echo time (TE) = 32 ms; slice thickness = 3 mm; spacing = 0.3mm; Field of view (FOV) = 150 mm × 150 mm; matrix = 300 × 238; flip angle = 150°]. Figure 1 illustrated the overall workflow.
 |
Figure 1 The overall workflow. |
Image Data Augmentation
Considering the robustness of the models and the requirement of a large amount of data in deep learning, systematic data augmentation processing was implemented on the original images of each subject. Specifically, six image augmentation techniques were applied, including salt-and-pepper noise addition, Gaussian noise perturbation, brightness reduction, brightness enhancement, color jitter, and Gaussian blur processing (Figure 2). Each augmentation method set two different parameter configurations (Table 1) to simulate different degrees of image perturbation or change, thereby generating more diverse training samples. Then, 12 augmented images were generated for each original image, thus expanding the original dataset to include 3549 MRI images.
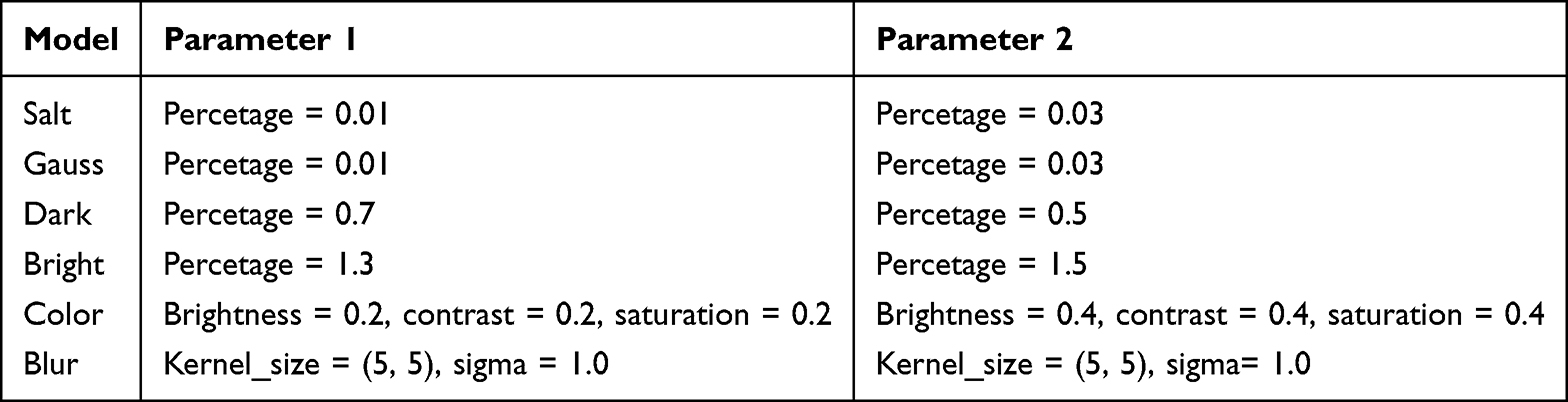 |
Table 1 The Parameter Settings for Image Data Augmentation |
 |
Figure 2 Visualization of data augmentation effects. (A) Original image, (B) Gaussian blur processing, (C) brightness enhancement, (D) color jitter, (E) brightness reduction, (F) Gaussian noise perturbation, (G) salt-and-pepper noise addition. |
ROI Region Label
The labelImg image data annotation software (version 1.8.6, https://pypi.org/project/labelImg/) was used to label the regions of interests (ROIs) of plantar fascia by two professionally trained radiologists with annotation files saved in YOLO format. During the labeling process, only one target area was marked for each image to ensure the uniqueness and accuracy of the annotation information. Specifically, images were labeled as RF, reflecting the pathological state, or Normal, representing the normal plantar structure. Such label design not only helps the model distinguish between pathological and non-pathological states during the training stage, but also provides structured supervisory information for subsequent classification and localization tasks.
Object Detection Models
Considering the sample size, real-time requirements and the computing power of the devices, multiple lightweight variants, including four Nano versions of the YOLO model (YOLOv8n, YOLOv11n, YOLOv12n, and YOLOv13n), were selected for training object detection models.
The model construction was based on the YOLO interface provided by Ultralytics, and a transfer learning strategy was adopted to alleviate the overfitting risk and slow convergence problems during medical small-sample training. The pre-trained weights were adopted as the starting point of the model to accelerate convergence and improve generalization by leveraging the low-level features learned on large-scale natural images. In the input preprocessing stage, the images were resized to 640×640 pixels (imgsz = 640), maintaining the detailed features of medical images while balancing the demand for video memory usage. The total number of training epochs was set to 200 (epochs = 200). At the same time, the early stop mechanism was enabled and the tolerance step number was set to 100 (patience = 100) to avoid meaningless overfitting. The mixed precision (amp = True) was also adopted to reduce video memory usage and increase computational throughput. The optimizer was AdamW (optimizer = “AdamW”) with an initial learning rate of 0.001 (lr0 = 0.001), cosine annealing learning rate scheduling strategy (cos_lr=True), weight decay of 0.0005 (weight_decay = 0.0005), and batch size set of 8 (batch = 8). To achieve a reasonable balance between the localization and classification tasks, the weights of the loss terms were adjusted specifically to moderately enhance the localization accuracy while retaining the classification ability in medical scenarios. The weight for bounding box regression was set to 0.1 (box = 0.1), while the weight for the category loss was set to 1 (cls = 1). The visualization output was enabled (plots = True), and the loss, mAP, and learning rate curves were recorded in real time. The best weights were saved on the validation set. After the training was completed, the final model was saved for subsequent evaluation and deployment. An engineering path was also reserved for model compression, quantization, and inference optimization on the target hardware in the future.
Classification Models
The CNN and residual network (ResNet) were used for classification model construction. The designed CNN consisted of four consecutive convolutional modules, each of which included convolution, batch normalization and ReLU activation. To retain the edge and local structure information as much as possible during downsampling, a 3×3 convolution with a stride of 2 was adopted instead of the traditional pooling operation. The number of channels was gradually increased by 64, 128, 256, and 512 to enhance the feature expression ability. At the end of feature extraction, Dropout was added to alleviate overfitting, and global average pooling was used to aggregate spatial information and achieve final classification output through the fully connected layer. Considering that deep convolutional networks may suffer from degradation issues where performance declines as the depth increases, a residual structure was adopted to improve the optimizability of deep training. The basic components of ResNet include two types of residual units: the BasicBlock composed of two layers of 3×3 convolutions, and the Bottleneck which employs 1×1 dimensionality reduction, 3×3 extraction, and 1×1 dimensionality increase. The residual connection adds the input directly to the output through a shortcut path, providing a shortcut for gradient transmission, alleviating gradient disappearance and improving the convergence stability of deep networks. The constructed ResNet consisted of four residual stages, each composed of several residual units stacked together. The stages were reduced in size through convolution with a stride of 2. The end of the network output classification results through global average pooling and fully connected layers, with weights initialized using He to match the numerical characteristics of ReLU activation. By adjusting the number of residual units in each stage, different depth variants of ResNet could be flexibly generated to adapt to data scale and task complexity.
To achieve a robust generalization evaluation, a ten-fold cross-validation strategy was adopted during the training process. The dataset was partitioned into ten subsets using the patient-wise split strategy. In each iteration, nine folds were used for training and one for testing, ensuring that every sample was used for evaluation exactly once. Final performance metrics were computed by averaging results across all folds, enabling fair and robust comparison of different models. All models were optimized using stochastic gradient descent (SGD), with the optimizer parameters set as the initial learning rate lr = 0.001 and weight decay weight_decay = 0.0001. Additionally, a learning rate scheduler (create_lr_scheduler) was introduced with the training set batch count of 200 as the time scale. The warm-up mechanism (warmup = TRUE) was enabled and the warm-up period was set to the first 10 epochs (warmup_epochs = 10), which gradually increased the initial learning rate and smoothly decreased the learning rate through the scheduling strategy during the subsequent training stages, thus balancing the stability in the early training phase and the convergence in the later stages. The metrics, including accuracy, area under the curve (AUC), precision, recall, mean average precision (mAP), and F1 score, were calculated to evaluate the model performance. Among these metrics, mAP is the most comprehensive index for evaluating model performance, with higher mAP values corresponding to better model performance.
Clinical Interpretability Analysis
The Gradient-weighted Class Activation Mapping (Grad-CAM) visualization technology was further adopted to display the image regions that the model was concerned about during the training process, which enhanced the interpretability of the model and the transparency of its clinical application.
Experimental Environment
The laboratory setup comprised NVIDIA GeForce RTX 4090 24G GPU and Intel(R) Xeon(R) Platinum 8352V @ 2.10 GHz (2 sockets, 64 physical cores, 128 logical threads) CPU. Python 3.9.0 was the development environment, and PyTorch 2.5.0 was the DL framework, and CUDA 13.0 was used for image processing.
Results
Object Detection Models
To eliminate the risk of data leakage and ensure the validity of model evaluation, a patient-wise split strategy was adopted. The core principle was to ensure that all MRI images (original and augmented) from a single patient were exclusively assigned to either the training set or the test set, rather than being distributed across both. The 3549 MRI images (PF = 1599 and Normal = 1950) were divided into a training set and a test set in a roughly 8:2 ratio using the patient-wise split strategy. Then, 2808 MRI images (PF = 1274 and Normal = 1534) were used for YOLO model training, whereas 741 MRI images (PF = 325 and Normal = 416) were set aside for testing. The performances of the object detection models were listed in Table 2. The YOLOv12n model presented the best performance, achieving a mAP50 of 0.907, with 0.864 of precision, 0.851 of recall, 0.857 of F1-score. The YOLOv13n model came second, achieving a mAP50 of 0.904, with 0.887 of precision, 0.828 of recall, and 0.856 of F1-score. The YOLOv11n and YOLOv8n models achieved mAP50 of 0.896 and 0.887, respectively. Meanwhile, the dynamic changes of F1 score, precision, PR curve, and recall for each model during the training process were visualized (Figure 3 and Figure S1). Based on these findings, YOLOv12n model was included in the subsequent process construction.
 |
Table 2 The Performance of Object Detection Models |
 |
Figure 3 Validation metrics for YOLOv12n model. The dynamic changes of indicators under different thresholds for F1 score (A), precision (B), PR curve (C), and recall (D). |
Classification Models
The ten-fold cross-validation strategy was adopted for classification model training. The performances of the classification models were listed in Table 3. The results indicated that ResNet models improved the performance of CNN model. Among them, ResNet34 exhibited the highest accuracy value of 0.9740, with 0.9927 of AUC, 0.9743 of precision, 0.9740 of recall, and 0.9740 of F1 score, suggesting that the ResNet34 model achieved the best performance. The dynamic changes of accuracy and loss graphs during the training process of each model were visualized as well (Figure 4 and Figure S2). To validate the necessity of the object detection module, the ablation study was performed to compare the performance of ResNet34 model with (two-stage) or without YOLOv12n model (single-stage) for image cropping. The single-stage method used ResNet34 for direct end-to-end PF diagnosis on the original full MRI images without YOLO-based localization. The two-stage pipeline first applied YOLOv12n to detect and extract the ROI of the plantar fascia, then used ResNet34 for classification based on the cropped ROI. Both methods were implemented under the same patient-wise data split and training strategy for fair comparison. The results indicated that the performance of ResNet34 model without YOLOv12n model for image cropping was worse than that of the ResNet34 model using the YOLOv12n model, with decreased accuracy, AUC, precision, recall, and F1 score (Table S1), suggesting the value and necessity of image cropping by YOLOv12n model.
 |
Table 3 The Performance of Classification Models |
 |
Figure 4 The overall accuracy (A) and loss (B) graphs for ResNet34 model. |
Clinical Interpretability
To enhance the interpretability of classification models and the transparency of clinical applications, the heat maps were generated by using Grad-CAM to visualize the discrimination process of the model. The images of two PF patients were randomly selected, and the activation of the ROI in their plantar fascia images in the ResNet34 model was visualized (Figure 5). The results confirmed that the classification model focused on anatomically and clinically relevant regions, supporting its interpretability. This finding indicated that the ResNet34 model could stably and accurately identify the key features of the plantar fascia region and conduct effective category discrimination based on this. This visualization results not only verified the biological rationality of the model’s discrimination mechanism in image classification tasks, but also further enhanced the credibility and interpretive ability of the model in medical image analysis.
 |
Figure 5 The Grad-CAM visualization. Original images (left). Grad-CAM visualization (right). Grad-CAM heatmaps visualize which portions of the input image were important for the classification decision. Red areas in Grad-CAM visualizations highly contribute to the prediction. Blue represents areas that contribute little or almost no to the prediction. |
Automatic Identification Process Construction
Based on the training results of the above-mentioned object detection model and classification model, an integrated intelligent diagnostic process for the automatic identification of PF was constructed (Figure 6). This process integrated the advantages of the YOLOv12n model in precisely locating the ROI area in the object detection task, as well as the high accuracy and stability of the ResNet34 model in the image classification task, thereby achieving efficient identification and classification judgment of PF.
 |
Figure 6 Automated process for detection and diagnosis of PF. Red arrows indicate the approximate position of plantar fascia, and green rectangle represents the area of plantar fascia of this individual automatically recognized by the YOLO model. |
The entire detection process supports multiple image input formats (including JPG, PNG and BAM), without limiting the original resolution and size of the images, and has good adaptability and universality. The YOLOv12n model will automatically resize the input image to a standard size of 640×640 to meet the input requirements of the model. Subsequently, the pre-trained YOLOv12n network is used to perform object detection on the plantar fascia area in the image, and the results output include bounding box coordinates and confidence scores. This detection result not only achieves precise positioning of PF, but also provides structured input for subsequent classification tasks.
After the object detection is completed, the system will automatically crop the ROI area identified by YOLOv12n model and further scale it to a standard size of 224×224 to match the input specification of the ResNet34 model. Due to the relatively slender structure of the plantar fascia, there may be a certain degree of deformation or subjective distortion during the scaling process of the image, but this processing method does not affect the discriminative performance of the ResNet34 model. Finally, the cropped image is classified and predicted by the pre-trained ResNet34 model, and the category to which the sample belongs and its corresponding confidence score are output. Based on the integrated process developed in this study, the diagnosis of patients with PF can be achieved without manual labeling of the thickness of the plantar fascia, which not only improves the automation and speed of PF recognition, but also provides a technical foundation for clinical auxiliary diagnosis.
Discussion
In this study, an integrated intelligent diagnostic framework grounded in deep learning was constructed to tackle the challenge of automatic recognition of PF. Recognizing the significant ethical, security, privacy, and regulatory hurdles that come with obtaining extensive medical imaging datasets, we adopted image enhancement techniques as a pivotal strategy to expand the available data volume. By meticulously applying systematic data augmentation procedures to a substantial corpus of medical images and integrating object detection and classification models, we have successfully accomplished the efficient and precise identification of PF.
Four lightweight versions from the YOLO series (YOLOv8n, YOLOv11n, YOLOv12n, and YOLOv13n) were selected for training the object detection model. YOLO algorithm has demonstrated unique advantages in object detection tasks. Kang et al collected 170 X-ray images of hip implants to build a stem detection model using YOLOv3 and achieved an AUC of 0.99.21 Kim et al explored automation of implant identification process on plain knee radiographs using YOLOv5, exhibiting total accuracy value of 0.978, 0.953, 0.956 in the validation set, internal test set, and external test set.22 The SE-Yolo V5 model proposed by Tang et al could identify cysts with high accuracy based on knee MRI scans.23 The YOLO-UNet model demonstrated excellent vertebral body segmentation capabilities on both X-ray and MRI datasets.24 Liu et al demonstrated that the YOLOv12 model based on CT images approached MRI-based reference performance for differentiating lateral malleolar avulsion fractures from subfibular ossicles.25 In the present study, YOLOv12n model, as the object detection model, presented the best performance with mAP50 of 0.907.
In the field of medical image analysis, CNNs have proven to be a groundbreaking technology with remarkable capabilities. CNNs progressively learn more complex and abstract visual features from the images with increasing network depth.26 Shin et al constructed a CNN model based on knee MRI to help diagnosis anterior cruciate ligament tear.27 Ying et al developed a knowledge distillation framework based on knee Arthroscopy-MRI scans, which used residual neural networks architectures, and achieved an improved meniscus tear detection performance.28 Chung et al developed a CNN-based algorithm (EfficientNet-B5, ResNet152, VGG19) for differentiating common peroneal nerve injury from other etiologies in patients with foot drop, and achieved the highest AUC of 0.946 in EfficientNet-B5.29 In this study, ResNet34 model achieved the best performance with the highest accuracy value of 0.9740. ResNet34 combines the dual advantages of lightweight models and deep networks. Compared to ResNet14 and ResNet18, its deeper hierarchical structure endows it with more powerful feature extraction and expression capabilities; while compared to ResNet50, its more streamlined parameter quantity effectively avoids the risk of overfitting, and demonstrates outstanding generalization performance in small-sample medical image scenarios. This “moderate depth” design concept enables it to achieve an ideal balance between deployment efficiency, inference speed, and model stability, precisely meeting the dual requirements of medical image analysis for accuracy and reliability.
The integrated intelligent diagnostic process combining YOLOv12n and ResNet34 was constructed for the automatic identification of PF. The system has several advantages in the context of PF diagnosis, particularly in terms of automation, efficiency, and objectivity. The automated diagnostic system is capable of autonomously processing and evaluating plantar fascia images, facilitating a swifter and more streamlined diagnostic process. The integration of object detection is critical for reliable PF diagnosis. Although the plantar fascia is located relatively fixed on sagittal MRI, whole-image classification is easily affected by surrounding tissues and unrelated pathological features. Precise ROI localization via YOLOv12n eliminates irrelevant interference and enhances model specificity and robustness. The comparative experiment further verified that the two-stage framework outperforms single-stage full-image classification, demonstrating the practical value of the proposed pipeline. Notably, when a model is trained to recognize PF using only one image rather than relying on a multitude of images, the associated computer system operates with heightened efficiency. This enhanced efficiency becomes especially crucial in handling the substantial imaging data loads that radiologists routinely encounter in their clinical settings. Another significant benefit of the automated diagnostic system lies in its objectivity during object detection and classification. In contrast to traditional approaches that hinge on manual feature extraction, our automated system can directly learn and discern pertinent features from the plantar fascia images. This inherent objectivity minimizes the risk of human error and interpretive variability, thereby yielding more consistent and dependable diagnostic outcomes.
This study has several limitations that should be acknowledged. First, the entire dataset, including 123 PF patients and 150 normal controls, was collected from a single clinical center, which may introduce selection bias and may not be representative of the broader clinical population, potentially limiting the applicability of the proposed model to other healthcare settings. Second, the overall sample size of 273 subjects, while sufficient for preliminary model development and internal validation, is relatively modest for deep learning-based medical image studies. This modest sample size limits the statistical power to detect subtle differences in model performance and may lead to overestimation of the model’s diagnostic ability. Third, due to constraints in clinical data acquisition, we were unable to collect an independent external validation dataset, which is a major limitation. Despite the strict adoption of patient-wise ten-fold cross-validation, the lack of external validation prevents full verification of the model’s generalization ability to unseen patients from different centers, meaning the reported performance may not accurately reflect the model’s actual clinical utility in diverse settings, and the model may still exhibit mild overfitting to the internal single-center dataset, as evidenced by the relatively high internal performance metrics. Collectively, these limitations indicate that the findings of this study should be interpreted with caution. Future studies will focus on addressing these shortcomings by expanding to multi-center datasets with larger sample sizes, conducting rigorous external validation, and optimizing the model to reduce overfitting, thereby enhancing the statistical power, generalizability, and clinical utility of the proposed diagnostic framework.
In this study, we have innovatively crafted an automated diagnostic process that integrates YOLOv12n and ResNet34 for the precise identification of PF based on plantar fascia images. Our study represents a pioneering attempt to devise an automated diagnostic system that is adept at both “detecting” and “classifying” PF cases alongside normal controls with remarkable accuracy, utilizing solely a single slice from an MRI sagittal image (fs-PDWI). Despite the constraint of a relatively modest sample size in our study, the system has demonstrated impressive location detection and classification using just one image. To further enhance the system’s generalizability and mitigate the risk of overfitting, it is imperative for subsequent studies to incorporate larger and more heterogeneous datasets sourced from multiple centers and employing a variety of devices, which will undoubtedly contribute to the robustness and reliability of the automated diagnostic system in real-world clinical settings.
Data Sharing Statement
The datasets generated and/or analyzed during the current study are available from the corresponding author by reasonable request.
Ethics Approval and Informed Consent
This single-center, retrospective study was approved by the institutional review boards at the Third Hospital of Hebei Medical University (W2020-069-1) and was conducted in accordance with the tenets of the Declaration of Helsinki. Written informed consent was obtained from each participant.
Author Contributions
All authors made a significant contribution to the work reported, whether that is in the conception, study design, execution, acquisition of data, analysis and interpretation, or in all these areas; took part in drafting, revising or critically reviewing the article; gave final approval of the version to be published; have agreed on the journal to which the article has been submitted; and agree to be accountable for all aspects of the work.
Funding
This research did not receive any specific grant from funding agencies in the public, commercial, or not-for-profit sectors.
Disclosure
The authors declare that they have no competing interests in this work.
References
1. Tseng WC, Chen YC, Lee TM, Chen WS. Plantar Fasciitis: an Updated Review. J Med Ultrasound. 2023;31(4):268–12. doi:10.4103/jmu.jmu_2_23
2. Boob Jr MA, Phansopkar P, Somaiya KJ. Physiotherapeutic Interventions for Individuals Suffering From Plantar Fasciitis: a Systematic Review. Cureus. 2023;15(7):e42740. doi:10.7759/cureus.42740
3. Nweke TC. Comprehensive Review and Evidence-Based Treatment Framework for Optimizing Plantar Fasciitis Diagnosis and Management. Cureus. 2025;17(7):e88745. doi:10.7759/cureus.88745
4. Trojian T, Tucker AK. Plantar Fasciitis. Am Fam Physician. 2019;99(12):744–750.
5. Elabd K, Basudan L, Alomari MA, Almairi A. Plantar Fasciitis as a Potential Early Indicator of Elevated Cardiovascular Disease Risk. Cureus. 2024;16(6):e62007. doi:10.7759/cureus.62007
6. Goff JD, Crawford R. Diagnosis and treatment of plantar fasciitis. Am Fam Physician. 2011;84(6):676–682.
7. Zhang L, Cai M, Gan Y, et al. Anatomical features of plantar fasciitis in various age cohorts: based on magnetic resonance imaging. J Orthop Surg (Hong Kong). 2023;31(1):10225536231161181. doi:10.1177/10225536231161181
8. Tan VAK, Tan CC, Yeo NEM, et al. Consensus statements and guideline for the diagnosis and management of plantar fasciitis in Singapore. Ann Acad Med Singap. 2024;53(2):101–112. doi:10.47102/annals-acadmedsg.2023211
9. Bai W, Liu L, Lu J, et al. Progress in diagnosis and treatment of plantar fasciitis. J Chin J Bone Joint Surg. 2021;14(9):805–810.
10. Choi RY, Coyner AS, Kalpathy-Cramer J, Chiang MF, Campbell JP. Introduction to Machine Learning, Neural Networks, and Deep Learning. Transl Vis Sci Technol. 2020;9(2):14. doi:10.1167/tvst.9.2.14
11. Xu D, Zhou H, Quan W, et al. A new method proposed for realizing human gait pattern recognition: inspirations for the application of sports and clinical gait analysis. Gait Posture. 2024;107:293–305. doi:10.1016/j.gaitpost.2023.10.019
12. Luan S, Ji Y, Liu Y, et al. Real-Time Reconstruction of HIFU Focal Temperature Field Based on Deep Learning. BME Front. 2024;5:0037. doi:10.34133/bmef.0037
13. Xu D, Zhou H, Jie T, et al. Data-driven deep learning for predicting ligament fatigue failure risk mechanisms. Int J Mech Sci. 2025;301:110519.
14. Shen D, Wu G, Suk HI. Deep Learning in Medical Image Analysis. Annu Rev Biomed Eng. 2017;19:221–248. doi:10.1146/annurev-bioeng-071516-044442
15. Chen X, Wang X, Zhang K, et al. Recent advances and clinical applications of deep learning in medical image analysis. Med Image Anal. 2022;79:102444. doi:10.1016/j.media.2022.102444
16. Li M, Jiang Y, Zhang Y, Zhu H. Medical image analysis using deep learning algorithms. Front Public Health. 2023;11:1273253. doi:10.3389/fpubh.2023.1273253
17. Redmon J, Divvala S, Girshick R, Farhadi A. You Only Look Once: Unified, Real-Time Object Detection. 2016.
18. Almufareh MF, Imran M, Khan A, Humayun M, Asim M. Automated Brain Tumor Segmentation and Classification in MRI Using YOLO-Based Deep Learning. IEEE Access. 2024;12:16189–16207. doi:10.1109/access.2024.3359418
19. Sun H, Pang Y. GlanceNets—Efficient convolutional neural networks with adaptive hard example mining. Science China Information Sciences. 2018;61(10):109101.
20. Alzubaidi L, Zhang J, Humaidi AJ, et al. Review of deep learning: concepts, CNN architectures, challenges, applications, future directions. J Big Data. 2021;8(1):53. doi:10.1186/s40537-021-00444-8
21. Kang YJ, Yoo JI, Cha YH, Park CH, Kim JT. Machine learning-based identification of Hip arthroplasty designs. J Orthop Translat. 2020;21:13–17. doi:10.1016/j.jot.2019.11.004
22. Kim B, Lee DW, Lee S, et al. Automated Detection of Surgical Implants on Plain Knee Radiographs Using a Deep Learning Algorithm. Medicina (Kaunas). 2022;58(11):1677. doi:10.3390/medicina58111677
23. Xiongfeng T, Yingzhi L, Xianyue S, et al. Automated detection of knee cystic lesions on magnetic resonance imaging using deep learning. Front Med (Lausanne). 2022;9:928642. doi:10.3389/fmed.2022.928642
24. Wang H, Lu J, Yang S, et al. Cervical vertebral body segmentation in X-ray and magnetic resonance imaging based on YOLO-UNet: automatic segmentation approach and available tool. Digit Health. 2025;11:20552076251347695. doi:10.1177/20552076251347695
25. Liu J, Sun P, Yuan Y, et al. YOLOv12 Algorithm-Aided Detection and Classification of Lateral Malleolar Avulsion Fracture and Subfibular Ossicle Based on CT Images: multicenter Study. JMIR Med Inform. 2025;13:e79064. doi:10.2196/79064
26. Saha S, Vignarajan J, Frost S. A fast and fully automated system for glaucoma detection using color fundus photographs. Sci Rep. 2023;13(1):18408. doi:10.1038/s41598-023-44473-0
27. Shin H, Choi GS, Chang MC. Development of convolutional neural network model for diagnosing tear of anterior cruciate ligament using only one knee magnetic resonance image. Medicine (Baltimore). 2022;101(44):e31510. doi:10.1097/md.0000000000031510
28. Ying M, Wang Y, Yang K, Wang H, Liu X. A deep learning knowledge distillation framework using knee MRI and arthroscopy data for meniscus tear detection. Front Bioeng Biotechnol. 2023;11:1326706. doi:10.3389/fbioe.2023.1326706
29. Chung KM, Yu H, Kim JH, et al. Deep Learning-Based Knee MRI Classification for Common Peroneal Nerve Palsy with Foot Drop. Biomedicines. 2023;11(12):3171. doi:10.3390/biomedicines11123171
 © 2026 The Author(s). This work is published and licensed by Dove Medical Press Limited. The
full terms of this license are available at https://www.dovepress.com/terms
and incorporate the Creative Commons Attribution
- Non Commercial (unported, 4.0) License.
By accessing the work you hereby accept the Terms. Non-commercial uses of the work are permitted
without any further permission from Dove Medical Press Limited, provided the work is properly
attributed. For permission for commercial use of this work, please see paragraphs 4.2 and 5 of our Terms.
© 2026 The Author(s). This work is published and licensed by Dove Medical Press Limited. The
full terms of this license are available at https://www.dovepress.com/terms
and incorporate the Creative Commons Attribution
- Non Commercial (unported, 4.0) License.
By accessing the work you hereby accept the Terms. Non-commercial uses of the work are permitted
without any further permission from Dove Medical Press Limited, provided the work is properly
attributed. For permission for commercial use of this work, please see paragraphs 4.2 and 5 of our Terms.
Recommended articles

Accurate Differentiation of Spinal Tuberculosis and Spinal Metastases Using MR-Based Deep Learning Algorithms
Duan S, Dong W, Hua Y, Zheng Y, Ren Z, Cao G, Wu F, Rong T, Liu B
Infection and Drug Resistance 2023, 16:4325-4334
Published Date: 4 July 2023
AI-Assisted Compressed Sensing Enables Faster Brain MRI for the Elderly: Image Quality and Diagnostic Equivalence with Conventional Imaging
Gu W, Yang C, Wang Y, Hu W, Wu D, Cai S, Hong G, Hu P, Zhang Q, Dai Y
International Journal of General Medicine 2025, 18:379-390
Published Date: 23 January 2025
Hybrid ResNet-ViT Framework for Endometrial Lesion Analysis: A Comparative Study of MRI and CT in Endometrial Cancer Classification
Abu-azzam OH, Sindiani AM, Alhatamleh S, Amin M, Abu Mhanna HY, Madain R, Akhdar HF, Gharaibeh H, Altal OF, Alshdaifat EH, Alinad TM, Maashey F, Nasayreh A, Bashkami A, Alghulayqah L
International Journal of Women's Health 2025, 17:4103-4130
Published Date: 5 November 2025
Deep Learning Radiomics of Multiparametric MRI for Individualized Prediction of Axillary Lymph Node Response After Neoadjuvant Chemotherapy in Breast Cancer
Li S, Li R, Xu M, Liao J, Cao Z, Gong B, Yan F, Wang M, Tan H
Breast Cancer: Targets and Therapy 2026, 18:568337
Published Date: 21 January 2026