
Back to Journals » Diabetes, Metabolic Syndrome and Obesity » Volume 18
Quantitative CT Assessment of Skeletal Muscle and Abdominal Fat Distribution: Predictive Value for Type 2 Diabetes Mellitus
Authors Zhang B  , Wu Z , Jiang C, Li N, An X, Tian L, Cai Y, Zou Y, Tang Y
Received 15 July 2025
Accepted for publication 26 October 2025
Published 11 November 2025 Volume 2025:18 Pages 4153—4163
DOI https://doi.org/10.2147/DMSO.S550824
Checked for plagiarism Yes
Review by Single anonymous peer review
Peer reviewer comments 2
Editor who approved publication: Dr Hillary Keenan
Bo Zhang,1,* Zhe Wu,2,* Chao Jiang,2 Ning Li,2 Xiujing An,1 Lufeng Tian,3 Yang Cai,4 Yanjun Zou,5 Yi Tang6
1College of The Third Clinical Medical College, Jinzhou Medical University, Jinzhou, Liaoning Province, People’s Republic of China; 2Department of Radiology, Fushun Central Hospital, Fushun, Liaoning Province, People’s Republic of China; 3Department of Internal Medicine, Fushun Central Hospital, Fushun, Liaoning Province, People’s Republic of China; 4Department of Medical Record Room, Fushun Central Hospital, Fushun, Liaoning Province, People’s Republic of China; 5Department of Radiology, Ansteel Group General Hospital, Anshan, Liaoning Province, People’s Republic of China; 6Department of Endocrinology, Fushun Central Hospital, Fushun, Liaoning Province, People’s Republic of China
*These authors contributed equally to this work
Correspondence: Yanjun Zou, Department of Radiology, Ansteel Group General Hospital, Jianshen Road, Tiedong District, Anshan, Liaoning Province, 114005, People’s Republic of China, Tel +86-139-41225318, Email [email protected] Yi Tang, Department of Endocrinology, Fushun Central Hospital, Xincheng Road, Shuncheng District, Fushun, Liaoning Province, 113006, People’s Republic of China, Tel +86-156-42018668, Email [email protected]
Objective: In this study, we aimed to investigate the association between skeletal muscle area (SMA), subcutaneous fat area (SFA), and visceral fat area (VFA), quantified using computed tomography (CT), and the risk of type 2 diabetes mellitus (T2DM). We also evaluated the predictive performance of these parameters for assessing T2DM risk.
Methods: We used a retrospective case–control design, including 207 hospitalized patients who underwent abdominal quantitative CT (QCT) scans at Fushun Central Hospital from July 2021 to July 2022. Using QCT technology, SMA, SFA, and VFA were measured at the level of the third lumbar vertebra. Additionally, the skeletal muscle index (SMI=SMA/height2) and the visceral-to-subcutaneous fat ratio (VFA/SFA) were calculated. Univariate and multivariate logistic regression analyses were used to examine the association between skeletal muscle and abdominal fat parameters with T2DM, and receiver operating characteristic (ROC) curves evaluated the predictive performance of each indicator.
Results: Body mass index, systolic blood pressure, diastolic blood pressure, fasting blood glucose, VFA, and SFA were significantly higher in the T2DM group compared with the control group, and SMA and SMI were significantly lower (all P< 0.05). Multivariate logistic regression analysis showed that lower SMI (odds ratio [OR]=0.906, 95% confidence interval [CI]: 0.847– 0.970, P=0.004) and greater VFA (OR=1.008, 95% CI: 1.004– 1.012, P< 0.001) were independent risk factors for T2DM. ROC curve analysis showed that SMI (area under the ROC curve [AUC]=0.634) and VFA (AUC=0.697) had moderate predictive performance for T2DM whereas the combined model (SMI+VFA) significantly improved predictive efficacy (AUC=0.816).
Conclusion: Visceral fat accumulation was an independent risk factor for T2DM, and increased skeletal muscle mass showed a protective effect. The combined SMI and VFA model showed significantly enhanced predictive ability for T2DM risk, suggesting its potential as a clinical biomarker.
Keywords: type 2 diabetes mellitus, visceral fat area, subcutaneous fat area, skeletal muscle index, risk prediction
Introduction
Type 2 diabetes mellitus (T2DM) has become a major global public health issue. According to data from the International Diabetes Federation, there were 537 million people with diabetes worldwide in 2023; this number is projected to increase to 783 million by 2045, marking a 46% increase.1 As a country with a high diabetes burden, China’s diabetes prevalence rate among adults has reached 11.2%,2 with a noticeable trend toward younger onset, posing a serious challenge for disease prevention and control.
Traditional diabetes risk assessment methods mainly rely on body mass index (BMI), waist circumference, and other obesity indicators. However, these indicators fail to effectively differentiate between visceral fat area (VFA) and subcutaneous fat area (SFA) in metabolic processes and do not fully capture the impact of the skeletal muscle index (SMI) on glucose metabolism.3,4 In recent years, growing research into the pathophysiology of diabetes has confirmed that the synergistic effect of skeletal muscle loss (sarcopenia) and visceral fat accumulation plays a crucial role in exacerbating insulin resistance and contributing to the development of T2DM.5–7
As a high-resolution imaging technique, computed tomography (CT) can accurately quantify skeletal muscle and fat distribution, providing a new dimension for stratified metabolic risk assessment.5,8 Previous studies have shown that VFA and SMI can serve as independent predictive indicators for metabolic syndrome.8 However, most current research focuses on single-parameter analyses (such as VFA or SMI) and systematic exploration of sex-based differences has been lacking. It is noteworthy that men are more prone to visceral fat accumulation owing to higher androgen levels,9,10 and postmenopausal women experience a shift in fat distribution from subcutaneous to visceral regions owing to a decline in estrogen levels.11,12 Additionally, the sex-specific relationship between skeletal muscle loss and diabetes risk has not been fully clarified.13,14
In recent years, significant progress has been made in precise segmentation techniques of skeletal muscle in CT imaging, providing more reliable technical support for the quantitative assessment of muscle mass. Multiple innovative studies have demonstrated that: ① Site-specific and multi-class muscle segmentation techniques—such as simultaneous delineation of functional muscle groups including the psoas major and erector spinae15—enable accurate localization of muscle subtypes closely associated with metabolism, effectively differentiating muscular characteristics across anatomical regions; ② Deep learning-based simultaneous segmentation of the erector spinae muscles—for example, using convolutional neural networks to automatically identify core muscle groups16—has achieved efficient and low-error muscle extraction in large-sample cohorts, significantly improving reproducibility; ③ 3D U-Net-based whole-body surface muscle segmentation techniques, which integrate full-volume CT information via three-dimensional networks,17 not only support combined multi-muscle group analysis but also provide a methodological foundation for extending body composition assessment beyond the L3 level. The integration of these technologies ensures that skeletal muscle and fat parameters (such as SMI and VFA) obtained from L3-level CT segmentation in this study exhibit higher accuracy and clinical applicability, while also establishing a technical foundation for future expansion to whole-abdomen or whole-body muscle analysis.
In the present study, we aimed to use CT-based quantitative analysis to evaluate the SMI and abdominal fat distribution parameters (VFA, SFA) in a Chinese inpatient population to reveal their association patterns with T2DM risk. Specifically, we 1) explored the association of SMI, VFA, and SFA with T2DM risk; 2) constructed sex-specific predictive models for more accurate diabetes risk assessment across different sexes; and 3) provide imaging-based biomarkers for early diabetes screening and offer evidence-based support for targeted intervention. This study aimed to evaluate the independent and combined predictive value of the skeletal muscle index (SMI) and visceral fat area (VFA) in order to provide clinically applicable imaging biomarkers for early risk stratification of type 2 diabetes mellitus (T2DM), while also offering mechanistic insights into the role of muscle-fat metabolic imbalance in the development and progression of T2DM.
Materials and Methods
Study Participants
In this study, we adopted a retrospective case–control design. The study was approved by the Medical Ethics Committee of our hospital (approval no. zxyyll2023008). Data of hospitalized patients at Fushun Central Hospital from July 2021 to July 2022 were collected using the hospital’s electronic medical record system. The inclusion criteria were: (1) age between 18 and 70 years; (2) meeting the World Health Organization [2019 diagnostic criteria for T2DM (fasting blood glucose [FBG] ≥7.0 mmol/L or glycated hemoglobin ≥6.5%); (3) having complete abdominal CT imaging data. Exclusion criteria were: (1) presence of malignant tumors, immunodeficiency, liver cirrhosis, renal failure, or heart failure; (2) long-term use of glucocorticoids (>6 months); (3) history of acute diabetic complications (diabetic ketoacidosis, DKA/hyperglycemic hyperosmolar state, HHS) or trauma.
A total of 207 patients were included in the study, with 100 in the T2DM group (48.3%) and 107 in the non-T2DM (control) group (51.7%).The current sample size (100 cases each in the T2DM and non-DM groups, with sex subgroups n ≥ 40) meets the minimum requirement for binary logistic regression (≥50 cases per group to avoid overfitting)18 Future prospective studies should determine the optimal sample size for the target effect size using PASS software (α = 0.05, β = 0.2).
Clinical Data Collection
Clinical data were collected using the electronic medical record system, and included the following. (1) Demographic characteristics including sex, age, height, and weight. BMI (kg/m2) was calculated using height and weight, measured with a standardized electronic height and weight measuring device accurate to 0.1 cm and 0.1 kg, respectively. (2) Blood pressure measurement including brachial systolic blood pressure (SBP) and diastolic blood pressure (DBP), with the average of two consecutive measurements recorded. (3) Biochemical indicators including fasting plasma glucose (hexokinase method), glycated hemoglobin (high-performance liquid chromatography), and urine albumin/creatinine ratio, measured using morning urine samples and the immunoturbidimetry/creatinine oxidase method.
CT Acquisition
Imaging was performed using a Siemens SOMATOM Perspective 64-slice or PHILIPS Brilliance 128-slice spiral CT scanner. Non-contrast enhanced abdominal CT scans were acquired using the following parameter settings: detector configuration 0.625 mm×64, 120 kV, 300 mA, 1.0 mm thickness, and 1.0 mm increment, 0.984 pitch. The field of view covered the abdomen, extending from the xiphoid process to the pubic symphysis. To minimize inter-scanner variability, all CT devices underwent regular performance calibration, and scanning procedures were performed by the same team of three certified radiologic technologists following a standardized protocol. During the data analysis phase, uniform normalization was applied to mitigate manufacturer-specific variations in Hounsfield Unit (HU) values across different devices.
Image Analysis
Semi-automatic segmentation of axial CT images at the level of the third lumbar vertebra (L3) was performed using the open-source medical imaging software 3D Slicer (version 4.11.0). An abdominal radiologist with 5 years of experience manually delineated the skeletal muscle area—including the psoas major, rectus abdominis, and paraspinal muscles—using a Hounsfield unit (HU) threshold range of −29 to 150 HU. Visceral and subcutaneous adipose tissues were segmented using a threshold range of −190 to −30 HU. All segmentations were conducted on a dedicated professional workstation. All segmentation results were reviewed and were corrected by another abdominal radiologist with 10 years of experience, if necessary, to ensure accuracy. To assess segmentation consistency, 30 patients were randomly selected for independent segmentation by both physicians, and the intraclass correlation coefficient was calculated to evaluate inter-observer agreement. Body composition metrics were derived as follows: the SMI was calculated as L3 skeletal muscle area (cm2)/height2 (m2); VFA and SFA were quantified using threshold segmentation; and the visceral-to-subcutaneous fat ratio (VSR) was calculated as VFA/SFA (Figure 1).
 |
Figure 1 Axial image at the level of the third lumbar vertebra (L3). (A) VFA; (B) SMA; (C) SFA. Abbreviations: VFA, visceral fat area; SMA, skeletal muscle area; SFA, subcutaneous fat area. |
Statistical Analysis
All statistical analyses were performed using R software version 4.2.1 and IBM SPSS version 26.0 (IBM Corp., Armonk, NY, USA). Continuous variables with a normal distribution are expressed as mean±standard deviation, and non-normally distributed variables are expressed as median with interquartile range. Categorical variables are described using frequency (percentage). Between-group comparisons for continuous variables were performed using independent-samples t-tests for normally distributed data or Mann–Whitney U-tests for non-normally distributed data. Categorical variables were compared using Pearson’s chi-square test or Fisher’s exact test when the expected observations in any category were <5. Multivariate logistic regression analysis was used to assess the association between SMI, VFA, and T2DM, adjusting for potential confounders such as sex, age, and BMI. Results are expressed as odds ratios (ORs) with 95% confidence intervals (CIs). The predictive performance of SMI and VFA for T2DM was evaluated using receiver operating characteristic (ROC) curves, and the area under the ROC curve (AUC) was calculated. The optimal cutoff value, sensitivity, and specificity were reported. A two-sided P value <0.05 was considered statistically significant.
Results
Baseline Characteristics and Imaging Parameters in Patient Groups
A total of 207 participants were included in this study, with 100 in the T2DM group (48.3%) and 107 in the non-T2DM group (51.7%). Patients with T2DM exhibited significant metabolic abnormalities compared with the non-T2DM group. The median FBG was 76.8% higher (9.30 vs 5.26 mmol/L, P<0.001), and BMI was significantly elevated in the T2DM group (24.22 vs 23.06 kg/m2, P=0.011), indicating a shift toward obesity. Both SBP (135 vs 130 mmHg) and DBP (85 vs 80 mmHg) were also significantly higher in the T2DM group (P<0.05). Quantitative CT analysis revealed characteristic body composition changes. Compared with the non-T2DM group, the T2DM group exhibited a 12.6% smaller SMA (190.26 vs 217.83 cm2, P=0.007), and an 8.4% lower SMI (71.21 vs 77.74 cm2/m2, P=0.001). In contrast, the VFA was 53.2% greater (334.12 vs 218.10 cm2, P<0.001), and the SFA was 23.1% larger (252.04 vs 204.77 cm2, P<0.001). No statistically significant differences were observed in age, height, or VSR between the two groups (all P>0.05) (Table 1).
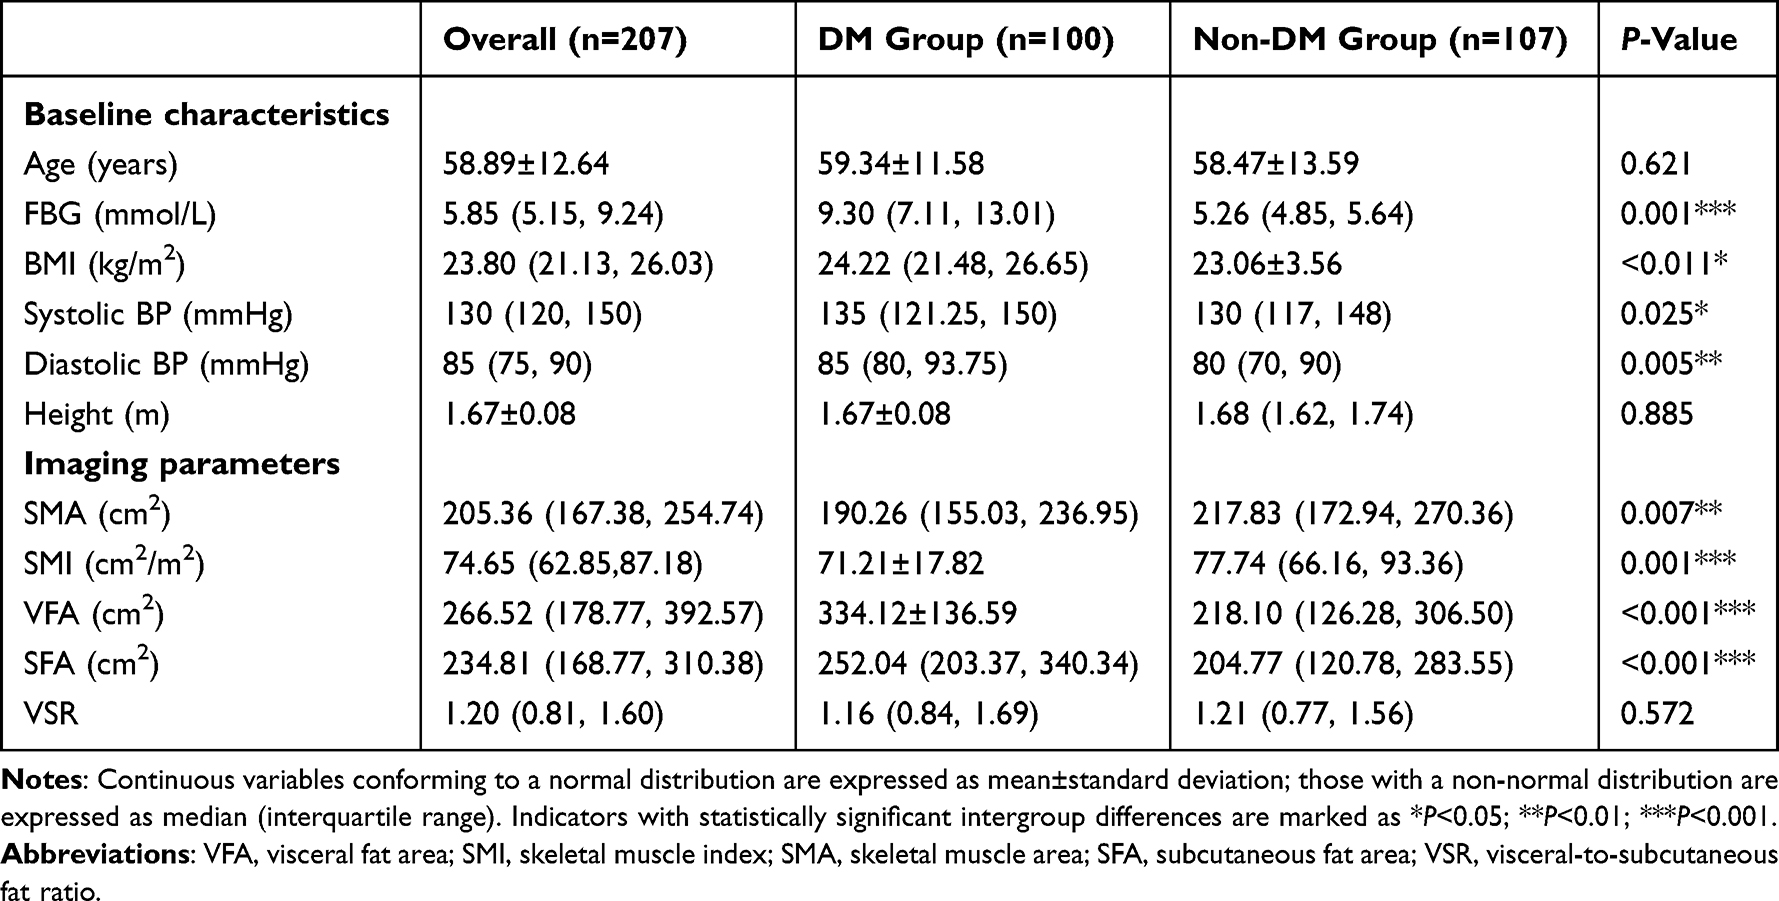 |
Table 1 Baseline Characteristics and Imaging Parameters Between Study Groups |
Predictors of T2DM
Univariate logistic regression analysis showed that the occurrence of T2DM was associated with BMI, DBP, SMA, SMI, VFA, and SFA (P<0.05) (Table 2).
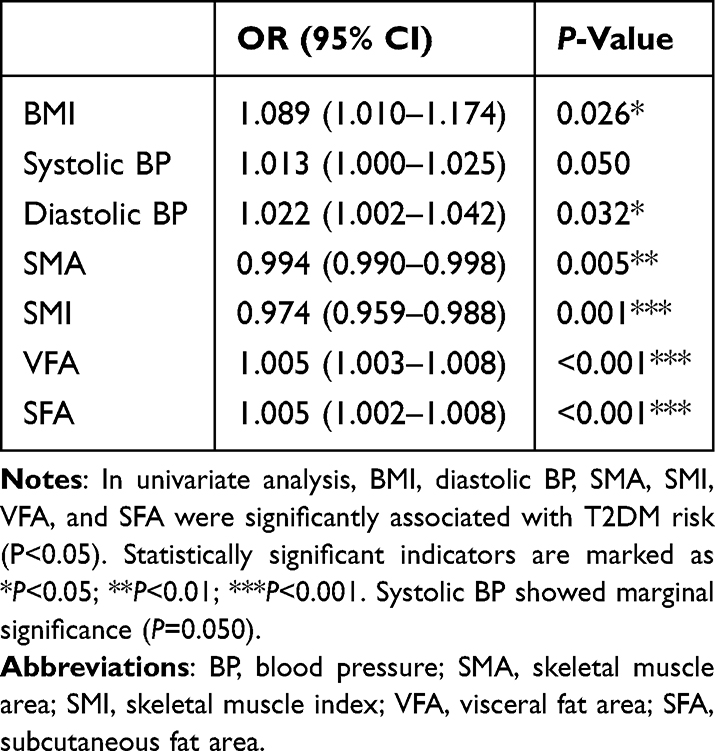 |
Table 2 Univariate Logistic Regression Analysis for Predicting T2DM |
In multivariate logistic regression analysis, after adjusting for sex, age, and BMI, we found that SMI (OR=0.906, 95% CI: 0.847–0.970, P=0.004) and VFA (OR=1.008, 95% CI: 1.004–1.012, P<0.001) were independent influencing factors for T2DM (Table 3).
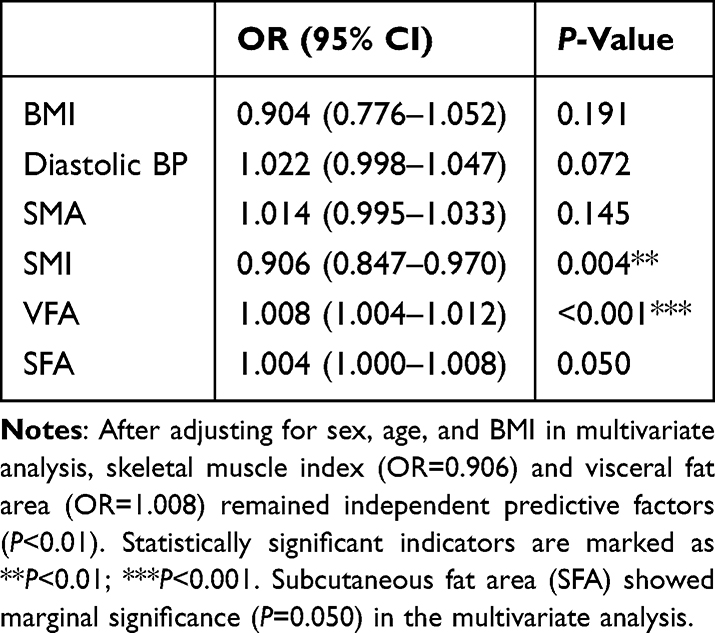 |
Table 3 Multivariate Logistic Regression Analysis for Predicting T2DM |
Multivariate Logistic Regression Forest Plot
Based on the multivariable-adjusted model, each 1-unit increase in VFA increased the risk of T2DM by 0.8% (P<0.001). By contrast, each 1-unit increase in the SMI reduced the risk of T2DM by 9.4% (P=0.004) (Figure 2).
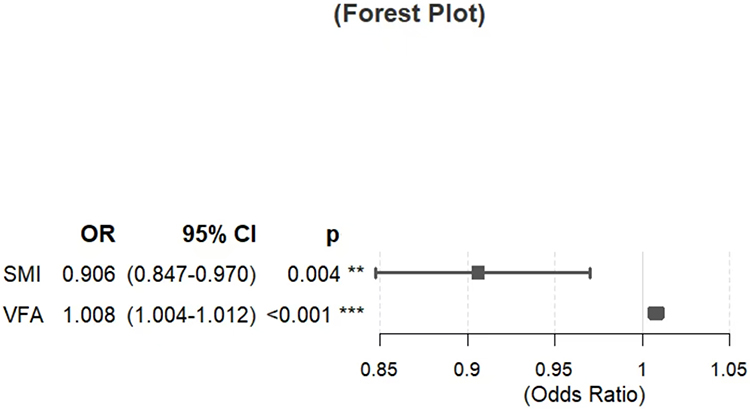 |
Figure 2 Forest plot of multivariate logistic regression analysis. Indicators with statistically significant intergroup differences are marked as **P<0.01; ***P<0.001. |
Model Construction and Predictive Efficacy
Predictive models for T2DM were constructed using SMI and VFA, as well as their combination. The SMI-based model had an AUC of 0.634 (95% CI, 0.558–0.709), with an optimal cutoff value of 71.18 cm2/m2, yielding a sensitivity of 55.0% and specificity of 65.4% for T2DM. The VFA-based model had an AUC of 0.697 (95% CI, 0.644–0.749), with a cutoff of 191.315 cm2, achieving a sensitivity of 88.0% and specificity of 44.9%. The combined model incorporating both VFA and SMI showed significantly improved predictive performance, resulting in an AUC of 0.816 (95% CI: 0.773–0.859), with a cutoff value of 0.479, providing a balanced sensitivity of 72.0% and specificity of 81.3% (Figure 3). The combined predictive model of VFA and SMI demonstrated a significantly higher AUC value compared to using VFA or SMI alone, with all differences being statistically significant (P < 0.001 by DeLong’s test) (Table 4).
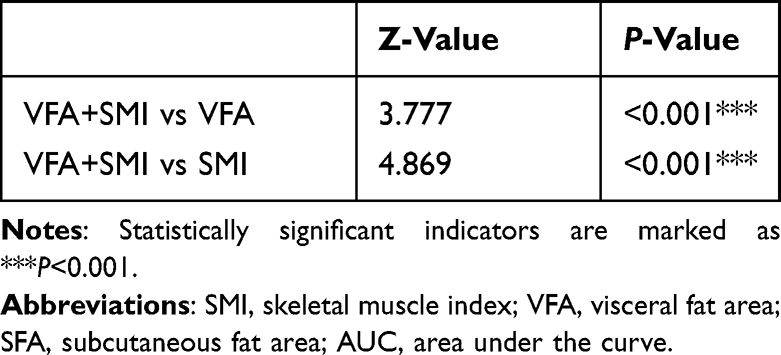 |
Table 4 Comparison of the AUC Between the Combined VFA and SMI Indicator and Individual Indicators |
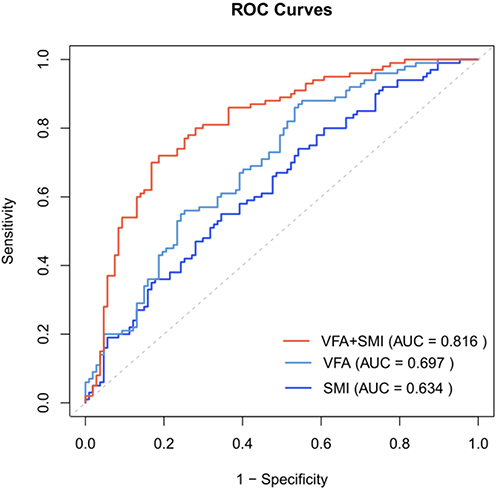 |
Figure 3 ROC curves of different predictive models. Abbreviations: VFA, visceral fat area; SMI, skeletal muscle index. |
Sex-Specific Analysis of Body Composition Differences
In male patients, the T2DM group showed a significantly smaller SMA (239.89 vs 264.37 cm2, P=0.028), a 9.4% lower SMI (80.10 vs 89.46, P=0.008), a 51% larger VFA (374.50 vs 247.98 cm2, P<0.001), and a 48% greater SFA (241.18 vs 163.01 cm2, P=0.001) in comparison with the control group. No significant difference in VSR (1.52 vs 1.45, P=0.585) was observed (Table 5).
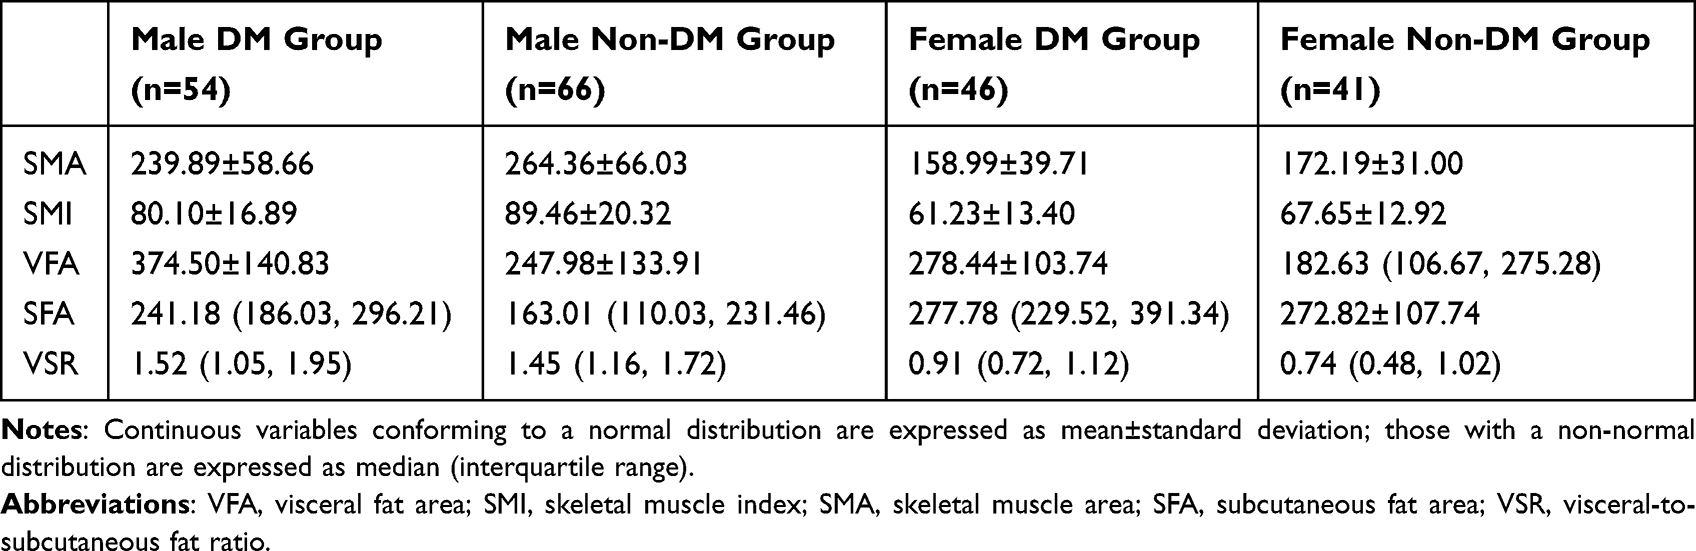 |
Table 5 Sex-Specific Analysis of Body Composition Differences |
In female patients, the T2DM group showed a 7.7% smaller SMA (158.99 vs 172.19 cm2, P=0.095), a 9.5% lower SMI (61.24 vs 67.65, P=0.030), and a 52% larger VFA (278.44 vs 182.63 cm2, P=0.019), as compared with the control group. No significant differences were observed in SFA (277.78 vs 272.82 cm2, P=0.141) or VSR (0.91 vs 0.74, P=0.066) (Figure 4).
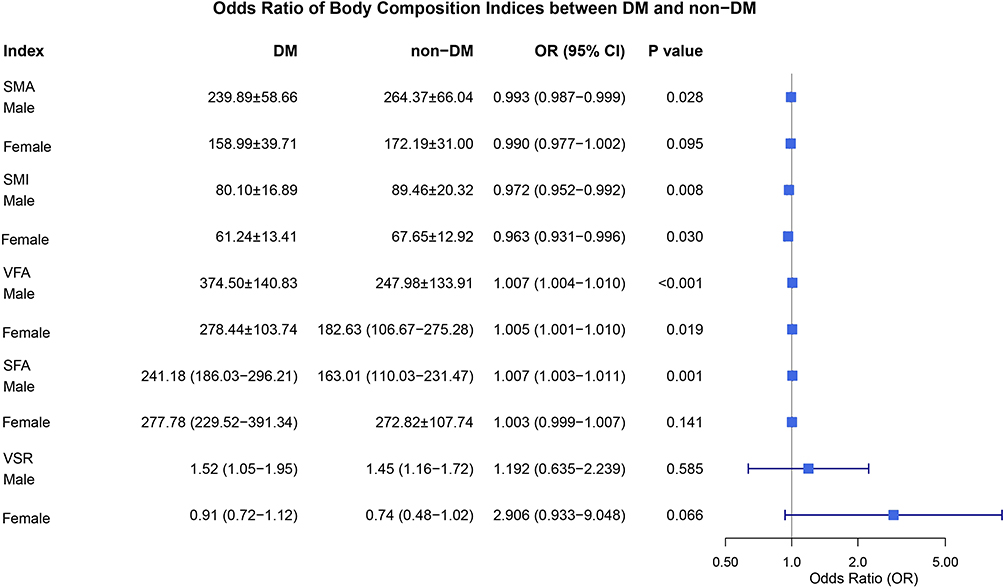 |
Figure 4 Odds ratios of body composition indicators between participant groups. |
Discussion
In this study, we systematically explored the association between the SMI and abdominal fat distribution parameters (VFA, SFA) measured quantitatively using CT, and their relationship with the risk of T2DM. The study results showed that VFA and SFA in patients with T2DM were significantly greater than those in the non-diabetic group (P<0.001), and the SMI was significantly lower (P=0.001). After adjustment, multivariate regression analysis showed that SMI was an independent protective factor against T2DM (OR=0.906, 95% CI: 0.847–0.970), and VFA was an independent risk factor (OR=1.008, 95% CI: 1.004–1.012). The combined model incorporating both SMI and VFA demonstrated superior predictive performance (AUC=0.816) compared with individual parameters, underscoring its potential clinical utility in T2DM risk stratification.
We found that the SMI of patients with T2DM was significantly lower than that of the non-diabetic control group (OR=0.906, 95% CI: 0.847–0.970), suggesting that reduced skeletal muscle mass is an important risk factor for the development of diabetes. This finding is consistent with the “sarcopenia–insulin resistance vicious cycle” theory proposed by Kim et al, supporting the theoretical framework that a decline in muscle mass aggravates glucose metabolism abnormalities via dysregulation of the AMPK/mTOR pathway.6 From a molecular mechanism perspective, skeletal muscle is the main target organ for insulin-mediated glucose uptake and undergoes the following pathological changes when its mass declines: 1) reduced expression of GLUT4 transporters, resulting in a 30%–40% decrease in skeletal muscle glucose uptake capacity;13 2) impaired mitochondrial function in muscle cells, decreased β-oxidation capacity leading to lipotoxicity;6,19 3) dysregulation of myokine secretion, including approximately 25% reduction in irisin levels and a 1.5-fold increase in interleukin 6, disrupting the endocrine balance between fat and muscle.13,20 In this study, the reduction in SMI among male patients with T2DM (10.5% vs 9.5%, P=0.028) was significantly greater than that in female patients, which may be related to differences in sex hormone regulation. Studies show that for every 1 nmol/L decrease in serum testosterone, skeletal muscle cross-sectional area decreases by 3.2 cm2 (β=–3.2, 95% CI: –5.8 to –0.6, P=0.013),18 and exogenous testosterone supplementation can increase the proportion of type II muscle fibers (+14.2%) and improve the Homeostatic Model Assessment of Insulin Resistance index (–1.8).18 By contrast, female muscle mass loss is more associated with chronic low-grade inflammation (C-reactive protein increased by 1.8 mg/L) and intramuscular fat infiltration (increased by 12%).10,14 This finding supports the sex-stratified model established by Srikanthan et al, emphasizing that muscle mass assessment should be integrated with sex hormone profile analysis.13
In this study, VFA was identified as an independent risk factor for T2DM (OR=1.008/cm2, 95% CI: 1.004–1.012), with its pathogenic mechanism involving multi-organ crosstalk effects, as follows. 1) Adipocyte hypertrophy (diameter >100 μm) leads to activation of hypoxia-inducible factor-1α, promoting M1 polarization of macrophages (CD68+ cells increased 2.3-fold) and tumor necrosis factor α secretion (increased by 60%).4,21 2) The lipolysis rate of visceral fat is three times higher than that of subcutaneous fat, and excessive free fatty acids directly impair hepatic insulin signaling through the portal vein (insulin receptor substrate 1 phosphorylation decreased by 40%).22 3) Overexpression of adipose tissue exosomal miR-27a inhibits the skeletal muscle PI3K/Akt pathway (p-Akt levels decreased by 55%).6 Sex difference analysis shows that postmenopausal women experience a 1.5 percentage point greater increase in VFA than men (52.5% vs 51.0%), likely owing to estrogen deficiency leading to an approximately 35% reduction in lipoprotein lipase activity and impaired adipocyte differentiation.11,12 This phenomenon aligns with the “sex-specific fat metabolism model” proposed by Karastergiou et al, which suggests that men are more prone to visceral fat accumulation owing to high androgen receptor expression whereas postmenopausal women experience reduced subcutaneous fat storage capacity, resulting in ectopic fat deposition in the viscera and liver.10
This study, along with recent research on pancreatic fat, reveals that ectopic visceral fat deposition has a multi-organ synergistic effect. In addition to the known abdominal visceral fat (VFA↑) and skeletal muscle reduction (SMI↓), pancreatic fat infiltration further exacerbates insulin secretion defects by directly inducing β-cell apoptosis through lipotoxicity.7 This abnormal fat distribution across multiple organs (abdominal, pancreatic, and muscular) forms a “metabolic triad”, collectively driving the progression of T2DM.In this study, we innovatively constructed a combined predictive model using the SMI and VFA, whose diagnostic performance (AUC=0.816, 95% CI: 0.758–0.875) was significantly superior to individual indicators (SMI: AUC=0.634; VFA: AUC=0.697). When the combined critical probability was set to 0.479, this model’s diagnostic sensitivity (72.0%) improved by 19 percentage points compared with the VFA-alone model, showing clinical equivalence to the machine learning model developed by Lee et al (AUC=0.82).19 This suggests that CT-based body composition analysis can be translated into a clinically practical tool for diabetes risk stratification. For example, in high-risk individuals with low SMI (<71.18 cm2/m2) and high VFA (>191.32 cm2), a stepwise intervention is recommended, as follows: 1) progressive resistance training (3 times/week, 60%–80% one-repetition maximum intensity) to improve muscle mass and increase irisin secretion (+35%);14 2) moderate-intensity continuous exercise combined with a low-glycemic index (GI) diet (30 minutes/day, 50%–70% heart rate reserve, GI <55) can reduce visceral fat by 5.8% annually.22 Additionally, the sex-specific threshold system proposed in this study (male VFA >374.5 cm2, female VFA >278.4 cm2) provides imaging-based support for precision medicine and could be integrated into electronic health record systems in the future to achieve automated risk alerts.5,8
This study has several limitations. First, as a single-center retrospective study, the results may be subject to selection bias. We also did not control for lifestyle and other confounding factors, although strict inclusion and exclusion criteria were used to minimize bias. Second, we did not quantify muscle fiber types (type II fiber reduction is associated with insulin resistance, r=0.32) or intramyocellular lipid content.13 Third, the radiation dose of CT (average 3.5 mSv) limits its applicability in large-scale population screening; Technical Limitations:① The L3 level only reflects a localized anatomical region and cannot capture the heterogeneous distribution of abdominal or whole-body muscle/fat;16 ② Low sensitivity to dynamic changes — Single-slice measurements may fail to capture volumetric gradient differences in muscle and fat across vertebral segments (eg, T12–L5), particularly during the progression of obesity or sarcopenia, where compensatory changes in other regions might be missed with a single cross-section;17 ③ Functional relevance limitations — Key metabolically active muscle groups and deep fat depots are not directly covered at the L3 level, potentially leading to an underestimation of overall metabolic load.23 Additionally, this study did not assess pancreatic fat content, which may overlook its potential role in the pathogenesis of diabetes. Future studies should incorporate imaging techniques such as MRI to further investigate the interplay between pancreatic fat and overall body composition.
Conclusion
This study confirmed that both skeletal muscle index (SMI) and visceral fat area (VFA) are independent predictors of T2DM risk (SMI: OR = 0.906; VFA: OR = 1.008). Moreover, the predictive model combining these two parameters (AUC = 0.816) significantly outperformed models based on either indicator alone (DeLong’s test, P < 0.001).In summary, this study quantitatively demonstrated, for the first time, the synergistic effect of increased visceral fat accumulation (VFA↑) and reduced skeletal muscle mass (SMI↓) in the development of T2DM (interaction P<0.001). The newly proposed muscle-to-fat metabolic imbalance index (SMI/VFA) showed significantly improved risk stratification efficacy as compared with individual indicators, evidenced by a net reclassification improvement index of 37.2% (P<0.001). The CT-based quantitative body composition system provides objective biomarkers for the precise prevention and management of diabetes. The establishment of sex-specific cutoff values (male VFA >374.5 cm2, female VFA >278.4 cm2) offers a new tool for precision screening. Future multicenter prospective studies are warranted to validate the translational potential of these CT biomarkers in diabetes primary prevention and to explore targeted interventions aimed at restoring muscle–fat balance.19,24
Although this study relied on single-slice CT assessment at the L3 level, future efforts could leverage deep learning techniques to improve the comprehensiveness and accuracy of muscle and fat segmentation. For instance, multi-level CT data (eg, from T12 to L5) combined with deep learning algorithms could enable automated quantification of total abdominal muscle volume. Alternatively, 3D U-Net-based models could be employed to construct three-dimensional reconstructions of muscle and fat compartments, allowing precise identification of metabolically high-risk areas. These approaches would not only overcome the spatial limitations of single-slice analysis but also enhance efficiency through automated processing, thereby offering more reliable solutions for large-scale population screening.
Abbreviations
SMA, Skeletal Muscle Area; SFA, Subcutaneous Fat Area; VFA, Visceral Fat Area; CT, Computed Tomography; T2DM, Type 2 Diabetes Mellitus; SMI, Skeletal Muscle Index; BMI, Body Mass Index; FBG, Fasting Blood Glucose; SBP, Systolic Blood Pressure; DBP, Diastolic Blood Pressure; VSR, Visceral-to-Subcutaneous fat Ratio.
Data Sharing Statement
The data that support the findings of this study are available from the corresponding author, [Tang Y] upon reasonable request.
Ethical Statement
This retrospective study has obtained approval from the ethics committees of Fushun Central Hospital (zzyyll2023008). The Institutional Review Board exempted the informed consent requirement because this was a retrospective study and this study kept all the patients’ data confidentiality. This study complied with the Declaration of Helsinki.
Author Contributions
Bo Zhang and Zhe Wu are co-first authors for this study. Bo Zhang, Zhe Wu: Conceptualization; Writing – Original Draft; Yanjun Zou, Yi Tang: Formal Analysis; Methodology; Writing - original draft; Chao Jiang: Supervision; Formal Analysis; Writing - review & editing; Ning Li: Software; Formal analysis; Writing - review & editing; Xiujing An: Visualization; Data curation; Writing - review & editing; Lufeng Tian: Writing – Review & Editing; Data curation; Yang Cai: Resources; Formal Analysis; Writing - review & editing. All authors contributed to the writing and critical revision of the paper, provided final approval of the version to be published, agreed on the submission to this journal, and agreed to be accountable for all aspects of the work.
Funding
This work was supported by Fushun Revitalization Talents Program (FSYC202207001) (to Yi Tang) and Fushun Revitalization Talents Program (FSYC202407005)(to Zhe Wu).
Disclosure
All authors declare no conflicts of interest in this work.
References
1. Saeedi P, Petersohn I, Salpea P, et al. Global and regional diabetes prevalence estimates for 2019 and projections for 2030 and 2045: results from the International Diabetes Federation Diabetes Atlas. Diabet Res Clin Pract. 2020;157:107843. doi:10.1016/j.diabres.2019.107843
2. Wang L, Peng W, Zhao Z, et al. Prevalence and treatment of diabetes in China, 2013-2018. JAMA. 2021;326(24):2498–2506. doi:10.1001/jama.2021.22208
3. H Kim, H Hirano, A Edahiro, et al. Sarcopenia: prevalence and associated factors based on different suggested definitions in community-dwelling older adults. J Bone Metab. 2013;20(1):1–10. doi:10.11005/jbm.2013.20.1.1
4. Neeland IJ, Ross R, Després J-P, et al. Visceral and ectopic fat, atherosclerosis, and cardiometabolic disease: a position statement. Lancet Diabetes Endocrinol. 2019;7(9):715–725. doi:10.1016/S2213-8587(19)30084-1
5. Yoshiura T, Kiryu S. FAIR: a recipe for ensuring fairness in healthcare artificial intelligence. Jpn J Radiol. 2024;42:1–2. doi:10.1007/s11604-023-01478-z
6. Kim TN, Park MS. Sarcopenia and Insulin Resistance: mechanisms and Therapeutic Implications. Endocrinol Metab. 2022;37(1):35–48.
7. Tang Y, Wei Z, Li N, et al. CT Quantitation and Prediction of the Risk of Type 2 Diabetes Mellitus in Non-Obese Patients with Pancreatic Fatty Infiltration. Diabetes Metab Syndr Obes. 2024;17:2619–2625. doi:10.2147/DMSO.S455966
8. Pickhardt PJ, Graffy PM, Zea R, et al. Utilizing Fully Automated Abdominal CT–Based Biomarkers for Opportunistic Screening for Metabolic Syndrome in Adults Without Symptoms. AJR Am J Roentgenol. 2021;216(1):85–92. doi:10.2214/AJR.20.23049
9. Karastergiou K, Smith SR, Greenberg AS, et al. Sex differences in human adipose tissues – the biology of pear shape. Biol Sex Differ. 2012;3(1):13. doi:10.1186/2042-6410-3-13
10. Lotta LA, Abbasi A, Sharp SJ, et al. Definitions of Metabolic Health and Risk of Future Type 2 Diabetes in BMI Categories: A Systematic Review and Network Meta-analysis. Diabetes Care. 2015;38(11):2177–2187. doi:10.2337/dc15-1218
11. Lovejoy JC, Champagne CM, de Jonge L, Xie H, Smith SR. Increased visceral fat and decreased energy expenditure during the menopausal transition. Int J Obes (Lond). 2008;32(6):949–958. doi:10.1038/ijo.2008.25
12. Lovejoy JC, Champagne CM, Smith SR, de Jonge L, Xie H. Ethnic differences in dietary intakes, physical activity, and energy expenditure in middle-aged, premenopausal women: the Healthy Transitions Study. Am J Clin Nutr. 2001;74(1):90–95. doi:10.1093/ajcn/74.1.90
13. Srikanthan P, Horwich TB, Tseng CH. Relation of Muscle Mass and Fat Mass to Cardiovascular Disease Mortality. Am J Cardiol. 2016;117(8):1355–1360. doi:10.1016/j.amjcard.2016.01.033
14. Wilkinson DJ, Piasecki M, Atherton PJ. The age-related loss of skeletal muscle mass and function: Measurement and physiology of muscle fibre atrophy and muscle fibre loss in humans. Aging Res Rev. 2018;47:123–132. doi:10.1016/j.arr.2018.07.005
15. Ashino K, Kamiya N, Zhou X, Kato H, Hara T, Fujita H. Joint segmentation of sternocleidomastoid and skeletal muscles in computed tomography images using a multiclass learning approach. Radiol Phys Technol. 2024;17(4):854–861. doi:10.1007/s12194-024-00839-1
16. Kawamoto M, Kamiya N, Zhou X, Kato H, Hara T, Fujita H. Simultaneous Learning of Erector Spinae Muscles for Automatic Segmentation of Site-Specific Skeletal Muscles in Body CT Images. IEEE Access. 2024;12:15468–15476. doi:10.1109/ACCESS.2023.3335948
17. Kamiya N, Oshima A, Zhou X, et al. Surface Muscle Segmentation Using 3D U-Net Based on Selective Voxel Patch Generation in Whole-Body CT Images. Appl Sci (Basel). 2020;10(13):4477. doi:10.3390/app10134477
18. Bhasin S, Storer TW, Berman N, et al. The effects of supraphysiologic doses of testosterone on muscle size and strength in normal men. N Engl J Med. 1996;335(1):1–7. doi:10.1056/NEJM199607043350101
19. Tang SY, Wu H, Liu MR, et al. Association between skeletal muscle mass to visceral fat area ratio and insulin resistance in type 2 diabetes. J Diabetes Metab Disord. 2025;24(2):148. doi:10.1007/s40200-025-01644-2
20. Pedersen BK, Febbraio MA. Muscles, exercise and obesity: skeletal muscle as a secretory organ. Nat Rev Endocrinol. 2012;8(8):457–465. doi:10.1038/nrendo.2012.49
21. Tchernof A, Després JP. Pathophysiology of human visceral obesity: an update. Physiol Rev. 2013;93(1):359–404. doi:10.1152/physrev.00033.2011
22. Neeland IJ, Ross R, Després JP, et al. International Chair on Cardiometabolic Risk Working Group on Visceral Obesity. Visceral and ectopic fat, atherosclerosis, and cardiometabolic disease: a position statement. Lancet Diabetes Endocrinol. 2019;7(9):715–725. doi:10.1016/S2213-8587(19)30084-1
23. Borga M, West J, Bell JD, et al. Advanced body composition assessment: from body mass index to body composition profiling. J Investig Med. 2018;66(5):1–9. doi:10.1136/jim-2018-000722
24. Srikanthan P, Karlamangla AS. Muscle mass index as a predictor of longevity in older adults. Am J Med. 2014;127(6):547–553. doi:10.1016/j.amjmed.2014.02.007
 © 2025 The Author(s). This work is published and licensed by Dove Medical Press Limited. The
full terms of this license are available at https://www.dovepress.com/terms
and incorporate the Creative Commons Attribution
- Non Commercial (unported, 4.0) License.
By accessing the work you hereby accept the Terms. Non-commercial uses of the work are permitted
without any further permission from Dove Medical Press Limited, provided the work is properly
attributed. For permission for commercial use of this work, please see paragraphs 4.2 and 5 of our Terms.
© 2025 The Author(s). This work is published and licensed by Dove Medical Press Limited. The
full terms of this license are available at https://www.dovepress.com/terms
and incorporate the Creative Commons Attribution
- Non Commercial (unported, 4.0) License.
By accessing the work you hereby accept the Terms. Non-commercial uses of the work are permitted
without any further permission from Dove Medical Press Limited, provided the work is properly
attributed. For permission for commercial use of this work, please see paragraphs 4.2 and 5 of our Terms.
Recommended articles

Association Between Coronary Artery Calcium Score and Bone Mineral Density in Type 2 Diabetes Mellitus with Different Visceral Fat Area
Yang Y, Li L, Zhang Y, Yang H, Bai J, Lv H, Fu S
Diabetes, Metabolic Syndrome and Obesity 2022, 15:3949-3960
Published Date: 16 December 2022
Association of Conventional and Unconventional Lipid Profiles with Visceral Fat Area in Overweight/Obese Individuals with Type 2 Diabetes Mellitus
Ma X, Jiang X, Gao G, Ban B, Sheng J, Shi S, Zhao H, Ji B
Diabetes, Metabolic Syndrome and Obesity 2025, 18:1025-1034
Published Date: 4 April 2025
J-Shaped Relationship Between Visceral Fat Area and Large-Nerve Fiber Dysfunction Estimated by Vibration Perception Threshold in Type 2 Diabetes: A Cross-Sectional Study
Tang D, Gu X, Xuan Y, Liu Q, Lu L
Diabetes, Metabolic Syndrome and Obesity 2025, 18:2935-2943
Published Date: 20 August 2025
Assessing Invasiveness of Ground-Glass Nodules Using Ternary-Class CT Radiomics Models: A Multi-Center Study with SHAP Explanations
Zhao P, Chen H, Gu H, Lin Y, Ma Y
Cancer Management and Research 2026, 18:602730
Published Date: 5 June 2026
Development and Internal Validation of a Machine Learning–Based Classification Model for Identifying Cognitive Frailty in Older Inpatients with Type 2 Diabetes Mellitus
Wang S, Tan T, Wang Q, Xu C, Yang C, Wang M, Dai K
Clinical Interventions in Aging 2026, 21:594752
Published Date: 1 July 2026