Back to Journals » Diabetes, Metabolic Syndrome and Obesity » Volume 15
Association Between Coronary Artery Calcium Score and Bone Mineral Density in Type 2 Diabetes Mellitus with Different Visceral Fat Area
Authors Yang Y, Li L, Zhang Y, Yang H, Bai J, Lv H, Fu S
Received 4 October 2022
Accepted for publication 26 November 2022
Published 16 December 2022 Volume 2022:15 Pages 3949—3960
DOI https://doi.org/10.2147/DMSO.S392152
Checked for plagiarism Yes
Review by Single anonymous peer review
Peer reviewer comments 2
Editor who approved publication: Prof. Dr. Juei-Tang Cheng
Ying Yang,1,2 Lingling Li,1,2 Yangyang Zhang,1,2 Hong Yang,1,2 Jia Bai,1,2 Haihong Lv,1,2 Songbo Fu1,2
1Department of Endocrinology, The First Hospital of Lanzhou University, Lanzhou, Gansu, 730000, People’s Republic of China; 2The First Clinical Medical College of Lanzhou University, Lanzhou, Gansu, 730000, People’s Republic of China
Correspondence: Haihong Lv; Songbo Fu, Department of Endocrinology, The First Hospital of Lanzhou University, No. 1Donggang West Road, Lanzhou, Gansu, 730000, People’s Republic of China, Tel +86 13893324091 ; +86 13993122257, Email [email protected]; [email protected]
Purpose: The relationship between coronary artery calcification and bone mineral density (BMD) in T2DM is still unclear. The aim of this study is to analyze the association between coronary artery calcium score (CACs) and BMD in T2DM with different visceral fat area (VFA), and further to explore the clinical significance of CACs in predicting osteoporosis in T2DM patients.
Patients and Methods: A total of 479 T2DM patients aged ≥ 50 years were included. Agatston was applied to calculate CACs to evaluate the degree of coronary artery calcification. Dual-energy X-ray absorptiometry (DXA) was used to measure BMD. According to VFA, all subjects were divided into VFA < 100cm2 and VFA ≥ 100cm2 group. Adjusted regression analysis was performed to analyze the association between CACs and BMD. ROC curve was used to analyze the optimal cut-off value of CACs for screening osteoporosis.
Results: The baseline showed that in VFA ≥ 100cm2 group, CACs increased significantly than that in VFA < 100cm2 group (212.1± 195.9 vs 139.3± 141.8, p< 0.001) and total hip BMD decreased obviously (0.968± 0.19 vs 1.021± 0.184, p=0.01). After multivariable adjustment, CACs was not significantly associated with BMD in all patients (p> 0.05). However, CACs was negatively associated with BMD of total hip and lumbar spine in patients with VFA ≥ 100cm2 (total hip β=− 0.087 p=0.01; lumbar spine β=− 0.052 p=0.005), but not VFA < 100cm2. ROC curve analysis showed that the optimal cut-off value of CACs for screening osteoporosis was 191.505.
Conclusion: The present study implied that associations between CACs and BMD varied by the visceral fat deposition. It is critical to evaluate the condition of visceral fat accumulation for exploring the complex interplay of coronary artery calcification and BMD in T2DM patients. It may be of some clinical value for CACs in predicting osteoporosis in T2DM with visceral obesity.
Keywords: bone mineral density, coronary artery calcium score, type 2 diabetes mellitus, visceral fat area
Introduction
With the aging of population and the change of lifestyle, the prevalence of T2DM is increasing which is becoming one of the major diseases affecting people’s health. Continuous hyperglycemia will damage multiple organs and cause a series of complications, among which coronary artery disease is one of the common complications of T2DM.1 Atherosclerosis is the main pathological mechanism of coronary artery disease with the specific manifestation of vascular calcification. The increase of calcified plaque leads to stenosis, occlusion or rupture of lumen, resulting in acute cardiovascular events.2
The pathological mechanism of vascular calcification is still unclear now. It has been traditionally considered as a passive, degenerative process mainly related to the deposition of calcium and phosphate salts.3 However, evidence now supports the concept that the development of arterial calcification plaque is an active process characterized by the process of bone formation.4 Kurabayashi M found that smooth muscle cells could differentiate into cartilage precursor and chondrocyte-like cells in calcified blood vessels lacking in Matrix Gla Protein (MGP) in mice.5 The trans-differentiation is an important process, accelerating vascular calcification and the presence of bone components in calcified vessels. In addition, several large clinical studies showed that CACs was significantly negatively correlated with BMD.6 These studies suggested that vascular calcification and BMD may be closely related in pathological mechanism. However, some studies have suggested that there was no correlation between CACs and BMD after controlling for multiple risk factors.7
Recent studies mostly focus on the correlation between coronary artery calcification and BMD in normal or overweight or obese patients, and these are limited.8 It is still unclear how the association between coronary artery calcification and BMD is in T2DM. There is no unified conclusion on the changes of bone mass in T2DM.9,10 In addition, patients with T2DM are often complicated with visceral obesity. Visceral fat can secrete a variety of pro-inflammatory adipokines, which are closely related to insulin resistance, lipid disorders, cardiovascular diseases and bone metabolic diseases.11,12 Therefore, it is of great significance to study the association between coronary artery calcification and BMD in T2DM patients with different VFA.
According to the 2010 American College of Cardiology/American Heart Association (ACC/AHA) guidelines, CACs measured by the Agatston method is commonly used clinically to evaluate the severity of coronary artery calcification.13 It is a specific quantification of the degree of vascular calcification, which is positively correlated with that of coronary atherosclerotic plaque load, and can be applied to identify high-risk groups earlier.14 Therefore, this study analyzed the association between CACs and BMD in T2DM patients with different VFA and further to explore the relationship between coronary artery calcification and osteoporosis.
Materials and Methods
Subjects
A total of 479 T2DM patients aged ≥50 years who were hospitalized in The First Hospital of Lanzhou University from October 2019 to October 2021 were selected for study, including 255 males and 224 females. The sample size was calculated based on the formulas for comparing two independent sample and at least 153 people should be included in each group.15 According to the criteria of visceral obesity, the subjects were divided into two groups: VFA <100 cm2 group and VFA ≥100 cm2 group, as shown in Figure 1. The clinical data, biochemical results, CACs and BMD of the total hip, femoral neck and lumbar spine were collected and compared.
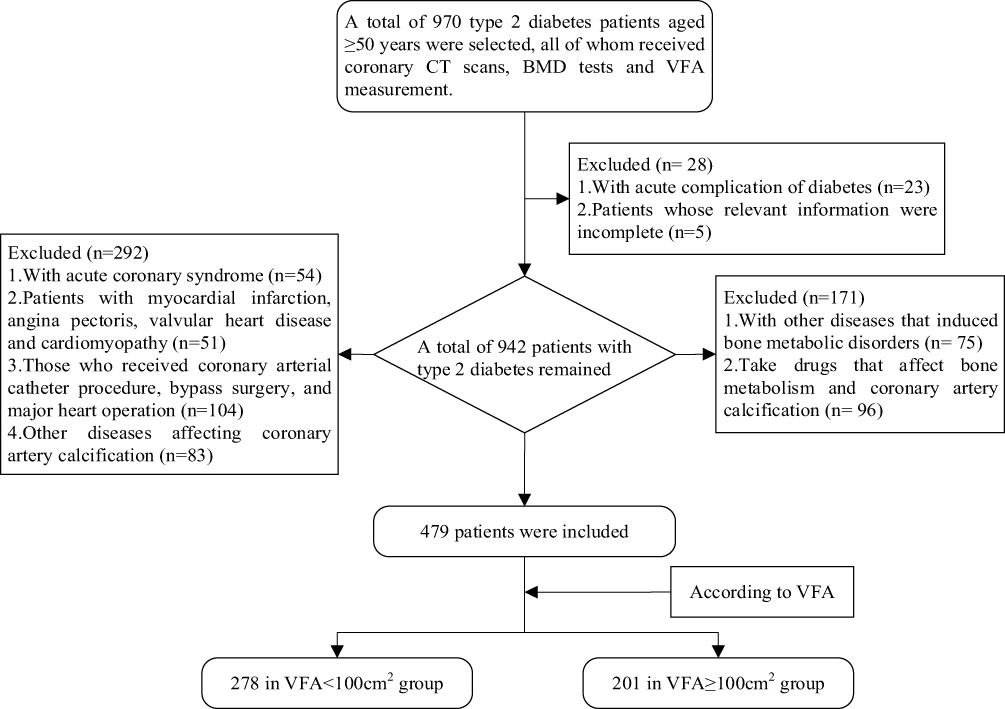 |
Figure 1 Flow diagram of the enrollment of study subjects. Abbreviations: BMD, bone mineral density; VFA, visceral fat area. |
Inclusion Criteria
(1) The diagnosis of T2DM was performed according to the 1999 World Health Organization (WHO) classification and diagnostic criteria of diabetes; (2) Age ≥50 years, and females were menopause; (3) Duration of T2DM ≥5 years; (4) This study was performed in line with the principles of the Declaration of Helsinki. Approval was granted by the Ethics Committee of The First Hospital of Lanzhou University (LDYYLL2022-331).
Exclusion Criteria
The subjects who met the following criteria were excluded: (1) patients with acute complications of diabetes, acute coronary syndrome and other high-risk characteristics; (2) patients with myocardial infarction, angina pectoris, valvular heart disease, cardiomyopathy;16 (3) those who had previously undergone coronary artery bypass grafting or percutaneous coronary stenting;17 (4) those who took lipid-lowering drugs such as atorvastatin or rosuvastatin in half year;18 (5) Those with severe liver and kidney dysfunction; (6) those with diseases that significantly affected bone metabolism, such as hyperthyroidism and hypoparathyroidism;19,20 (7) those who took calcium, vitamin D, antiepileptic drugs, hormones and other drugs that significantly affected bone metabolism within 1 year;21 (8) those with malignant tumors and autoimmune diseases;22,23 (9) relevant information was incomplete.
Data Collection
The clinical data such as gender, age, height, weight, duration of T2DM, systolic blood pressure, and diastolic blood pressure were collected. BMI was calculated based on height and weight, BMI=weight/height2 (kg/m2). Blood pressure was measured by a nurse using an electronic sphygmomanometer while the patient was in a quiet state (at least 5 minutes of rest). All patients completed blood test before coronary CTA examination. Serum blood was taken in the morning after a 12-hour fast. FPG, TC, TG, LDL-C, HDL-C, Ca, P, ALP were measured by automatic biochemical analyzer (Beckman Coulter AU5800). HbA1c was measured by high pressure liquid chromatography (Bio-Rad variant turbo II analyzer). 25(OH)D was determined using chemiluminescence.
Visceral Fat Area Measurement
Omron DUALSCAN HDS-2000 device was used to measure VFA. All patients were fasted for at least 8 hours and should defecate and urinate before taking the measurement. The patient was in a supine position to ensure a quiet state, and then the VFA were measured by a specialized operator according to the operating instructions of the DUALSCAN HDS-2000.
CACs Measurement
Philips Brilliance 256-slice spiral CT was adapted. During the scan, the patient held breath and the heart rate was controlled below 80 beats/min. Plain scan images were acquired during the R-R interval of the cardiac cycle. All images were denoised and artifact-removed and analyzed after acquisition. Image quality and coronary calcium scores were assessed by two professional radiologists individually, who were blinded to the patient’s other clinical data and this study. The adopted final calcium score was the average of assessments made independently by two radiologists.
The coronary artery calcification score was calculated according to the Agatston scoring method.24 The calcified plaque was defined as the CT value >130HU and the area >1mm2. The calculation method was the area multiplied by the peak calcification score. The rule of peak calcification score was that 1 point for 130–199Hu, 2 points for 200–299Hu, 3 points for 300–399Hu, and 4 points for >400Hu. The vessels of interest included the left main (LM), left anterior descending (LAD), left circumflex (LCX), and right coronary arteries (RCA) and their major branches. And then the scores of these branches were summed to obtain a total coronary artery calcium score, such as Figure 2.
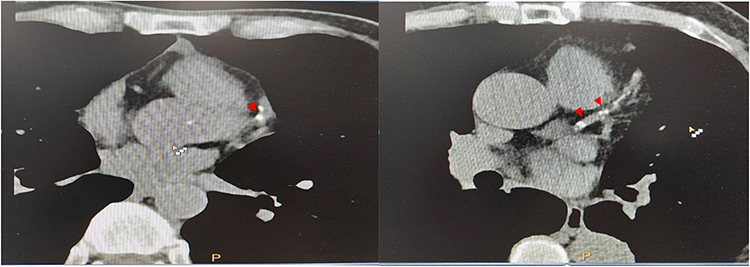 |
Figure 2 Identification of coronary artery calcifications (red arrows) in patients with type 2 diabetes. The coronary calcium score of left was 64 (with non-visceral obesity) while the right was 302 (with visceral obesity). |
BMD Measurement
The BMD of the LS, FN, and TH (g/cm2) were measured by DXA scanning using a GE Lunar Prodigy Pro densitometer (Madison, WI, USA). Results were analyzed using enCORE version 16 software (GE Health). Regions of interest were manually checked and adjusted by two reviewers. The DXA scanner needs to be calibrated before each scan according to the manufacturer’s recommendations. According to the diagnostic criteria of osteoporosis recommended by the World Health Organization (WHO) in 1994, the T value of any tested site ≤-2.5 SD was diagnosed as osteoporosis, −2.5 SD < T value < −1.0 SD was considered as osteopenia, and T value ≥-1.0 SD was normal.
Statistical Analysis
SPSS 25.0 software was used for statistical analysis. For quantitative variables, results were expressed as mean ± standard deviation. The differences were analyzed by T test between two groups while by one-way ANOVA among at least three groups. The counting data were expressed by number or frequency and the significance was tested by chi square test. Because CACs was skewed distribution, we took the logarithm of CACs and used multiple linear regression models to analyze the correlation between CACs and total hip, femoral neck and lumbar BMD. The receiver operating characteristic (ROC) curve was used to analyze optimal cut-off points of CACs for screening osteoporosis in T2DM. P< 0.05 was considered a significant difference.
Results
Clinical and Biochemical Features
The clinical characteristics of the study population are displayed in Table 1. There were 479 subjects evaluated in the study with a mean (±SD) age of 60.4±9.8 years. In the two groups divided by VFA, there were 278 subjects in VFA <100cm2 group and 201 subjects in VFA ≥100cm2 group. The mean CACs (±SD) of two groups were, respectively, 139.3±141.8 and 212.1±195.9. The differences were statistically significant (p<0.001; Figure 3). There were significant differences in mean total hip BMD levels between VFA <100cm2 group (1.021±0.184) and VFA ≥100cm2 group (0.968±0.19) (p=0.01; Figure 4). The level of femoral neck and lumbar spine BMD decreased in VFA ≥100cm2 group (but not significantly) (p>0.05). With the increase of VFA, the CACs levels were significantly higher while BMD levels were significantly lower. There were no statistical differences in height, weight, BMI, SBP, DBP, FPG, 2hPG, HbA1c, HDL-C, LDL-C, TC, TG, Ca, P, ALP, and 25(OH)D among the groups (p>0.05).
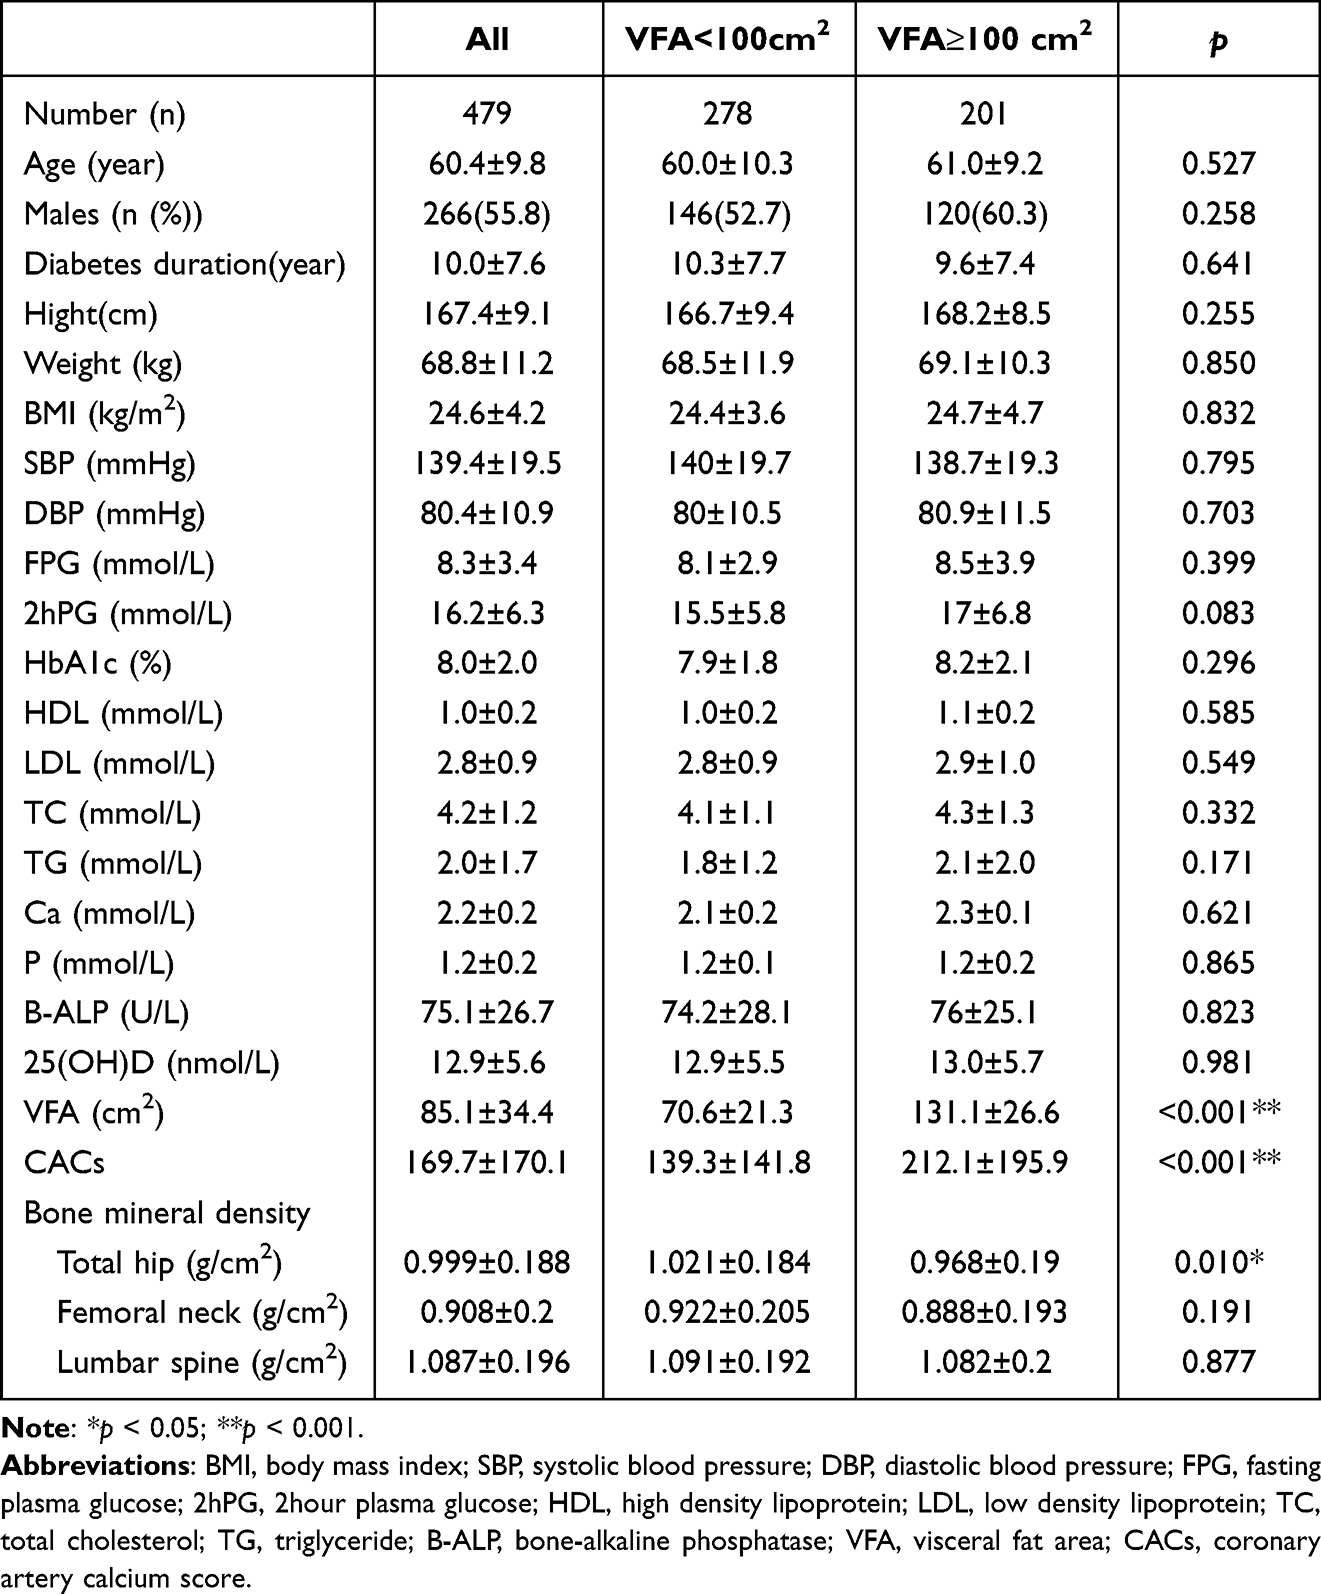 |
Table 1 Clinical and Biochemical Features |
 |
Figure 3 Coronary artery calcium score distribution difference between VFA<100cm2 and VFA≥100cm2. |
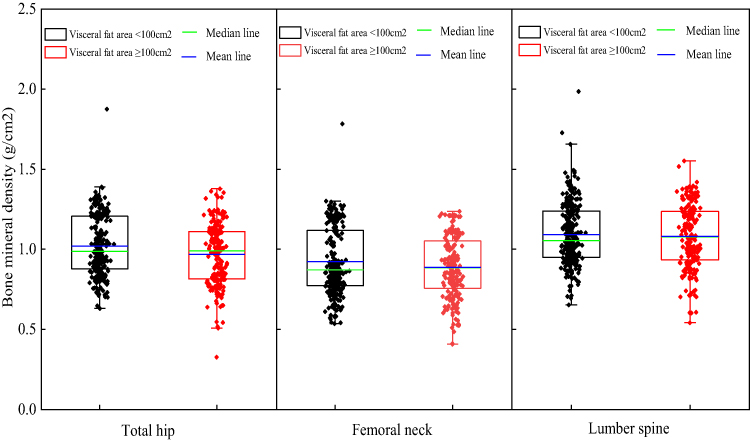 |
Figure 4 Bone mineral density distribution difference between VFA<100cm2 and VFA≥100cm2 in 3 locations. |
Comparison of CACs Levels in T2DM Patients with Normal, Osteopenia and Osteoporosis
According to BMD results, subjects were classified into three groups: normal, osteopenia, and osteoporosis, as shown in Table 2 (Figure 5). The mean (±SD) CACs levels of normal BMD, osteopenia, and osteoporosis in all participants were, respectively, 116.3±104.2, 177.5±150.8, 183.4±171.8 (p<0.05) and in those subjects, no matter for men or women, the differences of CACs levels were significant (p<0.05).
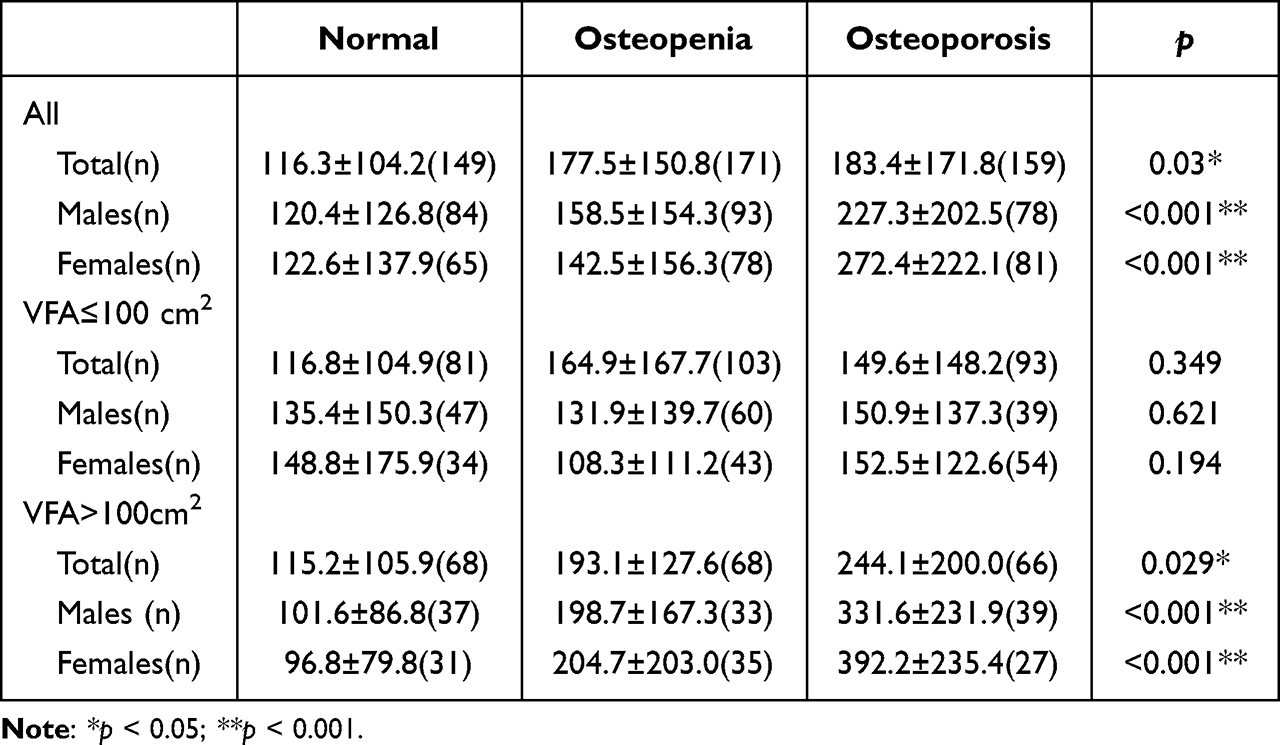 |
Table 2 Comparation of CACs in T2DM Patients of Normal, Osteopenia and Osteoporosis |
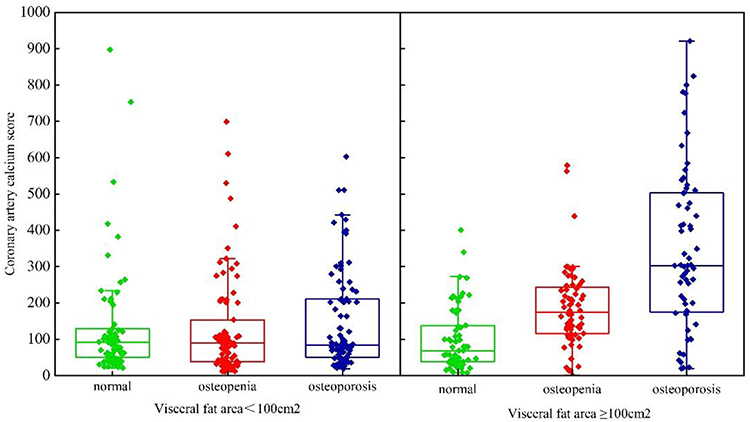 |
Figure 5 Coronary artery calcium score distribution difference among normal, osteopenia and osteoporosis in visceral fat area <100cm2 and visceral fat area ≥100cm2 group. |
Subgroup analysis with respect to VFA was not concordant with the results for overall study population. In VFA <100cm2 group, the differences of CACs levels were not significant between patients with normal BMD, osteopenia, and osteoporosis (116.8±104.9 vs 164.9±167.7 vs 149.6±148.2) (p=0.349). Further, no significant differences were observed in either males or females. However, in VFA ≥100cm2 group, the mean (±SD) CACs of patients with osteoporosis was 244.1±200.0, which was significantly higher than those with osteopenia or normal BMD (p<0.05). The differences were significant in both males and females.
The Correlation Between CACs and BMD by Adjusted Regression
As shown in Table 3, BMD was used as the dependent variable. The adjusted regression model was used to analyze the relationship between the CACs and BMD, which was divided into 4 steps. The first step was model 0 (M0) which only introduced CACs as an independent variable. The second step was model 1 (M1) which introduced Age, Sex and BMI for adjustment. The third step was model 2 (M2) which introduced BMI, SBP, DBP, HbA1c and VFA on the basis of model 1 for adjustment. The fourth step was model 3 (M3) which added LDL, TG, TC, Ca, ALP and 25(OH)D on the basis of model 2 for adjustment. The regressions of M0-M3 are depicted in Figure 6.
 |
Table 3 Correlation Between CACs (Log x) and BMD by Adjusted Regression |
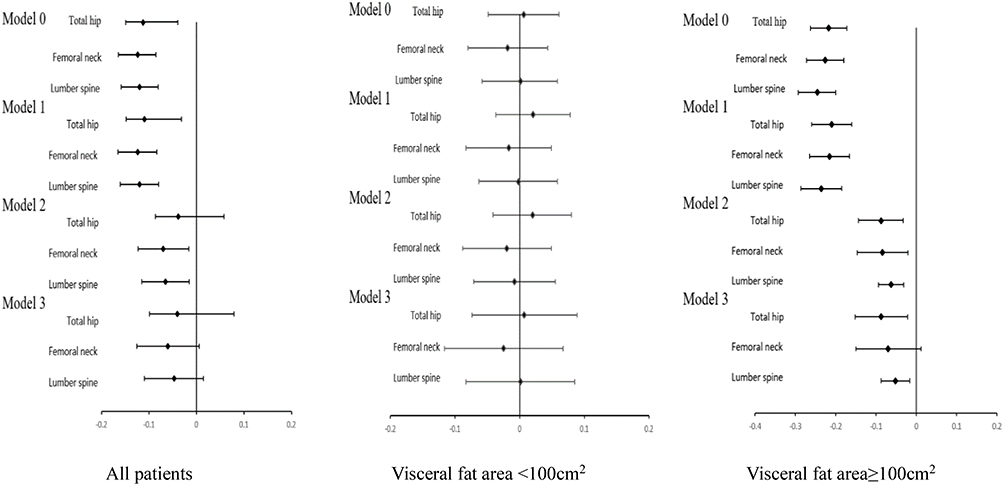 |
Figure 6 Standardized regression coefficients are shown for correlation between CACs and BMD by adjusted regression analyses in all patients, visceral fat area <100cm2 and visceral fat area ≥100cm2. Notes: Model 0: Unadjusted; Model 1: Adjusted for age, sex, diabetes duration; Model 2: Adjusted for the covariates in Model 1+BMI, SBP, DBP, HbA1c, VFA; Model 3: Adjusted for the covariates in Model 2+HDL, LDL, TG, TC, Ca, ALP, 25(OH)D. |
The results showed that in all patients, CACs was associated negatively with BMD in M1 adjusted for age, sex and duration (p<0.001 for total hip, femoral neck, lumber spine) and in M2 adjusted for BMI, SBP, DBP, HbA1c and VFA (p=0.011 for femoral neck). With further adjustment for HDL, LDL, TG, TC, Ca, ALP, 25(OH)D, the association between CACs and BMD was attenuated (p=0.190 for total hip, p=0.075 for femoral neck, p=0.139 for lumber spine).
Subgroup analysis showed that among participants with VFA <100cm2, there was no significant association between CACs and BMD in minimally or multivariable adjusted models (M0-M3) (p>0.05). For patients with VFA ≥100cm2, significant negative associations between CACs and BMD of total hip and lumber spine were observed with adjustment for age, sex and duration in M1 (β=−0.210, p<0.001 for total hip; β=−0.236, p<0.001 for lumber spine) and adjustment for BMI, SBP, DBP, HbA1c, VFA in M2 (β=−0.088, p=0.002 for total hip; β=−0.063, p<0.001 for lumber spine). With further adjustment for HDL, LDL, TG, TC, Ca, ALP, 25(OH)D, the associations between CACs and BMD of total hip and lumber spine remained significant but attenuated (β=−0.087, p=0.010 for total hip; β=−0.052, p=0.005 for lumber spine). CACs was significantly associated negatively with femoral neck BMD after adjustment confounders in M1 (β=−0.246, p<0.001) and 2 (β=−0.084, p=0.01), but further adjustment for factors attenuated the relationship (p>0.05).
ROC Curve Analysis of CACs Screening Osteoporosis
As shown in Figure 7, the AUC of CACs for predicting osteoporosis in T2DM patients was 0.879 according to ROC curve data (95% CI:0.827–0.930, p<0.001). The maximum Jordan index was calculated to be 0.702, and the corresponding optimal cut-off value of CACs level was 191.505, with a sensitivity of 81.9% and specificity of 88.2%.
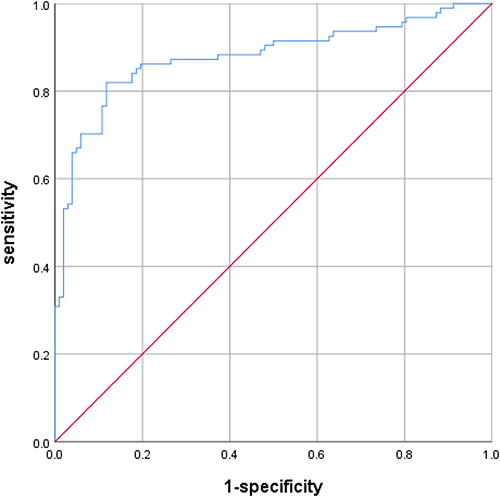 |
Figure 7 ROC curve analysis of CACs screening osteoporosis. |
Discussion
Osteoporosis and cardiovascular diseases are both major diseases in public. More and more studies have shown that vascular calcification is closely related to osteoporosis. Xu R found that low BMD in the spine and femoral neck was an independent risk factor for coronary artery calcification in postmenopausal women.25 Therkildsen J reported that BMD was significantly correlated with CACs in obese women when adjusting confounding factors. BMD decreased significantly with the aggravation of calcification.26 In this study, we found there was no correlation between CACs and BMD in whole T2DM patients (p>0.05), which was inconsistent with above studies. It was possibly due to their subjects being obese.
Most of T2DM patients are complicated with visceral obesity. In addition to age, hypertension, hyperglycemia, visceral fat is significantly associated with the development of atherosclerosis.27 Bouchi R found that high VFA (≥100cm2) was an important determinant of carotid atherosclerosis in T2DM.28 Visceral fat can secrete lots of factors and cause continuous inflammatory response which accelerates coronary calcification.29 In addition, adipose tissue can also be deposited around bone tissue causing bone metabolism disorder and inhibiting bone formation.30 Therefore, we investigated the level of CACs and BMD in T2DM patients with different VFA. The results showed that with increase of VFA, CACs was significantly increased and total hip BMD decreased apparently. The excessive accumulation of visceral fat causes vascular endothelial dysfunction and further induces oxidative stress causing vascular injury.
The present study showed that relationship of BMD and CACs for patients with different VFA were different. We found that CACs was significantly negatively correlated with total hip and lumbar spine BMD for T2DM patients with VFA ≥100cm2, but not in patients with VFA <100cm2. Ahmadi N’s research reveals that BMD decreased significantly with increasing coronary artery calcification in obese individuals and their results are consistent with ours.31 When adjusted for age, sex and duration in M1, further adjusted for BMI, SBP, DBP, HbA1c, VFA in M2 and for HDL, LDL, TG, TC, Ca, ALP, and 25(OH)D in M3, the correlation between CACs and BMD were low values of the regression, respectively. The results suggested that above confounders could affect BMD; however, the present study still found that the associations between CACs and BMD were significant in patients with VFA ≥100cm2. Therefore, CACs is an independent risk factor for osteoporosis of T2DM patients with visceral obesity.
There are some researches on the relationship between CACs and BMD, but the conclusions are not consistent, which may be related to subjects and BMD sites. Lee HT found an inverse association between BMD and CACs in patients with metabolic syndrome, but no association in patients without metabolic syndrome.32 Another study showed that there was no significant association between CAC and osteopenia or osteoporosis of postmenopausal females.33,34 In a cross-sectional study, a significantly negative association was found between CACs and BMD of lumbar spine, but not total hip.35 However, another study reported that a significant association of CACs with an increase of osteoporotic fracture and hip fracture risk.36 These studies implied that the included subjects and BMD sites may be critical when analyzing the association of these two. Our study firstly found a negative association between CACs and BMD in T2DM patients with visceral obesity.
The possible molecular mechanism of relation between BMD and vascular calcification is that bone metabolism and arterial calcification share a common signaling pathway called OPG/RANKL/RANK.37 The expresses of OPG gene are not only in bone tissue to inhibit osteoclast differentiation, but in vascular smooth muscle cells and endothelial cells to accelerate vascular calcification.38 The overexpressing OPG transgenic mice can develop osteosclerosis, while the mice with OPG gene knocking out show severe aortic calcification and severe osteoporosis.39 In addition, klotho gene-deficient mice developed atherosclerosis and osteoporosis.40 Klotho protein is mainly expressed by kidney and is involved in the activation of fibroblast growth factor (FGF) receptors. Through the regulation on ion channels and signal-regulated kinases, this protein can improve the metabolism of blood phosphorus and bone tissue, and then involve in the progression of coronary artery calcification.41
This study firstly designed to investigate the relationship between CACs and BMD in T2DM patients with different VFA. We demonstrated that there was significant association between CACs and BMD of total hip and lumber spine in T2DM patients with VFA ≥100cm2. However, this study had several limitations. Firstly, it was a cross-sectional study and could not explore the cause-and-effect relationship between CACs and BMD. Further prospective studies are needed to identify causality among coronary artery calcification and osteoporosis. Secondly, although DXA is the standard method for osteoporosis screening and follow-up, DXA may not be the ideal technique to distinguish between bone mineral content and extraosseous calcification. Also, it must be considered that the calcified ROIs marked manually may cause bias of CACs results. However, studies have suggested that accuracy of CACs by semi-automated Agatston scoring was not inferior to that based software for fully automated. Finally, we measured VFA by bioelectrical impedance analysis (BIA) rather than computed tomography (CT), a gold standard measure of VFA. However, compared with CT, BIA is a more widely available, low-cost, and no radiation method. And a significant correlation between VFA observed by CT and VFA estimated by BIA was revealed in healthy volunteers.42,43
Conclusion
In conclusion, the present study suggested that there was no significant association between CACs and BMD in all patients with T2DM. However, in patients with VFA ≥100cm2 group, there was a negative association between CACs and BMD of total hip and lumbar spine. Our findings implied that associations between CACs and BMD varied by the visceral fat deposition. It is critical to evaluate the condition of visceral fat accumulation for exploring the complex interplay of vascular calcification and bone metabolism in T2DM. It may be of some clinical value for CACs in predicting osteoporosis in T2DM with visceral obesity.
Ethics Approval
This study was approved by the Ethics Committee of The First Hospital of Lanzhou University (LDYYLL2022-331).
Acknowledgments
We thank all patients and their families for consenting use their medical documentations and information that lead to our paper.
Funding
This work was supported by Gansu Natural Science Foundation [No. 21JR1RA080] and The First Hospital of Lanzhou University Research Fund [No. ldyyyn2019-39].
Disclosure
The authors report no conflicts of interest in this work.
References
1. Hong T, Yan Z, Li L, et al. The prevalence of cardiovascular disease in adults with type 2 diabetes in China: results from the cross-sectional CAPTURE study. Diabetes Ther. 2022;13:969–981. doi:10.1007/s13300-022-01243-x
2. Van den Hoogen IJ, Stuijfzand WJ, Gianni U, et al. Early versus late acute coronary syndrome risk patterns of coronary atherosclerotic plaque. Eur Heart J Cardiovasc Imaging. 2022;23(10):1314–1323. doi:10.1093/ehjci/jeac114
3. Wallin R, Wajih N, Greenwood GT, Sane DC. Arterial calcification: a review of mechanisms, animal models, and the prospects for therapy. Med Res Rev. 2001;21(4):274–301. doi:10.1002/med.1010
4. Bourne LE, Wheeler-Jones CP, Orriss IR. Regulation of mineralisation in bone and vascular tissue: a comparative review. J Endocrinol. 2021;248(2):R51–R65. doi:10.1530/JOE-20-0428
5. Kurabayashi M. Vascular calcification - pathological mechanism and clinical application - role of vascular smooth muscle cells in vascular calcification. Clin Calcium. 2015;25(5):661–669.
6. Nakama C, Kadowaki T, Choo J, et al. Cross-sectional association of bone mineral density with coronary artery calcification in an international multi-ethnic population-based cohort of men aged 40–49: ERA JUMP study. IJC Heart Vasc. 2020;30:100618. doi:10.1016/j.ijcha.2020.100618
7. Fathala AL, Alkulaybi S, Khawaji A, Alomari A, Almuhaideb A. The association between low bone mineral density and coronary artery calcification in osteoporotic and non-osteoporotic patients in a tertiary center in Saudi Arabia. Ann Saudi Med. 2021;41(2):101–108. doi:10.5144/0256-4947.2021.101
8. Zhu J, Guo F, Zhang J, Mu C. Relationship between carotid or coronary artery calcification and osteoporosis in the elderly. Minerva Med. 2019;110(1):12–17. doi:10.23736/S0026-4806.18.05632-X
9. Zhao C, Kan J, Xu Z, et al. Higher BMI and lower femoral neck strength in males with type 2 diabetes mellitus and normal bone mineral density. Am J Med Sci. 2022;364(5):631–637. doi:10.1016/j.amjms.2022.06.007
10. Dahihandekar C, Pisulkar SG, Sathe S, Godbole S, Bansod AV, Purohit H. Assessment of bone mineral density in type 2 diabetes: a Cone Beam Computed Tomography (CBCT) Study. Cureus. 2022;14(8):e28035. doi:10.7759/cureus.28035
11. Aras M, Tchang BG, Pape J. Obesity and diabetes. Nurs Clin North Am. 2021;56(4):527–541. doi:10.1016/j.cnur.2021.07.008
12. Rana MN, Neeland IJ. Adipose tissue inflammation and cardiovascular disease: an update. Curr Diab Rep. 2022;22(1):27–37. doi:10.1007/s11892-021-01446-9
13. Greenland P, Alpert JS, Beller GA, et al. 2010 ACCF/AHA guideline for assessment of cardiovascular risk in asymptomatic adults: a report of the American College of Cardiology Foundation/American Heart Association task force on practice guidelines. J Am Coll Cardiol. 2010;56(25):e50–103. doi:10.1016/j.jacc.2010.09.001
14. Manapragada PP, Aziz MU, Singh SP, Nath H. Cardiac computed tomographic evaluation of coronary artery calcification: a review. J Med Radiat Sci. 2021;52(3s):S12–s18. doi:10.1016/j.jmir.2021.07.006
15. Examination Committee of Criteria for ‘Obesity Disease’ in J, Japan Society for the Study of O. New criteria for ‘obesity disease’ in Japan. Circ J. 2002;66(11):987–992. doi:10.1253/circj.66.987
16. Ahmed T, Ahmad M, Mungee S. Cardiac calcifications. In: StatPearls. Treasure Island (FL): StatPearls Publishing; 2022.
17. Iwai S, Watanabe M, Okamura A, et al. Prognostic impact of calcified plaque morphology after drug eluting stent implantation- an optical coherence tomography study. Circ J. 2021;85(11):2019–2028. doi:10.1253/circj.CJ-20-1233
18. Ahn HJ, Lee H, Park HE, et al. Changes in metabolic syndrome burden and risk of coronary artery calcification progression in statin-naïve young adults. Atherosclerosis. 2022;360:27–33. doi:10.1016/j.atherosclerosis.2022.09.011
19. Nicolaisen P, Obling ML, Winther KH, et al. Consequences of hyperthyroidism and its treatment for bone microarchitecture assessed by high-resolution peripheral quantitative computed tomography. Thyroid. 2021;31(2):208–216. doi:10.1089/thy.2020.0084
20. Silva BC, Bilezikian JP. Skeletal abnormalities in hypoparathyroidism and in primary hyperparathyroidism. Rev Endocr Metab Disord. 2021;22(4):789–802. doi:10.1007/s11154-020-09614-0
21. Sun X, Xiao W, Li Z, et al. Does vitamin D supplementation improve bone health, body composition and physical performance beyond endurance exercise in patients with type 2 diabetes: a secondary analysis of randomized controlled trial. Front Physiol. 2022;13:1003572. doi:10.3389/fphys.2022.1003572
22. Huang JF, Tan QC, Bai H, Wang J, Bergman M, Wu Z. Bone mineral density, osteopenia and osteoporosis among US adults with cancer. QJM. 2022;115(10):653–660. doi:10.1093/qjmed/hcac015
23. Deng L, Yao F, Tian F, Luo X, Yu S, Wen Z. Influence of iguratimod on bone metabolism in patients with rheumatoid arthritis: a meta-analysis. Int J Clin Pract. 2022;2022:5684293. doi:10.1155/2022/5684293
24. Agatston AS, Janowitz WR, Hildner FJ, Zusmer NR, Viamonte M
25. Xu R, Yang HN, Li YQ, et al. Association of coronary artery calcium with bone mineral density in postmenopausal women. Coron Artery Dis. 2016;27(7):586–591. doi:10.1097/MCA.0000000000000402
26. Therkildsen J, Winther S, Nissen L, et al. Sex differences in the association between bone mineral density and coronary artery disease in patients referred for cardiac computed tomography. J Clin Densitom. 2021;24(1):55–66. doi:10.1016/j.jocd.2019.09.003
27. Brown JC, Gerhardt TE, Kwon E. Risk factors for coronary artery disease; 2020.
28. Bouchi R, Takeuchi T, Akihisa M, et al. High visceral fat with low subcutaneous fat accumulation as a determinant of atherosclerosis in patients with type 2 diabetes. Cardiovasc Diabetol. 2015;14:136. doi:10.1186/s12933-015-0302-4
29. Vasamsetti SB, Natarajan N, Sadaf S, Florentin J, Dutta P. Regulation of cardiovascular health and disease by visceral adipose tissue-derived metabolic hormones. J Physiol. 2022. doi:10.1113/JP282728
30. Piñar-Gutierrez A, García-Fontana C, García-Fontana B, Muñoz-Torres M. Obesity and bone health: a complex relationship. Int J Mol Sci. 2022;23:15. doi:10.3390/ijms23158303
31. Ahmadi N, Mao SS, Hajsadeghi F, et al. The relation of low levels of bone mineral density with coronary artery calcium and mortality. Osteoporos Int. 2018;29(7):1609–1616. doi:10.1007/s00198-018-4524-7
32. Lee HT, Shin J, Lim YH, et al. The relationship between coronary artery calcification and bone mineral density in patients according to their metabolic syndrome status. Korean Circ J. 2011;41(2):76–82. doi:10.4070/kcj.2011.41.2.76
33. Akin MN, Altun I. Associations of coronary plaque characteristics and coronary calcification with bone mineral density in postmenopausal women. Eur Rev Med Pharmacol Sci. 2022;26(20):7616–7622. doi:10.26355/eurrev_202210_30037
34. Zhang P, Yang L, Xu Q, et al. Associations between bone mineral density and coronary artery calcification: a systematic review and meta-analysis. Ther Adv Chronic Dis. 2022;13:20406223221086998. doi:10.1177/20406223221086998
35. Chuang TL, Koo M, Wang YF. Association of bone mineral density and coronary artery calcification in patients with osteopenia and osteoporosis. Diagnostics. 2020;10:9.
36. Chuang TL, Wang YF, Koo M, Chuang MH. Association of trabecular bone score-adjusted fracture risk assessment tool with coronary artery calcification in women. Diagnostics. 2022;12:1.
37. Liu H, Ru NY, Cai Y, et al. The OPG/RANKL/RANK system modulates calcification of common carotid artery in simulated microgravity rats by regulating NF-κB pathway. Can J Physiol Pharmacol. 2022;100(4):324–333. doi:10.1139/cjpp-2021-0329
38. Rochette L, Meloux A, Rigal E, et al. The role of osteoprotegerin in vascular calcification and bone metabolism: the basis for developing new therapeutics. Calcif Tissue Int. 2019;105(3):239–251. doi:10.1007/s00223-019-00573-6
39. Min H, Morony S, Sarosi I, et al. Osteoprotegerin reverses osteoporosis by inhibiting endosteal osteoclasts and prevents vascular calcification by blocking a process resembling osteoclastogenesis. J Exp Med. 2000;192(4):463–474. doi:10.1084/jem.192.4.463
40. Sasaki M, Hasegawa T, Yamada T, et al. Altered distribution of bone matrix proteins and defective bone mineralization in klotho-deficient mice. Bone. 2013;57(1):206–219. doi:10.1016/j.bone.2013.08.008
41. Hum JM, O’Bryan LM, Tatiparthi AK, et al. Chronic hyperphosphatemia and vascular calcification are reduced by stable delivery of soluble klotho. J Am Soc Nephrol. 2017;28(4):1162–1174. doi:10.1681/ASN.2015111266
42. Lee DH, Park KS, Ahn S, et al. Comparison of abdominal visceral adipose tissue area measured by computed tomography with that estimated by bioelectrical impedance analysis method in Korean subjects. Nutrients. 2015;7(12):10513–10524. doi:10.3390/nu7125548
43. Nagai M, Komiya H, Mori Y, Ohta T, Kasahara Y, Ikeda Y. Development of a new method for estimating visceral fat area with multi-frequency bioelectrical impedance. Tohoku J Exp Med. 2008;214(2):105–112. doi:10.1620/tjem.214.105
 © 2022 The Author(s). This work is published and licensed by Dove Medical Press Limited. The
full terms of this license are available at https://www.dovepress.com/terms
and incorporate the Creative Commons Attribution
- Non Commercial (unported, 3.0) License.
By accessing the work you hereby accept the Terms. Non-commercial uses of the work are permitted
without any further permission from Dove Medical Press Limited, provided the work is properly
attributed. For permission for commercial use of this work, please see paragraphs 4.2 and 5 of our Terms.
© 2022 The Author(s). This work is published and licensed by Dove Medical Press Limited. The
full terms of this license are available at https://www.dovepress.com/terms
and incorporate the Creative Commons Attribution
- Non Commercial (unported, 3.0) License.
By accessing the work you hereby accept the Terms. Non-commercial uses of the work are permitted
without any further permission from Dove Medical Press Limited, provided the work is properly
attributed. For permission for commercial use of this work, please see paragraphs 4.2 and 5 of our Terms.
Recommended articles
Risk Factors for Nonalcoholic Fatty Liver Disease in Postmenopausal Women with Type 2 Diabetes Mellitus and the Correlation with Bone Mineral Density at Different Locations
Du YJ, Liu NN, Zhong X, Pan TR
Diabetes, Metabolic Syndrome and Obesity 2022, 15:1925-1934
Published Date: 21 June 2022
Association Between Hemoglobin Levels and Osteoporosis in Chinese Patients with Type 2 Diabetes Mellitus: A Cross-Sectional Study
Ye T, Lu L, Guo L, Liang M
Diabetes, Metabolic Syndrome and Obesity 2022, 15:2803-2811
Published Date: 14 September 2022
Effect of Chiglitazar and Sitagliptin on Bone Mineral Density and Body Composition in Untreated Patients with Type 2 Diabetes
Wang Y, Zhou Y, Zhou X, Su X, Xu X, Li H, Ma J
Diabetes, Metabolic Syndrome and Obesity 2023, 16:4205-4214
Published Date: 27 December 2023
Association of Conventional and Unconventional Lipid Profiles with Visceral Fat Area in Overweight/Obese Individuals with Type 2 Diabetes Mellitus
Ma X, Jiang X, Gao G, Ban B, Sheng J, Shi S, Zhao H, Ji B
Diabetes, Metabolic Syndrome and Obesity 2025, 18:1025-1034
Published Date: 4 April 2025
J-Shaped Relationship Between Visceral Fat Area and Large-Nerve Fiber Dysfunction Estimated by Vibration Perception Threshold in Type 2 Diabetes: A Cross-Sectional Study
Tang D, Gu X, Xuan Y, Liu Q, Lu L
Diabetes, Metabolic Syndrome and Obesity 2025, 18:2935-2943
Published Date: 20 August 2025