Back to Journals » Journal of Hepatocellular Carcinoma » Volume 10
Prognostic Lysosome-Related Biomarkers for Predicting Drug Candidates in Hepatocellular Carcinoma: An Insilco Analysis
Authors Xu J, Zhang K, Zhang G ![]()
Received 13 December 2022
Accepted for publication 15 March 2023
Published 21 March 2023 Volume 2023:10 Pages 459—472
DOI https://doi.org/10.2147/JHC.S401338
Checked for plagiarism Yes
Review by Single anonymous peer review
Peer reviewer comments 3
Editor who approved publication: Prof. Dr. Jörg Trojan
Junxiu Xu,1,* Kai Zhang,2,* Genhao Zhang3
1Department of Medical Laboratory, Zhengzhou University Fifth Affiliated Hospital, Zhengzhou, People’s Republic of China; 2Department of Medical Laboratory, Zhengzhou University Third Affiliated Hospital, Zhengzhou, People’s Republic of China; 3Department of Blood Transfusion, Zhengzhou University First Affiliated Hospital, Zhengzhou, People’s Republic of China
*These authors contributed equally to this work
Correspondence: Genhao Zhang, Zhengzhou University First Affiliated Hospital, Jianshe Road 1#, Zhengzhou, 450052, People’s Republic of China, Email [email protected]
Background: Lysosomes play an important role in enhancing tumorigenesis and chemoresistance in hepatocellular carcinoma (HCC). Therefore, a detailed analysis of the role of lysosome-related genes could improve the poor prognosis of HCC patients.
Methods: Lysosome-associated genes were downloaded from the GO and Genome Enrichment Analysis (GSEA) databases. After analyzing lysosome-associated differentially expressed genes (DEGs) between the TCGA and GTEx cohorts, we used univariate Cox regression, LASSO-Cox regression, stepwise Cox regression, and multivariate Cox regression analyses to build a predictive risk model. The ICGC cohort was used as a test cohort for the prognostic signature’s validation. It was also assessed how significantly the signature affected the tumor microenvironment (TME) and sensitivity to immune checkpoint inhibitors. To investigate the expression of this signature in clinical samples, qRT-PCR and immunohistochemistry (IHC) were carried out in 50 normal tissues and 59 HCC tissues.
Results: A total of 894 lysosome-associated genes were obtained. After identifying 113 lysosome-associated DEGs, we constructed a five-gene prognostic signature (RRAGD, AP1M2, CRHBP, NCSTN, and SLCO4C1) that can be effectively applied to the prognostic classification of HCC patients in TCGA and ICGC cohorts. Additionally, we discovered that this signature can affect the proportion of macrophage infiltration in TME. We also evaluated several tumor-sensitive medicines that affect this signature. Finally, we discovered that HCC tissues had lower amounts of CRHBP compared to normal tissues by the qRT-PCR and IHC assay.
Conclusion: We developed and validated a predictive signature of five lysosome-related genes for HCC patients and verified the downregulation of CRHBP expression in clinical samples, which may provide fresh perspectives for customized immunotherapy.
Keywords: lysosome, signature, HCC, TME, prognosis
Introduction
Lysosomes are vesicular structures with a single membrane in which a large number of acidic hydrolases are present inside, and their internal pH is low, between approximately 4.5 and 5.5.1 Lysosomes can degrade damaged proteins and organelles phagocytosed by endocytosis through the release of acid hydrolases, while nutrients from metabolites are reabsorbed by the cell to maintain metabolic homeostasis.2 A variety of transcription factors including transcription factor EB (TFEB) and mTORC1 are involved in the regulation of lysosomal biosynthesis.3 When amino acids or nutrients are abundant, mTORC1 phosphorylates TFEB to inhibit its translocation to the nucleus to promote lysosome synthesis, and conversely, when nutrients are scarce, inactivated mTORC1 cannot continue to phosphorylate TFEB leading to nuclear translocation of TFEB to inhibit lysosome synthesis.4 Due to the ability to determine cell fate, lysosome-induced cell death, which we call lysosomal cell death, plays an important role in the regulation of proliferation and survival of cancer cells.5 Lipid and protein peroxidation caused by elevated reactive oxygen species (ROS) levels can lead to the disruption of lysosomal membrane integrity and play an important role in lysosomal cell death.6 As a participant in the biological process of autophagy, lysosome activity can be altered by oncoproteins associated with autophagy via the AMPK/mTOR signaling pathway, which in turn affects the fusion of autophagosomes with lysosomes.7 Defective fusion causes increased accumulation of autophagic vacuoles, leading to the death of cancer cells.8,9 In addition, lysosomes play an important role in mediating cancer drug resistance and may provide new ideas for overcoming drug resistance using lysosomal drug isolation approaches.10,11 Multiple organelle dysfunctions and non-canonical death are brought on by lysosome-targeted medication combinations in pancreatic cancer cells.12 Lysosomal activity and TFEB in hepatocytes are highly interdependent.13 The coordinated expression and regulation (CLEAR) network genes are downregulated as a result of abnormal TFEB nuclear localization, and lysosomal compartment malfunction severely inhibits the growth of tumor cells. In addition, abnormal TFEB nuclear localization also causes reduced lysosomal motility, which increases the effectiveness of sorafenib target sites and consequently enhances antitumor effects. This is important to note because most chemotherapeutic drugs, because of their hydrophobic and weak base chemistry, tend to be passively isolated within the acidic lumen of the lysosomes and are unable to reach their intracellular molecular targets.14 Vps34 controls lysosomal transport to prevent the tumor cells invasion in HCC.15 It has been noted that GNS561 alters lysosomal function to have anti-HCC effects.16 Lysosomal TRPML1 controls tumor cell mitochondrial activity to encourage HCC growth.17 For HCC patients receiving anti-cancer medication, the protein phosphatase 2A-B56-Drp1-Rab7 signaling axis controls the interaction between the mitochondria and lysosomes.18 Lysosomes may actively trigger tumor cell death when considered as a whole, which calls for more research.
There are yet insufficient pertinent investigations on the connection between lysosome-related genes and HCC prognosis since prior research has mostly concentrated on the function of lysosomes in human health and illness. In the current work, we developed and validated a predictive signature for HCC patients based on genes associated with the lysosome, and we also assessed the fundamental usefulness of this signature in the choice of treatment medicines.
Methods
Obtainment of TCGA, ICGC, and GTEx Datasets and Lysosome-Related Genes
RNA sequencing (RNA-seq) data from The Cancer Genome Atlas-LIHC cohort and the GTEx database from the UCSC Xena project (https://xenabrowser.net/) were merged to create a discovery cohort for identifying differentially expressed genes (DEGs) and building predictive models. After performing a log2 (FPKM+1) transformation to normalize the RNA-seq data, Combat from the “SVA” R package was used to correct the batch effects between the two datasets. Samples with incomplete survival data and those that survived for less than one month were removed. DEGs were eliminated using the cutoff values of |logFC| ≥1.5 and a P value of less than 0.05. The LIRI-JP cohort from the ICGC database (https://dcc.icgc.org/) served as the test cohort. We obtained tissues from 50 normal tissues and 59 HCC samples to further confirm the use of the signature in predicting the prognosis of HCC. A total of 628 HCC samples were included in this study, and Table S1 displays the clinical characteristics of HCC patients. Furthermore, a total of 894 lysosome-relevant genes were downloaded from the GO (Gene Ontology) database (https://geneontology.org/) and Gene Set Enrichment Analysis (GSEA) database (http://www.gsea-msigdb.org/).
Prognostic Model Construction and Validation
As we previously reported, the lysosome-relevant DEGs were evaluated to build a prognostic risk model by univariate Cox regression, LASSO-Cox regression, stepwise-Cox regression, and multivariate Cox regression.19  . HCC patients in the aforementioned two datasets were split into two subgroups, and the effects of the prognostic model were evaluated using the receiver operating characteristic (ROC) analysis, Kaplan-Meier survival analysis, and Cox relative risks relapse inquiry.
Genomic Variation Characterization and Functional Analysis
The R package “TCGAmutations” was used to download and analyze the mutation data of HCC patients to examine the variations in genetic alterations across the different groupings. GSEA was carried out to discover significantly altered HALLMARK, GO, and KEGG items.
Analysis of Immunological Checkpoint Genes and Immune Cell Infiltration
The stromal and immune scores in tumor tissue were calculated using the ESTIMATE package in the TCGA database.20 To further explore the variability in the TME, the abundance ratio of TIICs was assessed using the CIBERSORT,21 xCELL,22 MCPcounter,23 and TIMER24 databases. The TIDE (http://tide.dfci.harvard.edu/) database for predicting the response rate of HCC patients to immunotherapy. Last but not least, we assessed the changes in gene expression for PD1, PD-L1, CD276, CTLA4, LAG3, CXCR4, IL1A, IL6, TGFB1, TNFRSF4, TNFRSF9, and PD-L2 across distinct subgroups.
Analysis of the Sensitivity to Potential Therapeutic Drugs
In our risk model, the relationship between 216 medicines and mRNA molecules that were authorized by the CellMiner database was directly investigated.25 Drugs were classified as tumor-sensitive if their Pearson correlation coefficients were larger than 0.3 and their adjusted P-values were less than 0.001. Then, we compared the differences in half maximum inhibitory concentration (IC50) across different subgroups of tumor-sensitive drugs.
Evaluation of Gene Expression in Clinical Samples
We obtained tissues from 50 normal tissues and 59 HCC samples to further confirm the use of the signature in predicting the prognosis of HCC. We then utilized qRT-PCR to determine the expression of genes in the signature, as previously done.26 Sequences of primers were shown in Table S2. The sections were heated in citrate buffer for antigen retrieval after quenching endogenous peroxidase with 2% hydrogen peroxide and blocking with 5% bovine serum albumin (BSA, A602449, Sangon Biotech, China). After that, the slices were incubated at 4 °C for the duration of the evening with an isotype control and an anti-CRHBP (PA5-76099, Invitrogen) antibody. The sections were first washed with PBST (Phosphate Buffer Solution with Tween-20) and then progressively stained with DAB chromogen (A690009, Sangon Biotech, China). Two experienced pathologists evaluated the IHC data using single-blind and unified criteria methods, as previously described.27
Statistical Analysis
The chi-square test was used to analyze the qualitative data, while the grouped t-test or Mann-Whitney-Wilcoxon test was used to analyze the continuously distributed numerical data. To compare overall survival rates between groups, a Kaplan-Meier survival analysis was performed. To calculate the AUC values at 1, 2, and 3 years, ROC curves were made using the timeROC program. Univariate and multivariate Cox regression studies were done to see if the signature was a reliable prognostic predictor. The correlation analysis employed the Pearson or Spearman correlation test. When the P value was less than 0.05, the findings were deemed statistically significant.
Results
Identification of Lysosome-Related DEGs
The flow chat was shown in Figure S1. These lysosome-associated genes, as seen in Figure 1A, were able to discriminate clearly between normal and HCC tissue samples, indicating that lysosome-related genes played a significant role in the development of HCC. After batch effect removal, we filtered out 2169 DEGs from the TCGA-GTEx cohort (Figure 1B). The expression levels of the 113 lysosome-related DEGs that had been discovered (Figure 1C and D) were then shown.
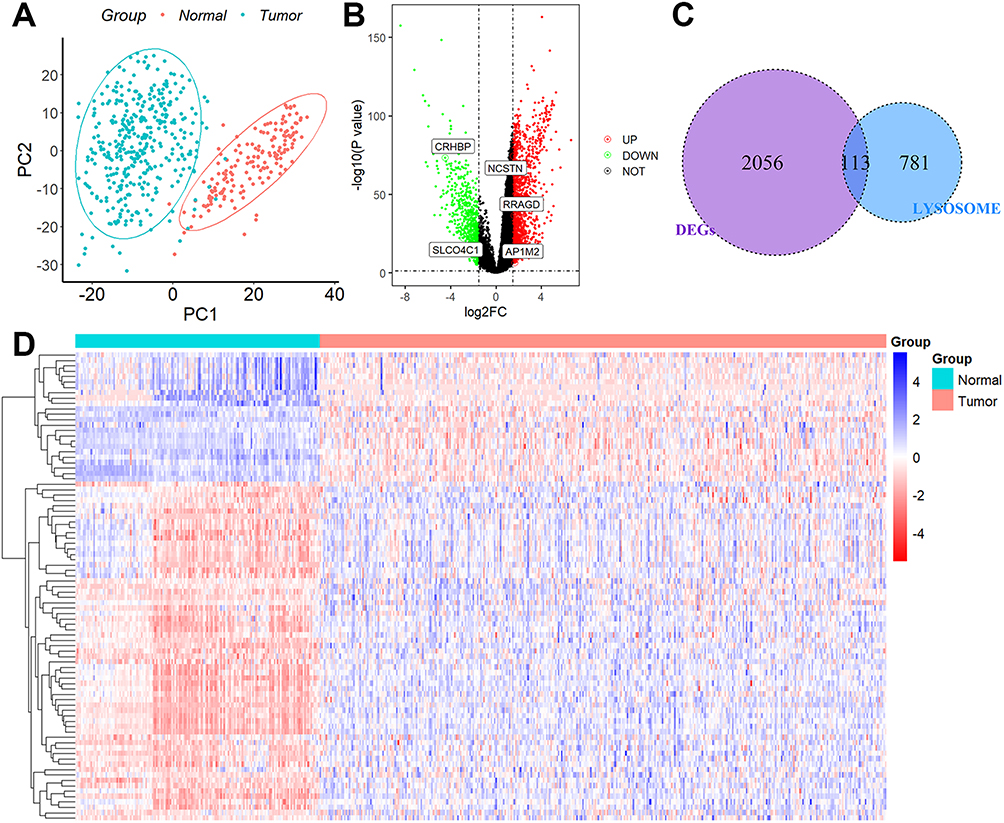 |
Figure 1 Identification of DEGs associated with lysosomes. (A) PCA assay. (B) DEGs between the 110 normal liver tissues and 421 HCC tissues. (C) 113 overlapping genes were identified as lysosome-related DEGs. (D) Heatmap of the expression levels of 113 lysosome-related DEGs in normal and tumor tissues. |
Creation of Subgroups Associated with Lysosomes
Twenty of the 113 lysosome-related DEGs were determined to be prognostic genes by the univariate Cox regression analysis (Figure 2A). The LASSO-Cox regression analysis was then used to examine these prognostic DEGs (Figure 2B), and 11 genes were screened out (Figure 2C). Finally, the stepwise and multivariate Cox regression was performed among the above 11 genes to build a five-gene prognostic model. Score = (0.22594783×RRAGD) + (0.07424310×AP1M2) - (0.14843547×CRHBP) + (0.42881435×NCSTN) + (0.09403647×SLCO4C1). Figure 2D displayed that HCC patients were divided into two groups with high- and low-risk scores. We discovered that the majority of lysosome-related genes were linked with the scores (Table S3) and patients with higher scores showed markedly worse survival rates (Figure 2E). This signature demonstrated strong predictive ability, with AUCs at 1-, 2-, and 3-year of 0.770, 0.681, and 0.692 (Figure 2F). Additionally, greater scores were connected to patient deaths, advanced grade stage, advanced TNM stage, T stage, high AFP value, vascular invasion, and relapses, but not to gender, age, or cirrhosis (Figure 3). This signature may be used as a stand-alone prognostic factor for HCC patients, according to results of univariable and multivariate Cox regression analysis (univariable HR=4.307, 95% CI 2.618–7.085, P = 8.96e-09; multivariate HR=3.150, 95% CI 1.917–5.175, P = 5.87e-06).
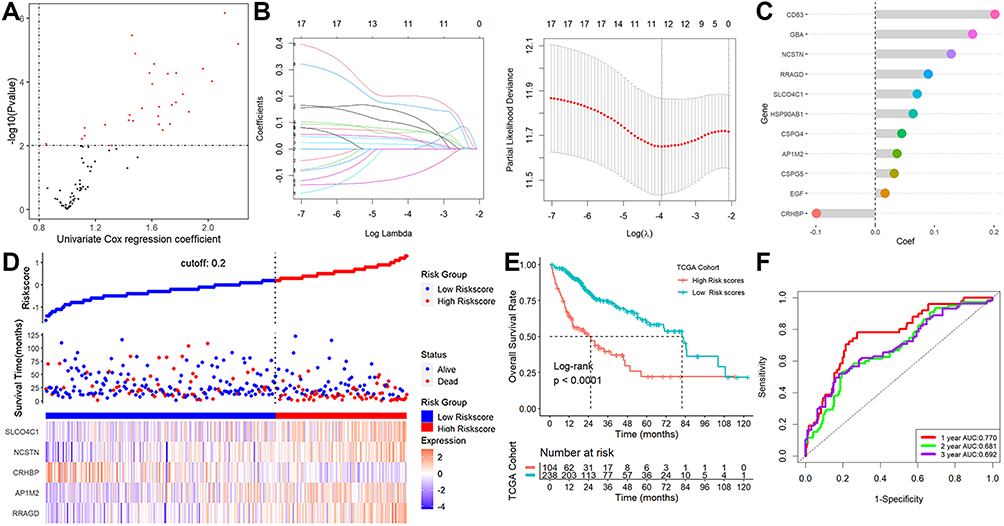 |
Figure 2 Establishment of a lysosome-related signature. (A) 20 of the 113 lysosome-related DEGs were calculated as prognostic genes. (B) LASSO-Cox regression analysis. (C) 11 genes were screened out. (D) The patient scores and their dispersion. (E) Patients with greater risk ratings showed markedly worse survival rates. (F) ROC analysis. |
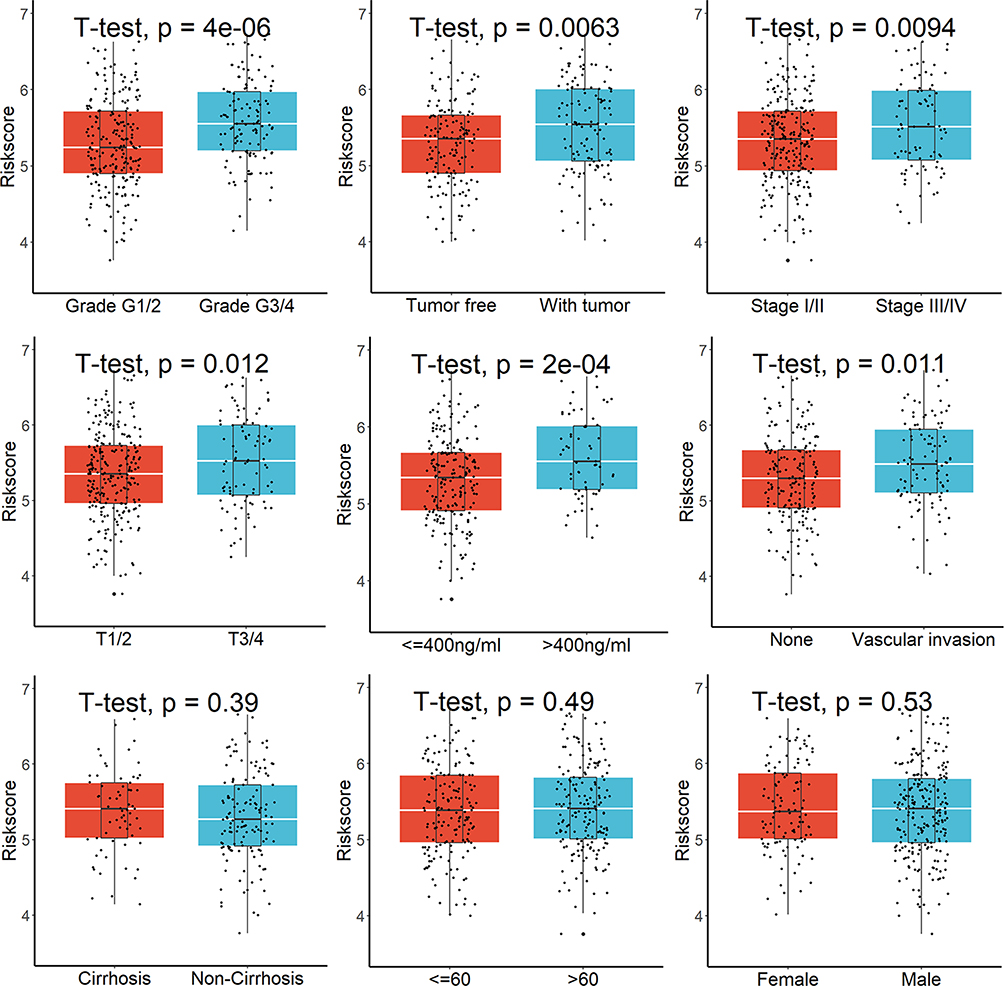 |
Figure 3 Greater risk scores were connected to patient deaths, advanced grades, advanced TNM stage, T stage, high AFP value, vascular invasion, and relapses, but not to gender, age, or cirrhosis. |
Verification of the Signature in the ICGC Cohort
In the ICGC cohort, patients were divided into high- or low-risk subgroups based on their risk scores (Figure 4A). The scores were considerably higher in patients who were deceased (Figure 4B) or had advanced TNM stages (Figure 4C). A Kaplan-Meier survival analysis showed a strong correlation between patients with higher risk scores and lower OS rates (Figure 4D), and a ROC analysis showed that this signature had strong prognostic performance, with AUCs at 1-, 2-, and 3-year of 0.715, 0.672, and 0.719 (Figure 4E). Furthermore, our predictive model may further distinguish between individuals with different TNM stages (Figure 4F). Finally, this signature may be used as a stand-alone prognostic factor for HCC patients, according to results of univariable and multivariate Cox regression analysis (univariable HR=5.039, 95% CI 2.121–11.970, P = 0.000249; multivariate HR=3.486, 95% CI 1.428–8.508, P = 0.00607).
 |
Figure 4 Verification of the signature in ICGC cohort. (A) The patient scores and their dispersion. (B and C) The scores were considerably higher in patients who were deceased or had advanced TNM stages. (D) Patients with greater risk ratings showed markedly worse survival rates. (E) ROC analysis. (F) Our predictive model may further distinguish between individuals with different TNM stages. |
Characterization of Genomic Variation and Prediction of ICB Response
According to the GSEA, affected HALLMARK, GO, and KEGG items were mostly involved in cell cycle-related activities (Figure S2). Genetic modification studies that concentrated on the significantly changed genes revealed that the mutation rates in the two groups were extremely dissimilar from one another (Figure 5A). Each HCC patient’s tumor mutational burden (TMB) value was examined (Figure 5B), and the results showed that patients with higher scores had higher TMB values, and those patients also had the lowest overall survival rates (Figure 5C). The TIDE analysis revealed that the TIDE and exclusion scores were considerably higher in the group with higher risk scores than in the group with lower risk scores, although the dysfunction scores had the reverse effect (Figure 5D). The proportion of “respond” was lower in the high-risk group when the anticipated response rate to immunotherapy was taken into account (Figure 5E). Finally, we found that patients with lower scores had greater levels of the genes PD-L1, PD-L2, CD4, and LL6 than patients with higher scores (Figure 5F), indicating that these ICIs may be more advantageous for patients with lower scores.
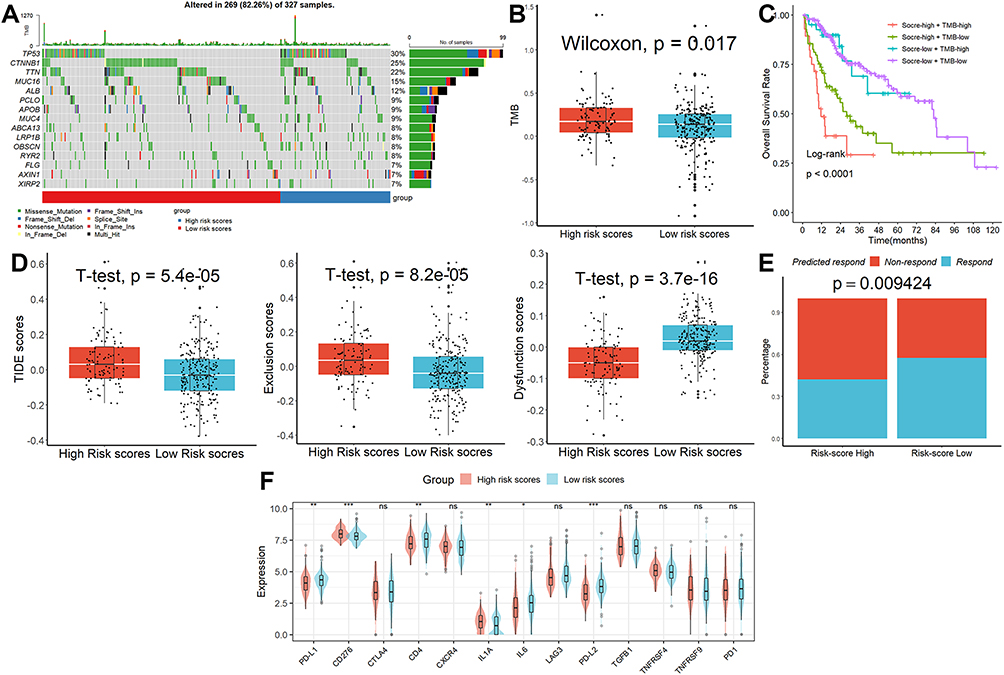 |
Figure 5 Characterization of genomic variation and prediction of ICB response. (A) The mutation rates in the two groups were extremely dissimilar from one another. (B) Patients in the high-risk category had higher TMB values. (C) Patients with high scores and high TMB values had the lowest overall survival rates. (D) The results of TIDE analysis. (E) The proportion of “respond” was lower in the high-risk group. (F) Patients with lower scores had greater levels of the genes PD-L1, PD-L2, CD4, and LL6 than patients with higher scores. ns, not significant; *p < 0.05; **p <0.01; ***p < 0.001. |
Correlation Analysis of the Five-Gene Biomarker and TME
Figure 6A shows that there is variability in the stromal, immune, and estimated scores of HCC patients in different risk groups, indicating some differences in TME between the two groups. Additionally, as depicted in Figure 6B, patients in the high-risk score group exhibited higher abundance levels of CD4 T cells, neutrophils, macrophages, and myeloid dendritic cells compared to patients with lower scores, whereas CD8 T cell abundance was lower. According to CIBERSORT (Figure 6C), patients with higher scores had higher numbers of Tregs and neutrophils when contrasted with those who had lower scores, whereas follicular helper T cells and macrophages. M0 cell abundance was lower. As demonstrated in Figure 6D, patients with higher scores exhibited greater abundance levels of monocyte and macrophage monocyte compared to patients with lower scores in the MCPcounter database. As determined by the xCELL database (Figure 6E), patients with higher scores had lower numbers of memory CD4 T cell, naïve CD4 T cell, effector memory CD4 T cell, naïve CD8 T cell, CD8 T cell, central memory CD8 T cell, common lymphoid progenitor, myeloid dendritic cell, endothelial cell, cancer-associated fibroblast, granulocyte monocyte progenitor, hematopoietic stem cell, macrophage M2, mast cell, and plasmacytoid dendritic cell when contrasted with those who had lower scores, whereas macrophage, NK T cell, and Th1 CD4 T cell was higher. When the four aforementioned algorithms are combined, patients with lower scores had more immune cell infiltrates in their TME, as seen in Table S4. Macrophages were the most prevalent kind of differential immune cell.
 |
Figure 6 Analysis of the signature’s and TME’s correlation. (A) There is variability in the stromal, immune, and estimated scores of HCC patients in different risk groups. Immune cell infiltration was analyzed by the TIMER (B), CIBERSORT (C), MCPcounter (D), and xCELL (E). ns, not significant; *p < 0.05; **p <0.01; ***p < 0.001. |
Development of a Nomogram Model and Investigation of the Possible Sensitivity to Therapeutic Drugs
A nomogram model was built to evaluate the effectiveness of this signature’s coefficient prediction. The results showed that the nomogram with a C-index of 0.801 may help in developing a precise quantitative method for predicting the 1-, 2-, and 3-year survival rates (Figure S3A). The likelihood of 1-, 2-, and 3-year survival rates predicted and actual overlap on the calibration curves showed good agreement (Figure S3B). In addition, we discovered 21 tumor-sensitive pharmaceuticals (Table S5), and the top 16 most significant tumor-sensitive medications were displayed in Figure 7A. As shown in Figure 7B, we also discovered that patients with higher scores had a lower IC50 for geldanamycin analogs, one of the 27 tumor-sensitive treatments, suggesting that patients with higher scores were more sensitive to geldanamycin analogs.
 |
Figure 7 Investigation of the possible sensitivity to therapeutic drugs. (A) The top 16 most significant tumor-sensitive medications target the signature. (B) Differential analysis of the IC50 of tumor-sensitive drugs. ns, not significant; *p < 0.05; **p <0.01; ***p < 0.001. |
Expression Levels of RRAGD, AP1M2, CRHBP, NCSTN, and SLCO4C1 in HCC
Using qRT-PCR methods, we initially investigated the five genes’ mRNA levels in clinical samples and discovered that only three genes (RRAGD, CRHBP, and NCSTN) showed differential expression in normal and HCC tissues (Figure 8A). The survival rate of patients with higher risk scores was lower than that of patients with lower risk scores when the expression of the three genes was substituted into the method to compute the risk score (Figure 8B). Additionally, there were noticeable variations in survival rates among HCC patients with various RRAGD, CRHBP, and NCSTN expression levels (Figure 8C). Then, using the human protein atlas database (HPA)28 to examine the protein expression of RRAGD, CRHBP, and NCSTN in normal and HCC tissues, we discovered that all of them had a differential expression except for RRAGD (Figure 8D). Finally, considering that only CRHBP was a protective gene, we subsequently verified its protein level by the immunohistochemistry technique and found that the protein level of CRHBP was down-regulated in HCC tissues compared to normal tissues, which was consistent with the above bioinformatics analysis (Figure 8E).
 |
Figure 8 Expression levels of RRAGD, AP1M2, CRHBP, NCSTN, and SLCO4C1 in HCC. (A) mRNA levels of the five lysosome-related genes. (B) The survival rate of patients with higher risk scores was lower than that of patients with lower risk scores when the expression of the three genes was substituted into the method to compute the risk score. (C) There were noticeable variations in survival rates among HCC patients with various RRAGD, CRHBP, and NCSTN expression levels. (D) The protein expression of RRAGD, CRHBP, and NCSTN in normal and HCC tissues was explored in the HPA database. (E) The protein level of CRHBP was down-regulated in HCC tissues compared to normal tissues by the IHC assay. ns, not significant; ***p < 0.001. |
Discussion
Since damage to the lysosomal membrane leads to the release of acidic hydrolases into the cytoplasm, causing indiscriminate degradation of cellular protein components and leading to cellular necrosis, there is growing evidence that lysosomes can be targeted for tumor immunotherapy.29 Fluvastatin can lead to breast cancer cell death by inhibiting mTORC1 signaling and promoting lysosomal depletion.9 Water-soluble yeast β-D-glucan (WSG) can cause lysosomal dysfunction by increasing lysosomal pH in HCC cells, ultimately leading to the activation of apoptotic signals and tumor cell death.30 Compound-induced lysosomal alkalinization also enhances the antitumor activity in colorectal cancer.31 Therefore, the use of natural or synthetic molecular drugs or gene therapy to modulate the integrity and stability of lysosomes and thus fight lysosome-specific tumors may become a big trend in the future.
In this study, after we found that these lysosome-associated genes can clearly distinguish between normal and HCC tissue samples, we constructed a 5-gene risk model that can accurately predict patient prognosis in the TCGA dataset and validated it in the ICGC dataset. To determine the prognostic effect of this prognosis in actual clinical practice, we performed qRT-PCR analysis on the collected 50 normal and 59 HCC tissues and found that three genes, RRAGD, CRHBP, and NCSTN, were differentially expressed. When the expression of the three genes was substituted into the method of calculating risk scores, the survival rate of patients with higher risk scores was lower than that of patients with lower risk scores. These demonstrate that the model we constructed also has better predictive results in the real world.
Corticotropin-releasing hormone binding protein (CRHBP) is a 37 kDa oligopeptide involved in the regulation of physiological responses and is widely expressed in a variety of human tissue types.32 CRHBP is involved in the progression of a variety of malignancies including lung,33 kidney,34 and ovarian cancers.35 In addition, CRHBP has an anti-HCC effect by regulating the expression of cell cycle-related proteins.36 In our study, we found that CRHBP could be involved in the prognostic regulation of HCC as a lysosome-associated protein with low expression in HCC tissues. Of course, more precise in vivo and ex vivo experiments are needed to validate the mechanism in the future.
An increasing amount of evidence suggests that TME plays a substantial role in the emergence and spread of HCC. Immune cells, stromal cells, endothelial cells, complex cytokine secretion, and fibroblasts are just a few of the cell types seen in TME that may have a role in tumor genesis, growth, and migration.37 When the results from the four algorithms TIMER, CIBERSORT, XCELL, and MCPcounter were combined, Macrophages showed up as the different immune cells between the high- and low-risk groupings, showing that the lysosome-related signature may influence macrophages abundance in TME to impair the prognosis of HCC. By inducing tumor-associated macrophage (TAMs) differentiation and altering the tumor microenvironment, PKM2 could promote the prognosis of HCC.38 TAMs can promote HCC metastasis by inhibiting the infiltration of tumor T cells.39 As the most abundant tumor-infiltrating leukocytes in TME, TAMs can be used as a target for lysosome-associated DNA nanodevices for tumor mitigation.40 Lysosome-targeted TAMs may be a new direction for immune cell-targeted immunotherapy in the future. We also looked at the differences in the expression levels of various immune checkpoint genes between high- and low-risk subgroups in light of the possibility that complex TME can lead to HCC cells developing resistance to immune checkpoint inhibitors (ICIs), which could affect the effectiveness of immunotherapy.41 The genes PD-L1, PD-L2, CD4, and LL6 were shown to be more prevalent in patients with lower scores than in individuals with higher scores. This finding suggests that these ICIs may be more helpful for patients with lower scores.
Finally, using the CellMiner database, we also obtained 27 tumor-sensitive medications that target this signature. With geldanamycin analogs having the lowest IC50 in patients with higher scores, it is clear that patients with higher scores were more sensitive to these geldanamycin analog medications. Geldanamycin analogs have been widely used in the treatment of a variety of tumors.42–44 Many hepatocellular carcinoma cell lines can be treated with geldanamycin analogs in combination with Hsp90 inhibitors to cause hepatocarcinogen breakdown, cell cycle arrest, and death.11 However, more experiments are needed to verify whether geldanamycin analogs can promote tumor cell death by targeting lysosomes in the future. The effectiveness of chemotherapeutic treatment for HCC patients unquestionably has certain restrictions. First, owing to patient variability, chemotherapy may be exceedingly ineffective or even inefficient for certain people. Second, the majority of chemotherapy medications are only suitable for local tumor injection. Therefore, ICIs may be a helpful addition to local treatment for HCC patients.45 On the one hand, by releasing tumor antigens that destroy tumor cells, local treatment can improve anti-tumor immunity. Yet, ICIs can improve the antitumor immune response brought on by local therapy. In the future, we anticipate finding an optimal combination treatment for HCC patients.
Despite previous comparable articles employing construct characteristics to predict the prognosis of HCC patients, our work still offers certain strengths. First, we used lysosome-related genes to assess the prognosis of HCC patients for the first time. Second, we used the TCGA and ICGC datasets, two freely accessible datasets, to successfully corroborate the signature. Finally, we looked at clinical tissue samples to corroborate the levels of gene expression that make up this signature. Of course, there are certain restrictions on our study. In the future, a sizable multicenter randomized controlled trial will be required to assess this signature. Future research on the particular processes of these five genes in HCC will require more in vivo and in vitro experiments.
Conclusion
The predictive features connected to lysosomal genes in HCC that we identified and verified, along with the confirmation of the down-regulation of CRHBP expression in clinical samples, may offer fresh perspectives for lysosomal gene-targeted immunotherapy.
Abbreviations
HCC, hepatocellular carcinoma; GSEA, Genome Enrichment Analysis; DEGs, differentially expressed genes; TME, tumor microenvironment; IHC, immunohistochemistry; TFEB, transcription factors including transcription factor EB; ROS, reactive oxygen species; FDA, Food and Drug Administration; HPA, human protein atlas; WSG, Water-soluble yeast β-D-glucan; CRHBP, Corticotropin-releasing hormone binding protein; TAMs, tumor-associated macrophage; ICIs, immune checkpoint inhibitors.
Data Sharing Statement
The datasets used and/or analyzed during the current study are available from the corresponding author upon reasonable request.
Ethics Approval and Consent to Participate
This study was supported by the Ethics Committees of Zhengzhou University. Written informed consent was obtained from all patients. All methods were performed following the relevant guidelines and regulations. The manuscript is consistent with the Declaration of Helsinki.
Acknowledgments
Junxiu Xu and Kai Zhang are co-first authors for this study.
Author Contributions
All authors made a significant contribution to the work reported, whether that is in the conception, study design, execution, acquisition of data, analysis and interpretation, or in all these areas; took part in drafting, revising or critically reviewing the article; gave final approval of the version to be published; have agreed on the journal to which the article has been submitted; and agree to be accountable for all aspects of the work.
Funding
There is no funding to report.
Disclosure
All authors declare no conflicts of interest in this work.
References
1. Song Q, Meng B, Xu H, Mao Z. The emerging roles of vacuolar-type ATPase-dependent lysosomal acidification in neurodegenerative diseases. Transl Neurodegener. 2020;9(1):17. doi:10.1186/s40035-020-00196-0
2. Mahapatra KK, Panigrahi DP, Praharaj PP, et al. Molecular interplay of autophagy and endocytosis in human health and diseases. Biol Rev Camb Philos Soc. 2019;94(4):1576–1590. doi:10.1111/brv.12515
3. Zhao B, Dierichs L, Gu JN, et al. TFEB-mediated lysosomal biogenesis and lysosomal drug sequestration confer resistance to MEK inhibition in pancreatic cancer. Cell Death Discov. 2020;6:12. doi:10.1038/s41420-020-0246-7
4. Di malta C, Cinque L, Settembre C. Transcriptional regulation of autophagy: mechanisms and diseases. Front Cell Dev Biol. 2019;7:114.
5. Aits S, Jäättelä M. Lysosomal cell death at a glance. J Cell Sci. 2013;126(Pt 9):1905–1912.
6. Domagala A, Fidyt K, Bobrowicz M, Stachura J, Szczygiel K, Firczuk M. Typical and atypical inducers of lysosomal cell death: a promising anticancer strategy. Int J Mol Sci. 2018;19(8):2256.
7. Jahreiss L, Menzies FM, Rubinsztein DC. The itinerary of autophagosomes: from peripheral formation to kiss-and-run fusion with lysosomes. Traffic. 2008;9(4):574–587.
8. Yang Y, Wang Q, Song D, et al. Lysosomal dysfunction and autophagy blockade contribute to autophagy-related cancer suppressing peptide-induced cytotoxic death of cervical cancer cells through the AMPK/mTOR pathway. J Exp Clin Cancer Res. 2020;39(1):197.
9. Elimam H, El-Say KM, Cybulsky AV, Khalil H. Regulation of autophagy progress via lysosomal depletion by fluvastatin nanoparticle treatment in breast cancer cells. ACS omega. 2020;5(25):15476–15486.
10. Zhitomirsky B, Assaraf YG. Lysosomes as mediators of drug resistance in cancer. Drug Resist Updat. 2016;24:23–33. doi:10.1016/j.drup.2015.11.004
11. Breinig M, Caldas-Lopes E, Goeppert B, et al. Targeting heat shock protein 90 with non-quinone inhibitors: a novel chemotherapeutic approach in human hepatocellular carcinoma. Hepatology. 2009;50(1):102–112. doi:10.1002/hep.22912
12. Suzuki S, Ogawa M, Miyazaki M, et al. Lysosome‑targeted drug combination induces multiple organelle dysfunctions and non‑canonical death in pancreatic cancer cells. Oncol Rep. 2022;47(2):1–20.
13. Ferro I, Gavini J, Gallo S, et al. The human vault RNA enhances tumorigenesis and chemoresistance through the lysosome in hepatocellular carcinoma. Autophagy. 2022;18(1):191–203. doi:10.1080/15548627.2021.1922983
14. Zhang Z, Yue P, Lu T, Wang Y, Wei Y, Wei X. Role of lysosomes in physiological activities, diseases, and therapy. J Hematol Oncol. 2021;14(1):79.
15. Qi C, Zou L, Wang S, et al. Vps34 inhibits hepatocellular carcinoma invasion by regulating endosome-lysosome trafficking via Rab7-RILP and Rab11. Cancer Res Treat. 2022;54(1):182–198. doi:10.4143/crt.2020.578
16. Brun S, Bestion E, Raymond E, et al. GNS561, a clinical-stage PPT1 inhibitor, is efficient against hepatocellular carcinoma via modulation of lysosomal functions. Autophagy. 2022;18(3):678–694. doi:10.1080/15548627.2021.1988357
17. Siow WX, Kabiri Y, Tang R, et al. Lysosomal TRPML1 regulates mitochondrial function in hepatocellular carcinoma cells. J Cell Sci. 2022;135(6). doi:10.1242/jcs.259455
18. Che L, Wu JS, Xu CY, et al. Protein phosphatase 2A-B56γ-Drp1-Rab7 signaling axis regulates mitochondria-lysosome crosstalk to sensitize the anti-cancer therapy of hepatocellular carcinoma. Biochem Pharmacol. 2022;202:115132. doi:10.1016/j.bcp.2022.115132
19. Zhang G. Platelet-related molecular subtype to predict prognosis in hepatocellular carcinoma. J Hepatocell Carcinoma. 2022;9:423–436. doi:10.2147/JHC.S363200
20. Yoshihara K, Shahmoradgoli M, Martínez E, et al. Inferring tumour purity and stromal and immune cell admixture from expression data. Nat Commun. 2013;4(1):2612. doi:10.1038/ncomms3612
21. Gentles AJ, Newman AM, Liu CL, et al. The prognostic landscape of genes and infiltrating immune cells across human cancers. Nat Med. 2015;21(8):938–945. doi:10.1038/nm.3909
22. Aran D, Hu Z, Butte AJ. xCell: digitally portraying the tissue cellular heterogeneity landscape. Genome Biol. 2017;18(1):220. doi:10.1186/s13059-017-1349-1
23. Zhu K, Xiaoqiang L, Deng W, Wang G, Fu B. Development and validation of a novel lipid metabolism-related gene prognostic signature and candidate drugs for patients with bladder cancer. Lipids Health Dis. 2021;20(1):146. doi:10.1186/s12944-021-01554-1
24. Li T, Fan J, Wang B, et al. A web server for comprehensive analysis of tumor-infiltrating immune cells. Cancer Res. 2017;77(21):e108–e110. doi:10.1158/0008-5472.CAN-17-0307
25. Reinhold WC, Sunshine M, Liu H, et al. CellMiner: a web-based suite of genomic and pharmacologic tools to explore transcript and drug patterns in the NCI-60 cell line set. Cancer Res. 2012;72(14):3499–3511. doi:10.1158/0008-5472.CAN-12-1370
26. Zhang G. Regulatory T-cells-related signature for identifying a prognostic subtype of hepatocellular carcinoma with an exhausted tumor microenvironment. Front Immunol. 2022;13:975762. doi:10.3389/fimmu.2022.975762
27. Zhang G, Lv X, Yang Q, Liu H. Identification of HM13 as a prognostic indicator and a predictive biomarker for immunotherapy in hepatocellular carcinoma. BMC Cancer. 2022;22(1):888. doi:10.1186/s12885-022-09987-2
28. Colwill K, Gräslund S. A roadmap to generate renewable protein binders to the human proteome. Nat Methods. 2011;8(7):551–558. doi:10.1038/nmeth.1607
29. Mondal B, Dutta T, Padhy A, Das S, Sen Gupta S. Lysosome-targeting strategy using polypeptides and chimeric molecules. ACS omega. 2022;7(1):5–16. doi:10.1021/acsomega.1c04771
30. Wang N, Liu H, Liu G, et al. Yeast β-D-glucan exerts antitumour activity in liver cancer through impairing autophagy and lysosomal function, promoting reactive oxygen species production and apoptosis. Redox Biol. 2020;32:101495. doi:10.1016/j.redox.2020.101495
31. Fu Y, Gu Q, Luo L, et al. New anti-cancer strategy to suppress colorectal cancer growth through inhibition of ATG4B and lysosome function. Cancers. 2020;12(6). doi:10.3390/cancers12061523
32. Ketchesin KD, Stinnett GS, Seasholtz AF. Corticotropin-releasing hormone-binding protein and stress: from invertebrates to humans. Stress. 2017;20(5):449–464. doi:10.1080/10253890.2017.1322575
33. Deng F, Shen L, Wang H, Zhang L. Classify multicategory outcome in patients with lung adenocarcinoma using clinical, transcriptomic and clinico-transcriptomic data: machine learning versus multinomial models. Am J Cancer Res. 2020;10(12):4624–4639.
34. Yang K, Xiao Y, Xu T, et al. Integrative analysis reveals CRHBP inhibits renal cell carcinoma progression by regulating inflammation and apoptosis. Cancer Gene Ther. 2020;27(7–8):607–618.
35. Wang Y, Lei L, Chi YG, Liu LB, Yang BP. A comprehensive understanding of ovarian carcinoma survival prognosis by novel biomarkers. Eur Rev Med Pharmacol Sci. 2019;23(19):8257–8264.
36. Wang Z, Li M, Liu Y, et al. CRHBP is degraded via autophagy and exerts anti-hepatocellular carcinoma effects by reducing cyclin B2 expression and dissociating cyclin B2-CDK1 complex. Cancer Gene Ther. 2022;29(8–9):1217–1227.
37. Hinshaw DC, Shevde LA. The tumor microenvironment innately modulates cancer progression. Cancer Res. 2019;79(18):4557–4566.
38. Hou PP, Luo LJ, Chen HZ, et al. Ectosomal PKM2 promotes HCC by inducing macrophage differentiation and remodeling the tumor microenvironment. Mol Cell. 2020;78(6):1192–1206.e1110.
39. Wu L, Zhang X, Zheng L, et al. RIPK3 orchestrates fatty acid metabolism in tumor-associated macrophages and hepatocarcinogenesis. Cancer Immunol Res. 2020;8(5):710–721.
40. Cui C, Chakraborty K, Tang XA, et al. A lysosome-targeted DNA nanodevice selectively targets macrophages to attenuate tumours. Nat Nanotechnol. 2021;16(12):1394–1402.
41. Carbone C, Piro G, Agostini A, et al. Intratumoral injection of TLR9 agonist promotes an immunopermissive microenvironment transition and causes cooperative antitumor activity in combination with anti-PD1 in pancreatic cancer. J Immunother Cancer. 2021;9:9.
42. Li YP, Chen JJ, Shen JJ, et al. Synthesis and biological evaluation of geldanamycin analogs against human cancer cells. Cancer Chemother Pharmacol. 2015;75(4):773–782.
43. Zhang Z, Li HM, Zhou C, et al. Non-benzoquinone geldanamycin analogs trigger various forms of death in human breast cancer cells. J Exp Clin Cancer Res. 2016;35(1):149.
44. Xie Y, Guo L, Huang J, et al. Cyclopentenone-containing tetrahydroquinoline and geldanamycin alkaloids from streptomyces malaysiensis as potential anti-androgens against prostate cancer cells. J Nat Prod. 2021;84(7):2004–2011.
45. Xing R, Gao J, Cui Q, Wang Q. Strategies to improve the antitumor effect of immunotherapy for hepatocellular carcinoma. Front Immunol. 2021;12:783236.
 © 2023 The Author(s). This work is published and licensed by Dove Medical Press Limited. The
full terms of this license are available at https://www.dovepress.com/terms
and incorporate the Creative Commons Attribution
- Non Commercial (unported, 3.0) License.
By accessing the work you hereby accept the Terms. Non-commercial uses of the work are permitted
without any further permission from Dove Medical Press Limited, provided the work is properly
attributed. For permission for commercial use of this work, please see paragraphs 4.2 and 5 of our Terms.
© 2023 The Author(s). This work is published and licensed by Dove Medical Press Limited. The
full terms of this license are available at https://www.dovepress.com/terms
and incorporate the Creative Commons Attribution
- Non Commercial (unported, 3.0) License.
By accessing the work you hereby accept the Terms. Non-commercial uses of the work are permitted
without any further permission from Dove Medical Press Limited, provided the work is properly
attributed. For permission for commercial use of this work, please see paragraphs 4.2 and 5 of our Terms.
Recommended articles
Platelet-Related Molecular Subtype to Predict Prognosis in Hepatocellular Carcinoma
Zhang G
Journal of Hepatocellular Carcinoma 2022, 9:423-436
Published Date: 19 May 2022
Identification of a Novel Pyroptosis-Related Gene Signature Indicative of Disease Prognosis and Treatment Response in Skin Cutaneous Melanoma
Li AA, Zhang Y, Tong WL, Chen JW, Huang SH, Liu JM, Liu ZL
International Journal of General Medicine 2022, 15:6145-6163
Published Date: 12 July 2022
Systemic Inflammation Score Using Pretherapeutic Inflammatory Markers to Predict Prognosis for Hepatocellular Carcinoma Patients After Hepatic Arterial Infusion Chemotherapy
Wu T, Zheng Z, Wang J, He M, Wang J, Pan Y, Chen J, Hu D, Zhang Y, Xu L, Chen M, Zhou Z
Journal of Hepatocellular Carcinoma 2023, 10:2133-2145
Published Date: 1 December 2023
A Hypoxia-Related miRNA-mRNA Signature for Predicting the Response and Prognosis of Transcatheter Arterial Chemoembolization in Hepatocellular Carcinoma
Zong S, Huang G, Pan B, Zhao S, Ling C, Cheng B
Journal of Hepatocellular Carcinoma 2024, 11:525-542
Published Date: 12 March 2024
scRNA-Seq Analysis Revealed CAFs Regulating HCC Cells via PTN Signaling
Lin W, Tang L, Zhuo C, Mao X, Shen J, Huang S, Li S, Qin Y, Liao J, Chen Y, Zhang X, Li Y, Song J, Meng L, Dong X, Li Y
Journal of Hepatocellular Carcinoma 2024, 11:2269-2281
Published Date: 18 November 2024