Back to Journals » Journal of Hepatocellular Carcinoma » Volume 10
Systemic Inflammation Score Using Pretherapeutic Inflammatory Markers to Predict Prognosis for Hepatocellular Carcinoma Patients After Hepatic Arterial Infusion Chemotherapy
Authors Wu T ![]() , Zheng Z
, Zheng Z ![]() , Wang J, He M, Wang J, Pan Y
, Wang J, He M, Wang J, Pan Y ![]() , Chen J
, Chen J ![]() , Hu D, Zhang Y
, Hu D, Zhang Y ![]() , Xu L
, Xu L ![]() , Chen M, Zhou Z
, Chen M, Zhou Z
Received 27 August 2023
Accepted for publication 14 November 2023
Published 1 December 2023 Volume 2023:10 Pages 2133—2145
DOI https://doi.org/10.2147/JHC.S437329
Checked for plagiarism Yes
Review by Single anonymous peer review
Peer reviewer comments 4
Editor who approved publication: Prof. Dr. Imam Waked
Tianqing Wu,1,2,* Zhikai Zheng,1,2,* Jiongliang Wang,1,2,* Minrui He,1,2,* Juncheng Wang,1,2 Yangxun Pan,1,2 Jinbin Chen,1,2 Dandan Hu,1,2 Yaojun Zhang,1,2 Li Xu,1,2 Minshan Chen,1,2 Zhongguo Zhou1,2
1State Key Laboratory of Oncology in South China, Guangdong Provincial Clinical Research Center for Cancer, Sun Yat-sen University Cancer Center, Guangzhou, 510060, People’s Republic of China; 2Department of Liver Surgery, Sun Yat-sen University Cancer Center, Guangzhou, Guangdong, 510060, People’s Republic of China
*These authors contributed equally to this work
Correspondence: Zhongguo Zhou, Department of Liver Surgery, Sun Yat-sen University Cancer Center, State Key Laboratory of Oncology in South China, Dongfeng Road East 651, Guangzhou, Guangdong, 510060, People’s Republic of China, Email [email protected]
Purpose: To assess the clinical value of the pretherapeutic systemic inflammation score (SIS) in predicting the prognosis of hepatocellular carcinoma (HCC) after hepatic arterial infusion chemotherapy (HAIC).
Methods: From February 2016 to April 2021, 415 advanced HCC patients who underwent HAIC at Sun Yat-sen University Cancer Center were randomly divided into training (n = 277) and validation cohorts (n = 138) and analyzed. The aspartate aminotransferase–alanine aminotransferase ratio (AAR), lymphocyte × albumin (L × A), and neutrophil × monocyte (N × M) were used to construct the SIS score based on a multivariate Cox analysis in the training cohort. A nomogram consisting of the SIS score was created and evaluated by calibration plot, areas under the receiver operating characteristic (AUC) curve, and decision curve analysis (DCA).
Results: Univariate and multivariate Cox analyses revealed that the SIS score was an independent predictor of OS. A high SIS score was associated with large tumor size (P < 0.05), multiple lesions (P < 0.01), high AFP level (P < 0.01), extrahepatic metastasis (P < 0.05), and advanced BCLC stage (P < 0.01). Kaplan–Meier analysis showed that the patients with a high SIS had shorter OS than those with a low SIS in both the non-PD (p = 0.015) and PD group (p = 0.023). The calibration plots showed good concordance between the nomogram’s prediction and the actual observations in both the training and validation cohorts. In the training cohort, the AUCs of the nomogram predicting the 2-year and 3-year survival rates were 0.749 and 0.739, respectively; in the validation cohort, they were 0.760 and 0.681, respectively. Based on the AUC and DCA, the nomogram showed better predictive ability than other predictors.
Conclusion: The pretherapeutic SIS score is a potential prognostic predictor for HCC patients undergoing HAIC.
Keywords: HCC, systemic inflammation score, nomogram, prognosis
Introduction
Hepatocellular carcinoma (HCC) is a leading cause of cancer deaths worldwide. It ranks as the sixth most common malignant tumor and the third leading cause of cancer-related mortality.1 However, with the development of surveillance programs, nearly half of HCC patients are diagnosed with advanced HCC with extrahepatic metastasis or vascular invasion.2 Sorafenib or lenvatinib is the standard systemic therapy for advanced HCC and has been reported to be effective.3,4 However, the prognosis of these patients remains poor, with a median survival time of 6.4–11.5 months and a response rate of 2.3–9.3%.5–8
Immunotherapy has been an effective treatment in several malignancies.9 Based on the IMbrave150 trail, atezolizumab plus bevacizumab showed good efficacy in unresectable HCC patients.10 Although immune checkpoint inhibitors have revolutionized the treatment landscape of HCC, a response rate of 13.7–20% is still unsatisfactory.11,12 In recent years, hepatic arterial infusion chemotherapy (HAIC) has been demonstrated to improve the prognosis of advanced HCC patients. Compared to systemic therapy, HAIC showed better efficacy and good tolerance with a response rate of 28.6–29.4% by infusing drugs into tumors via the hepatic artery, which contributes to higher local concentrations of drugs and lower peripheral concentrations.13,14 Moreover, Li et al revealed that HAIC is superior to the traditional interventional treatment, transcatheter chemoembolization (TACE), with a longer median progression-free survival time of 9.6 months.15 Although HAIC has been shown to be an effective treatment, 13–34.8% of HCC patients are still resistant to HAIC.15,16 Hence, it is essential to develop a simple and reliable indicator for identifying HAIC-sensitive populations and predicting prognosis in HCC patients after HAIC.
Inflammation plays an important role in the tumor microenvironment.17 Several studies have shown that the systemic inflammatory response is involved in tumor development.18,19 Oxaliplatin and 5-fluorouracil, which are infused via hepatic artery in the process of HAIC in our center, have been demonstrated to be associated with inflammation.20–22 Besides, inflammation-related factors, such as the neutrophil-to-lymphocyte ratio (NLR), platelet-to-lymphocyte ratio (PLR) and aspartate transaminase to aminotransferase ratio (AAR), have been suggested to predict the prognosis of HCC patients.23,24 However, few studies have developed a system that combines these indicators for prognostic prediction in HCC patients after HAIC. Therefore, establishing a comprehensive, easy-to-use tool to predict the OS of HCC patients after HAIC is necessary. The aim of this study is to formulate a simple and reliable predictive model in HCC patients which can serve as a valuable decision-making tool for clinicians.
Materials and Methods
Patients and Clinical Data
From February 2016 to April 2021, the clinical records of 415 patients with primary HCC were collected retrospectively at Sun Yat-sen University Cancer Center (SYSUCC). All patients had received HAIC. The clinical characteristics, liver function tests and hematological markers were recorded before the first HAIC. The inclusion criteria were as follows: (1) patients who underwent HAIC only without receiving any other therapy; (2) patients who were diagnosed with HCC clinically or pathologically; (3) patients with complete clinical and follow-up data; and (4) Child‒Pugh classification A or B. In addition, patients were excluded if they met the following exclusion criteria: (1) received surgery, TACE, immunotherapy, targeted therapy, or immunotherapy during follow-up; (2) diagnosed with intrahepatic cholangiocarcinoma or combined hepatocellular and intrahepatic cholangiocarcinoma; (3) had missing clinical data; and (4) Child‒Pugh C. The tumor stage was evaluated according to the BCLC staging system. The study protocol was approved by the Clinical Research Ethics Committee of Sun Yat-sen University Cancer Center (SYSUCC, Guangzhou, China) and all patients provided written informed consent (Ethical review no. B2022-238-01).
Clinical data, including age, sex, hepatitis B surface antigen (HBsAg), total bilirubin, alanine aminotransferase (ALT), aspartate transaminase (AST), albumin (ALB), alpha-fetoprotein (AFP), protein induced by vitamin K absence/antagonist-II (PIVKA-II), white blood cell (WBC), neutrophil (NE), lymphocyte (LY), monocyte (MO), platelet (PLT), C-reactive protein (CRP), Child‒Pugh classifications, Barcelona Clinic Liver Cancer (BCLC) stage, liver cirrhosis, times of HAIC, tumor size, tumor number, tumor vascular invasion, and tumor metastasis, were collected. The lab test data were collected within five days before HAIC.
The NE to LY ratio (NLR), PLT to LY ratio (PLR), LY to CRP ratio (LCR), LY to MO ratio (LMR), CRP to ALB ratio (CAR), AST to ALT ratio (AAR), AST to LY ratio (ALR), NE to ALB ratio (NAR), NE to MO ratio (NMR), MO to ALB ratio (MAR), PLT to ALB ratio (PAR), NE × MO (N × M), NE × PLT (N × P), NE × CRP (N × C), MO × PLT (M × P), MO × CRP (M×C), PLT × CRP (P × C), and LY × ALB (L × A) were calculated, where NE, LY, PLT, MO, CRP, ALB, AST, and ALT represent the neutrophil counts (109/L), lymphocyte counts (109/L), platelet counts (109/L), monocyte count (109/L), C-reactive protein concentration (mg/L), albumin concentration (g/L), aspartate transaminase concentration (U/L), and aminotransferase concentration (U/L), respectively. The best cutoff value of inflammation-related indicators was identified using the surv_cutpoint function of survminer using overall survival as the target variable (Supplemental Figure 1). The cutoff values were as follows: NLR (2.01), PLR (154.50), LCR (0.35), LMR (3.83), CAR (0.07), AAR (0.83), ALR (32.76), NAR (0.14), MAR (0.01), PAR (6.57), N × M (4.32), N × P (1250.20), N × C (20.41), M × P (136.00), M × C (0.82), P × C (317.24), and L × A (40.05).
Treatments
Unlike the traditional HAIC infusing epirubicin or cisplatin, our center conducted FOLFOX-HAIC, which was performed every 3 weeks, and the process was described as follows: a catheter/microcatheter was placed in the major supplying hepatic artery, and then the following regimen was infused via the hepatic artery: oxaliplatin 85 mg/m2 from hour 0 to 2 on day 1; leucovorin 400 mg/m2 from hour 2 to 3 on day 1; 5-fluorouracil 400 mg/m2 bolus at hour 3; and 2400 mg/m2 over 46 h on days 1 and 2. The following HAIC refers to FOLFOX-HAIC.
Follow-Up and Data
Patients were followed after two HAIC procedures. When HAIC was completed, patients were followed every 3 months up to 2 years and every 6 months until 5 years. Regular examination included dynamic computed tomography scans and magnetic resonance imaging, routine blood tests, liver function and tumor markers. Overall survival was defined as the time interval between the date of first HAIC to the date of death or the last follow-up time. The treatment response was evaluated according to RECIST version 1.1. The median follow-up time was 39.1 months, and the last follow-up date was December 13, 2022.
Statistical Analysis
We performed all statistical analyses with R software (version 4.2.2; https://www.r-project.org/). Student’s t-test was used for continuous variables with a normal distribution, and the Mann‒Whitney U-test was used for variables with an abnormal distribution. Categorical variables were compared using the chi-square test or Fisher’s exact test. According to the cutoff value, we defined the index of hematological markers below the cutoff value as 0 and those above the cutoff value as 1. OS curves were described using the Kaplan–Meier method and compared using the Log rank test. Continuous variables were transformed to categorical variables for univariate analysis, and the factors related to survival in the univariate analysis were then incorporated into the multivariate Cox regression analysis to identify independent prognostic factors. Three inflammation-related indicators (AAR, N × M, and L × A) for SIS were significantly associated with OS. The SIS score was calculated by the formula SIS score = sum (each status of hematological index * corresponding regression coefficient). Patients were divided into SIS-low and SIS-high groups according to the median value of the SIS score. All reported P values are two-sided, and P < 0.05 was regarded as significant.
Nomogram
All enrolled patients were randomly divided into a training cohort or validation cohort in a 2:1 ratio. After significant factors related to OS in the training cohort were identified by multivariate Cox regression analyses (P < 0.05), a nomogram for predicting the 2- and 3-year OS was constructed using the rms package in R (version 4.2.2; http://www.r-project.org/). Receiver operating characteristic (ROC) curves, the area under the curve (AUC) and decision-curve analysis (DCA) were used to analyze the performance of the nomogram to predict OS.
Results
Clinical Characteristics of Training and Validation Cohorts
In total, 415 patients who underwent HAIC for primary HCC were included in this study. For nomogram construction and validation, we randomly assigned patients into the training cohort (n = 277) or validation cohort (n = 138). The clinical characteristics of the training cohort and validation cohort are summarized in Table 1. For the overall cohort, 87.71% of the patients were male, the mean age was 50.75 ± 12.09 years, 94.22% of patients were classified as Child–Pugh class A, 90.36% of patients were HBsAg-positive, and 46.02% of patients were diagnosed with liver cirrhosis. The median AFP and PIVKA-II levels were 1814.00 (44.38–52,483.00) ng/mL and 11,274.00 (1185.50–45,069.50) mAU/mL, respectively. The proportion of patients with vascular invasion was 56.14%, and that of extrahepatic metastasis was 25.78%. The majority of patients had BCLC stage C HCC (65.06). A total of 62.17% of patients had multiple lesions, and the median size of the maximum tumor was 10.40 (8.20–13.15) cm. All patients underwent HAIC only, and 31.33% of patients experienced HAIC more than 3 times. There were no significant differences in clinical characteristics between the training and validation cohorts (Table 1).
 |
Table 1 Baseline Characteristics for the Training and Validation Cohorts of HCC Patients Who Underwent HAIC |
Construction of the Systemic Inflammation Score
The univariate Cox analysis revealed that NLR, PLR, CAR, NAR, MAR, PAR, N × M, N × P, N × C, M × P, M × C, P × C, AAR, and ALR (p < 0.05), along with reduced LCR, LMR and L × A (p < 0.05), were significant prognostic factors for OS (Figure 1a). However, in the multivariate analysis, only AAR, N × M and L × A were identified as independent predictors for OS (p < 0.05) (Figure 1b). Therefore, the SIS score was constructed based on AAR, N × M, L × A and their corresponding regression coefficient in the training group. The formula for the SIS score is SIS = 0.385*AAR + 0.697*N × M – 0.612*L × A (Figure 1c). The median SIS was −0.227, patients with scores lower than −0.227 being divided into the SIS-low group, and those with scores greater than −0.227 being divided into the SIS-high group. Kaplan–Meier estimates of OS in the training and validation cohorts are presented in Figure 1d and e. Patients with a high SIS had a worse prognosis than patients with a low SIS in both the training (p = 0.01) and validation cohorts (p < 0.01).
 |
Figure 1 SIS is associated with OS in patients with hepatocellular carcinoma. (a and b) Univariate Cox regression analysis (a) and multivariate Cox regression analysis (b) between blood indicators and overall survival in the training cohort. The indicators with statistical significance (p < 0.05) are presented in bold text. (c) The calculation formula of SIS. (d and e) Kaplan–Meier estimates of overall survival in the training cohort (d) and the validation cohort (e) of patients in the low- and high- SIS groups. Abbreviations: NLR, neutrophil-to-lymphocyte ratio; PLR, platelet-to-lymphocyte ratio; LCR, lymphocyte to C-reactive protein ratio; LMR, lymphocyte-to-monocyte ratio; CAR, C-reactive protein-to-albumin ratio; AAR, aspartate transaminase to alanine aminotransferase ratio; ALR, aspartate aminotransferase-to-lymphocyte ratio; NAR, neutrophil-to-albumin ratio; MAR, monocyte-to-albumin ratio; PAR, platelet-to-albumin ratio; N × M, neutrophil × monocyte; N × P, neutrophil × platelet; N × C, neutrophil × C-reactive protein; M × P, monocyte × platelet; M × C, monocyte × C-reactive protein; P × C, platelet × C-reactive protein; L × A, lymphocyte × albumin. |
Independent Prognostic Factors for HCC
The variables listed in Table 1 were used for univariate Cox analysis, and the results are shown in Table 2. In the univariate analysis, extrahepatic metastasis (p = 0.023), vascular invasion (p = 0.015), tumor size (p < 0.001), SIS (p = 0.014), BCLC stage (p = 0.021), ALB (p = 0.021), and TBIL (p = 0.044), and AFP (p < 0.001) were associated with OS. The multivariate analyses showed that extrahepatic metastasis (hazard ratio [HR], 1.521; 95% confidence interval [CI] 1.025–2.260; p = 0.037), vascular invasion (HR, 2.017; 95% CI 1.150–3.540; p = 0.014), tumor size (HR, 1.671; 95% CI 1.258–2.220; p < 0.001), SIS (HR, 1.579; 95% CI 1.018–2.450; p = 0.042), and AFP (HR, 1.506; 95% CI 1.132–2.000; p = 0.005) were independent risk factors for OS.
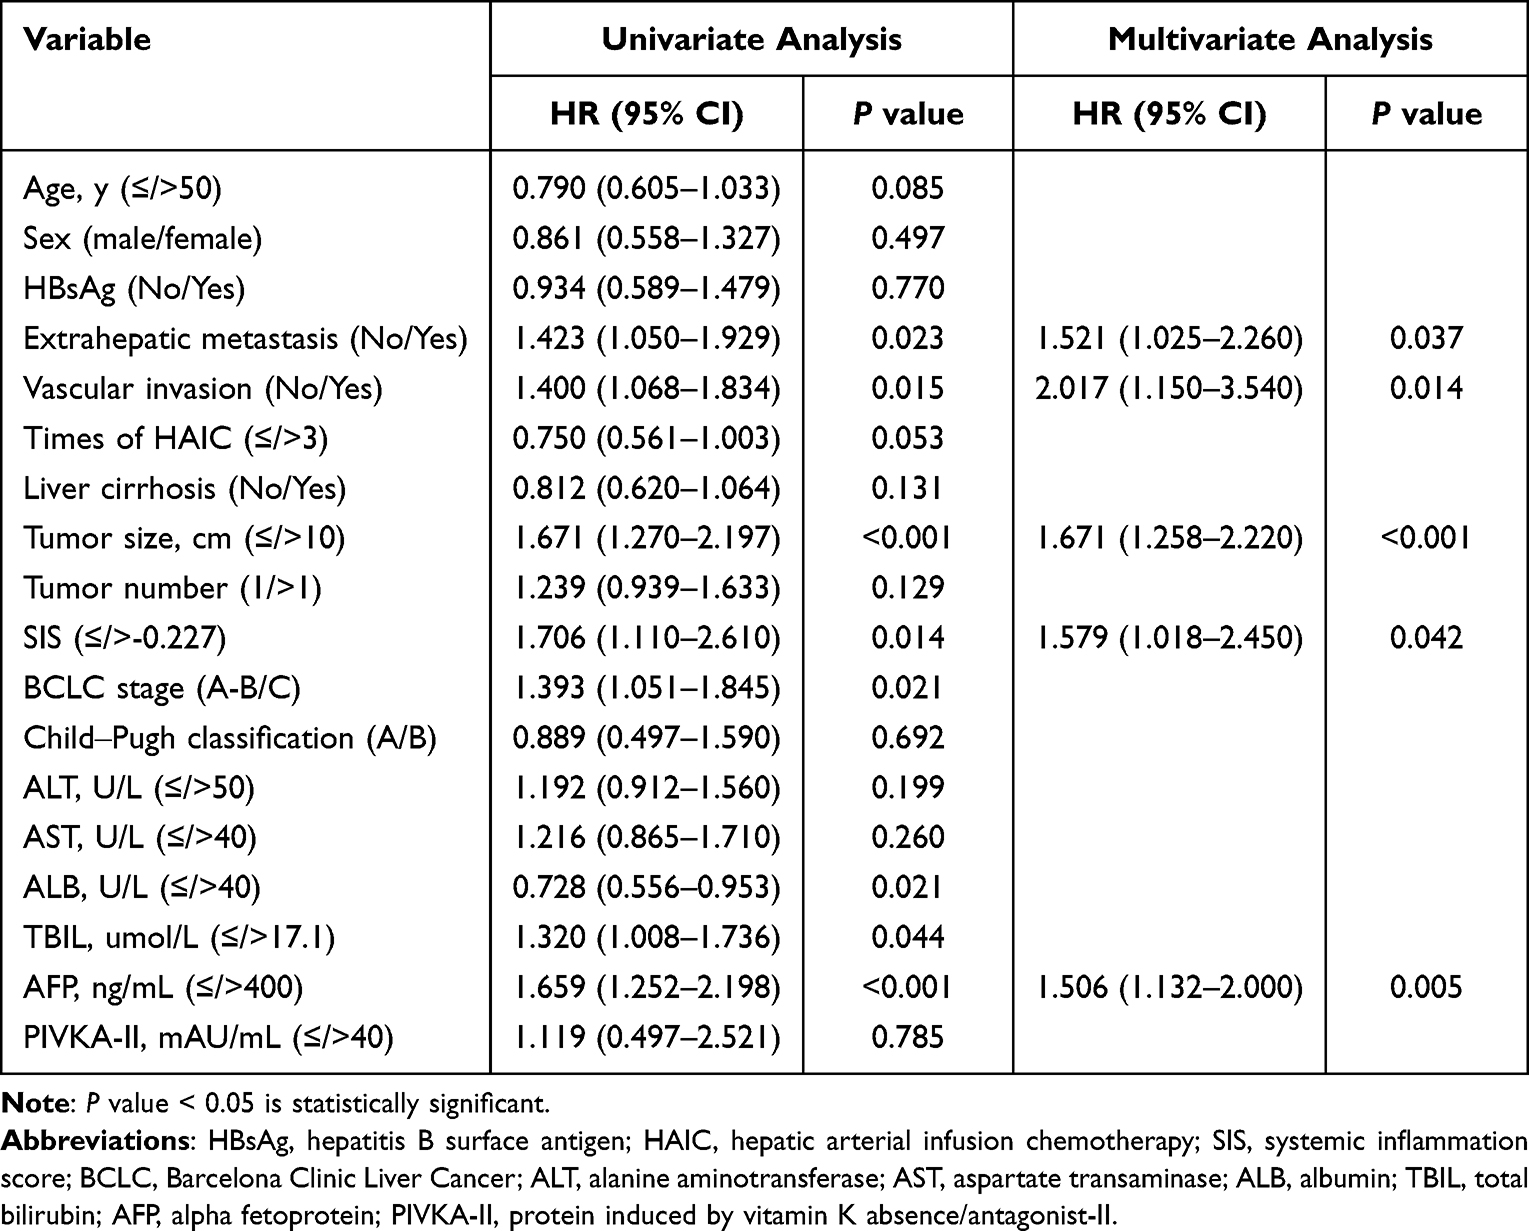 |
Table 2 Cox Regression Analysis for OS Among Clinical Characteristics and SIS in the Training Cohort |
Correlations Between the SIS and Clinical Characteristics
We performed a further analysis to recognize the association between SIS and the clinical characteristics (Table 3). Compared with the SIS-low group, patients in the SIS-high group had a larger tumor size (58.67% vs 40.00%, p < 0.001), a higher proportion of metastasis (29.67% vs 15.65%, p = 0.003), more lesions (65.67% vs 53.04%, p = 0.018) and a more advanced BCLC stage (69.33% vs 53.91%, p < 0.001). Therefore, patients with high SIS scores were more likely to have poor prognoses.
 |
Table 3 Relationship Between SIS and Clinical Characteristics |
Association Between SIS and OS in Different Response to HAIC
According to treatment response, patients were divided into the non-PD and PD group. Among the 116 patients in the non-PD group, 46 were defined as partial response (PR) and 70 were defined as stable disease (SD). There are 115 patients defined as progressive disease (PD) in the PD group. Kaplan–Meier estimates of OS in the non-PD and PD group are presented in Supplemental Figure 1. Patients with a high SIS had a worse prognosis than patients with a low SIS in both the non-PD (p = 0.015) and PD group (p = 0.023).
Development and Validation of the Nomogram
The nomogram that integrated the SIS and other independent prognostic factors for OS prediction is presented in Figure 2 and the web-based tool is available at https://nomoforhaic.shinyapps.io/DynNomapp/. The calibration curves for 2-year and 3-year OS suggested acceptable agreements between the nomogram and actual observation in both the training and validation cohorts (Figure 3). To further assess the accuracy of the nomogram, ROC analysis was performed. The AUCs of the nomogram predicting the 2-year and 3-year survival rates were 0.749 and 0.739 in the training cohort, respectively (Figure 4a); in the validation cohort, they were 0.760 and 0.681, respectively (Figure 4b). In addition, when compared with metastasis, AFP, SIS, tumor size, BCLC stage and vascular invasion, the nomogram showed the best ability to predict 2-year and 3-year OS in both the training and validation cohorts (Figure 4c–f). Finally, DCA demonstrated that the SIS-based nomogram had a higher net benefit in predicting 2-year and 3-year OS (Figure 5a–d).
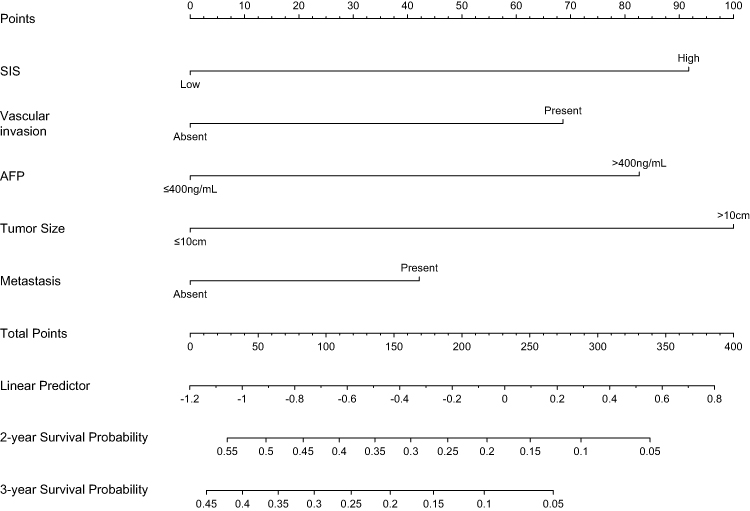 |
Figure 2 Nomogram depicting 2- and 3-year overall survival probability for patients with hepatocellular carcinoma. Abbreviations: SIS, systemic inflammation score; AFP, alpha fetoprotein. |
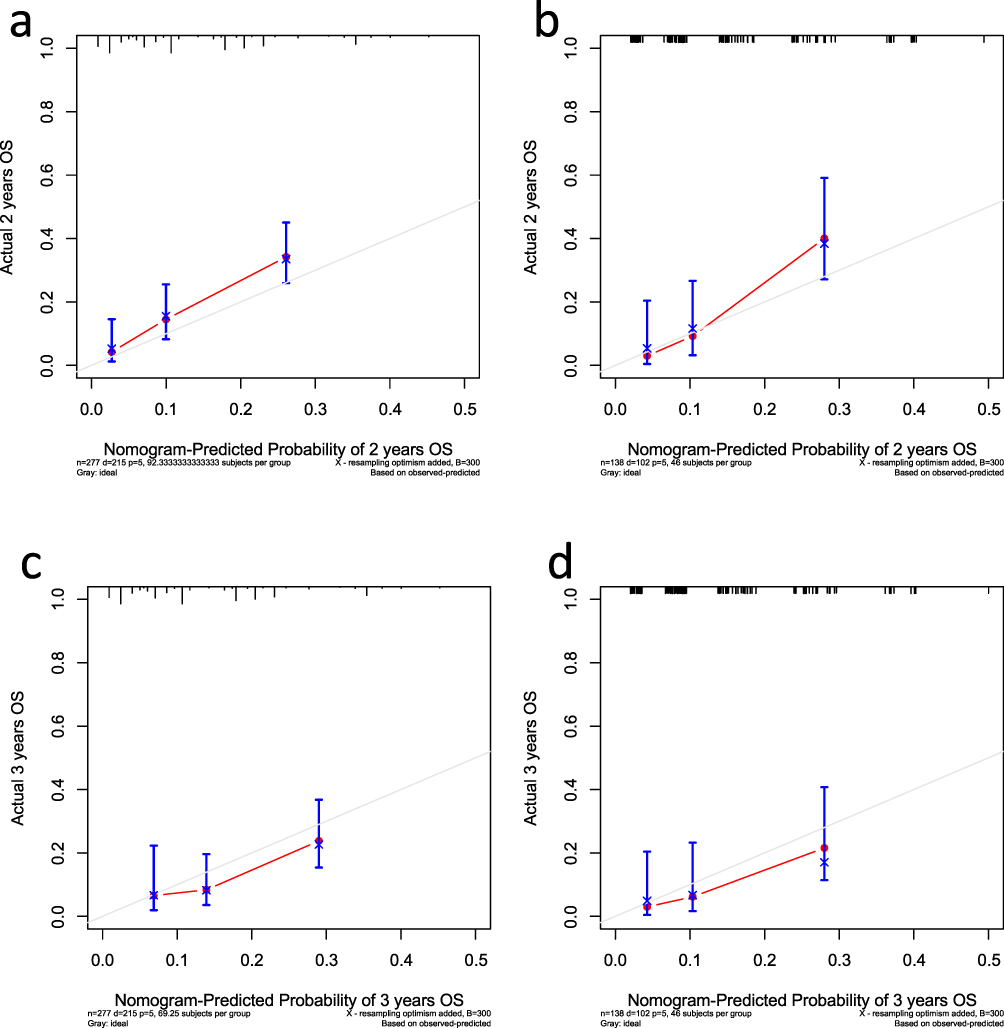 |
Figure 3 Calibration plots of overall survival in the training and validation cohorts. (a and b) Calibration plot of the nomogram for 2-year survival in the training cohort (a) and validation cohort (b). (c and d) Calibration plot of the nomogram for 3-year survival in the training cohort (c) and validation cohort (d). |
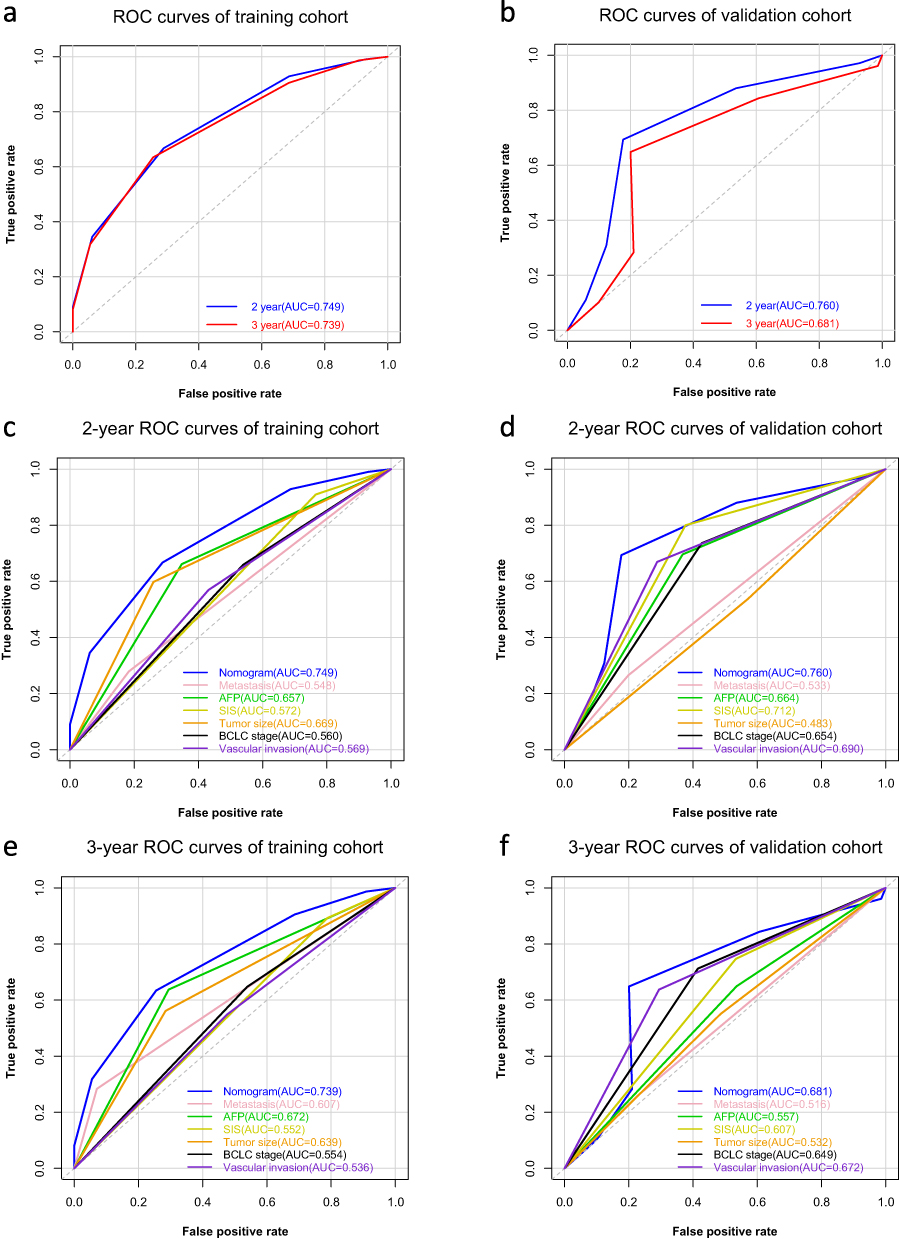 |
Figure 4 Nomogram has better predict ability than other prognostic factors. (a and b) ROC analysis of 2- and 3-year overall survival for nomogram in the training cohort (a) and validation cohort (b). (c and d) AUC of ROC curves compared the prognostic accuracy for 2-year survival of the nomogram and other prognostic factors in the training cohort (c) and validation cohort (d). (e and f) AUC of ROC curves compared the prognostic accuracy for 3-year survival of the nomogram and other prognostic factors in the training cohort (e) and validation cohort (f). |
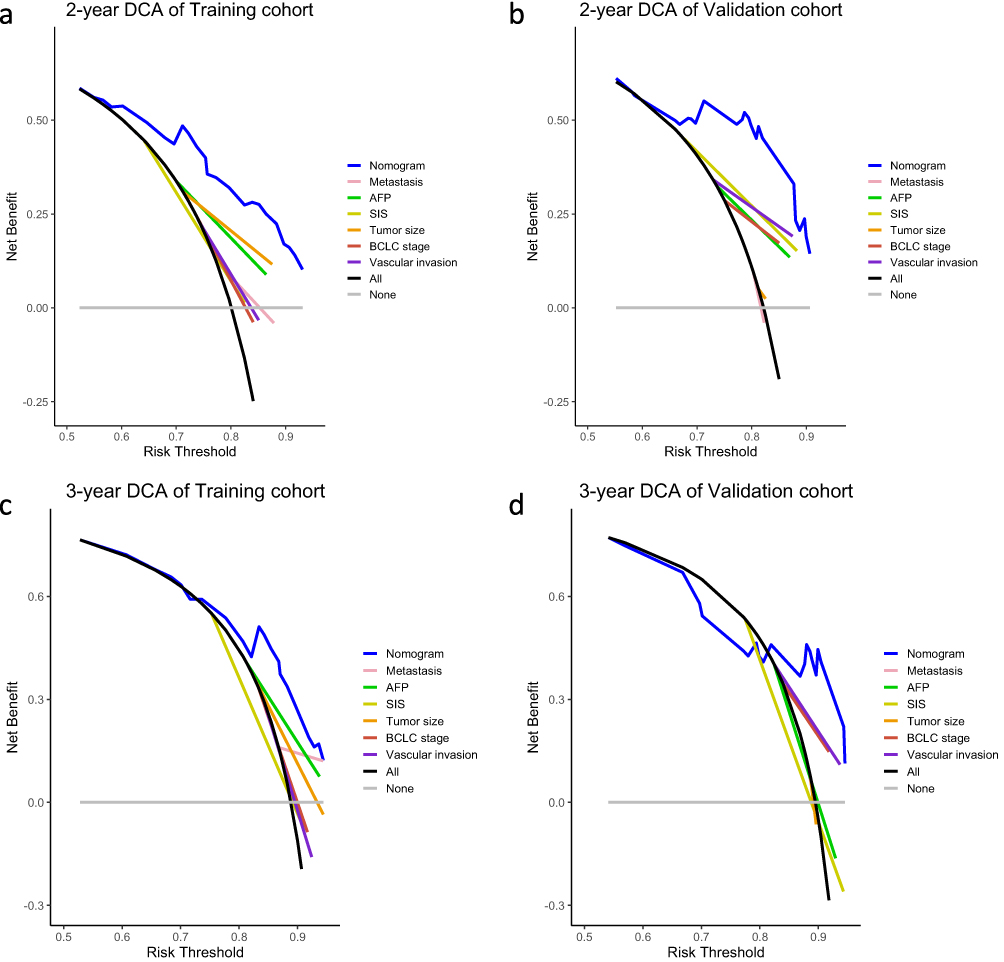 |
Figure 5 Decision-curve analysis (DCA) of nomogram in the training and validation cohorts. (a and b) DCA curves compared the standardized net benefit for 2-year survival of the nomogram and other prognostic factors in the training cohort (a) and validation cohort (b). (c and d) DCA curves compared the standardized net benefit for 3-year survival of the nomogram and other prognostic factors in the training cohort (c) and validation cohort (d). |
Discussion
HCC is the sixth most common malignant tumor with a high mortality rate worldwide.1 The treatments vary in HCC patients with different stages, and the BCLC staging system is widely used in HCC staging and prognostic prediction. However, due to tumor heterogeneity, patients with the same stage may have different responses to HAIC. The possible causes are as follows. First, the BCLC staging system was developed based on the Western population. The main etiology of HCC is hepatitis C virus infection and alcohol use in Western countries. However, hepatitis B virus (HBV) infection is the major cause of HCC in Asia.25 In addition, inflammation is considered the seventh hallmark of cancer and plays an important role in the development of almost all human tumors.26,27 For example, chronic gastritis induced by Helicobacter pylori is correlated with gastric cancer.27 Obesity promotes the development of pancreatic cancer by augmenting the release of IL-1β and the recruitment of tumor-associated neutrophils.28 HBV infection can induce inflammation by promoting the infiltration of immunosuppressive cells in HCC.29 Nevertheless, the BCLC staging system focuses on the tumor burden without including the inflammatory status of patients. Therefore, we conducted this study to develop a novel inflammation indicator to identify patients who benefit from HAIC and predict patients’ prognosis better.
In our study, we collected clinical data from 415 patients for further analysis (Table 1). Univariate and multivariate Cox regression analyses were used to identify independent prognostic indicators and then construct the SIS score based on AAR, N × M and L × A (Figure 1). Then, we developed a nomogram based on the SIS and other independent prognostic factors (Figure 2) and validated it by calibration curve, ROC analysis and DCA (Figures 3–5). The results suggested that the nomogram showed better ability in predicting the prognosis of HCC patients after HAIC.
To date, the effect of treatments for HCC, such as surgery and immunotherapy, has been reported to be associated with inflammation.30,31 In our research, the SIS, which integrates AST, ALT, albumin, neutrophils, monocytes and lymphocytes, was an independent predictor for HCC patients undergoing HAIC. AST, ALT and albumin, which are known liver function indicators, have been reported as prognostic factors in various types of cancer. Canat et al found that the AST to ALT ratio was associated with tumor progression in patients with localized renal cell carcinoma.32 Wang et al showed that an increased AST to ALT ratio was an independent prognostic factor for biochemical recurrence-free survival in patients with prostate cancer.33 Lim et al reported that patients with low albumin levels experienced a high risk of tumor progression and cancer-specific and overall mortality in head and neck squamous cell carcinoma.34 In addition, tumor-associated neutrophils (TANs) and tumor-associated monocytes (TAMs) are present in the tumor microenvironment of various cancers, where they can enhance tumor cell invasion and metastasis.35 Zhou et al found that the interaction of TANs and TAMs activated STAT3 signaling to promote the proliferation and invasion of intrahepatic cholangiocarcinoma.36 Lymphocytes are an important part of antitumor immunity. Federico et al showed that increasing the infiltration of T cells in the tumor microenvironment is associated with a good prognosis.37 In summary, there is a close relationship between tumor prognosis and AST, ALT, albumin, neutrophils, monocytes and lymphocytes. With our nomogram that contains these indicators, it is potentially possible to distinguish the optimal candidates for HAIC, which would precisely contribute to survival.
With the growing understanding of tumor microenvironment, inflammation plays a more and more important role in tumor suppression and progression. Exploring the correlation between inflammation and treatment contributes to elucidating the mechanism of drug resistance. Our study found out the relationship between HAIC and inflammation and showed that the inflammatory markers are associated with prognosis of HCC patients after HAIC. Patients with high SIS were better treated with other therapy, such as tyrosine kinase inhibitors and immune checkpoint inhibitors, rather than HAIC. In the future, further research on the association between HAIC and inflammation can help solve the HAIC resistance and improve efficacy.
There are still some limitations of this study. First, this is a retrospective single-center study. Although we validated the nomogram, the patients in the training and validation cohorts were enrolled from a single center, thereby easily leading to bias. Second, some special conditions like infection or inflammation in other tissue can influence the levels of the neutrophils, monocytes and lymphocytes, which may result in an interference with measurements. In addition, we analyzed HCC patients who underwent HAIC only, while some advanced HCC patients received HAIC combined with targeted therapy or immunotherapy. Multicenter, large-scale, prospective studies are needed to improve the nomogram for future use.
Conclusion
In summary, we constructed the pretreatment SIS score based on inflammation indicators and developed a nomogram for predicting the OS for HCC patients who underwent HAIC, demonstrating favorable performance and clinical usability.
Data Sharing Statement
The datasets used and analysed during the current study are available from the corresponding author on reasonable request.
Ethics Approval and Consent to Participate
The study was conducted according to the guidelines of the Declaration of Helsinki and approved by the Clinical Research Ethics Committee of Sun Yat-sen University Cancer Center University and all patients provided written informed consent (B2022-238-01).
Acknowledgments
The authors acknowledge and express their deepest gratitude to the participants of this study.
Author Contributions
All authors made a significant contribution to the work reported, whether that is in the conception, study design, execution, acquisition of data, analysis and interpretation, or in all these areas; took part in drafting, revising or critically reviewing the article; gave final approval of the version to be published; have agreed on the journal to which the article has been submitted; and agree to be accountable for all aspects of the work.
Funding
This work is funded by Sun Yat-sen University Cancer Center physician scientist funding (No. 16zxqk04), Wu Jieping Medical Foundation – special fund for tumor immunity (320.6705.2021-02-76), Bethune Fund-Advanced solid tumor project (STLKY2-041), Guangdong Basic and Applied Basic Research Foundation (2022A1515110961), Guangzhou Science and Technology Plan Project (2023A04J2125) and National Natural Science Foundation of China (82303893).
Disclosure
All authors declare that they have no competing interests in this work.
References
1. Sung H, Ferlay J, Siegel RL., et al. Global Cancer Statistics 2020: GLOBOCAN estimates of incidence and mortality worldwide for 36 cancers in 185 countries. CA Cancer J Clin. 2021;71(3):209–249. doi:10.3322/caac.21660
2. Vogel A, Meyer T, Sapisochin G, Salem R, Saborowski A. Hepatocellular carcinoma. Lancet. 2022;400(10360):1345–1362. doi:10.1016/S0140-6736(22)01200-4
3. Fan Y, Xue H, Zheng H. Systemic therapy for hepatocellular carcinoma: current updates and outlook. J Hepatocell Carcinoma. 2022;9:233–263. doi:10.2147/JHC.S358082
4. Wang S, Wang Y, Yu J, Wu H, Zhou Y. Lenvatinib as first-line treatment for unresectable hepatocellular carcinoma: a systematic review and meta-analysis. Cancers. 2022;14(22):5525. doi:10.3390/cancers14225525
5. Ahn YE, Suh SJ, Yim HJ, et al. Comparison of sorafenib versus hepatic arterial infusion chemotherapy-based treatment for advanced hepatocellular carcinoma with portal vein tumor thrombosis. Gut Liver. 2021;15(2):284–294. doi:10.5009/gnl19367
6. Kudo M, Ueshima K, Yokosuka O, et al. Sorafenib plus low-dose cisplatin and fluorouracil hepatic arterial infusion chemotherapy versus sorafenib alone in patients with advanced hepatocellular carcinoma (SILIUS): a randomised, open label, Phase 3 trial. Lancet Gastroenterol Hepatol. 2018;3(6):424–432. doi:10.1016/S2468-1253(18)30078-5
7. Kang MK, Park JG, Lee HJ. Comparison of clinical outcomes between sorafenib and hepatic artery infusion chemotherapy in advanced hepatocellular carcinoma: a STROBE-compliant article. Medicine. 2018;97(17):e0611. doi:10.1097/MD.0000000000010611
8. He MK, Liang RB, Zhao Y, et al. Lenvatinib, toripalimab, plus hepatic arterial infusion chemotherapy versus lenvatinib alone for advanced hepatocellular carcinoma. Ther Adv Med Oncol. 2021;13:17588359211002720. doi:10.1177/17588359211002720
9. Santoni M, Rizzo A, Kucharz J, et al. Complete remissions following immunotherapy or immuno-oncology combinations in cancer patients: the MOUSEION-03 meta-analysis. Cancer Immunol Immunother. 2023;72(6):1365–1379. doi:10.1007/s00262-022-03349-4
10. Cheng AL, Qin S, Ikeda M, et al. Updated efficacy and safety data from IMbrave150: atezolizumab plus bevacizumab vs. sorafenib for unresectable hepatocellular carcinoma. J Hepatol. 2022;76(4):862–873. doi:10.1016/j.jhep.2021.11.030
11. Qin S, Chen Z, Fang W, et al. Pembrolizumab versus placebo as second-line therapy in patients from Asia with advanced hepatocellular carcinoma: a randomized, double-blind, phase III trial. J Clin Oncol. 2023;41(7):1434–1443. doi:10.1200/JCO.22.00620
12. El-Khoueiry AB, Sangro B, Yau T, et al. Nivolumab in patients with advanced hepatocellular carcinoma (CheckMate 040): an open-label, non-comparative, Phase 1/2 dose escalation and expansion trial. Lancet Lond Engl. 2017;389(10088):2492–2502. doi:10.1016/S0140-6736(17)31046-2
13. Pan Y, Wang R, Hu D, et al. Comparative safety and efficacy of molecular-targeted drugs, immune checkpoint inhibitors, hepatic arterial infusion chemotherapy and their combinations in advanced hepatocellular carcinoma: findings from advances in landmark trials. Front Biosci Landmark Ed. 2021;26(10):873–881.
14. Lyu N, Lin Y, Kong Y, et al. FOXAI: a Phase II trial evaluating the efficacy and safety of hepatic arterial infusion of oxaliplatin plus fluorouracil/leucovorin for advanced hepatocellular carcinoma. Gut. 2018;67(2):395–396. doi:10.1136/gutjnl-2017-314138
15. Li QJ, He MK, Chen HW, et al. Hepatic arterial infusion of oxaliplatin, fluorouracil, and leucovorin versus transarterial chemoembolization for large hepatocellular carcinoma: a randomized phase III trial. J Clin Oncol off J Am Soc Clin Oncol. 2022;40(2):150–160. doi:10.1200/JCO.21.00608
16. An C, Zuo M, Li W, Chen Q, Wu P. Infiltrative hepatocellular carcinoma: transcatheter arterial chemoembolization versus hepatic arterial infusion chemotherapy. Front Oncol. 2021;11:747496. doi:10.3389/fonc.2021.747496
17. Denk D, Greten FR. Inflammation: the incubator of the tumor microenvironment. Trends Cancer. 2022;8(11):901–914. doi:10.1016/j.trecan.2022.07.002
18. Sui Q, Zhang X, Chen C, et al. Inflammation promotes resistance to immune checkpoint inhibitors in high microsatellite instability colorectal cancer. Nat Commun. 2022;13(1):7316. doi:10.1038/s41467-022-35096-6
19. Lee YH, Chuah S, Nguyen PHD, et al. IFNγ-IL-17+ CD8 T cells contribute to immunosuppression and tumor progression in human hepatocellular carcinoma. Cancer Lett. 2023;552:215977. doi:10.1016/j.canlet.2022.215977
20. Martinez-Bernabe T, Oliver J, Sastre-Serra J, Pons DG. Inflammation-related signature profile expression as a poor prognosis marker after oxaliplatin treatment in colorectal cancer. Int J Mol Sci. 2023;24(4):3821. doi:10.3390/ijms24043821
21. Wu J, Guo J, Cao Q, et al. Autophagy impacts on oxaliplatin-induced hepatocarcinoma apoptosis via the IL-17/IL-17R-JAK2/STAT3 signaling pathway. Oncol Lett. 2017;13(2):770–776. doi:10.3892/ol.2016.5476
22. Vyas D, Laput G, Vyas AK. Chemotherapy-enhanced inflammation may lead to the failure of therapy and metastasis. OncoTargets Ther. 2014;7:1015–1023. doi:10.2147/OTT.S60114
23. Liu C, Jia BS, Zou BW, et al. Neutrophil-to-lymphocyte and aspartate-to-alanine aminotransferase ratios predict hepatocellular carcinoma prognosis after transarterial embolization. Medicine. 2017;96:45.
24. Schobert IT, Savic LJ, Chapiro J, et al. Neutrophil-to-lymphocyte and platelet-to-lymphocyte ratios as predictors of tumor response in hepatocellular carcinoma after DEB-TACE. Eur Radiol. 2020;30(10):5663–5673. doi:10.1007/s00330-020-06931-5
25. Huang DQ, Singal AG, Kono Y, Tan DJH, El-Serag HB, Loomba R. Changing global epidemiology of liver cancer from 2010 to 2019: NASH is the fastest growing cause of liver cancer. Cell Metab. 2022;34(7):969–977.e2. doi:10.1016/j.cmet.2022.05.003
26. Hanahan D, Weinberg RA. Hallmarks of Cancer: the Next Generation. Cell. 2011;144(5):646–674. doi:10.1016/j.cell.2011.02.013
27. Singh N, Baby D, Rajguru JP, Patil PB, Thakkannavar SS, Pujari VB. Inflammation and Cancer. Ann Afr Med. 2019;18(3):121–126. doi:10.4103/aam.aam_56_18
28. Incio J, Liu H, Suboj P, et al. Obesity-induced inflammation and desmoplasia promote pancreatic cancer progression and resistance to chemotherapy. Cancer Discov. 2016;6(8):852–869. doi:10.1158/2159-8290.CD-15-1177
29. Fu J, Xu D, Liu Z, et al. Increased regulatory T cells correlate with CD8 T-cell impairment and poor survival in hepatocellular carcinoma patients. Gastroenterology. 2007;132(7):2328–2339. doi:10.1053/j.gastro.2007.03.102
30. Zhang D, Huo L, Pan Y, et al. A systemic inflammation response score for prognostic prediction in hepatocellular carcinoma patients after hepatectomy. J Inflamm Res. 2022;15:6869–6881. doi:10.2147/JIR.S397375
31. Sangro B, Melero I, Wadhawan S, et al. Association of inflammatory biomarkers with clinical outcomes in nivolumab-treated patients with advanced hepatocellular carcinoma. J Hepatol. 2020;73(6):1460–1469. doi:10.1016/j.jhep.2020.07.026
32. Canat L, Ataly HA, Agalarov S, Alkan I, Altunrende F. The effect of AST/ALT (De Ritis) ratio on survival and its relation to tumor histopathological variables in patients with localized renal cell carcinoma. Int Braz J Urol off J Braz Soc Urol. 2018;44(2):288–295. doi:10.1590/s1677-5538.ibju.2017.0173
33. Wang H, Fang K, Zhang J, et al. The significance of De Ritis (aspartate transaminase/alanine transaminase) ratio in predicting pathological outcomes and prognosis in localized prostate cancer patients. Int Urol Nephrol. 2017;49(8):1391–1398. doi:10.1007/s11255-017-1618-7
34. Lim WS, Roh JL, Kim SB, Choi SH, Nam SY, Kim SY. Pretreatment albumin level predicts survival in head and neck squamous cell carcinoma. Laryngoscope. 2017;127(12):E437–E442. doi:10.1002/lary.26691
35. Kim J, Bae JS. Tumor-associated macrophages and neutrophils in tumor microenvironment. Mediators Inflamm. 2016;2016:6058147. doi:10.1155/2016/6058147
36. Zhou Z, Wang P, Sun R, et al. Tumor-associated neutrophils and macrophages interaction contributes to intrahepatic cholangiocarcinoma progression by activating STAT3. J Immunother Cancer. 2021;9(3):e001946. doi:10.1136/jitc-2020-001946
37. Federico L, Dj M, Se B, et al. Distinct tumor-infiltrating lymphocyte landscapes are associated with clinical outcomes in localized non-small-cell lung cancer. Ann Oncol off J Eur Soc Med Oncol. 2022;33(1):42–56. doi:10.1016/j.annonc.2021.09.021
 © 2023 The Author(s). This work is published and licensed by Dove Medical Press Limited. The
full terms of this license are available at https://www.dovepress.com/terms
and incorporate the Creative Commons Attribution
- Non Commercial (unported, 3.0) License.
By accessing the work you hereby accept the Terms. Non-commercial uses of the work are permitted
without any further permission from Dove Medical Press Limited, provided the work is properly
attributed. For permission for commercial use of this work, please see paragraphs 4.2 and 5 of our Terms.
© 2023 The Author(s). This work is published and licensed by Dove Medical Press Limited. The
full terms of this license are available at https://www.dovepress.com/terms
and incorporate the Creative Commons Attribution
- Non Commercial (unported, 3.0) License.
By accessing the work you hereby accept the Terms. Non-commercial uses of the work are permitted
without any further permission from Dove Medical Press Limited, provided the work is properly
attributed. For permission for commercial use of this work, please see paragraphs 4.2 and 5 of our Terms.
Recommended articles
Platelet-Related Molecular Subtype to Predict Prognosis in Hepatocellular Carcinoma
Zhang G
Journal of Hepatocellular Carcinoma 2022, 9:423-436
Published Date: 19 May 2022
Histological Severity of Cirrhosis Influences Surgical Outcomes of Hepatocellular Carcinoma After Curative Hepatectomy
Liang BY, Gu J, Xiong M, Zhang EL, Zhang ZY, Lau WY, Wang SF, Guan Y, Chen XP, Huang ZY
Journal of Hepatocellular Carcinoma 2022, 9:633-647
Published Date: 23 July 2022
A Nomogram Based on SEER Database for Predicting Prognosis in Patients with Mucinous Ovarian Cancer: A Real-World Study
Zhang K, Feng S, Ge Y, Ding B, Shen Y
International Journal of Women's Health 2022, 14:931-943
Published Date: 26 July 2022
Nomogram for the Preoperative Prediction of the Macrotrabecular-Massive Subtype of Hepatocellular Carcinoma
Shan Y, Yu X, Yang Y, Sun J, Wu S, Mao S, Lu C
Journal of Hepatocellular Carcinoma 2022, 9:717-728
Published Date: 10 August 2022
Development and Validation of a Novel Nomogram Integrated with Hypoxic and Lactate Metabolic Characteristics for Prognosis Prediction in Hepatocellular Carcinoma
Qiu X, Dong L, Wang K, Zhong X, Xu H, Xu S, Guo H, Wei X, Chen W, Xu X
Journal of Hepatocellular Carcinoma 2024, 11:241-255
Published Date: 2 February 2024