Back to Journals » Diabetes, Metabolic Syndrome and Obesity » Volume 15
Predictive Value of Plasma Atherogenic Index for Microalbuminuria in Newly Diagnosed Patients with Type 2 Diabetes Mellitus
Authors Qi L ![]() , Kang N
, Kang N ![]() , Chen X
, Chen X ![]() , Li Z, Deng C, Chen S
, Li Z, Deng C, Chen S
Received 25 January 2022
Accepted for publication 12 April 2022
Published 21 April 2022 Volume 2022:15 Pages 1245—1252
DOI https://doi.org/10.2147/DMSO.S359811
Checked for plagiarism Yes
Review by Single anonymous peer review
Peer reviewer comments 2
Editor who approved publication: Professor Ming-Hui Zou
Licui Qi,1 Ning Kang,2 Xiaoyi Chen,3 Zelin Li,2 Chenqian Deng,3 Shuchun Chen1
1Endocrinology Department, Hebei General Hospital, Shijiazhuang, 050051, People’s Republic of China; 2Graduate School, Hebei Medical University, Shijiazhuang, 050000, People’s Republic of China; 3Graduate School, Hebei North University, Zhangjiakou, 075000, People’s Republic of China
Correspondence: Shuchun Chen, Endocrinology Department, Hebei General Hospital, 348, Heping West Road, Shijiazhuang, Hebei, 050051, People’s Republic of China, Email [email protected]
Purpose: This study aims to explore the predictive value of plasma atherogenic index of plasma (AIP) for microalbuminuria (MAU) in newly diagnosed patients with type 2 diabetes mellitus (T2DM).
Methods: This study was a retrospective study, which included 335 newly diagnosed T2DM patients. They were divided into microalbuminuria group (group A, n = 105 cases) and no microalbuminuria group (group B, n = 230 cases) according to whether microalbuminuria occurred. General information and laboratory examination indexes of patients were collected, and AIP was calculated. Multivariate logistic regression analysis was used to analyze the independent risk factors of microalbuminuria in T2DM patients, and receiver operating characteristic curve (ROC) was established to evaluate the predictive value of AIP on MAU of newly diagnosed T2DM patients.
Results: According to general data analysis, AIP level in group A was significantly higher than that in group B (P < 0.05). Multivariate logistic regression analysis showed that AIP was an independent risk factor for microalbuminuria (P < 0.05). The receiver operating characteristic curve showed that the area under the curve (AUC) of AIP was 0.772 (P < 0.05), which had a good predictive value for the occurrence of MAU in newly diagnosed T2DM patients. The waist-hip ratio, triglyceride, high-density lipoprotein cholesterol, fasting blood glucose, glycosylated hemoglobin and AIP were used to make a joint model, and the AUC was 0.841 (P < 0.05), which had a better predictive value for the occurrence of MAU.
Conclusions: AIP is an independent risk factor and could predict the occurrence of MAU in newly diagnosed T2DM patients. AIP provides clinicians a reliable basis to quickly identify high-risk patients and formulate appropriate treatment strategies.
Keywords: plasma arteriosclerosis index, microalbuminuria, type 2 diabetes, dyslipidemia, diabetic nephropathy
Introduction
In recent years, with the increasing prevalence of diabetes mellitus (DM), the number of patients with diabetic kidney disease (DKD) caused by DM is also increasing. A meta-analysis shows that the prevalence of diabetic kidney disease (DKD) in Chinese patients with type 2 diabetes mellitus (T2DM) is 21.8%.1 Clinically, when microalbuminuria occurs in diabetic patients, it indicates that they have entered the early stage of DKD, which can be reversed if the disease is actively prevented and treated.2 Therefore, early detection, prevention and intervention of microalbuminuria are significant.
In 2001, Dobiasova et al3 put forward the concept of plasma atherogenic index of plasma (AIP), a logarithmically transformed ratio of triglyceride (TG) to high-density lipoprotein-cholesterol (HDL-C) in molar concentration. AIP is a good predictor of the risk of atherosclerosis and coronary heart disease.4,5 The AIP is related to the size of antiatherosclerotic lipoprotein particles, which was a sign of lipid metabolism disorder. Furthermore, AIP can provide information on the severity of insulin resistance, which is associated with impaired glucose metabolism.6 At present, the researches on AIP at home and abroad mainly focused on diabetic macroangiopathy.7 However, at present, we do not fully understand the relationship between AIP and microvascular complications in patients with T2DM. Therefore, this study mainly discusses the predictive value of AIP for microalbuminuria in newly diagnosed patients with T2DM.
Materials and Methods
Study Design
This was a cross-sectional study. The study was conducted in accordance with the Declaration of Helsinki and approved by the Hebei General Hospital Ethics Committee.
Research Objects
In this study, 506 newly diagnosed patients with DM in Hebei People’s Hospital from January 2018 to December 2020 were collected. According to the inclusion and exclusion criteria (Figure 1), 335 newly diagnosed T2DM patients were finally included in this study. They were divided into microalbuminuria group (group A, n = 105 cases) and no microalbuminuria group (group B, n = 230 cases) according to whether microalbuminuria occurred. All the diagnoses and treatments conformed to the Chinese Guidelines for the Prevention and Treatment of Type 2 Diabetes (2020 Edition).8 This study was approved by the Medical Ethics Committee of People’s Hospital of Hebei Province, and all patients signed the informed consent form.
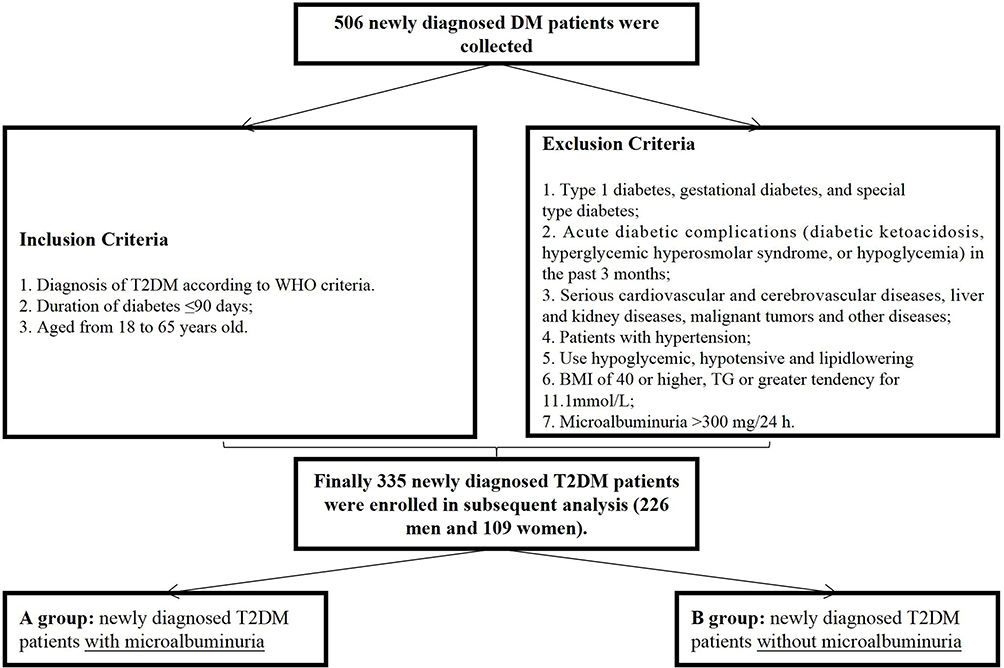 |
Figure 1 The flow chart of participants recruitment. |
Method
General data such as gender, age, course of diabetes, family history of three generations, history of smoking and drinking, blood pressure, BMI and waist-hip ratio were collected. After overnight fasting for 8–12 hours, the hospitalized patients will take venous blood samples for inspection in the next morning when they are on an empty stomach. Laboratory examination indexes include triglyceride (TC), triglyceride (TG), high-density lipoprotein cholesterol (HDL-C), low-density lipoprotein cholesterol (LDL-C), serum uric acid (SUA), serum creatinine (SCr), glomerular filtration rate (GFR), fasting blood glucose (FBG), fasting insulin, insulin resistance index (FINS), glycosylated hemoglobin (HbA1c) and 24-hour urinary microalbumin quantification (MAU). Then, we compute AIP by the formula: AIP =log(TG/HDL-C).
Statistical Analysis
SPSS 26.0 statistical software was used to analyze the data. Measurement data conforming to normal distribution are expressed by mean standard deviation ( ), and independent sample t test is used for comparison between groups. Measurement data that do not conform to normal distribution are all expressed by median (quartile), and Mann–Whitney U-test is used for comparison between groups. The data indicated by the number of cases (%), and the comparison between groups was performed by χ2 test. Multivariate analysis uses binary logistic regression analysis. Receiver operating characteristic curve (ROC) and area under the curve (AUC) were used to compare the accuracy of each index in predicting microalbuminuria in T2DM patients. All the above differences were statistically significant when P < 0.05.
Results
Comparison of General Clinical Data Between Groups A and Groups B
The average age of patients in group A was 43.13±11.34, while that of patients in group B was 44.13±12.39, and there was no significant difference between the two groups (P > 0.05). In addition, there was no significant difference in diabetes duration, smoking history, drinking history, systolic blood pressure, diastolic blood pressure, fasting insulin level, TC, LDL, creatinine, glomerular filtration rate and glycosylated hemoglobin level between the two groups (P > 0.05). The levels of BMI, WHR, TG, SUA, MAU, FBG, HOMA-IR and AIP in group A were higher than those in group B, and the differences were statistically significant (P < 0.05). HDL-C level was lower than that of group B, and the difference was statistically significant (P < 0.05). The results are shown in Table 1.
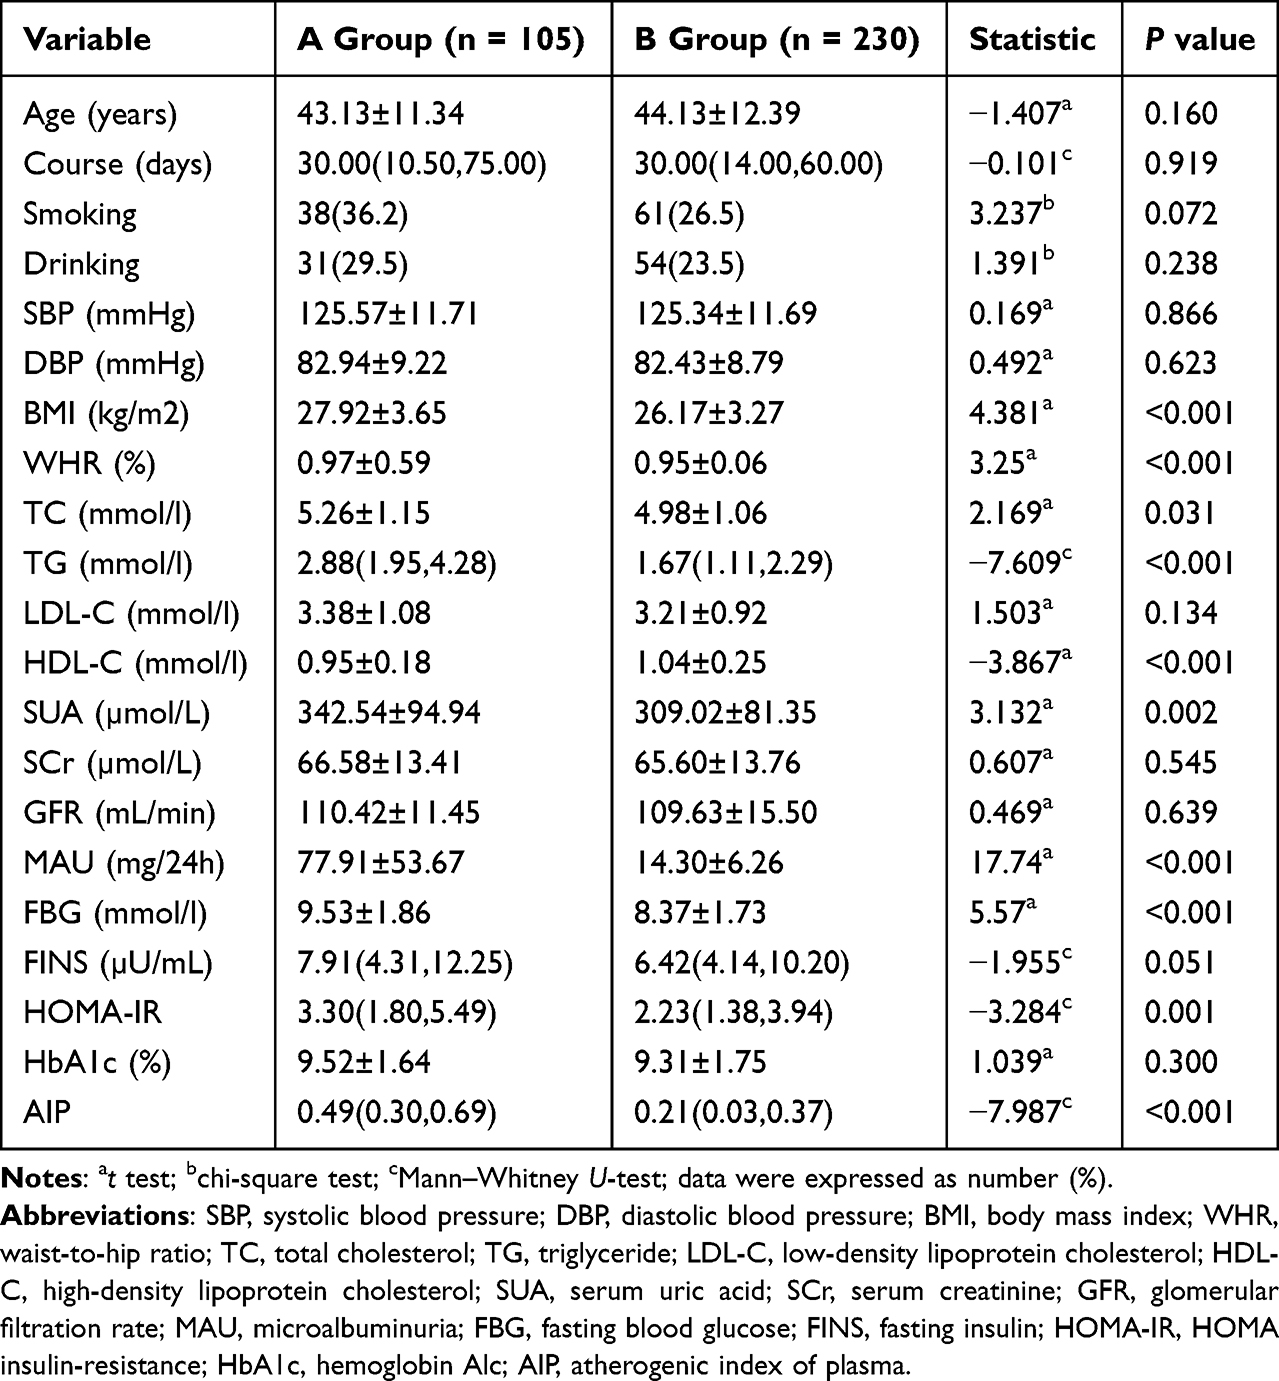 |
Table 1 The General Data of Group A and Group B Patients |
Analysis of Risk Factors Affecting Microalbuminuria
The microalbuminuria in T2DM patients was considered as the dependent variable. BMI, WHR, TC, TG, LDL-C, HDL-C, SUA, FBG, HOMA-IR, HbA1c and AIP were seen as independent variables, a binary logistic regression model was established. The results showed that WHR, TG, HDL-C, FBG, HbA1c and AIP were statistically significant (P<0.05). The results are shown in Table 2.
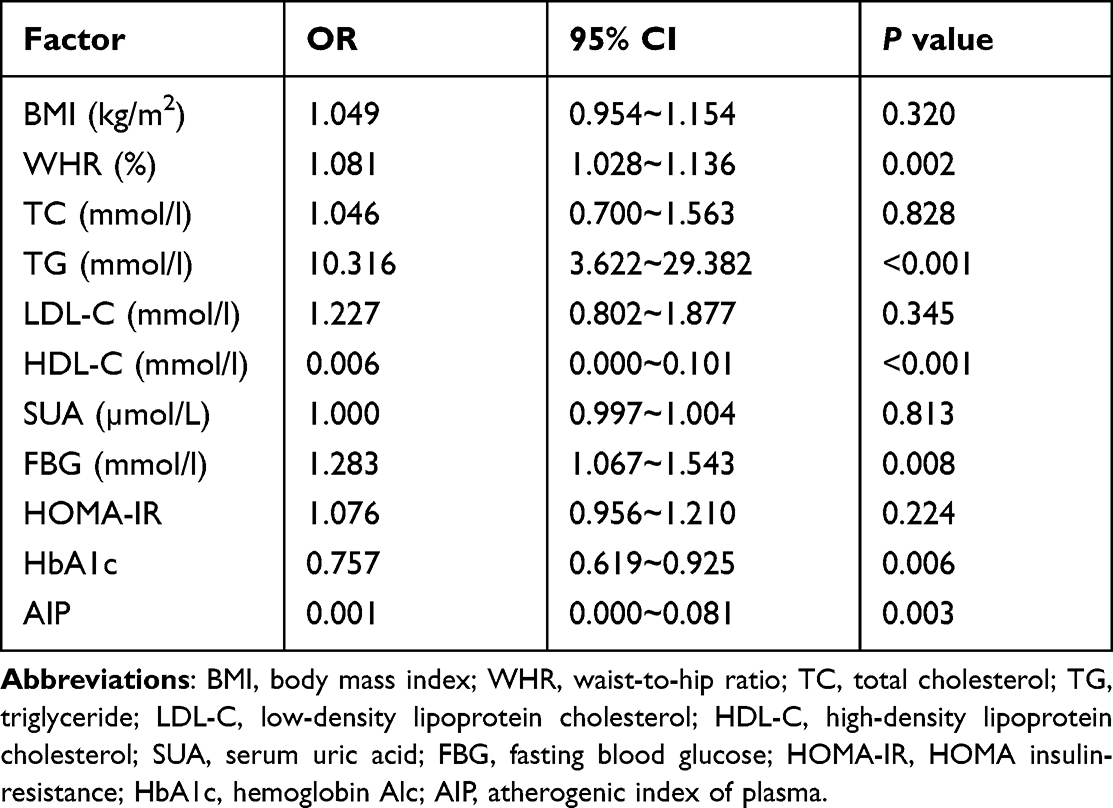 |
Table 2 Logistic Regression Analysis of T2DM Patients with Microalbuminuria |
Receiver Operating Characteristic Curve (ROC)
ROC curve was used to analyze the predictive efficiency of WHR, TG, HDL-C, FBG, HbA1c and AIP for microalbuminuria in T2DM patients. The results showed that the AUC of AIP in T2DM patients was 0.772 (95% CI 0.713~0.831, P ≤ 0.05). When the cut-off value was 0.415, the diagnostic efficiency was the highest and the sensitivity was 64. The AUC corresponding to WHR, TG, HDL-C, FBG and HbA1c were 0.629, 0.759, 0.594, 0.674 and 0.545, respectively, and AIP has the best predictive value. The results are shown in Table 3 and Figure 2.
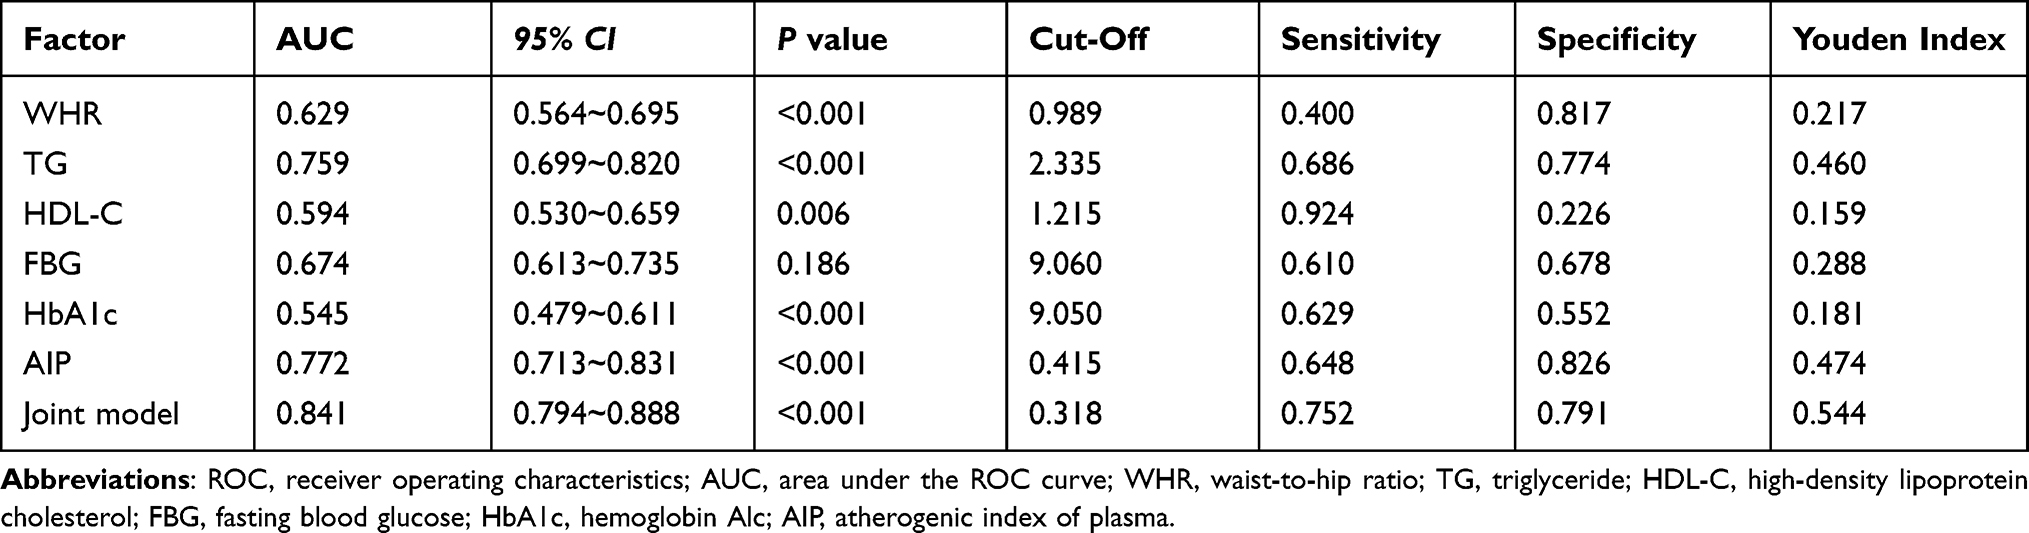 |
Table 3 ROC Curve Analysis of WHR, TG, HDL-C, FBG, HbA1c, AIP in Predicting Disease in All T2DM Patients |
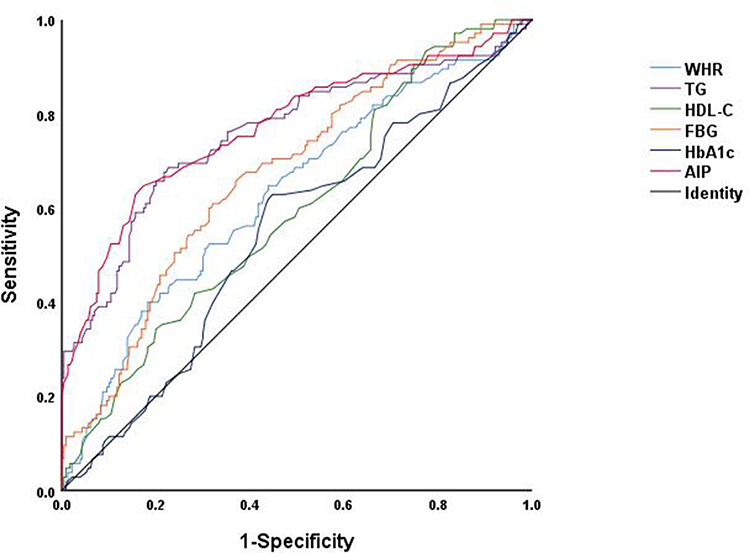 |
Figure 2 The ROC curve of WHI, TG, HDL-C, FBG, HbA1c, AIP in T2DM patients. |
Joint Forecasting Model
According to the results of binary Logistic regression analysis, WHR, TG, HDL-C, FBG, HbA1c and AIP were substituted into the equation to make the joint prediction model. The results showed that the AUC of the joint prediction model was 0.841 (95% CI 0.794~0.888, P ≤ 0.05), the sensitivity was 75.2% and the specificity was 79.1%. Compared with the above indicators, it has a higher prediction value. The results are shown in Table 3 and Figure 3.
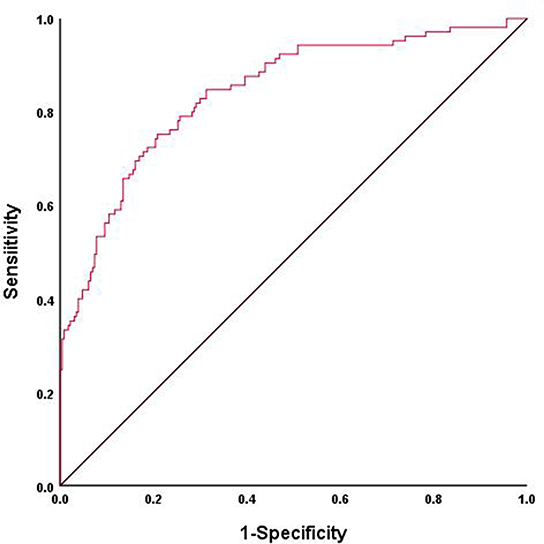 |
Figure 3 The ROC curve of joint prediction model in T2DM patients. |
Discussion
Diabetic kidney disease (DKD) is one of the common microvascular complications of diabetes, and it is also an important influencing factor in the poor prognosis of diabetic patients. Research has shown that roughly 3% of patients worldwide with a new diagnosis of type 2 diabetes mellitus (T2DM) already have an overt nephropathy at diagnosis and about 20–30% of the remaining ones develop a complication of this kind later in life.9 As a result, it is significant to identify and intervene the occurrence of DKD in the early stage to better improve the prognosis and decrease the mortality of T2DM. 24-hour urinary microalbumin is one of the most sensitive indexes to reflect glomerular damage in the early stage. However, clinically, the quantitative analysis of 24-hour urinary albumin is easily influenced by many factors, which leads to inaccurate results. Therefore, it is very important to find a simple and economical method for early screening of diabetic patients with DKD.
It is well known that different intracellular pathways demonstrated a driving role in the DKD process, stimulated by hyperglycemia,10 lipid metabolism disorder also plays an important role in DKD occurrence. Recent evidences indicate that both quantity and quality of lipids are involved in renal damage associated to lipotoxicity by activating inflammation, oxidative stress, mitochondrial dysfunction, and cell-death.11 It is one of the pathophysiological mechanism of DKD formation. The disorder of blood lipid metabolism is mainly manifested by the increase of TG, the decrease of HDL-C and the increase of sLDL-C ratio. Studies have shown that the diameter of LDL-C particles is closely related to the degree of atherosclerosis.12 AIP is a sensitive index proposed in 2004 to predict lipid metabolism disorder, which can indirectly reflect the size of sLDL-C particles. The higher the AIP, the smaller the diameter of sLDL-C particles and the higher the risk of vascular sclerosis.13 DKD is correlated with lipid metabolism disorder, and the AIP could be seen as a sensitive factor of lipid metabolism disorder. So, we contend that AIP may play a significant role in predicting the occurrence of DKD in the early stage. This research aims to study the predictive value of AIP.
At present, many studies showed that AIP has a good predictive value for diabetes14 and the occurrence of diabetes complicated with macroangiopathy.15–17 Some studies also showed that AIP was related to the distribution of body fat in diabetic patients.15–17 Up to now, there is little research on AIP and diabetic nephropathy. This study showed that compared with the control group, the AIP index of T2DM patients with microalbuminuria was significantly higher (P < 0.05), and the levels of BMI, WHR, TG, SUA, MAU, FBG and HOMA-IR in group A were all higher than those in group B. While the HDL-C level was lower than that in group B, and the differences were statistically significant (P < 0.05). These results indicated that the levels of AIP and HOMA-IR in group A were significantly higher than those in group B. The results of further binary logistic regression analysis showed that WHR, TG, HDL-C, FBG and AIP were independent risk factors for microalbuminuria (P < 0.05), which indicates that with the gradual increase of waist-hip ratio, triglyceride, fasting blood glucose, glycosylated hemoglobin, AIP and the gradual decrease of high-density lipoprotein cholesterol in T2DM patients, the probability of microalbuminuria is increasing. In this study, the ROC curve of WHR, TG, HDL-C, FBG, HbA1c and AIP was made. The results showed that the AUC of WHR, TG, HDL-C, FBG, AIP were 0.692, 0.759, 0.594, 0.674 and 0.722, respectively, all of which were P < 0.05. The AUC of AIP was the largest, which indicated that AIP had a better predictive value for the occurrence of microalbuminuria in T2DM patients. The corresponding optimal critical point of AIP was 0.415; hence, when AIP is greater than 0.415, it indicates that the occurrence rate of microalbuminuria is greatly increased, so we should be vigilant in clinic. We made a joint prediction model with WHR, TG, HDL-C, FBG, HbA1c and AIP, and the AUC was 0.841, which was more significant than the prediction of each index alone and had a higher predictive value for microalbuminuria. However, the AUC of glycated hemoglobin in this study is 0.545 (P value >0.05), which indicates that glycated hemoglobin is a risk factor of microalbuminuria, but it could not predict microalbuminuria by itself. Nevertheless, it demonstrated a high predictive value when combined with other indicators. The reason may be related to the factors such as the bias and size of samples enrolled in this study. We are looking forward to a larger sample and more people to study the predictive value of HbA1c for microalbuminuria.
T2DM patients are prone to lipid metabolism disorder, and high triglyceride and low HDL-C are typical manifestations of lipid metabolism disorder. The results of a prospective study in the UK showed that hypertriglyceridemia is independently related to the risk of microalbuminuria in T2DM patients.18 Studies have also shown that lipid metabolism disorder plays an important role in the occurrence and development of renal dysfunction.19–22 Dyslipidemia is associated with proteinuria, renal dysfunction and end-stage renal disease.23 Generally, patients with T2DM are susceptible to the disorder of blood lipid metabolism, and excessive lipids are gradually deposited in non-fat tissues and organs such as kidney, liver and blood vessels, which eventually leads to lipotoxicity and aggravates the disease progress. According to the theory of nephrotoxicity, excessive fatty acids and toxic metabolites are deposited in the glomerulus and renal tubules, activating various signal pathways, including oxidative stress, inflammation, fibrosis and apoptosis. These phenomena will lead to renal cell injury and dysfunction, and ultimately accelerating glomerulosclerosis and tubulointerstitial fibrosis.24–26 In addition, lipotoxicity can also enhance insulin resistance by activating the protein kinase pathway, and vice versa.27,28 In a word, high glucose toxicity and lipotoxicity play an important role in the occurrence and development of DKD.
Conclusion
To sum up, our research shows that AIP is an independent risk factor for microalbumin in newly diagnosed T2DM patients, which has a good predictive value for its occurrence, while the multi-index joint predictive model has a better predictive value. At present, blood lipid detection is relatively easy and feasible in the clinic, and it could be used as a reference index of abnormal lipid metabolism. In the aspect of the economy, AIP is simple and easy to calculate, which is not only an index of lipid metabolism disorder, but also could predict early renal function damage in T2DM patients, which is worthy of clinical popularization and usage.
Disclosure
The authors report no conflicts of interest in this work.
References
1. Microvascular Complications Group of Diabetes Branch of Chinese Medical Association. Guidelines for the prevention and treatment of diabetic nephropathy in China (2021 edition). Chin J Diabetes. 2021;13(08):762–784.
2. Gabriel R, Boukichou AN, Acosta T, et al. Early prevention of diabetes microvascular complications in people with hyperglycaemia in Europe. ePREDICE randomized trial. Study protocol, recruitment and selected baseline data. PLoS One. 2020;15(4):e231196. doi:10.1371/journal.pone.0231196
3. Dobiasova M, Raslova K, Rauchova H, et al. Atherogenic lipoprotein profile in families with and without history of early myocardial infarction. Physiol Res. 2001;50(1):1–8.
4. Cai G, Shi G, Xue S, et al. The atherogenic index of plasma is a strong and independent predictor for coronary artery disease in the Chinese Han population. Medicine. 2017;96(37):e8058. doi:10.1097/MD.0000000000008058
5. Kim JJ, Yoon J, Lee YJ, et al. Predictive value of the atherogenic index of plasma (aip) for the risk of incident ischemic heart disease among non-diabetic Koreans. Nutrients. 2021;13(9):3231. doi:10.3390/nu13093231
6. Tan MH, Johns D, Glazer NB. Pioglitazone reduces atherogenic index of plasma in patients with type 2 diabetes. Clin Chem. 2004;50(7):1184–1188. doi:10.1373/clinchem.2004.031757
7. Fu L, Zhou Y, Sun J, et al. Atherogenic index of plasma is associated with major adverse cardiovascular events in patients with type 2 diabetes mellitus. Cardiovasc Diabetol. 2021;20(1):201. doi:10.1186/s12933-021-01393-5
8. Diabetes Branch of Chinese Medical Association. Guidelines for the prevention and treatment of type 2 diabetes in China (2020 Edition) . Int J Endocrinol Metab. 2021;41(5):482–548.
9. Santoro D, Torreggiani M, Pellicano V, et al. Kidney biopsy in type 2 diabetic patients: critical reflections on present indications and diagnostic alternatives. Int J Mol Sci. 2021;22(11):5425. doi:10.3390/ijms22115425
10. Gembillo G, Ingrasciotta Y, Crisafulli S, et al. Kidney disease in diabetic patients: from pathophysiology to pharmacological aspects with a focus on therapeutic inertia. Int J Mol Sci. 2021;22(9):4824. doi:10.3390/ijms22094824
11. Opazo-Rios L, Mas S, Marin-Royo G, et al. Lipotoxicity and diabetic nephropathy: novel mechanistic insights and therapeutic opportunities. Int J Mol Sci. 2020;21(7):2632. doi:10.3390/ijms21072632
12. Lamarche B, Tchernof A, Moorjani S, et al. Small, dense low-density lipoprotein particles as a predictor of the risk of ischemic heart disease in men. Prospective results from the Quebec Cardiovascular StudY. Circulation. 1997;95(1):69–75. doi:10.1161/01.cir.95.1.69
13. Shiying L, Zheng L, Jinxia Z, et al. The relationship between oxidized low density lipoprotein, monocyte chemoattractant protein 1 and carotid atherosclerosis after cerebral infarction. Chin J Atheroscler. 2016;24(05):495–498.
14. Zhu XW, Deng FY, Lei SF. Meta-analysis of Atherogenic Index of Plasma and other lipid parameters in relation to risk of type 2 diabetes mellitus. Prim Care Diabetes. 2015;9(1):60–67. doi:10.1016/j.pcd.2014.03.007
15. Ma X, Sun Y, Cheng Y, et al. Prognostic impact of the atherogenic index of plasma in type 2 diabetes mellitus patients with acute coronary syndrome undergoing percutaneous coronary intervention. Lipids Health Dis. 2020;19(1):240. doi:10.1186/s12944-020-01418-0
16. Zhou K, Qin Z, Tian J, et al. The atherogenic index of plasma: a powerful and reliable predictor for coronary artery disease in patients with type 2 diabetes. Angiology. 2021;72(10):934–941. doi:10.1177/00033197211012129
17. Si Y, Fan W, Han C, et al. Atherogenic Index of plasma, triglyceride-glucose index and monocyte-to-lymphocyte ratio for predicting subclinical coronary artery disease. Am J Med Sci. 2021;362(3):285–290. doi:10.1016/j.amjms.2021.05.001
18. McNamara JR, Jenner JL, Li Z, et al. Change in LDL particle size is associated with change in plasma triglyceride concentration. Arterioscler Thromb. 1992;12(11):1284–1290. doi:10.1161/01.atv.12.11.1284
19. Herman-Edelstein M, Scherzer P, Tobar A, et al. Altered renal lipid metabolism and renal lipid accumulation in human diabetic nephropathy. J Lipid Res. 2014;55(3):561–572. doi:10.1194/jlr.P040501
20. Chang Y, Ryu S, Choi Y, et al. Metabolically healthy obesity and development of chronic kidney disease: a cohort study. Ann Intern Med. 2016;164(5):305–312. doi:10.7326/M15-1323
21. Smajic J, Hasic S, Rasic S. High-density lipoprotein cholesterol, apolipoprotein E and atherogenic index of plasma are associated with risk of chronic kidney disease. Med Glas. 2018;15(2):115–121. doi:10.17392/962-18
22. Akbas EM, Timuroglu A, Ozcicek A, et al. Association of uric acid, atherogenic index of plasma and albuminuria in diabetes mellitus. Int J Clin Exp Med. 2014;7(12):5737–5743.
23. Schaeffner ES, Kurth T, Curhan GC, et al. Cholesterol and the risk of renal dysfunction in apparently healthy men. J Am Soc Nephrol. 2003;14(8):2084–2091. doi:10.1681/ASN.V1482084
24. Bobulescu IA. Renal lipid metabolism and lipotoxicity. Curr Opin Nephrol Hypertens. 2010;19(4):393–402. doi:10.1097/MNH.0b013e32833aa4ac
25. Thongnak L, Pongchaidecha A, Lungkaphin A. Renal lipid metabolism and lipotoxicity in diabetes. Am J Med Sci. 2020;359(2):84–99. doi:10.1016/j.amjms.2019.11.004
26. Hung CC, Tsai JC, Kuo HT, et al. Dyslipoproteinemia and impairment of renal function in diabetic kidney disease: an analysis of animal studies, observational studies, and clinical trials. Rev Diabet Stud. 2013;10(2–3):110–120. doi:10.1900/RDS.2013.10.110
27. Yazici D, Sezer H. insulin resistance, obesity and lipotoxicity. Adv Exp Med Biol. 2017;960:277–304. doi:10.1007/978-3-319-48382-5_12
28. Ahmed B, Sultana R, Greene MW. Adipose tissue and insulin resistance in obese. Biomed Pharmacother. 2021;137:111315. doi:10.1016/j.biopha.2021.111315
 © 2022 The Author(s). This work is published and licensed by Dove Medical Press Limited. The
full terms of this license are available at https://www.dovepress.com/terms
and incorporate the Creative Commons Attribution
- Non Commercial (unported, 3.0) License.
By accessing the work you hereby accept the Terms. Non-commercial uses of the work are permitted
without any further permission from Dove Medical Press Limited, provided the work is properly
attributed. For permission for commercial use of this work, please see paragraphs 4.2 and 5 of our Terms.
© 2022 The Author(s). This work is published and licensed by Dove Medical Press Limited. The
full terms of this license are available at https://www.dovepress.com/terms
and incorporate the Creative Commons Attribution
- Non Commercial (unported, 3.0) License.
By accessing the work you hereby accept the Terms. Non-commercial uses of the work are permitted
without any further permission from Dove Medical Press Limited, provided the work is properly
attributed. For permission for commercial use of this work, please see paragraphs 4.2 and 5 of our Terms.
Recommended articles
Clinical and Pathological Features of Chinese Patients with Type 2 Diabetes, Biopsy-Proven Diabetic Kidney Disease, and Rapid eGFR Decline
Qin C, Wang Y, Zhao L, Zhang J, Ren H, Zou Y, Wu Y, Wang T, Zhao Y, Zhang R, Xu H, Zhang J, Cooper ME, Liu F
Diabetes, Metabolic Syndrome and Obesity 2022, 15:2847-2856
Published Date: 16 September 2022
Association of Lipopolysaccharide-Toll-Like Receptor 4 Signaling and Microalbuminuria in Patients with Type 2 Diabetes Mellitus
Zhang L, Zhang Y, Liu J, Li Y, Quan J
Diabetes, Metabolic Syndrome and Obesity 2022, 15:3143-3152
Published Date: 17 October 2022
Low Circulating Free Triiodothyronine Levels are Associated with the Progression of Diabetic Nephropathy in Patients with Type 2 Diabetes
Siddiqui K, Nawaz SS, Alfadda AA, Mujammami M
International Journal of General Medicine 2022, 15:8659-8668
Published Date: 19 December 2022
Differences and Clinical Significance of Serum 25-Hydroxyvitamin D3 and Vasohibin-1 (VASH-1) Levels in Patients with Diabetic Nephropathy and Different Renal Injuries
Liu H, Wang D, Tang J, Yu L, Su S
Diabetes, Metabolic Syndrome and Obesity 2023, 16:1085-1091
Published Date: 19 April 2023
Machine Learning-Based Predictive Modeling of Diabetic Nephropathy in Type 2 Diabetes Using Integrated Biomarkers: A Single-Center Retrospective Study
Zhu Y, Zhang Y, Yang M, Tang N, Liu L, Wu J, Yang Y
Diabetes, Metabolic Syndrome and Obesity 2024, 17:1987-1997
Published Date: 10 May 2024