Back to Journals » Diabetes, Metabolic Syndrome and Obesity » Volume 18
Predictive Model for In-Hospital Death in Older Patients with Type 2 Diabetes Mellitus: A Multicenter Retrospective Study in Southwest China
Authors Tang Y, Zhang Z, Yu Y, He Y, Yuan Y, Wu X, Xu Q, Niu J, Wu X ![]() , Tan J
, Tan J
Received 31 March 2025
Accepted for publication 27 May 2025
Published 9 June 2025 Volume 2025:18 Pages 1873—1889
DOI https://doi.org/10.2147/DMSO.S527018
Checked for plagiarism Yes
Review by Single anonymous peer review
Peer reviewer comments 2
Editor who approved publication: Prof. Dr. Ernesto Maddaloni
Yang Tang,1 Zhengyu Zhang,2 Yue Yu,3 Yuxin He,4 Yuan Yuan,5 Xin Wu,6 Qian Xu,7 Jianhua Niu,8 Xiaoxin Wu,9 Juntao Tan10
1Department of Cardiology, Affiliated Banan Hospital of Chongqing Medical University, Chongqing, 401320, People’s Republic of China; 2Medical Records Department, The First Affiliated Hospital, Zhejiang University School of Medicine, Hangzhou, Zhejiang, 310003, People’s Republic of China; 3Senior Bioinformatician Department of Quantitative Health Sciences, Mayo Clinic, Rochester, MN, 55905, USA; 4Department of Medical Administration, Affiliated Banan Hospital of Chongqing Medical University, Chongqing, 401320, People’s Republic of China; 5Medical Records Department, Women and Children’s Hospital of Chongqing Medical University, Chongqing, 401147, People’s Republic of China; 6Department of Gastrointestinal Surgery, Third Affiliated Hospital of Chongqing Medical University, Chongqing, 401120, People’s Republic of China; 7Library, Chongqing Medical University, Chongqing, 400016, People’s Republic of China; 8Department of Critical Care, the First Affiliated Hospital, Zhejiang University School of Medicine, Hangzhou, Zhejiang, 310003, People’s Republic of China; 9State Key Laboratory for Diagnosis and Treatment of Infectious Diseases, National Clinical Research Centre for Infectious Diseases, the First Affiliated Hospital, Zhejiang University School of Medicine, Hangzhou, Zhejiang, 310003, People’s Republic of China; 10College of Medical Informatics, Chongqing Medical University, Chongqing, 400016, People’s Republic of China
Correspondence: Xiaoxin Wu, State Key Laboratory for Diagnosis and Treatment of Infectious Diseases, National Clinical Research Centre for Infectious Diseases, The First Affiliated Hospital, Zhejiang University School of Medicine, 79 Qing Chun Road, Hangzhou, Zhejiang, 310003, People’s Republic of China, Tel +8615988112032, Email [email protected] Juntao Tan, College of Medical Informatics, Chongqing Medical University, Chongqing, 400016, People’s Republic of China, Tel +8618375753171, Email [email protected]
Objective: Older patients with type 2 diabetes mellitus (T2DM) often face severe health challenges. This study aims to develop and validate a predictive model for estimating in-hospital death risk in this population.
Methods: Clinical data of 17,421 patients with T2DM aged ≥ 65 years admitted to six hospitals in southwest China were collected retrospectively. Model performance was assessed through area under the receiver operating characteristic curve (AUROC) analysis and calibration plots. Clinical utility was evaluated using decision curve analysis (DCA) and clinical impact curve (CIC).
Results: The overall in-hospital death rate was 3.19% (556 cases). Eleven independent predictors were identified: age, gender, history of surgery, Charlson Comorbidity Index score, coronary heart disease, chronic obstructive pulmonary disease, serum levels of creatinine, albumin, glycated hemoglobin, nutritional support drug use, and antibiotic drug use. The multivariable model demonstrated robust predictive accuracy with AUROC values of 0.873 (95% CI: 0.857– 0.889) in training set, 0.830 (0.797– 0.864) in internal validation set, and 0.834 (0.757– 0.911) in external validation set. Bootstrap validation (n=1,000 resamples) confirmed adequate calibration. DCA and CIC analyses revealed substantial clinical net benefit across threshold probabilities. An interactive web-based calculator was implemented for clinical application (https://cqykdxtjt.shinyapps.io/in_hospital_death/).
Conclusion: The prediction model developed in this study demonstrated robust discrimination, calibration, and clinical utility. It can assist healthcare professionals in identifying high-risk older patients with T2DM, facilitating early prevention, detection, and intervention, thereby reducing the risk of in-hospital death in this vulnerable population.
Keywords: diabetes mellitus, type 2, hospital mortality, aged, predictive models
Introduction
Diabetes mellitus (DM) has become a global health priority, with its prevalence rising rapidly worldwide.1–3 China faces particularly severe challenges, holding both the highest growth rate of DM cases and the largest diabetic population globally. Epidemiological data reveal a striking 15-fold increase in DM prevalence over four decades (0.67% in 1980 vs 11.2% in 2017), with projections estimating 174 million cases by 2045.4,5 Age significantly impacts disease distribution: 24.0% of adults aged 75–79 have DM, and nearly half of all Chinese diabetic patients are elderly (≥65 years), over 90% of whom have type 2 diabetes (T2DM).6 DM-related complications (vascular, ocular, renal, and foot disorders) contributed to 140,000 deaths in 2016 alone, with mortality rates rising 63.5% since 1990 (6.3 to 10.3 per 100,000 population).7–13
Older patients with T2DM often face significant health challenges. Managing this patient group is complex due to increased heterogeneity, the presence of multiple comorbidities, weakened perception of hypoglycemia, and dependency on nursing care.14 In 2019, diabetes prevention and control were identified as one of the 15 key actions in the “Healthy China Action (2019–2030)” initiative.15 Through targeted interventions, the upward trend in DM incidence and premature mortality can be curbed, and improvements in per capita healthy life expectancy can be achieved.16,17 In-hospital death is a critical indicator of quality improvement.18 Developing a predictive model for in-hospital death in older patients with T2DM could help prevent such deaths, reduce medical costs, and enhance the quality of care and life. While existing models for in-hospital death prediction provide valuable insights, they often fail to adequately address the unique characteristics and needs of older patients with T2DM. Existing models may not fully capture the complexity of this population, including the presence of multiple comorbidities, age-related physiological changes, and the impact of frailty. Furthermore, these models often lack the granularity to provide precise risk estimates for this specific patient group.
This study aimed to identify factors influencing in-hospital death by analyzing the clinical data of older patients with T2DM admitted to six tertiary hospitals in Southwest China. We also sought to develop a predictive model for in-hospital death and create a user-friendly web interface to calculate the precise probability of in-hospital death in older patients with T2DM. Our model is designed to be tailored to the older T2DM population, incorporating a comprehensive set of predictors that account for their unique clinical characteristics, and providing a practical tool for clinicians to facilitate early prevention, detection, and intervention.
Material and Methods
Data Source
This retrospective multicenter study utilized electronic medical records (EMRs) to analyze 28,704 initial hospital discharges with primary or secondary diagnoses of T2DM across six tertiary hospitals in Southwest China (2012–2022). After applying exclusion criteria, the final analytical cohort comprised 17,421 older T2DM patients. Data from hospitals A–E were randomly allocated into a training set (n=11,203, 70%) and an internal validation set (n=4,802, 30%). Hospital F contributed an independent external validation cohort (n=1,416). Detailed case distributions across hospitals are provided in Supplementary Table S1.
The study protocol was approved by the Ethics Committee of the Affiliated Banan Hospital of Chongqing Medical University (Approval No. BNLLKY2023037). Informed consent requirements were waived in accordance with national regulations for retrospective analyses of anonymized EMR data. This study adhered to the TRIPOD (Transparent Reporting of a Multivariable Prediction Model for Individual Prognosis or Diagnosis) reporting guidelines.19
Patient and Public Involvement
Patients or the public were not involved in the design, or conduct, or reporting, or dissemination plans of our research.
Inclusion and Exclusion Criteria
Patients were classified as having T2DM if they met either of the following criteria: (1) documentation of T2DM diagnosis codes [International Classification of Disease, Ninth Revision, Clinical Modification (ICD-9-CM) or Tenth Revision, Clinical Modification (ICD-10-CM)] in primary/secondary discharge diagnoses; (2) prescription of antidiabetic medications during hospitalization; (3) Laboratory confirmation of diabetes based on World Health Organization (WHO) criteria: fasting glucose ≥7.0 mmol/L, random glucose ≥11.1 mmol/L, or glycated hemoglobin (HbA1c) ≥6.5% (48 mmol/mol) prior to or during hospitalization. Supplementary Table S2 provides the frequency distribution of the top 10 primary diagnoses.
The inclusion criteria were as follows: (1) age ≥65 years at admission; (2) hospitalization between 2012–2022 with T2DM as primary or secondary diagnosis (ICD-10 code: E11.9). The exclusion criteria were as follows: (1) non-emergent admissions (n=9,685); (2) Length of stay <2 days (n=976); (3) life-threatening comorbidities: pulmonary embolism (ICD code: I26.9, n=243), valvular heart disease (ICD code: I51.9, n=12), cardiac arrest (ICD code: I46.9, n=17), aortic dissection (ICD code: I71.0, n=129), and cardiogenic shock (ICD code: R57.0, n=132); (4) severe trauma-related admissions (n=89) (Supplementary Figure S1). The primary outcome was all-cause in-hospital death, defined as death from any cause during the index hospitalization.
Sample Size
Training set size was determined by two criteria: (1) ≥5 events per candidate predictor and20,21 (2) assumed minimum in-hospital mortality rate of 8%.22,23 A sample of 1,688 patients satisfied these requirements. External validation required ≥100 events;24 given an expected mortality rate of 12.5%, 800 patients should be included. In summary, the sample size included in this study fully meets the above criteria.
Data Collection
The following clinical data were collected from the EMRs data set using the first available measurements recorded within 48 hours of admission to ensure consistency and minimize confounding from in-hospital interventions. For parameters with multiple measurements during this window, only the initial values were retained:
i) Demographics: age, gender, history of surgery, smoking history, and drinking history.
ii) Baseline clinical data included Charlson comorbidity index (CCI) score, hypertension, coronary heart disease (CHD), cerebral infarction (CI), hyperlipidemia, chronic obstructive pulmonary disease (COPD), heart failure (HF), systolic blood pressure (SBP), diastolic blood pressure (DBP), total cholesterol (TC), triglycerides (TG), serum levels of creatinine (SCR), low-density lipoprotein cholesterol (LDL-C), high-density lipoprotein cholesterol (HDL-C), albumin (ALB), HbA1c, and fasting glucose.
iii) Medications: nutritional support drug use, statin drug use, antiplatelet and anticoagulant drug use, antiosteoporotic drug use, and antibiotic drug use.
Definition
Smoking and drinking histories were assessed via EMR at admission and during subsequent care. Patients were classified as having a smoking history if they reported active smoking or had ceased smoking for <1 year, as prior evidence indicates reduced reliability of sustained cessation within this timeframe. Drinking history followed identical classification criteria. Medication usage data, including drug names, dosages, and administration schedules, were extracted from EMR medication tables.
Statistical Analysis
Analyses were conducted using SPSS 22.0 (IBM Corp., USA) and R 4.0.2 (R Core Team, Austria). Normally distributed data were expressed as mean ± standard deviation and compared using t-tests, while non-normally distributed variables were reported as median (interquartile range) and analyzed via Mann–Whitney U-tests. Categorical variables were expressed as counts (percentages) and evaluated with χ²-tests. To address missing data and minimize bias, multivariate multiple imputation with chained equations was applied.25,26 Sensitivity analyses using complete-case approaches were performed for validation.
Variables showing significant differences in univariate analyses were selected as candidate predictors. Least absolute shrinkage and selection operator (LASSO) regression identified key influencing factors.27,28 Restricted cubic splines (RCS) assessed linearity assumptions between continuous predictors and in-hospital death risk; non-linear variables were dichotomized using optimal cutoff values. Univariate and multivariate backward stepwise logistic regression (guided by Akaike Information Criterion, AIC) identified independent risk factors for in-hospital mortality in older T2DM patients. Model performance was evaluated using area under the receiver operating characteristic curve (AUROC), calibration curves, Brier scores, decision curve analysis (DCA), and clinical impact curves (CIC).29,30 DCA quantified net clinical benefit across risk thresholds, while CIC visualized high-risk patient estimates.
To further assess the superiority of our model, we compared it with two existing models used for predicting in-hospital mortality in T2DM patients: the Munsakul et al model and the Liu et al model.31,32 Model performance was assessed via AUROC comparisons and Net Reclassification Improvement (NRI).
The “sampling” R package randomly allocated data from hospitals A–E into training (70%) and internal validation (30%) sets. LASSO regression utilized the “glmnet” package, nomograms were created with “rms”, AUROC curves with “pROC”, and DCA/CIC plots with “ggDCA.” Statistical significance was defined as P < 0.05.
Results
Patient Characteristics
The study included 17,421 older T2DM patients with an overall in-hospital death rate of 3.19% (556/17,421). Participants were stratified into a training set (n=11,203), an internal validation set (n=4,802), and an external validation set (n=1,416). Baseline characteristics for the training and internal validation sets are summarized in Table 1, while those for the external validation set are provided in Supplementary Table S3. Missing data proportions in the training set ranged from 0% to 35%, with 48% (5,348/11,203) of participants having complete data. Missing variable distributions were consistent between imputed and complete-case datasets (Supplementary Table S4), and sensitivity analyses confirmed robustness of results when using imputed data (Supplementary Table S5). In the training set, patients were divided into death group and survival group. Univariate analysis identified significant associations (P < 0.05) between in-hospital death and the following variables: age, gender, history of surgery, smoking history, CCI score, hypertension, CHD, CI, hyperlipidemia, COPD, HF, SBP, DBP, TC, TG, SCR, LDL-C, HDL-C, ALB, HbA1c, nutritional support drug use, statin drug use, and antibiotic drug use (Table 2).
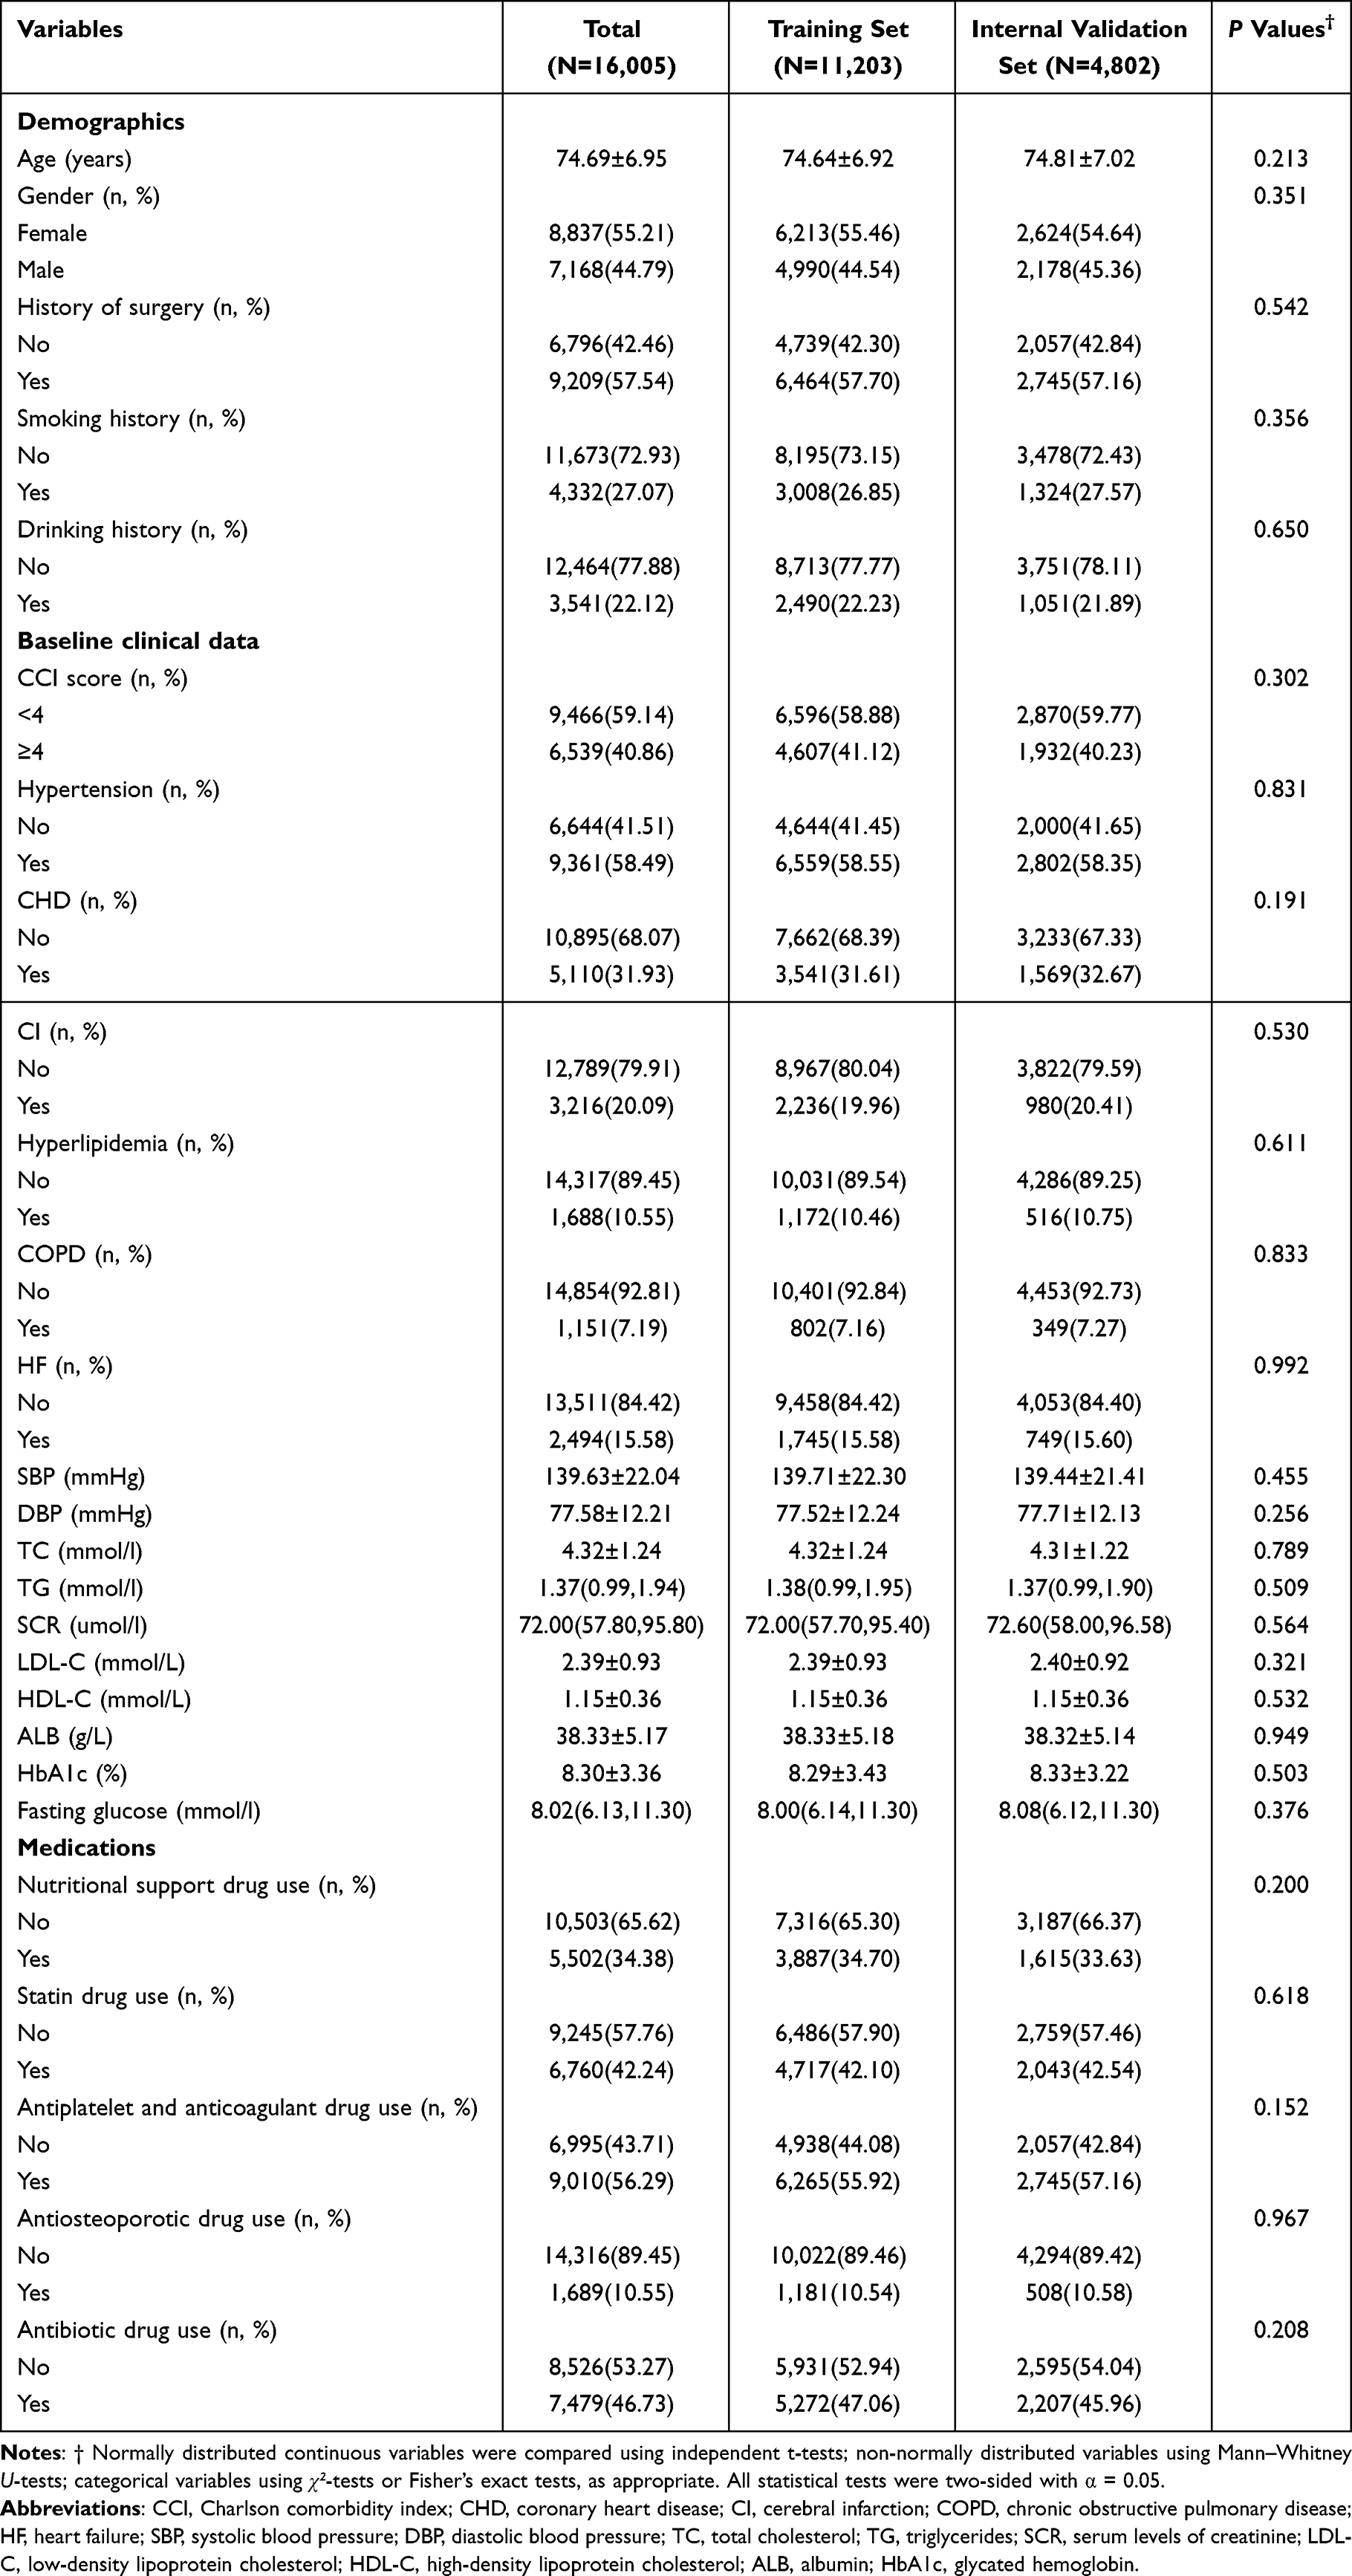 |
Table 1 Baseline Characteristics of Patients in the Training and Internal Validation Sets |
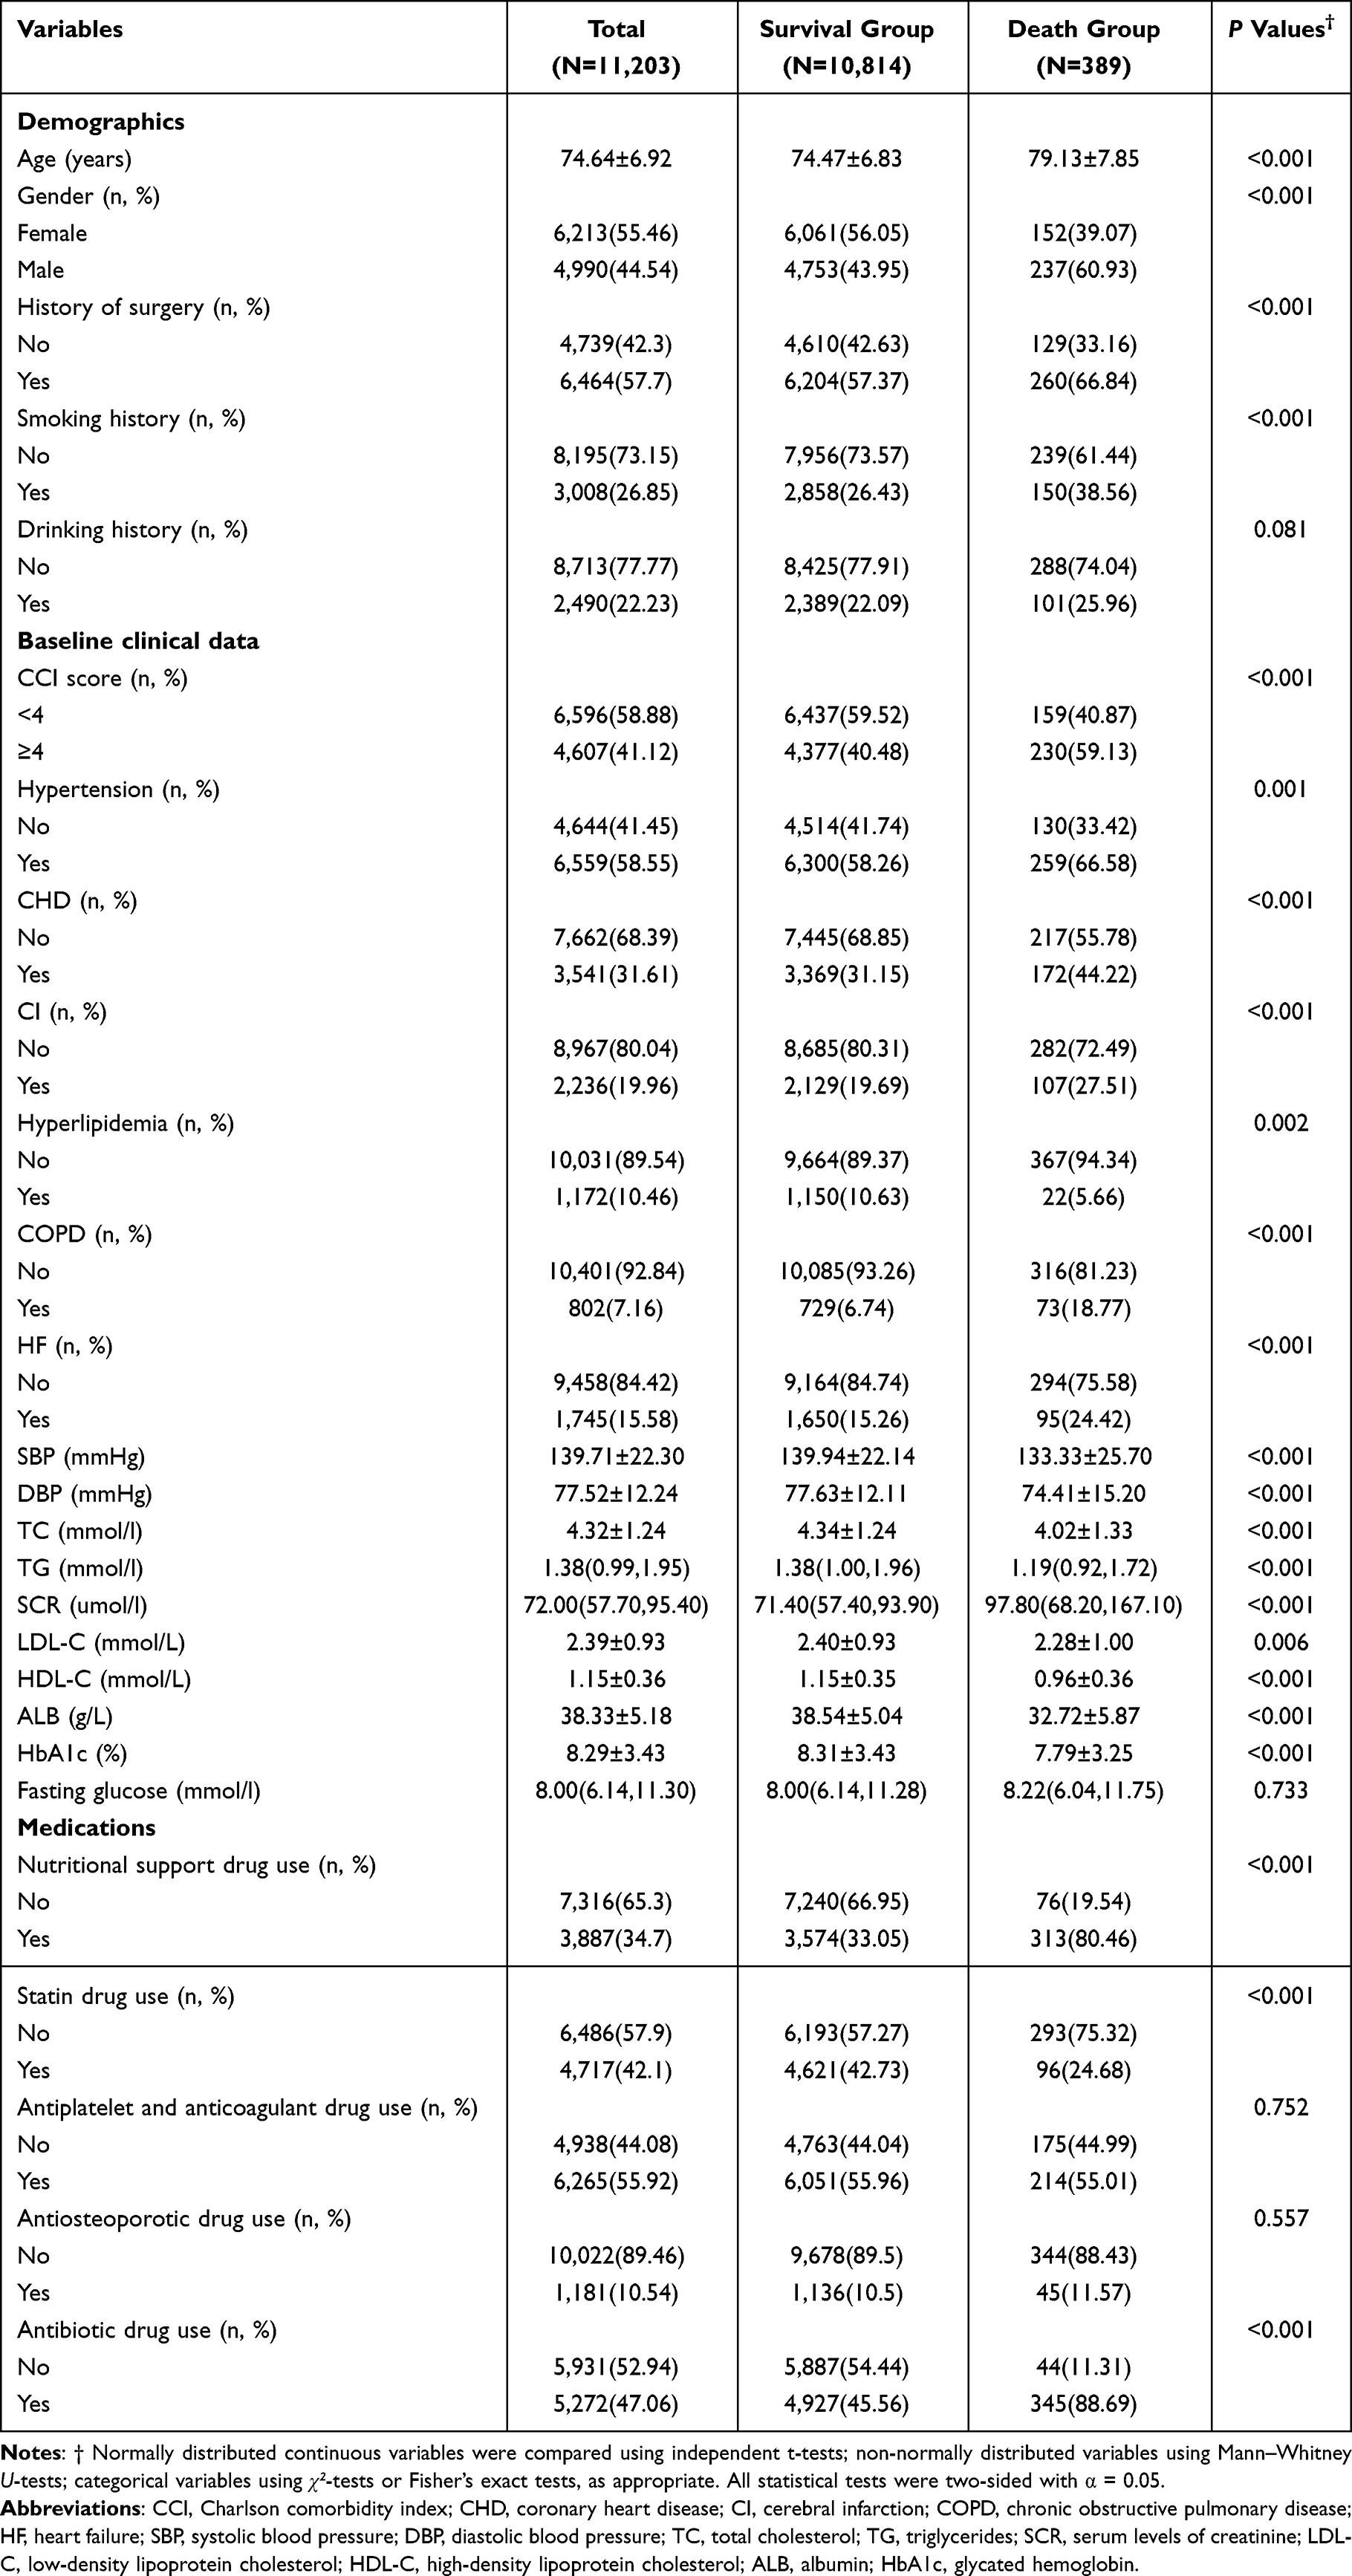 |
Table 2 Univariate Analysis of Variables Associated with in-Hospital Death |
Variable Selection and RCS Analysis
Using LASSO regression (λ = 0.0007266922; lambda.1se), 11 predictors were selected: age, gender, history of surgery, CCI score, CHD, COPD, SCR, ALB, HbA1c, nutritional support drug use, and antibiotic drug use (Figure 1). Validation of feature subsets confirmed that additional variables did not improve model performance (AUROC plateaued beyond 11 predictors; Figure 2). RCS analysis assessed nonlinear relationships between continuous predictors (age, SCR, ALB, and HbA1c) and in-hospital death risk. Nonlinear associations were observed for SCR and ALB (Figure 3). SCR >68 μmol/L and ALB <39 g/L were identified as optimal thresholds for dichotomization. Higher SCR (>68 μmol/L) correlated with increased death risk, while lower ALB (<39 g/L) showed an L-shaped relationship with elevated risk.
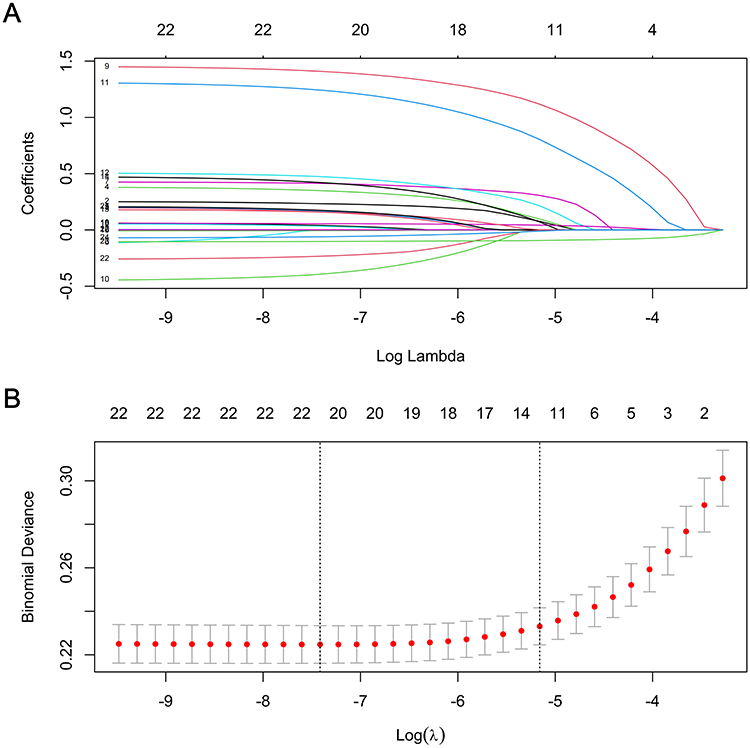 |
Figure 1 Features selection by LASSO. (A) LASSO coefficients profiles (y-axis) of the 23 features. The upper x-axis is the average numbers of predictors and the lower x-axis is the log(λ). (B) 10-fold cross-validation for tuning parameter selection in the LASSO model. The dotted vertical lines were drawn at optimal values by using the minimum criteria and within one standard error range of the minimum criteria. In the LASSO model, we initially conducted 10-fold cross-validation of LASSO to select candidate variables (“glmnet” package). |
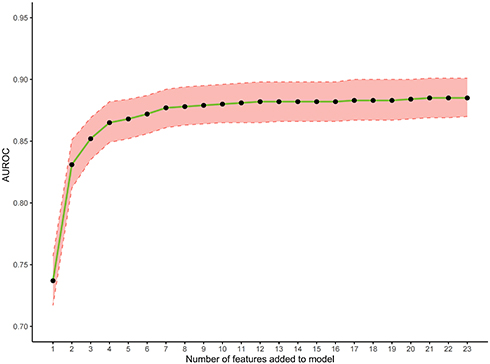 |
Figure 2 Identification the optimal numbers of variables for a prediction of in-hospital death. |
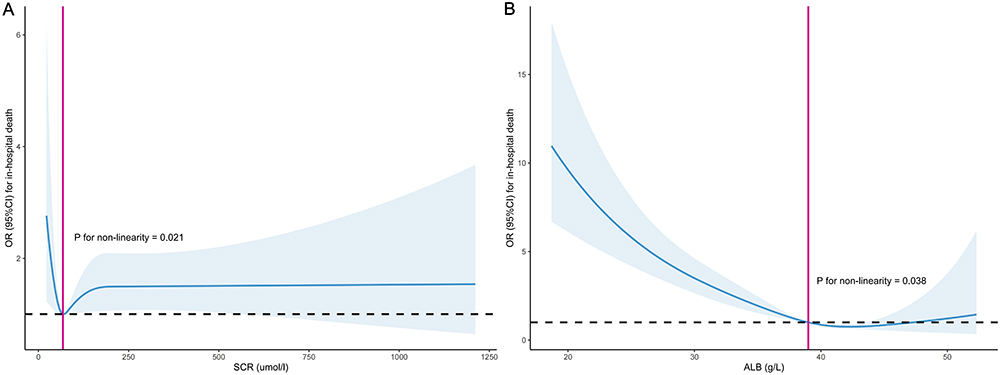 |
Figure 3 RCS curves analysis. (A) Association between SCR and the risk of in-hospital death in older patients with T2DM, P for nonlinear test < 0.05; (B) association between ALB and the risk of in-hospital death in older patients with T2DM, P for nonlinear test < 0.05. |
Univariate and Multivariate Logistic Regression Analysis
Eleven LASSO-selected variables underwent univariate logistic regression, with significant predictors (P < 0.05) included in multivariate backward stepwise regression. The final model retained 11 variables (age, gender, history of surgery, CCI score, CHD, COPD, SCR, ALB, HbA1c, nutritional support drug use, and antibiotic drug use) based on AIC minimization (Table 3).
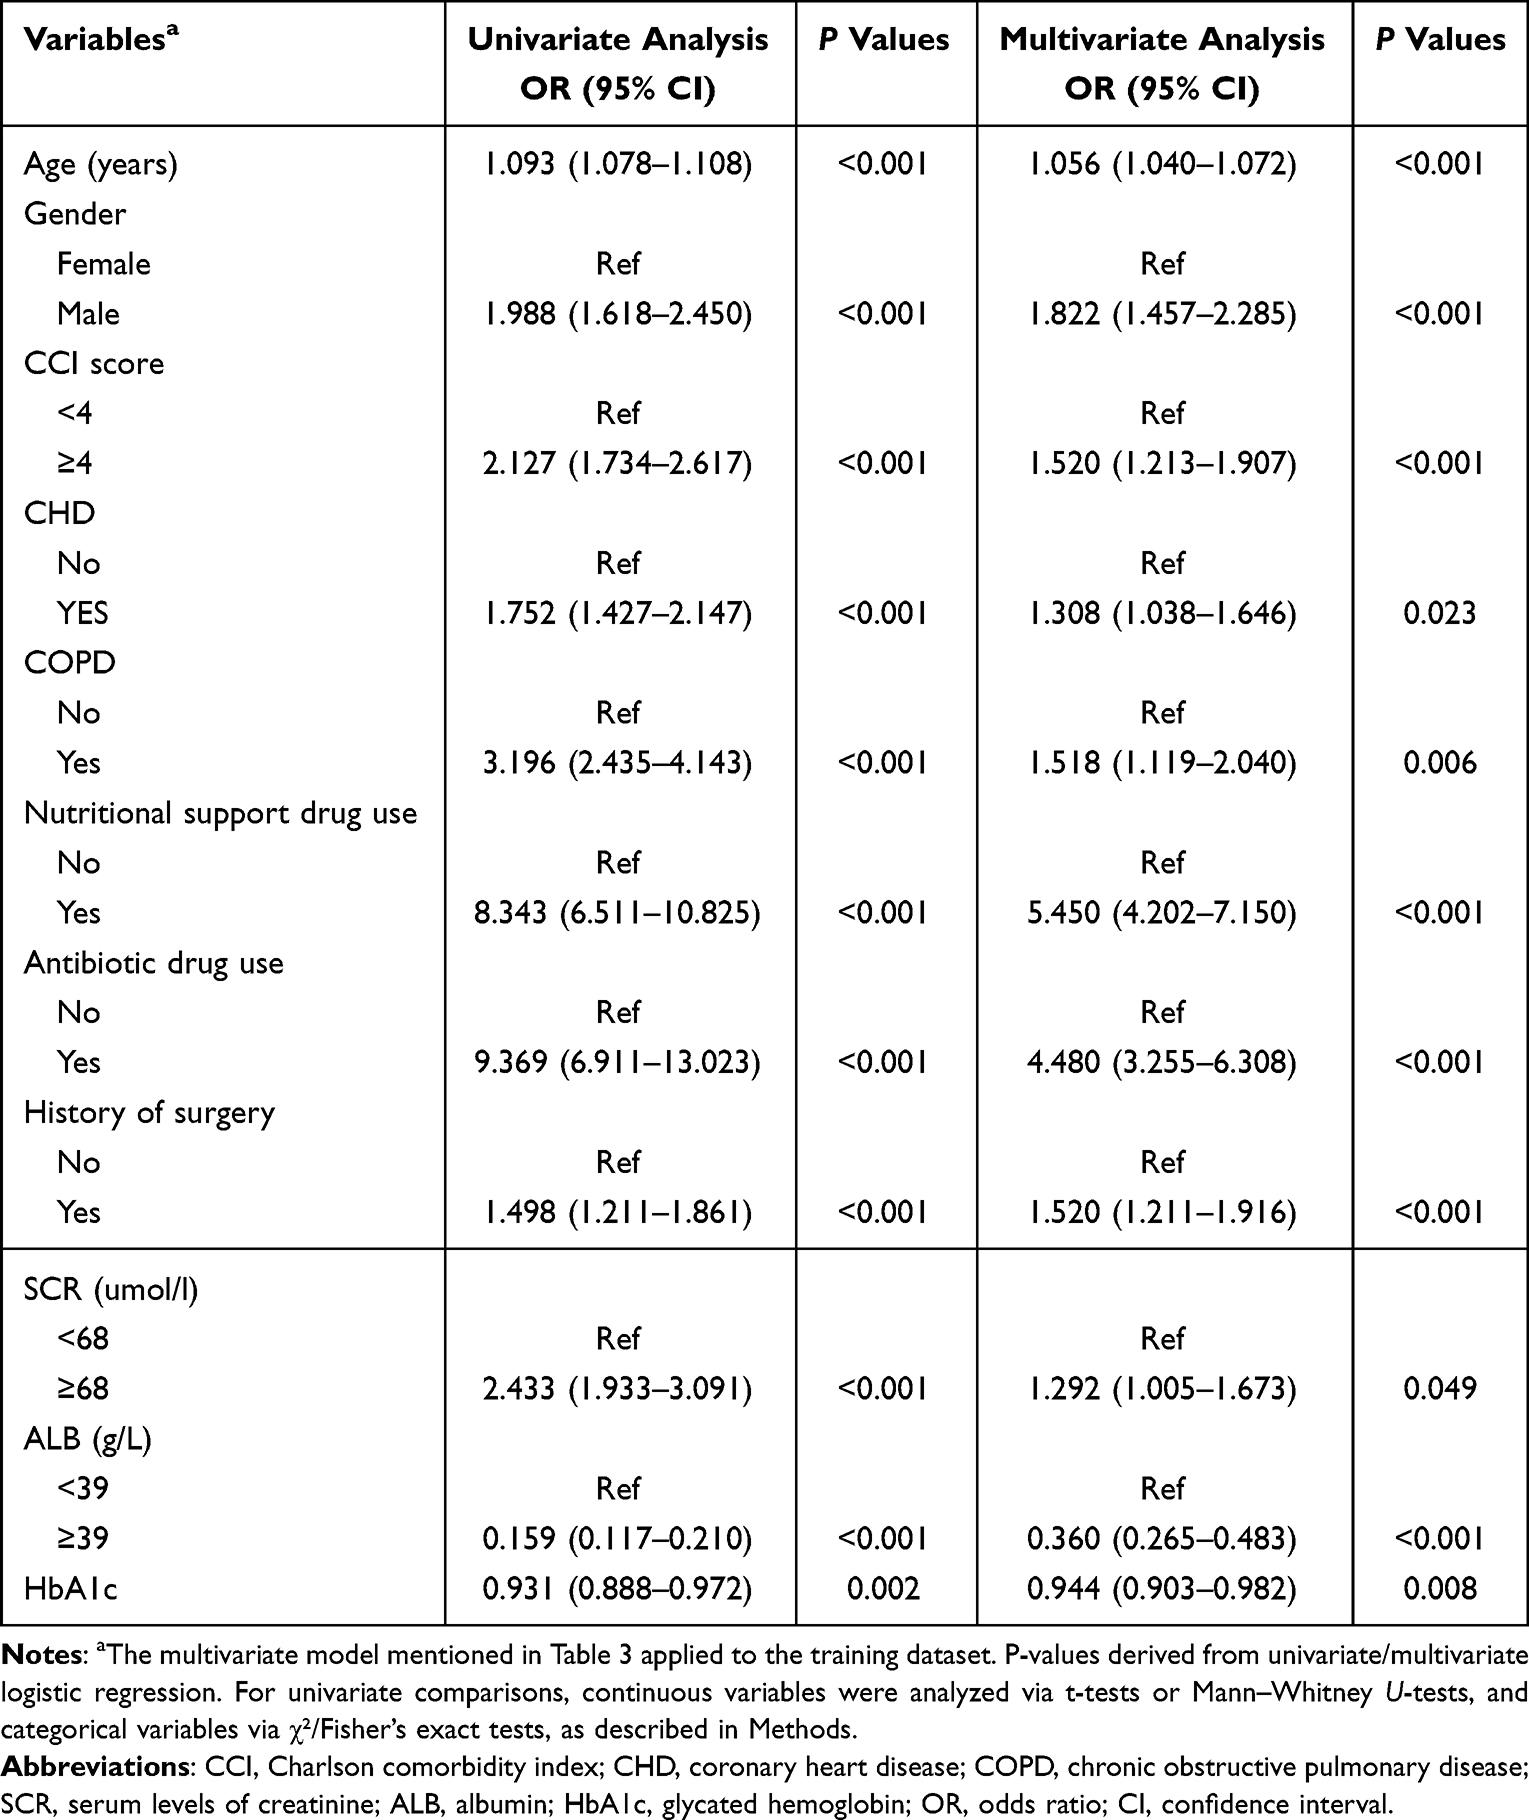 |
Table 3 Univariate and Multivariate Logistic Regression Analysis |
Nomogram Construction and Performance
A nomogram integrating the 11 predictors was developed (Figure 4). Scores for each predictor were summed to estimate total in-hospital death risk. The model demonstrated strong discrimination: AUROC = 0.873 (95% CI: 0.857–0.889) in the training set, 0.830 (0.797–0.864) in internal validation, and 0.834 (0.757–0.911) in external validation (Figure 5). At the optimal cutoff (0.044), sensitivity was 0.792, specificity 0.806, positive likelihood ratio (LR+) 4.082, and negative likelihood ratio (LR−) 0.258 (Table 4). Calibration curves (1,000 bootstraps) indicated excellent calibration (Figure 6). The Nagelkerke R2 values, reflecting the model’s explanatory power, were 0.268 (training set), 0.220 (internal validation), and 0.223 (external validation). The Brier scores in the training, internal validation, and external validation sets were 0.030 (95% CI: 0.027–0.032), 0.027 (95% CI: 0.023–0.030), and 0.016 (95% CI: 0.011–0.022), respectively. DCA revealed net clinical benefit when the in-hospital death risk threshold exceeded 17% (Figure 7). CIC demonstrated close alignment between predicted and actual in-hospital deaths at thresholds >30% for a hypothetical cohort of 1,000 patients (Figure 8).
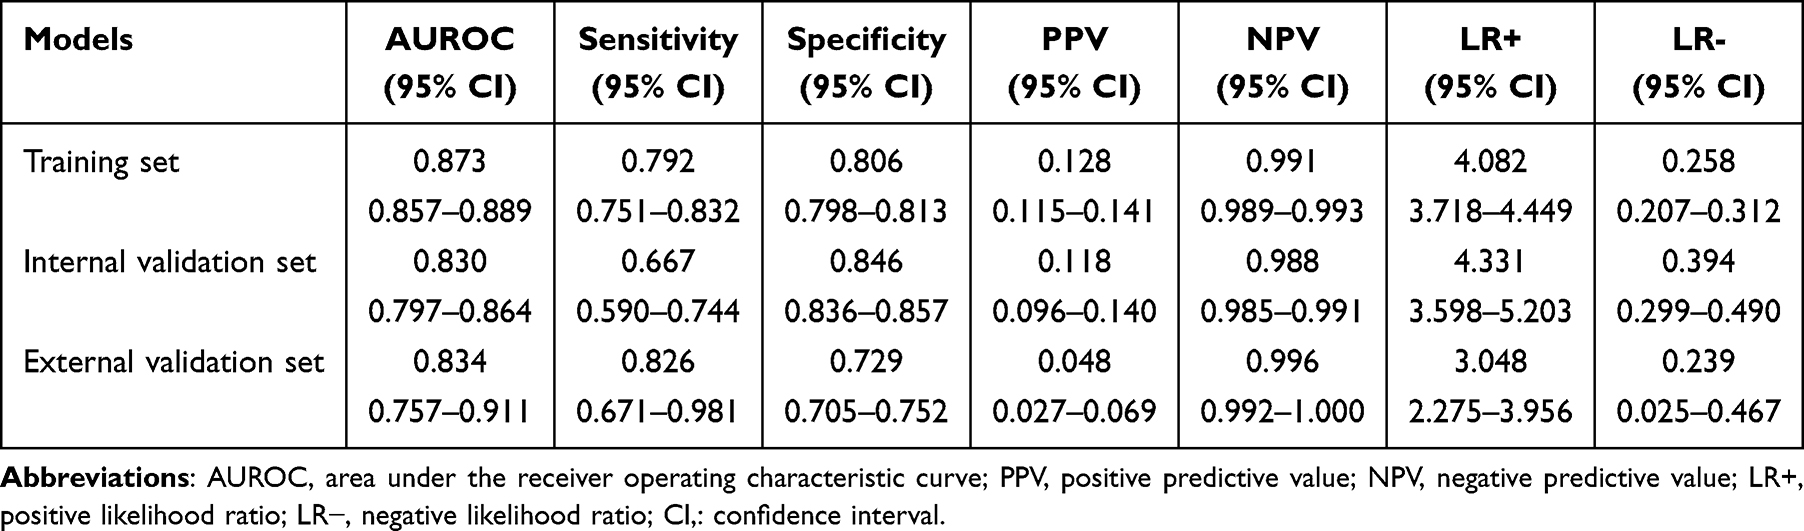 |
Table 4 Detailed Performance Metrics for the Three Datasets |
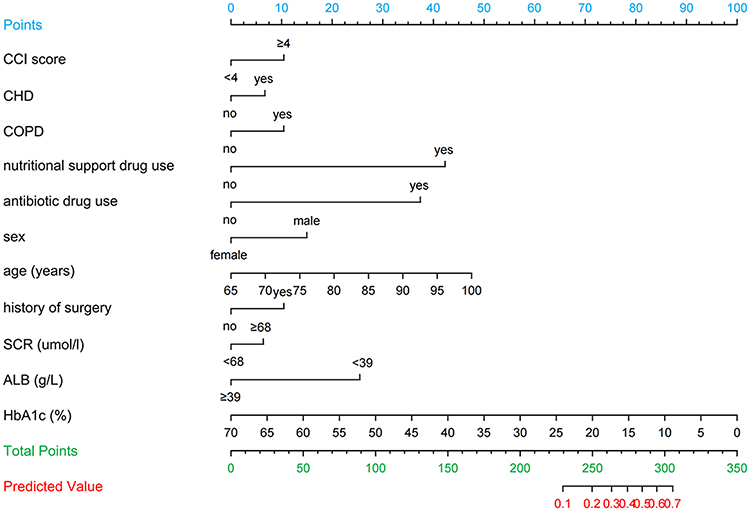 |
Figure 4 The nomogram for predicting in-hospital death based on the training set (n = 11,203). Eleven variables screened by LASSO regression were included in the univariate logistic regression analysis and those variables that were statistically significant (P < 0.05) in the univariate analysis were included in the multivariate logistic regression model in a backward stepwise fashion. The values of each variable were scored between 0 and 100, then added to give the total points score which was then used to predict the probability of in-hospital death. |
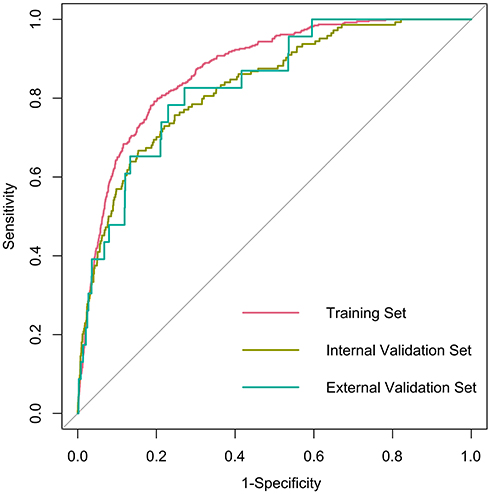 |
Figure 5 The AUROC curves of the nomogram model. The x-axis represents 1-specificity, and the y-axis represents sensitivity. |
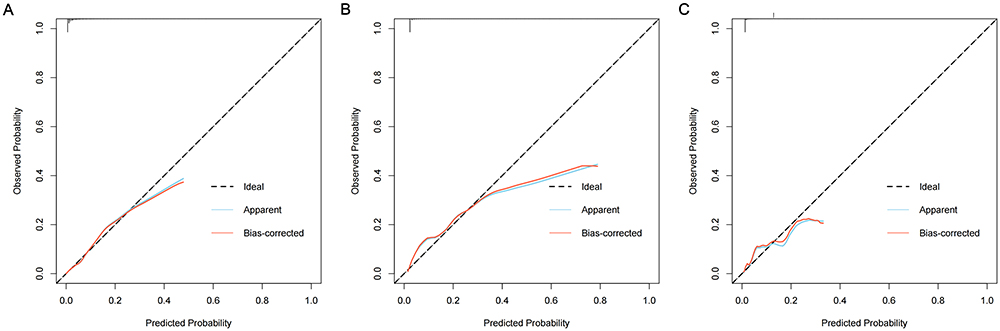 |
Figure 6 Calibration curves of the nomogram. (A) represents the calibration curve of the training set, (B) represents the calibration curve of the internal validation set, and (C) represents the calibration curve of the external validation set. The x-axis represents the predicted probability of in-hospital death. The y-axis represents the actual occurred in-hospital death. The black dashed line represents the perfect prediction with the same predicted probability as the actual probability. The blue dashed line represents the performance of the nomogram and the red solid line represents the performance of the model after calibration. The closer the calibration curve of the model is to the black dashed line, the better the model prediction is represented. |
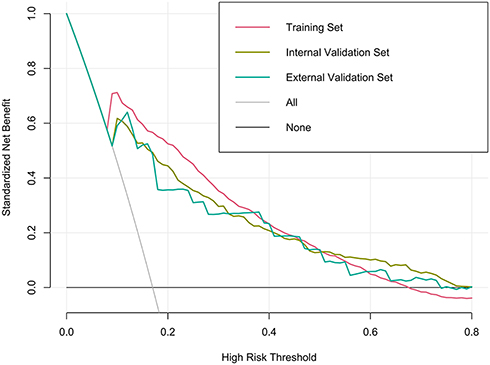 |
Figure 7 Decision curves show identification probability of in-hospital death using nomogram. |
 |
Figure 8 Clinical impact curves show identification probability of in-hospital death using nomogram. (A) indicates the clinical impact curve for the training set, (B) indicates the clinical impact curve for the internal validation set, and (C) indicates the clinical impact curve for the external validation set. Clinical impact curve to identify the in-hospital deaths for a population size of 1000. The blue curve shows the identified number of in-hospital deaths at different threshold probabilities, and the red curve represents actual number of in-hospital deaths. |
When comparing our model with two existing models, our model showed significantly better performance. Specifically, the AUROC values were 0.873 for our model, 0.710 for the Munsakul et al model, and 0.701 for the Liu et al model. The NRI was 0.112 compared to the Munsakul et al model and 0.141 compared to the Liu et al model, indicating that our model provides better risk stratification and reclassification (Supplementary Table S6).
Construction of a Web App to Easily Access the Nomogram
A web-based tool (https://cqykdxtjt.shinyapps.io/in_hospital_death/) was developed for clinical use. As an example, an 80-year-old male had history of surgery, CHD, COPD, CCI ≥4, SCR ≥68 μmol/L, ALB <39 g/L, HbA1c 10%, and concurrent nutritional/antibiotic use had a predicted in-hospital death probability of 36.6% (95% CI: 29.0%–44.8%; Figure 9).
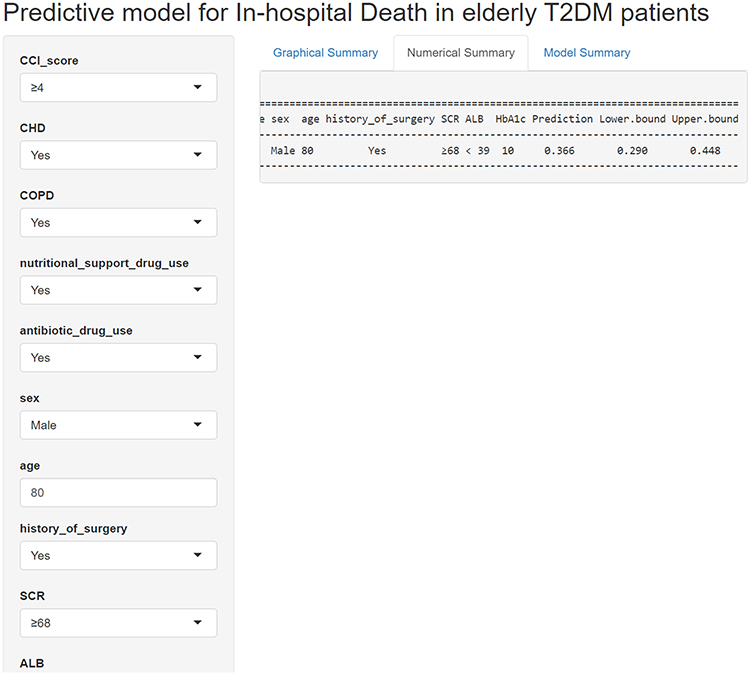 |
Figure 9 An example of in-hospital death prediction using the nomogram in older patients with T2DM via a link. |
Discussion
This study evaluated numerous characteristics and clinical parameters potentially linked to in-hospital death risk in older patients with T2DM. We developed an accessible prediction model incorporating 11 variables—age, gender, history of surgery, CCI score, CHD, COPD, SCR, ALB, HbA1c, nutritional support drug use, and antibiotic drug use. The model demonstrated strong performance, with an AUROC of 0.873, specificity of 0.806, and sensitivity of 0.792.
Our newly developed risk model demonstrates several advantages over existing tools. Unlike the Birmingham Hospital model33 and the American ADHERE-HF,34 which prioritize cardiovascular-specific predictors (eg, troponin, ejection fraction), our model incorporates glycemic control (HbA1c), nutritional status (ALB), and infection-related variables (antibiotic drug use)—factors particularly relevant to older T2DM patients in resource-limited settings. While the Finnish Diabetes Risk Score35 model similarly emphasizes glucose levels, it excludes diabetes-specific markers and fails to address nonlinear risk thresholds. Notably, our SCR cutoff (>68 μmol/L) contrasts with the >115 μmol/L threshold proposed in Jordanian cohorts,36 potentially reflecting ethnic differences in muscle mass and creatinine metabolism. These distinctions highlight the importance of population-specific calibration in predictive modeling.
Consistent with existing literature, our analysis confirms age as a significant in-hospital death risk factor.37–40 The aging process involves progressive decline in physiological functions (eg, immunosenescence and cardiovascular aging), which contributes to more complications, atypical presentations, and consequently delayed treatments in older patients.41–43 Our study revealed a particularly striking gender disparity: male T2DM patients showed significantly higher in-hospital death risk (OR=1.988, 95% CI: 1.618–2.450; P < 0.001). While this aligns with reports from Asian cohorts demonstrating elevated mortality in males with chronic metabolic diseases, several European studies have observed no significant gender differences in T2DM mortality after adjusting for socioeconomic factors.44–48 This discrepancy may reflect regional variations in healthcare access, lifestyle factors, or comorbidity profiles. For instance, lower rates of preventive care utilization among elderly males in rural China—a key contributor to delayed complication management—may amplify biological risk factors.
Our dataset of 17,421 samples included only 556 in-hospital deaths (3.19%), creating significant class imbalance that complicates predictive modeling. Developing predictive models using imbalanced datasets presents significant challenges, as standard classification algorithms—including logistic regression, decision trees, random forests, and deep learning—typically perform best with balanced training data.49,50 To address this issue, researchers have developed various techniques for handling class imbalance, which can be broadly categorized into resampling, algorithmic adjustments, and hybrid approaches.51–53 In medical datasets, where minority class cases (eg, rare clinical outcomes) often carry greater clinical significance than majority class cases, proper handling of imbalance is critical.54 Misclassification of high-risk patients (false negatives) can have severe consequences, making it essential to employ robust methods such as ensemble learning (eg, Balanced Random Forest) or cost-sensitive learning variants of traditional algorithms. The choice of technique depends on factors such as dataset size, imbalance ratio, and clinical requirements, with hybrid approaches often providing the best trade-off between performance and generalizability.
In this study, we developed a predictive model for in-hospital death among older patients with T2DM based on demographic characteristics and admission laboratory parameters. The model demonstrates excellent predictive performance and clinical utility. The predictors incorporated in our model are readily available and cost-effective, significantly enhancing its applicability in primary care hospitals and resource-limited rural areas. Clinicians and nurses can utilize this tool to rapidly and accurately assess mortality risk in older T2DM patients, enabling timely interventions that may reduce death rates. Notably, we have successfully applied this model to older hypertensive patients, where it also shows strong discriminative ability and high clinical value (Supplementary Figure S2).
This study has several strengths, most notably the use of a large, multicenter sample derived from EMR of older patients with T2DM, encompassing both those who experienced in-hospital death and those who did not. However, several limitations should be acknowledged. First, the retrospective design inherently provides weaker evidence than prospective studies, necessitating cautious interpretation of the findings. Second, while we examined key patient characteristics—including demographics, baseline clinical data, and medication use—incorporating additional socioeconomic factors (eg, household income and social status) could enhance the identification of predictors for in-hospital death in this population. Finally, the primary reason for hospitalization was not analyzed, as initial admission diagnoses (eg, “T2DM peripheral neuropathy” for a patient admitted with acute pain) may not fully reflect the actual causes of emergency hospitalization. Future studies with comprehensive data on all relevant covariates are warranted to address these gaps.
Conclusions
In a multicenter cohort of older T2DM patients, we identified age, gender, history of surgery, CCI score, CHD, COPD, SCR, ALB, HbA1c, nutritional support drug use, and antibiotic drug use as key mortality predictors. Optimizing these modifiable factors may reduce in-hospital deaths. Our model serves as a pragmatic screening tool for prioritizing high-risk patients, with potential applications across diverse clinical settings.
Data Sharing Statement
Data supporting the results of this study can be obtained on request to the co-corresponding author Juntao Tan (Email: [email protected]).
Ethics Approval and Consent to Participate
The study protocol was reviewed and approved by the ethics committee of the Affiliated Banan Hospital of Chongqing Medical University. The study was performed in accordance with the ethical standards laid down in the https://www.wma.net/policies-post/wma-declaration-of-helsinki-ethical-principles-for-medical-research-involving-human-subjects/ 1964 Declaration of Helsinki and its later amendments. Since this was a retrospective study, informed consent was not required (The informed consent was waived by the ethics committee of the Affiliated Banan Hospital of Chongqing Medical University).
Code Availability
An online interface (https://cqykdxtjt.shinyapps.io/in_hospital_death/) was developed to provide convenient access for users.
Acknowledgments
We would like to thank all the participants of this project and investigators for collecting the data. We would like to thank Editage (www.editage.com) for English language editing.
Author Contributions
All authors made a significant contribution to the work reported, whether that is in the conception, study design, execution, acquisition of data, analysis and interpretation, or in all these areas; took part in drafting, revising or critically reviewing the article; gave final approval of the version to be published; have agreed on the journal to which the article has been submitted; and agree to be accountable for all aspects of the work.
Funding
This study was funded by Project of Chongqing medical scientific research project (Joint project of Chongqing Health Commission and Science and Technology Bureau) (grant number 2024QNXM017), Scientific and Technological Research Program of Chongqing Municipal Education Commission (grant number KJQN202300454), Banan District Science and Technology Bureau of Chongqing Municipality (grant number BNWJ202300106) and the National Natural Science Foundation of China (grant number 82300004). The funding sources had no role in the study design; in the writing of the report; or in the decision to submit the paper for publication.
Disclosure
The authors of this article declared that there was no conflict of interest related to this manuscript.
References
1. Zghebi SS, Steinke DT, Carr MJ, Rutter MK, Emsley RA, Ashcroft DM. Examining trends in type 2 diabetes incidence, prevalence and mortality in the UK between 2004 and 2014. Diabetes Obesity Metab. 2017;19(11):1537–1545. doi:10.1111/dom.12964
2. Zhou B, Lu Y, Hajifathalian K, et al. Worldwide trends in diabetes since 1980: a pooled analysis of 751 population-based studies with 4·4 million participants. Lancet. 2016;387(10027):1513–1530. doi:10.1016/S0140-6736(16)00618-8
3. Thibault V, Bélanger M, LeBlanc E, et al. Factors that could explain the increasing prevalence of type 2 diabetes among adults in a Canadian province: a critical review and analysis. Diabetol Metab Syndr. 2016;8(1):71. doi:10.1186/s13098-016-0186-9
4. Khan MAB, Hashim MJ, King JK, Govender RD, Mustafa H, Kaabi JA. Epidemiology of Type 2 Diabetes – global Burden of Disease and Forecasted Trends. J Epidemiol Global Health. 2020;10(1):107–111. doi:10.2991/jegh.k.191028.001
5. Sun H, Saeedi P, Karuranga S, et al. IDF diabetes Atlas: global, regional and country-level diabetes prevalence estimates for 2021 and projections for 2045. Diab Res Clin Pract. 2021;183:109119. doi:10.1016/j.diabres.2021.109119
6. Sultan A, Singh J, Howarth FC. Mechanisms underlying electro-mechanical dysfunction in the Zucker diabetic fatty rat heart: a model of obesity and type 2 diabetes. Heart Failure Rev. 2020;25(5):873–886. doi:10.1007/s10741-019-09872-4
7. Roumie CL, Hung AM, Russell GB, et al. Blood Pressure Control and the Association With Diabetes Mellitus Incidence: results From SPRINT Randomized Trial. Hypertension. 2020;75(2):331–338. doi:10.1161/HYPERTENSIONAHA.118.12572
8. Merdzo I, Rutkai I, VNLR S, Katakam PVG, Busija DW. Effects of prolonged type 2 diabetes on mitochondrial function in cerebral blood vessels. Am J Physiol Heart Circulatory Physiol. 2019;317(5):H1086–H92. doi:10.1152/ajpheart.00341.2019
9. Mansour HAA, Mohamed AA, Abdeldayem HM, Mahmoud AF. Correlation between optical coherence tomographic patterns and visual acuity in eyes with diabetic macular edema. QJM: Int J Med. 2020;113(S1):191–192. doi:10.1093/qjmed/hcaa058.034
10. Guo J, Zheng HJ, Zhang W, et al. Accelerated Kidney Aging in Diabetes Mellitus. Oxid Med Cell Longev. 2020;2020:1234059. doi:10.1155/2020/1234059
11. Lasschuit JWJ, Greenfield JR, Tonks KTT. Contribution of peripheral neuropathy to poor bone health in the feet of people with type 2 diabetes mellitus. Acta diabetologica. 2021;59(2):217–224. doi:10.1007/s00592-021-01803-w
12. Li C, Sun X, Zhao S, Scherer PE. Crosstalk between adipose tissue and the heart: an update. J Transl Intern Med. 2022;10(3):219–226. doi:10.2478/jtim-2022-0039
13. Liu M, S-W L, Wang L-J, et al. Burden of diabetes, hyperglycaemia in China from to 2016: findings from the 1990 to 2016, global burden of disease study. Diabetes Metabolism. 2019;45(3):286–293. doi:10.1016/j.diabet.2018.08.008
14. Jia W, Fisher EB. Application and prospect of artificial intellingence in diabetes care. Medical Review. 2023;3(1):102–104. doi:10.1515/mr-2022-0039
15. Bao Y, Meng S, Sun Y, Jie S, Lu L. Healthy China Action plan empowers child and adolescent health and wellbeing. Lancet Public Health. 2019;4(9):e448. doi:10.1016/S2468-2667(19)30164-1
16. Strelitz J, Lawlor ER, Wu Y, et al. Association between weight change and incidence of cardiovascular disease events and mortality among adults with type 2 diabetes: a systematic review of observational studies and behavioural intervention trials. Diabetologia. 2021;65(3):424–439. doi:10.1007/s00125-021-05605-1
17. Pandey A, Khan MS, Patel KV, Bhatt DL, Verma S. Predicting and preventing heart failure in type 2 diabetes. Lancet Diabetes Endocrinol. 2023;11(8):607–624. doi:10.1016/S2213-8587(23)00128-6
18. Vincent J-L, Marshall JC, Ñamendys-Silva SA, et al. Assessment of the worldwide burden of critical illness: the Intensive Care Over Nations (ICON) audit. Lancet Respir Med. 2014;2(5):380–386. doi:10.1016/S2213-2600(14)70061-X
19. Collins GS, Reitsma JB, Altman DG, Moons KGM. Transparent Reporting of a Multivariable Prediction Model for Individual Prognosis or Diagnosis (TRIPOD): the TRIPOD Statement. Eur Urol. 2015;67(6):1142–1151. doi:10.1016/j.eururo.2014.11.025
20. Vittinghoff E, McCulloch CE. Relaxing the Rule of Ten Events per Variable in Logistic and Cox Regression. Ame J Epidemiol. 2007;165(6):710–718. doi:10.1093/aje/kwk052
21. Yu C, Wang J. Data mining and mathematical models in cancer prognosis and prediction. Medical Review. 2022;2(3):285–307. doi:10.1515/mr-2021-0026
22. Darmawan ES, Permanasari VY, Nisrina LV, Kusuma D, Hasibuan SR, Widyasanti N. Behind the Hospital Ward: in-Hospital Mortality of Type 2 Diabetes Mellitus Patients in Indonesia (Analysis of National Health Insurance Claim Sample Data). Int J Environ Res Public Health. 2024;21(5):581. doi:10.3390/ijerph21050581
23. Rokicka D, Hudzik B, Wróbel M, et al. The prognostic impact of insulin resistance surrogates in patients with acute myocardial infarction with and without type 2 diabetes. Cardiovas Diabetol. 2024;23(1):147. doi:10.1186/s12933-024-02240-z
24. Collins GS, Ogundimu EO, Altman DG. Sample size considerations for the external validation of a multivariable prognostic model: a resampling study. Stat Med. 2016;35(2):214–226. doi:10.1002/sim.6787
25. Lee KJ, Tilling KM, Cornish RP, et al. Framework for the treatment and reporting of missing data in observational studies: the Treatment And Reporting of Missing data in Observational Studies framework. J Clin Epidemiol. 2021;134:79–88. doi:10.1016/j.jclinepi.2021.01.008
26. White IR, Royston P, Wood AM. Multiple imputation using chained equations: issues and guidance for practice. Stat Med. 2011;30(4):377–399. doi:10.1002/sim.4067
27. Jardillier R, Koca D, Chatelain F, Guyon L. Prognosis of lasso-like penalized Cox models with tumor profiling improves prediction over clinical data alone and benefits from bi-dimensional pre-screening. BMC Cancer. 2022;22(1):1045. doi:10.1186/s12885-022-10117-1
28. Frndak S, Yu G, Oulhote Y, et al. Reducing the complexity of high-dimensional environmental data: an analytical framework using LASSO with considerations of confounding for statistical inference. Int J Hygiene Environ Health. 2023;249:114116. doi:10.1016/j.ijheh.2023.114116
29. Fitzgerald M, Saville BR, Lewis RJ. Decision Curve Analysis. JAMA. 2015;313(4):409–410. doi:10.1001/jama.2015.37
30. Kerr KF, Brown MD, Zhu K, Janes H. Assessing the Clinical Impact of Risk Prediction Models With Decision Curves: guidance for Correct Interpretation and Appropriate Use. J Clin Oncol. 2016;34(21):2534–2540. doi:10.1200/JCO.2015.65.5654
31. Munsakul N, Manosroi W, Buranapin S. Predictors and Predictive Score of In-Hospital Mortality in Diabetic Ketoacidosis: a Retrospective Cohort Study. Medicina. 2024;60(11):1833. doi:10.3390/medicina60111833
32. Liu L, Zhao YB, Cheng ZT, Li YH, Liu Y. Development and validation of a prognostic model for critically ill type 2 diabetes patients in ICU based on composite inflammatory indicators. Sci Rep. 2025;15(1):3627. doi:10.1038/s41598-025-87731-z
33. Nirantharakumar K, Hemming K, Narendran P, Marshall T, Coleman JJ. A prediction model for adverse outcome in hospitalized patients with diabetes. Diabetes Care. 2013;36(11):3566–3572. doi:10.2337/dc13-0452
34. DeVore AD, Greiner MA, Sharma PP, et al. Development and validation of a risk model for in-hospital worsening heart failure from the Acute Decompensated Heart Failure National Registry (ADHERE). Am Heart J. 2016;178:198–205. doi:10.1016/j.ahj.2016.04.021
35. Saaristo T, Peltonen M, Lindström J, et al. Cross-sectional evaluation of the Finnish Diabetes Risk Score: a tool to identify undetected type 2 diabetes, abnormal glucose tolerance and metabolic syndrome. Diabetes Vasc Dis Res. 2005;2(2):67–72. doi:10.3132/dvdr.2005.011
36. Izraiq M, Almousa E, Hammoudeh S, et al. Impact of Diabetes Mellitus on Heart Failure Patients: insights from a Comprehensive Analysis and Machine Learning Model Using the Jordanian Heart Failure Registry. Int J Gene Med. 2024;17:2253–2264. doi:10.2147/IJGM.S465169
37. Golüke NMS, IEvd V, Vaartjes IH, et al. Risk factors for in-hospital mortality in patients with dementia. Maturitas. 2019;129:57–61. doi:10.1016/j.maturitas.2019.08.007
38. Jiao R, Liu M, Lu X, Zhu J, Sun L, Liu N. Development and Validation of a Prognostic Model to Predict the Risk of In-hospital Death in Patients With Acute Kidney Injury Undergoing Continuous Renal Replacement Therapy After Acute Type a Aortic Dissection. Front Cardiovas Med. 2022;9:891038. doi:10.3389/fcvm.2022.891038
39. Li M, Zhao S, Huang L, Hu C, Zhang B, Hou Q. Establishment and external validation of an online dynamic nomogram for predicting in-hospital death risk in sepsis-associated acute kidney disease. Curr Med Res Opin. 2022;38(10):1705–1713. doi:10.1080/03007995.2022.2101818
40. Mayyas FA, Ibrahim IS. Predictors of mortality among patients with type 2 diabetes in Jordan. BMC Endocr Disord. 2021;21(1):200. doi:10.1186/s12902-021-00866-8
41. Feehan J, Tripodi N, Apostolopoulos V. The twilight of the immune system: the impact of immunosenescence in aging. Maturitas. 2021;147(prepublish):7–13. doi:10.1016/j.maturitas.2021.02.006
42. Sweeney M, Cook SA, Gil J. Therapeutic opportunities for senolysis in cardiovascular disease. FEBS J. 2022;290(5):1235–1255. doi:10.1111/febs.16351
43. Wang Y, Lau WB, Ma X. “Know Diabetes by Heart”: role of adipocyte-cardiomyocyte communications. Medical Review. 2021;1(1):14–17. doi:10.1515/mr-2021-0008
44. Lee Y, Yoon M, Choi DJ, Park JJ. Differential Effect of Sex on Mortality According to Age in Heart Failure. J Am Heart Assoc. 2024;13(15):e034419. doi:10.1161/JAHA.124.034419
45. Yang J, Wu S, Liu Y, et al. Gender disparities in all-cause mortality among individuals with early-onset cardiovascular diseases. BMC Public Health. 2024;24(1):1450. doi:10.1186/s12889-024-18908-w
46. Kaptoge S, Seshasai S, Sun L, Emerging Risk Factors Collaboration. Life expectancy associated with different ages at diagnosis of type 2 diabetes in high-income countries: 23 million person-years of observation. Lancet Diabetes Endocrinol. 2023;11(10):731–742. doi:10.1016/S2213-8587(23)00223-1
47. Vitale M, Orsi E, Solini A, et al. Association between age at diagnosis and all-cause mortality in type 2 diabetes: the Renal Insufficiency and Cardiovascular Events (RIACE) Italian Multicenter Study. Acta Diabetologica. 2024;61(9):1107–1116. doi:10.1007/s00592-024-02294-1
48. Igland J, Forster R, Jenum AK, et al. How valid is a prescription-based multimorbidity index (Rx-risk) in predicting mortality in the Outcomes and Multimorbidity In Type 2 diabetes (OMIT) study? A nation-wide registry-based cohort study from Norway. BMJ Open. 2024;14(3):e077027. doi:10.1136/bmjopen-2023-077027
49. Pravali M, Manjubala B. Diversity based imbalance learning approach for software fault prediction using machine learning models. Appl Soft Comput J. 2022;124:1.
50. Liu L, Wu X, Li S, Li Y, Tan S, Bai Y. Solving the class imbalance problem using ensemble algorithm: application of screening for aortic dissection. BMC Med Inf Decision Making. 2022;22(1):82. doi:10.1186/s12911-022-01821-w
51. Mulugeta G, Zewotir T, Tegegne AS, Juhar LH, Muleta MB. Classification of imbalanced data using machine learning algorithms to predict the risk of renal graft failures in Ethiopia. BMC Med Inf Decision Making. 2023;23(1):98. doi:10.1186/s12911-023-02185-5
52. Yang C, Fridgeirsson EA, Kors JA, Reps JM, Rijnbeek PR. Impact of random oversampling and random undersampling on the performance of prediction models developed using observational health data. J Big Data. 2024;11(1). doi:10.1186/s40537-023-00857-7
53. Zhang F, Petersen M, Johnson L, Hall J, O’Bryant SE. Hyperparameter Tuning with High Performance Computing Machine Learning for Imbalanced Alzheimer’s Disease Data. Appl Sci. 2022;12(13):6670. doi:10.3390/app12136670
54. Karajizadeh M, Nasiri M, Yadollahi M, Zolfaghari AH, Pakdam A. Mortality Prediction from Hospital-Acquired Infections in Trauma Patients Using an Unbalanced Dataset. Healthcare Inform Res. 2020;26(4):284–294. doi:10.4258/hir.2020.26.4.284
 © 2025 The Author(s). This work is published and licensed by Dove Medical Press Limited. The
full terms of this license are available at https://www.dovepress.com/terms
and incorporate the Creative Commons Attribution
- Non Commercial (unported, 4.0) License.
By accessing the work you hereby accept the Terms. Non-commercial uses of the work are permitted
without any further permission from Dove Medical Press Limited, provided the work is properly
attributed. For permission for commercial use of this work, please see paragraphs 4.2 and 5 of our Terms.
© 2025 The Author(s). This work is published and licensed by Dove Medical Press Limited. The
full terms of this license are available at https://www.dovepress.com/terms
and incorporate the Creative Commons Attribution
- Non Commercial (unported, 4.0) License.
By accessing the work you hereby accept the Terms. Non-commercial uses of the work are permitted
without any further permission from Dove Medical Press Limited, provided the work is properly
attributed. For permission for commercial use of this work, please see paragraphs 4.2 and 5 of our Terms.
Recommended articles
Predictive Value and Correlation Study of HOMA2 IR-CP and TyG-BMI for Metabolic Dysfunction-Associated Steatotic Liver Disease in Patients with Type 2 Diabetes Mellitus
Cao Q, Tian Q, Liu Y, Cheng Y, Luo T, Zhu X
Diabetes, Metabolic Syndrome and Obesity 2025, 18:4247-4261
Published Date: 16 November 2025
Development and Validation of a Nomogram for Predicting Chronic Kidney Disease in Older Patients with Type 2 Diabetes Mellitus and Cardiovascular Disease
Gu J, Chen J, Wang J, Zhu Z, Huang L, Deng Q, Li Y, You L, Zuo Y
Journal of Multidisciplinary Healthcare 2026, 19:604550
Published Date: 11 May 2026
Machine Learning-Based Prediction Model for Type 2 Diabetic Peripheral Neuropathy: Role of Bilateral Brachial-Ankle Pulse Wave Velocity and Anthropometric Indicators
Zhang Z, Sun L, Wang Y, Wang Y
International Journal of General Medicine 2026, 19:601767
Published Date: 26 June 2026