
Back to Journals » Journal of Pain Research » Volume 19
Predicting Treatment Response to Pulsed Radiofrequency in Postherpetic Neuralgia Using an Explainable Machine Learning Model
Authors Li Y  , Shen B, Zhai N, Chen C, Dang C
Received 13 April 2026
Accepted for publication 27 June 2026
Published 10 July 2026 Volume 2026:19 616433
DOI https://doi.org/10.2147/JPR.S616433
Checked for plagiarism Yes
Review by Single anonymous peer review
Peer reviewer comments 2
Editor who approved publication: Dr Alaa Abd-Elsayed
Yajun Li,1,* Baohong Shen,1,* Nannan Zhai,1 Chong Chen,2 Changlin Dang2
1Department of Pain, The First Affiliated Hospital of Henan Medical University, Xinxiang, 453100, People’s Republic of China; 2Department of First Ward of Rehabilitation, The First Affiliated Hospital of Henan Medical University, Xinxiang, 453100, People’s Republic of China
*These authors contributed equally to this work
Correspondence: Yajun Li, Department of Pain, The First Affiliated Hospital of Henan Medical University, No. 88 Jiankang Road, Weihui, Xinxiang, Henan, 453100, People’s Republic of China, Tel +86-13781960498, Email [email protected]
Objective: Postherpetic neuralgia (PHN) is a chronic neuropathic pain disorder with substantial heterogeneity in response to pulsed radiofrequency (PRF). This study aimed to develop and validate an explainable machine learning (ML) model for predicting PRF efficacy in PHN patients.
Methods: This single-center retrospective study included 404 PHN patients treated with PRF between January 2022 and December 2024. Patients were randomly assigned to a training set (n=283) and a validation set (n=121). Treatment efficacy was assessed 6 months after discharge. LASSO and the Boruta algorithms were used for feature selection. Six ML algorithms were developed and compared. Model performance was evaluated by area under the receiver operating characteristic curve (AUC), calibration, and decision curve analysis. SHapley Additive exPlanations (SHAP) were used to interpret the optimal model.
Results: Of the 404 patients, 255 (63.12%) were classified as effective and 149 (36.88%) as ineffective. Six predictors were finally selected: age, duration of pain, diabetes mellitus (DM), tumor necrosis factor-α (TNF-α), interleukin-6 (IL-6), and brain-derived neurotrophic factor (BDNF). Among the candidate models, the random forest (RF) model showed the best overall predictive performance, with an AUC of 0.878 (95% CI: 0.806– 0.949) in the validation set. SHAP analysis indicated that older age, longer pain duration, DM, and higher TNF-α and IL-6 were associated with poor response, whereas higher BDNF was associated with better outcome.
Conclusion: An explainable ML model for predicting PRF efficacy in PHN patients was developed, and the RF model showed the best predictive performance. This model may assist individualized risk stratification and support clinical decision-making, but further prospective multicenter validation is required.
Keywords: postherpetic neuralgia, pulsed radiofrequency, explainable machine learning, treatment response, SHapley Additive exPlanations
Introduction
Postherpetic neuralgia (PHN), a persistent neuropathic pain disorder, is widely recognized as one of the most prominent and frequent complications following herpes zoster (HZ).1 Once established, PHN is characterized by persistent spontaneous or evoked pain, often accompanied by sensory abnormalities, sleep disturbances, anxiety, and depression, which severely impair patients’ quality of life.2,3 The chance of getting PHN varies significantly across studies, ranging from around 5% to more than 30%, according to epidemiological research. This fluctuation suggests significant clinical heterogeneity among patients and may be explained by variations in research design, follow-up period, and definitions of PHN.4
The management of PHN remains challenging. Current treatment strategies include pharmacological treatment, topical therapy, nerve block, and other interventional approaches; however, overall efficacy is still limited, and substantial inter-individual variability in treatment response exists.5 In the past few years, pulsed radiofrequency (PRF) has been increasingly used as a minimally invasive intervention for PHN.6 Owing to its favorable safety profile and limited thermal injury to neural tissue, PRF has shown potential in relieving pain and improving patient outcomes.7,8 Nevertheless, the therapeutic response to PRF is not uniform, and marked differences in efficacy are frequently observed among patients. Therefore, determining which individuals are more inclined to gain benefits from PRF is very important from a therapeutic standpoint.
Accurate prediction of treatment efficacy is essential for improving individualized management of PHN. While traditional statistical methods have helped identify predictive markers, they may not be enough to capture the intricate nonlinear correlations and high-order interactions that are often seen in clinical data. Machine learning (ML) has become a highly promising approach for prognostic prediction due to its ability to analyze multidimensional variables and detect hidden patterns beyond traditional modeling strategies.9 However, the lack of interpretability in many ML models remains a major barrier to their adoption in clinical settings. Explainable ML provides an opportunity to overcome this limitation by improving the transparency of prediction models and clarifying the contribution of individual variables.10 For PHN patients undergoing PRF treatment, an explainable predictive model may not only improve risk stratification and outcome prediction but also help clinicians better understand the factors associated with treatment efficacy. To improve individualized management of PHN, this study aimed to establish an explainable ML model based on clinical data for predicting the effectiveness of PRF and for identifying the key variables associated with treatment outcomes.
Materials and Methods
Study Design and Participants
A total of 404 patients diagnosed with PHN and treated with PRF at our institution between January 2022 and December 2024 were included in this retrospective analysis. PHN was diagnosed in accordance with established clinical criteria, based on medical history, clinical manifestations, and findings from ancillary examinations. The inclusion criteria were as follows: (1) PHN diagnosis based on accepted diagnostic standards;11 (2) being at least 18 years old; (3) voluntary receipt of PRF treatment due to poor response to drug therapy; (4) full medical information. Exclusion criteria: (1) the existence of other chronic pain conditions, including trigeminal neuralgia or diabetic peripheral neuropathy; (2) puncture-site systemic or local infection; (3) abuse of sedatives or opioid analgesics; (4) mental or cognitive disability preventing assessment cooperation; (5) severe organ dysfunction; and (6) concomitant malignant tumors or hematologic disorders. The research comprised 404 patients who were randomly allocated to the training and validation sets at a 7:3 ratio after following the criteria for inclusion and exclusion. The study flow is shown in Figure 1.
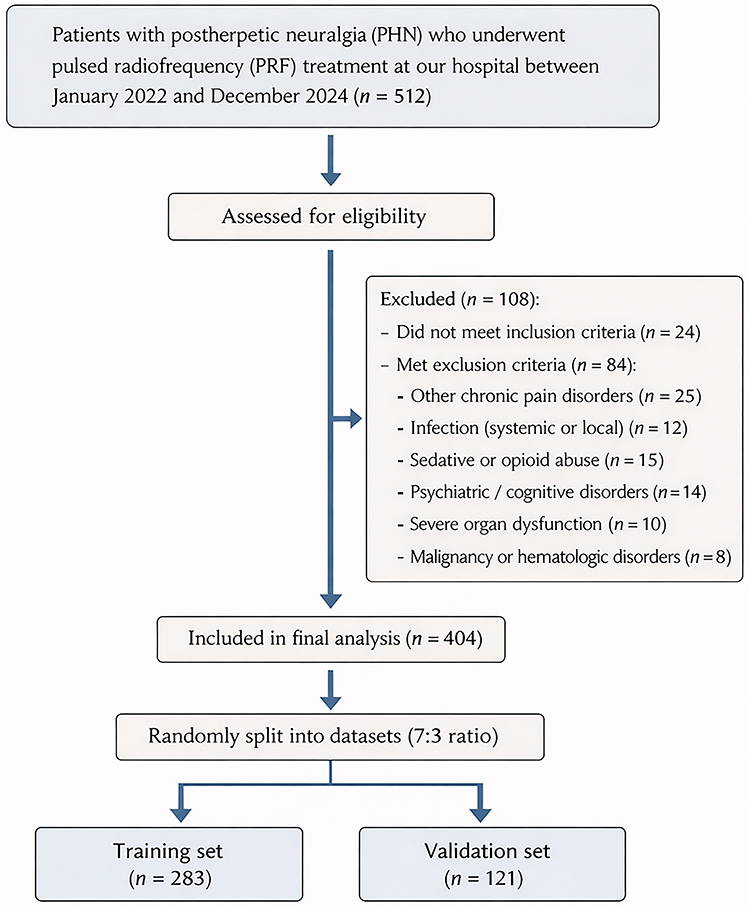 |
Figure 1 Flow diagram of patient selection and dataset allocation. |
PRF Treatment Procedure
After admission, all patients received PRF treatment using an R-2000B M1 radiofrequency temperature-controlled coagulator (Beijing Beiqi Medical Technology Co., Ltd., Beijing, China). Before treatment, the responsible nerve corresponding to the pain was identified comprehensively based on medical history, physical examination, and diagnostic nerve block tests. Under CT guidance, the anatomical course of the target nerve was localized and the puncture site was marked. With patients in a comfortable position, routine disinfection of the puncture site was performed. A radiofrequency puncture needle was then inserted along the predetermined trajectory toward the target nerve, followed by placement of the radiofrequency electrode. Motor and sensory stimulation tests were conducted at 2 Hz/1 V and 50 Hz/0.2–0.5 V, respectively. Correct needle tip placement was confirmed when the patient reported abnormal sensation in the affected dermatome without muscle twitching. After aspiration confirmed the absence of cerebrospinal fluid, air, or blood, PRF treatment was initiated. Treatment parameters: frequency, 2 Hz; voltage, 45–85 V; pulse width, 20 ms; electric field intensity, 60 V to the maximum intensity tolerated by the patient; and temperature≤42°C. The voltage range of 45–85 V was selected based on routine clinical practice and supported by prior studies suggesting that PRF voltage is an important parameter in optimizing analgesic outcomes in PHN patients.12,13 PRF is primarily neuromodulatory rather than neurodestructive, and the maximum voltage was adjusted individually according to patient tolerance to achieve sufficient electric field strength without causing significant discomfort or exceeding safe temperature limits. This approach was routinely applied to all patients following the standard clinical practice of our institution and was not solely based on operator preference. Although the allowable voltage range was 45–85 V, the actual delivered voltages in this cohort were concentrated within a relatively narrow range, with a mean value of 51.42 ± 4.95 V. Voltage was adjusted using the same stepwise institutional procedure for all patients, starting from a low level and gradually increasing to the maximum tolerated level without exceeding the safety temperature limit of 42°C. Each treatment session lasted 15 min. After puncture, the needle was removed, haemostasis was established by compression, and a sterile dressing was placed. After 20 minutes of observation, patients were brought back to the ward if no anomalies were found. PRF treatment was administered once every 3 days, for a total of three sessions.
Efficacy Assessment and Grouping
Clinical efficacy was assessed at 6 months after discharge. The numerical rating scale (NRS) was used to quantify the level of pain; values ranged from 0 to 10, with higher scores indicating more severe pain.14 Baseline NRS scores were recorded before treatment, and follow-up NRS scores were collected at 6 months after discharge. Patients were classified as ineffective if their NRS score decreased by <50% from baseline at 6 months, or if they developed pain-related anxiety or depression requiring pharmacological intervention, or pain-related sleep disturbance. The remaining patients were classified as the effective group.
Postoperative Analgesic and Neuropathic Pain Medications
Immediately after PRF treatment, patients continued their preoperative neuropathic pain medications, such as pregabalin, gabapentin, or duloxetine, at their baseline dosages. However, subsequent medication adjustment during follow-up was not governed by a study-specific standardized protocol and was made according to individual clinical needs and physician judgment. Any escalation of neuropathic pain medications or use of additional analgesics due to uncontrolled pain was recorded in the medical chart and considered when determining treatment efficacy at 6 months. Patients requiring medication escalation because of inadequate pain control, or those who developed pain-related anxiety, depression, or sleep disturbance requiring pharmacological intervention, were classified into the ineffective group.
Data Collection
General Information
A self-designed baseline data collection form was used. Trained investigators uniformly recorded the baseline characteristics of all patients. The collected data mainly included demographic characteristics (sex, age, body mass index (BMI), smoking status, and drinking status), disease-related characteristics (duration of pain and pain site), comorbidities (hypertension, diabetes mellitus (DM), hyperlipidemia, and coronary heart disease (CHD)), and treatment-related variables (voltage and target nerve).
Laboratory Indicators
Before treatment, 9 mL of fasting venous blood was collected from all study participants and divided into three specialized blood collection tubes. In the first tube, EDTA anticoagulant was added. A MEK-7300P automated hematology analyzer (Shanghai Kohden Medical Electronic Instrument Co., Ltd.) was used to measure white blood cell count (WBC), neutrophil percentage, and lymphocyte count (LYM). In the second tube, EDTA anticoagulant was also added. A UP5000 coagulation analyzer (Shanghai Sun Biotechnology Co., Ltd.) was used to determine prothrombin time (PT), activated partial thromboplastin time (APTT), and fibrinogen (FIB) levels. The third tube was centrifuged under routine conditions at 3000 r/min with a centrifugation radius of 15 cm for 20 min, and the serum was collected. A Stream SuperB-2000 automated biochemical analyzer (Guangzhou Daan Gene Co., Ltd.) was used to measure alanine aminotransferase (ALT), aspartate aminotransferase (AST), serum creatinine (Scr), blood urea nitrogen (BUN), tumor necrosis factor-α (TNF-α), interleukin-6 (IL-6), C-reactive protein (CRP), brain-derived neurotrophic factor (BDNF), and albumin levels. All tests were performed in strict accordance with the instrument manuals and relevant industry standards to ensure the accuracy and reliability of the results. All laboratory indicators included in this study were obtained as part of routine clinical assessment for patients with PHN at our institution prior to PRF treatment. These examinations were performed according to standardized institutional protocols and were not specifically collected for research purposes. These laboratory biomarkers were not prospectively collected in a dedicated research database; instead, they were retrospectively retrieved from electronic medical records for the present analysis.
Data Preprocessing and Feature Selection
Prior to model development, all candidate variables were checked for completeness and consistency. Since no missing data were identified in the dataset, no imputation procedure was performed. Continuous variables were kept as numerical variables, whereas categorical variables were encoded appropriately for subsequent analysis. Standardization of continuous variables was performed when required to improve the stability of feature selection and model training.
A multistep procedure was used to screen candidate predictors in the training set. Specifically, LASSO regression was introduced to suppress the contribution of weakly informative variables while highlighting those with greater predictive relevance. The degree of penalization was optimized by cross-validation, and features that survived the shrinkage process were retained. In the Boruta procedure, feature relevance was assessed through iterative comparison with shadow attributes generated from the original variables, and confirmed important features were retained. Finally, only the variables simultaneously selected by both algorithms were included in the final ML models.
Model Development and Optimal Model Selection
Using the final variables selected above, multiple ML models were established in the training set to predict treatment response after PRF in patients with PHN. Candidate algorithms included k-nearest neighbor (KNN), extreme gradient boosting (XGBoost), decision tree (DT), logistic regression (LR), support vector machine (SVM) and random forest (RF). The training dataset was used to train all models, whereas the validation dataset was only utilised to independently evaluate predicted performance. In the training phase, grid search with cross-validation was used to determine the optimal hyperparameter settings for each algorithm, helping to strengthen model robustness and prevent overfitting. A thorough comparison was made between the prediction performance of various models. The area under the receiver operating characteristic (ROC) curve (AUC) was used as the primary criterion for model discrimination, while accuracy, sensitivity, specificity, precision, recall, and F1-score were also taken into consideration. We chose the best performing model for interpretation and assessment based on its overall performance in the validation set.
Model Evaluation and Interpretability
After the optimal ML model was identified, its performance was further characterized using confusion matrices, calibration analysis, and decision curve analysis (DCA). To show the final model’s classification results graphically, confusion matrices were created in the training and validation sets. To evaluate the degree of agreement between observed results and expected probability, calibration curves were produced. Furthermore, DCA was used to assess the resulting model’s potential therapeutic value across a variety of threshold probabilities.
Interpretation of the final model was performed using SHapley Additive exPlanations (SHAP) to improve both transparency and potential clinical utility. By decomposing model predictions into feature-level contributions, SHAP made it possible to determine which variables played the most important roles in PRF treatment response among patients with PHN. A summary plot was used to present the overall impact of each predictor and the direction of its influence, while dependence plots provided further insight into the association between key features and the predicted response. Patient-specific explanation plots were also constructed to illustrate how individual predictors shaped the estimated probability of treatment benefit.15
Statistical Analysis
All statistical analyses were performed using R software (version 4.3.2). Continuous variables were expressed as mean ± standard deviation (SD) for normally distributed data or median with interquartile range (IQR) for non-normally distributed data, whereas categorical variables were presented as frequencies and percentages. Group comparisons were performed using the independent-samples t-test or Mann–Whitney U-test for continuous variables, and the chi-square test for categorical variables.
Before feature selection and model construction, multicollinearity among candidate variables was evaluated by calculating variance inflation factors (VIFs) with the “car” package, and variables with VIF > 5 were considered to indicate potential collinearity. Feature selection was performed by LASSO regression and the Boruta algorithm using the “glmnet” and “Boruta” packages, respectively. Model training, data partitioning, and hyperparameter tuning were conducted using the “tidymodels” package. Discrimination, calibration, and clinical utility were assessed using the “pROC”, “rms”, and “rmda” packages, respectively. SHAP analysis was performed using the “fastshap” package, and the results were visualized with the “shapviz” package. A two-sided P value <0.05 was considered statistically significant.
Results
Patient Characteristics in the Training and Validation Sets
A total of 404 patients with PHN who underwent PRF treatment were included in this study, of whom 283 were assigned to the training set and 121 to the validation set. Overall, 255 patients (63.12%) were classified into the effective group and 149 (36.88%) into the ineffective group. The mean age of the overall cohort was 56.00 ± 4.95 years, and 188 patients (46.53%) were male, while 216 (53.47%) were female. The distribution of treatment outcomes was comparable between the training set and validation set (P = 0.593). No statistically significant differences were observed between the two sets in baseline characteristics, including demographic features, disease-related variables, comorbidities, treatment-related variables, and laboratory indicators (all P > 0.05), indicating good comparability between the two datasets (Table 1).
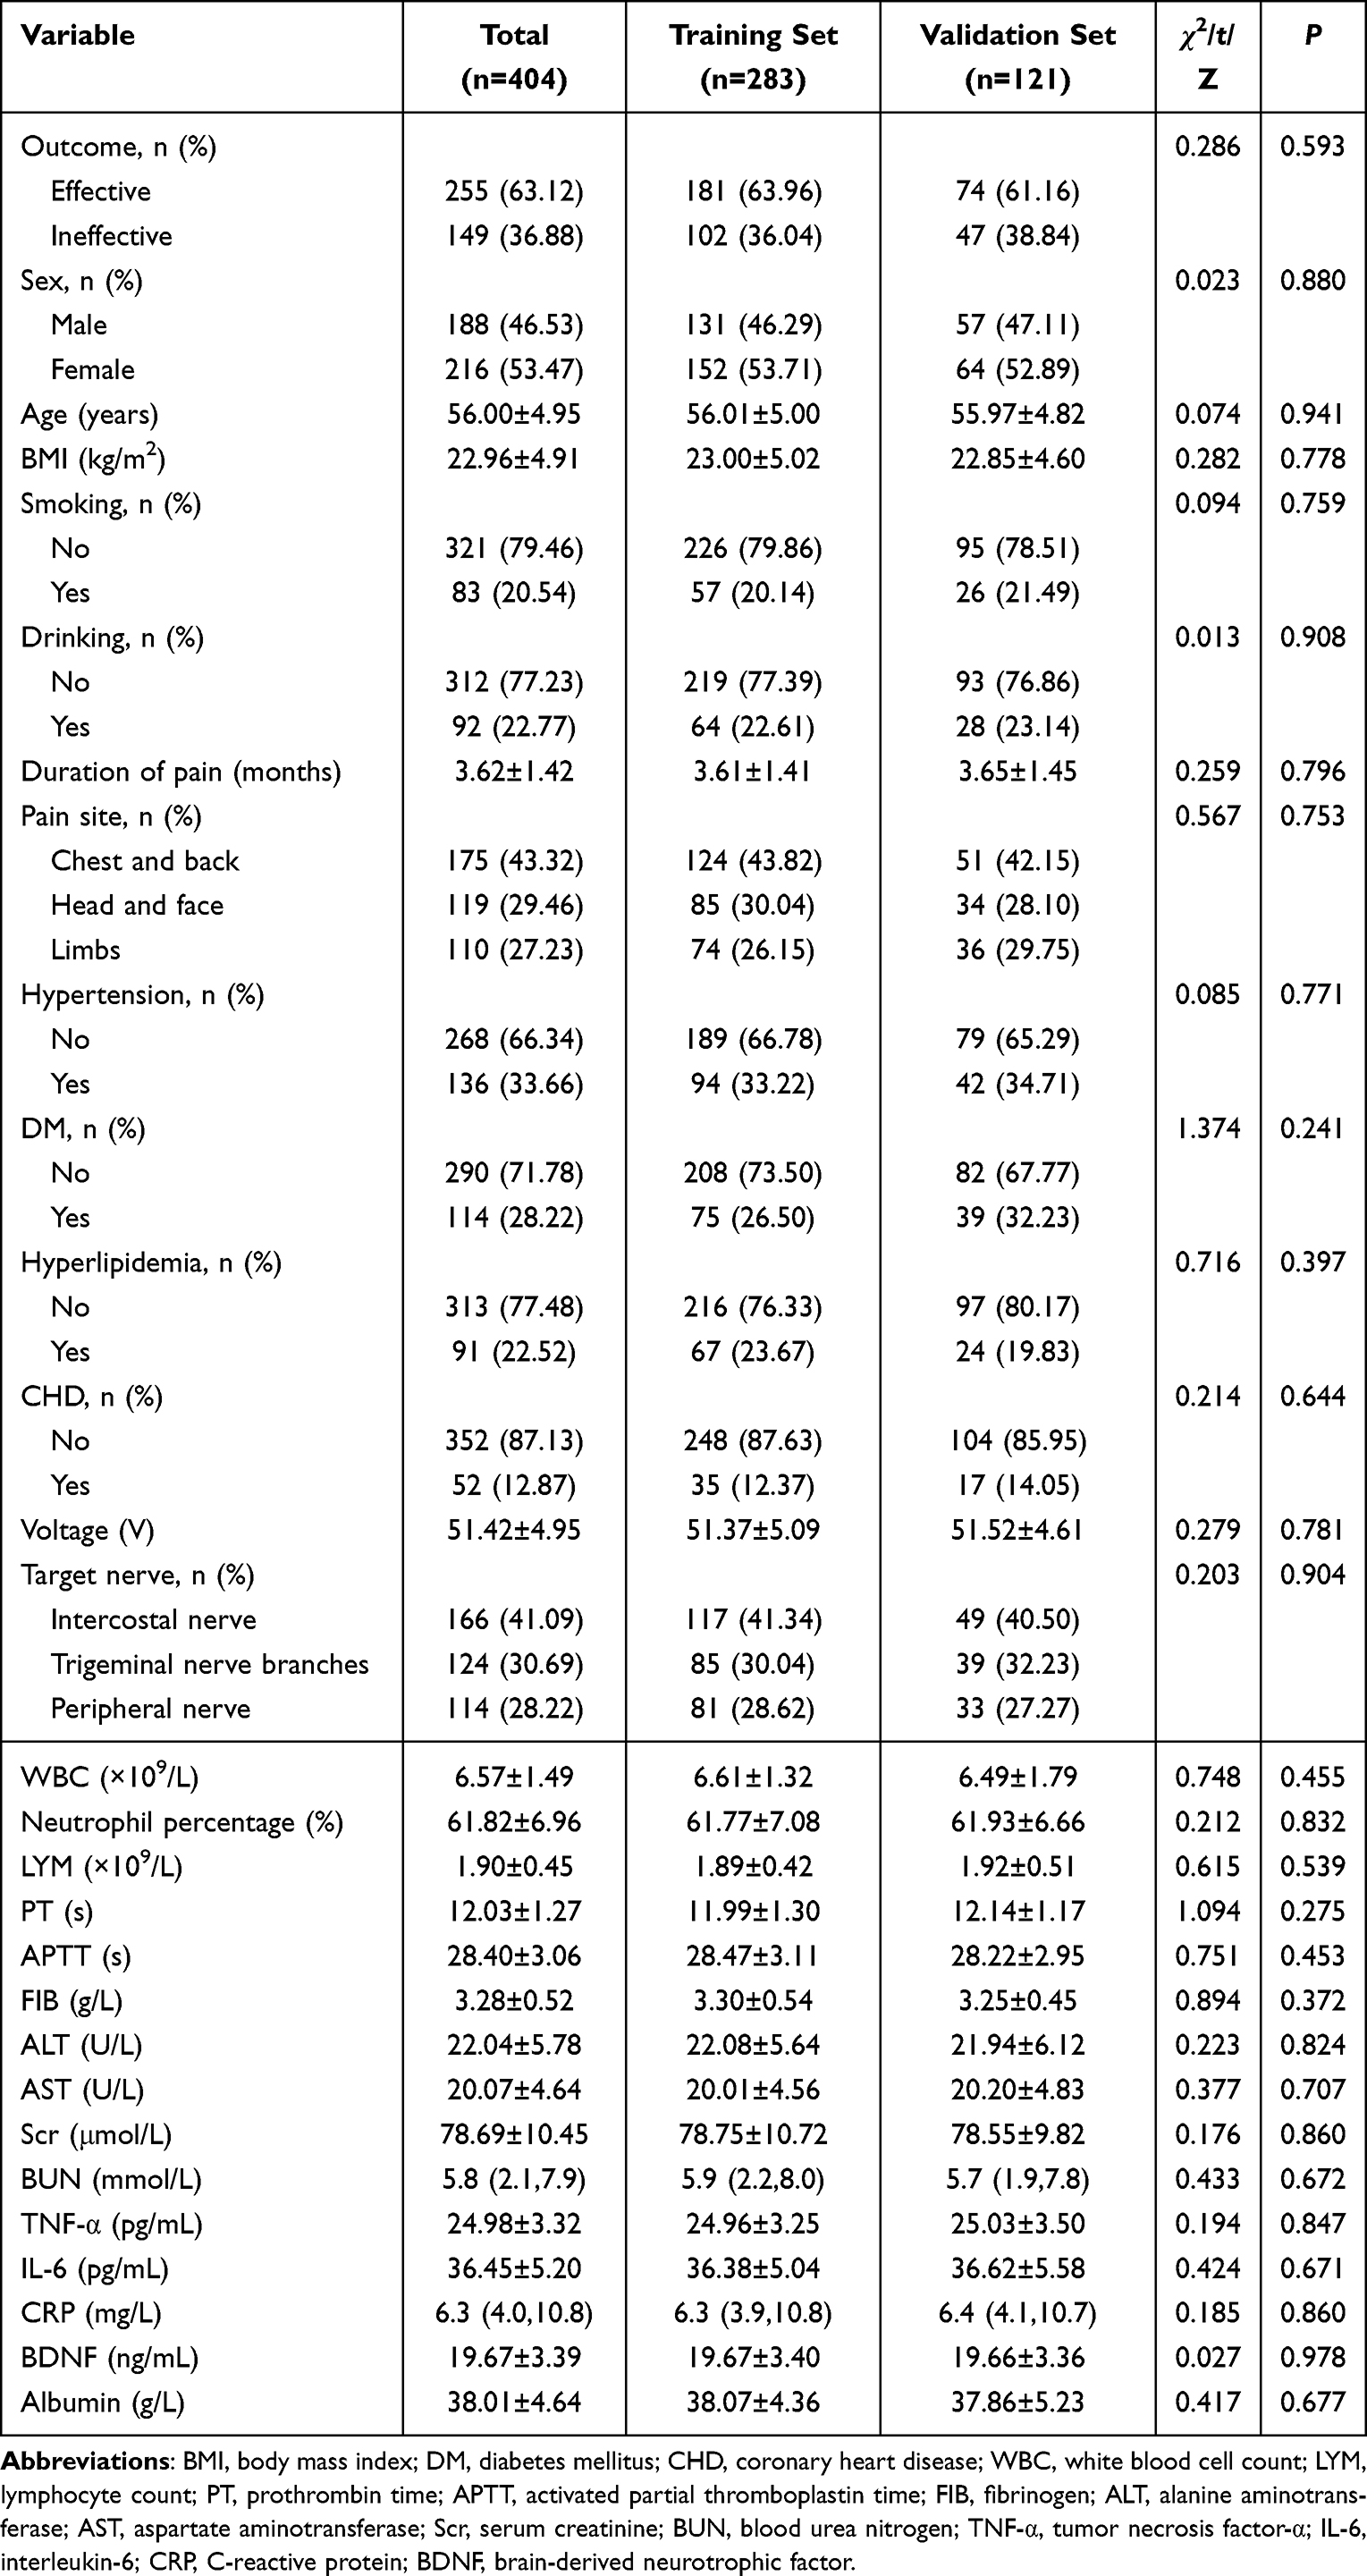 |
Table 1 Baseline Characteristics of the Overall Cohort and the Training and Validation Sets |
Baseline Characteristics of the Ineffective and Effective Groups in the Training Set
As shown in Table 2, significant differences were observed between the ineffective group and the effective group in several variables in the training set. Compared with the effective group, patients in the ineffective group were older (P = 0.002), had a longer duration of pain (P < 0.001), and had a higher proportion of DM (P < 0.001). In addition, the ineffective group showed a lower treatment voltage (P = 0.045), higher levels of TNF-α (P < 0.001) and IL-6 (P = 0.005), and lower BDNF levels (P < 0.001). No significant differences were found between the two groups in sex, BMI, smoking status, drinking status, pain site, hypertension, hyperlipidemia, CHD, target nerve, or the remaining laboratory indicators (all P > 0.05).
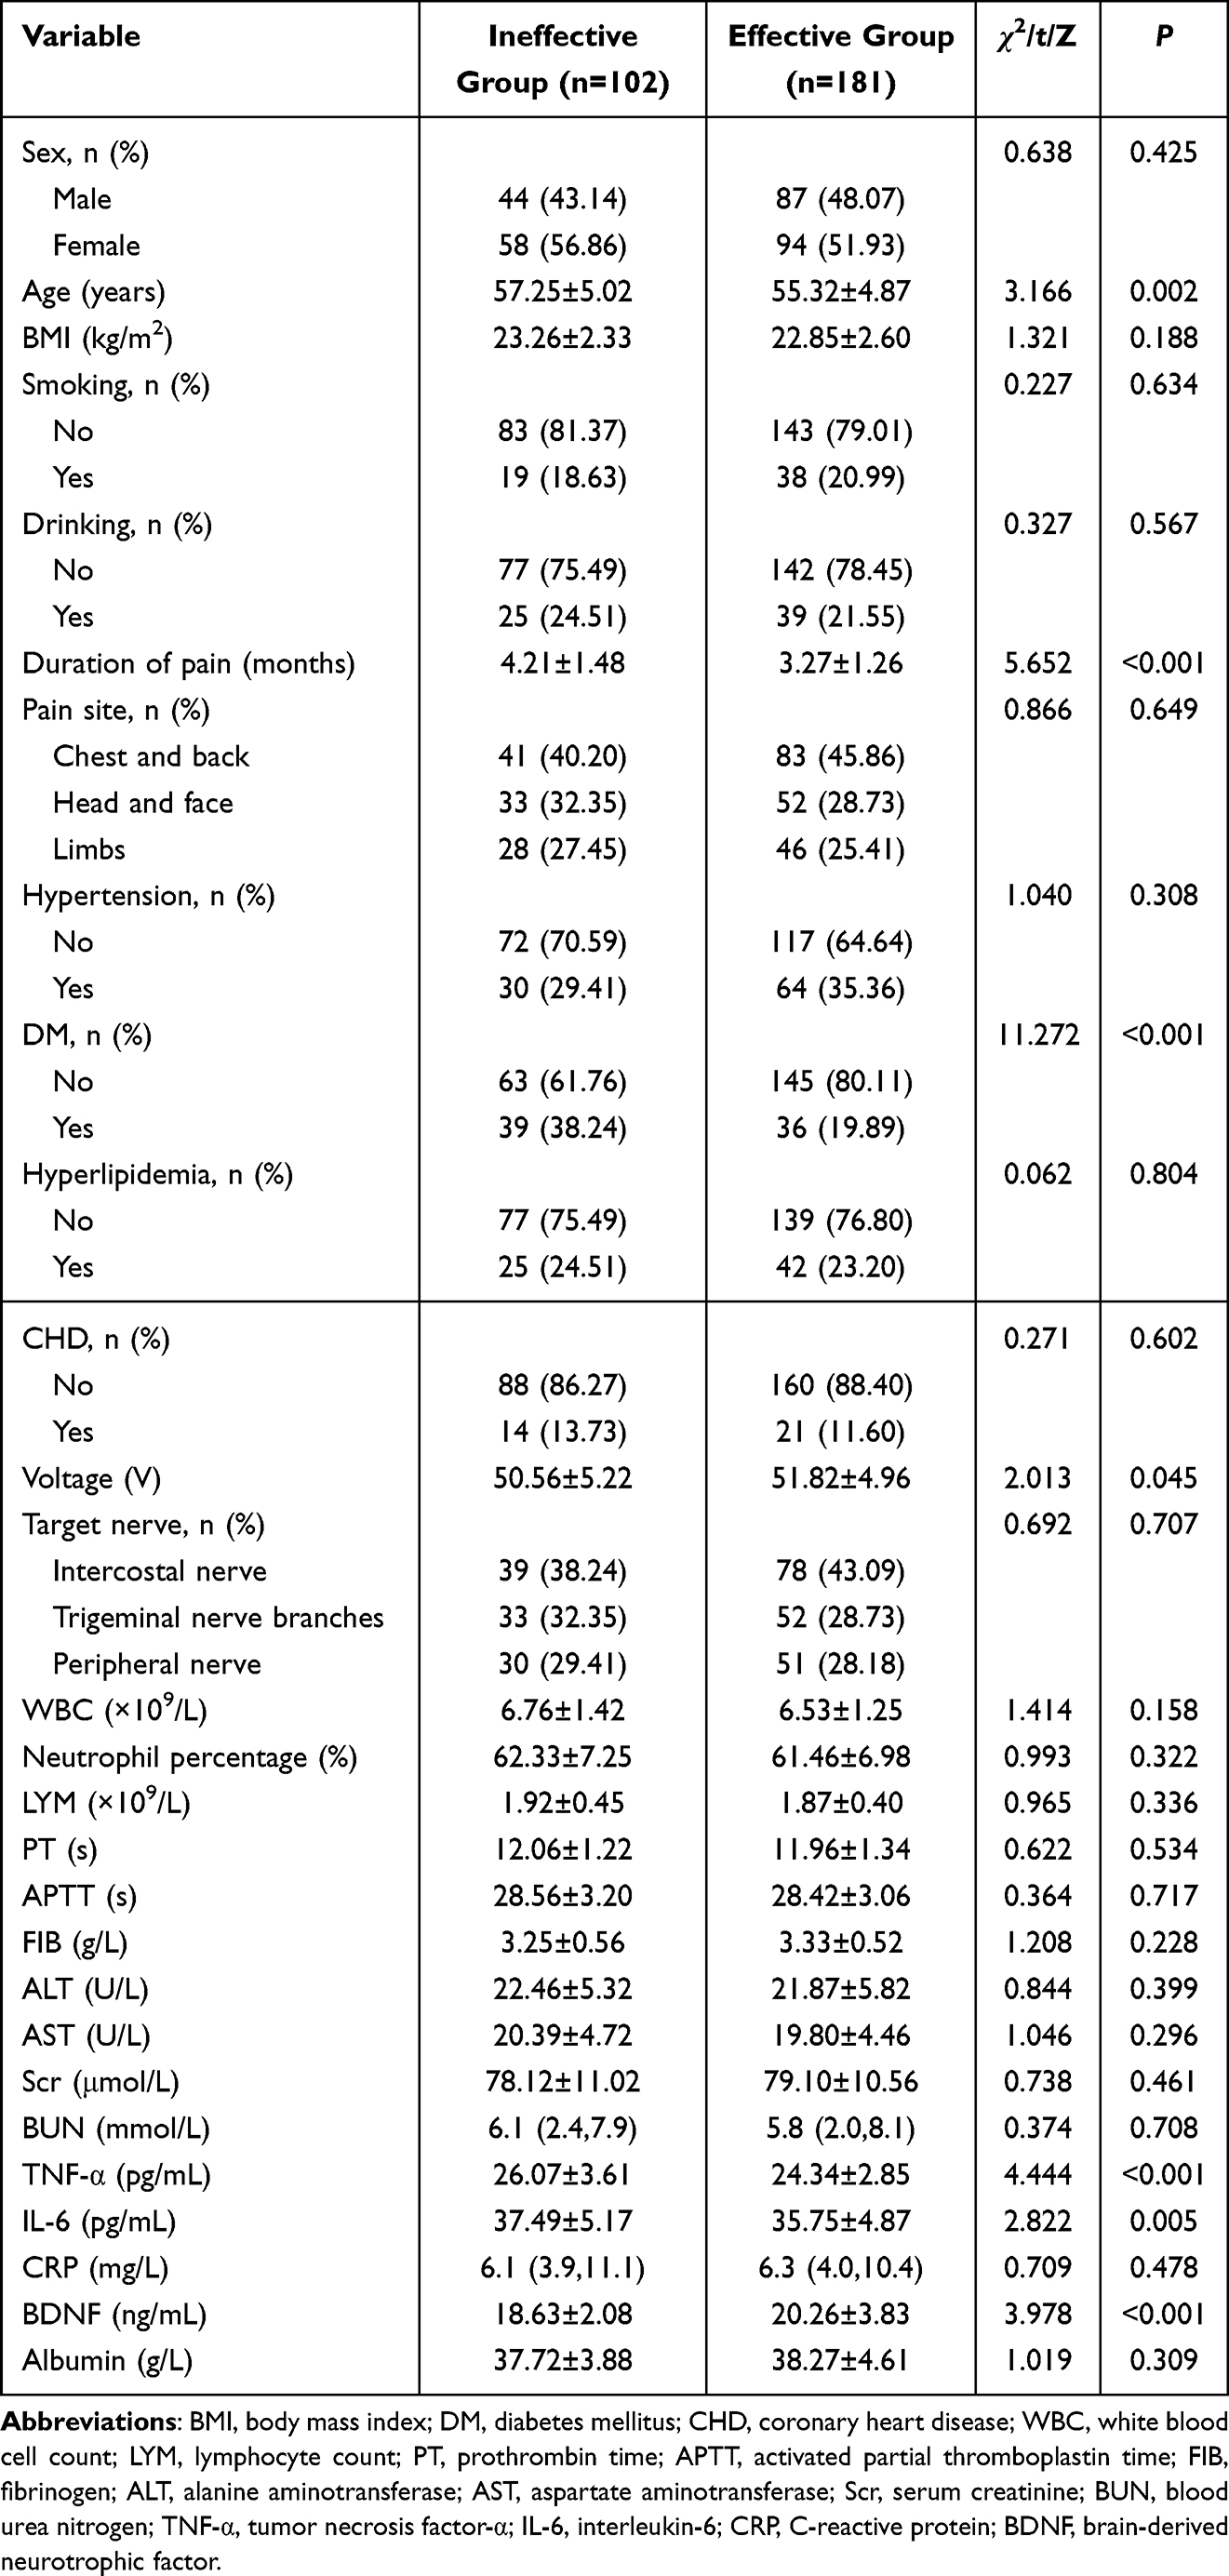 |
Table 2 Clinical Characteristics of the Ineffective and Effective Groups in the Training Set |
Screening of Predictive Features and Multicollinearity Assessment
As shown in Figure 2A and B, LASSO regression was performed in the training set. A total of 8 variables were retained, including age, duration of pain, DM, voltage, WBC, TNF-α, IL-6, and BDNF. Boruta was then used to further evaluate feature importance and confirm robust predictors. The iterative changes in variable importance are shown in Figure 2C, and the final classification of variables is presented in Figure 2D. Boruta confirmed 6 variables as important features, including DM, IL-6, age, TNF-α, duration of pain, and BDNF, whereas the remaining variables were classified as tentative or rejected. As shown in Figure 2E, the intersection of the results obtained by the two feature selection methods consisted of 6 variables, which were finally used for subsequent model construction. Voltage was recorded for all patients and included as a candidate treatment-related variable during feature selection. Although voltage was retained by LASSO and showed a significant difference in univariate analysis, it was not confirmed as an important predictor by Boruta and was therefore not included in the final model. Therefore, its independent contribution to treatment outcome prediction appeared limited after accounting for other clinical and laboratory variables.
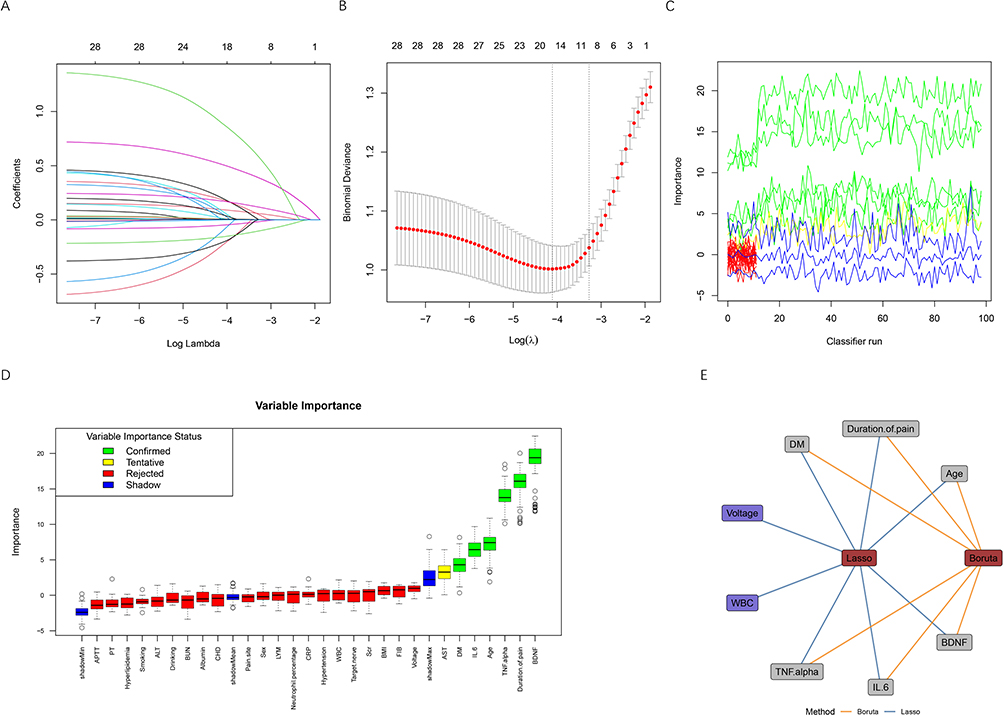 |
Figure 2 Selection and evaluation of candidate predictors by LASSO regression and Boruta feature screening. (A) LASSO coefficient profiles of candidate variables plotted against log(λ). Each curve represents the coefficient trajectory of a variable as the penalty parameter increases. (B) Ten-fold cross-validation plot for selection of the optimal penalty parameter (λ) in the LASSO logistic regression model. The dotted vertical lines indicate the λ value corresponding to the minimum binomial deviance and the 1-standard error criterion, respectively. (C) Variable importance across repeated classifier runs, showing the stability of the importance estimates. (D) Variable importance plot derived from the Boruta algorithm. Variables are categorized as confirmed, tentative, or rejected based on their importance relative to shadow features. (E) Network visualization of variables selected by LASSO and Boruta methods. Blue edges represent variables selected by LASSO, while Orange edges represent variables identified by Boruta. Abbreviations: BMI, body mass index; DM, diabetes mellitus; CHD, coronary heart disease; WBC, white blood cell count; LYM, lymphocyte count; PT, prothrombin time; APTT, activated partial thromboplastin time; FIB, fibrinogen; ALT, alanine aminotransferase; AST, aspartate aminotransferase; Scr, serum creatinine; BUN, blood urea nitrogen; TNF-α, tumor necrosis factor-α; IL-6, interleukin-6; CRP, C-reactive protein; BDNF, brain-derived neurotrophic factor. |
The definitions and coding methods of the variables included in the final analysis were presented in Supplementary Table 1. Multicollinearity among the selected predictors was further assessed using VIF, and the results were also shown in Supplementary Table 1. The VIF values of the six selected predictors ranged from 1.009 to 1.024, all of which were below the predefined threshold of 5, indicating the absence of substantial multicollinearity.
Comparison of Predictive Performance Among Different ML Models
Using the six selected predictors, six ML algorithms, including KNN, XGBoost, DT, LR, SVM, and RF, were developed and compared. Their discriminative abilities in the training and validation sets are shown by the ROC curves in Figure 3A and B, while the radar plots in Figure 3C and D present the overall performance of each model across multiple evaluation metrics. In the training set, the RF model achieved the best discriminative performance, with an AUC of 0.909 (95% CI: 0.876–0.941), followed by KNN (AUC = 0.890, 95% CI: 0.854–0.926), XGBoost (AUC = 0.879, 95% CI: 0.838–0.920), SVM (AUC = 0.861, 95% CI: 0.815–0.907), LR (AUC = 0.837, 95% CI: 0.788–0.886), and DT (AUC = 0.834, 95% CI: 0.782–0.886). In the validation set, RF remained the best-performing model, yielding the highest AUC of 0.878 (95% CI: 0.806–0.949), followed by SVM (AUC = 0.867, 95% CI: 0.799–0.934), LR (AUC = 0.861, 95% CI: 0.794–0.927), XGBoost (AUC = 0.850, 95% CI: 0.780–0.920), KNN (AUC = 0.840, 95% CI: 0.767–0.913), and DT (AUC = 0.787, 95% CI: 0.706–0.867). The radar plots further showed that RF had relatively balanced performance across multiple evaluation metrics in both datasets. Therefore, RF was selected as the optimal model for subsequent evaluation and interpretability analysis.
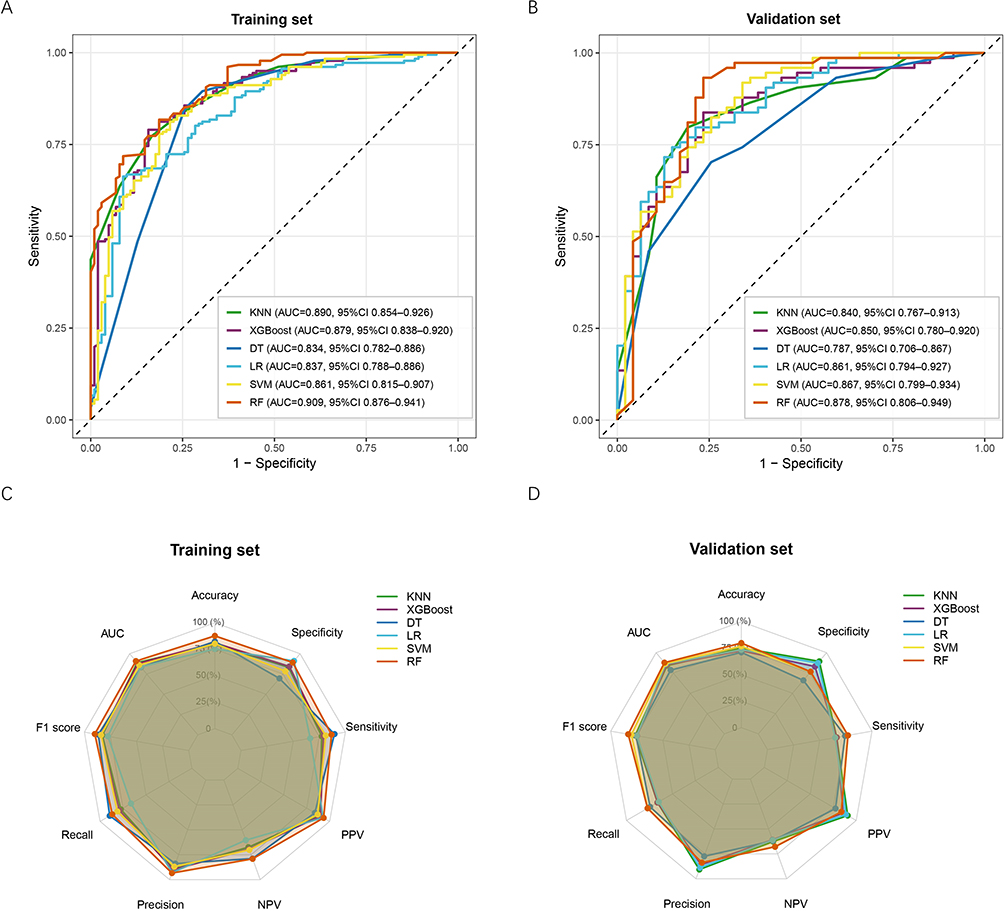 |
Figure 3 Performance comparison of different machine learning models in the training and validation sets. (A) ROC curves of six machine learning models in the training set, including KNN, XGBoost, DT, LR, SVM, and RF. (B) ROC curves in the validation set. (C) Radar plot showing the performance metrics of the six models in the training set, including accuracy, specificity, sensitivity, PPV, NPV, precision, recall, F1 score, and AUC. (D) Radar plot showing the performance metrics of the six models in the validation set. Abbreviations: ROC, receiver operating characteristic; AUC, area under the curve; CI, confidence interval; KNN, k-nearest neighbors; XGBoost, extreme gradient boosting; DT, decision tree; LR, logistic regression; SVM, support vector machine; RF, random forest; PPV, positive predictive value; NPV, negative predictive value. |
Evaluation of the Optimal RF Model
Figure 4A shows that the out-of-bag error of the RF model decreased progressively and remained stable as the number of trees increased, indicating satisfactory robustness. As shown in Figure 4B and C, the confusion matrices further demonstrated that the RF model achieved good classification performance in both the training set and validation set. Moreover, the calibration curves in Figure 4D and E were generally close to the ideal line, indicating good consistency between predicted and observed probabilities. The DCA further showed that the RF model yielded favorable net clinical benefit over the treat-all and treat-none strategies across a broad range of threshold probabilities in both datasets (Figure 4F and G). Overall, these findings suggested that the RF model had good stability, calibration, and clinical applicability.
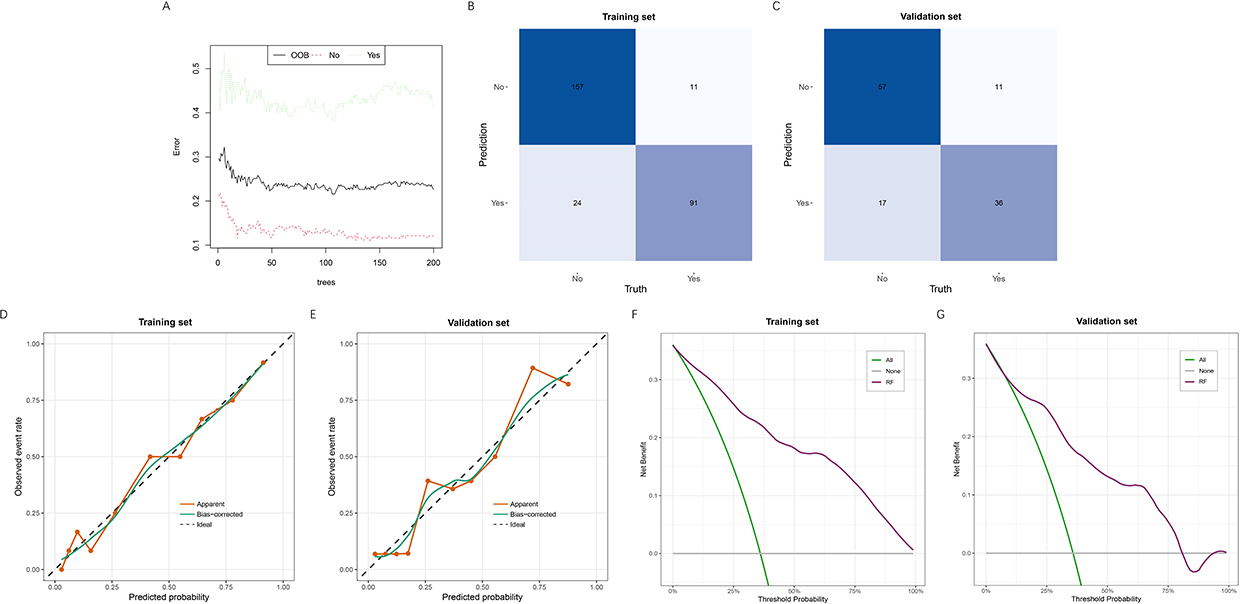 |
Figure 4 Error distribution, classification performance, calibration, and clinical utility of the final random forest model. (A) Error rate plot of the random forest model. The OOB error and class-specific error rates are shown as the number of trees increases. (B) Confusion matrix of the random forest model in the training set. (C) Confusion matrix of the random forest model in the validation set. (D) Calibration curve of the random forest model in the training set, showing the agreement between predicted probabilities and observed outcomes. (E) Calibration curve of the random forest model in the validation set. (F) Decision curve analysis of the random forest model in the training set, showing the net benefit across a range of threshold probabilities. (G) Decision curve analysis of the random forest model in the validation set. Abbreviations: OOB, out-of-bag. |
SHAP-Based Global and Individual Explanations of the RF Model
SHAP analysis was performed to improve the interpretability of the optimal RF model. As shown in Figure 5A, the most important predictors ranked by mean absolute SHAP value were BDNF, TNF-α, duration of pain, IL-6, age, and DM. The SHAP summary plot further showed that higher TNF-α, longer duration of pain, higher IL-6, older age, and the presence of DM were generally associated with higher SHAP values, indicating an increased probability of treatment ineffectiveness, whereas higher BDNF tended to reduce the predicted risk of an ineffective outcome (Figure 5B).
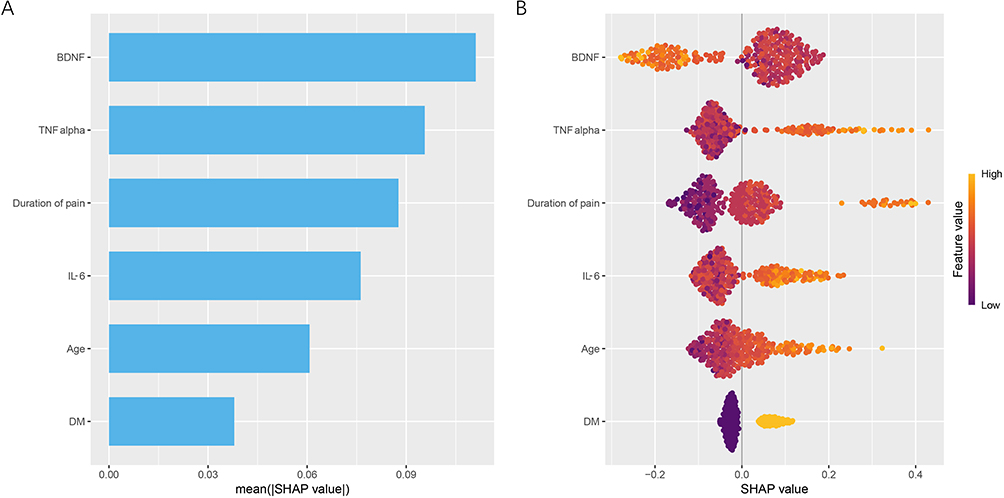 |
Figure 5 Feature importance and model interpretation based on SHAP analysis. (A) Feature importance ranking of the selected variables in the random forest model. The length of each bar represents the relative importance of the corresponding variable. (B) SHAP summary plot illustrating the contribution of each feature to the prediction. Each dot represents an individual observation, where the color gradient reflects the feature value and the SHAP value indicates the direction and magnitude of its effect on the model output. Abbreviations: SHAP, SHapley Additive exPlanations; BDNF, brain-derived neurotrophic factor; TNF-α, tumor necrosis factor-α; IL-6, interleukin-6; DM, diabetes mellitus. |
The SHAP dependence plots further illustrated the relationships between individual predictors and model output (Figure 6A–F). Age, duration of pain, TNF-α, and IL-6 demonstrated generally positive, nonlinear associations with the predicted risk of treatment ineffectiveness, whereas BDNF showed a generally inverse, nonlinear association. DM also showed a clear contribution to the model prediction. The individual SHAP waterfall plots provided further explanation at the patient level (Figure 7A–C). In patients with a low predicted probability of treatment ineffectiveness, shorter pain duration, lower TNF-α and IL-6 levels, younger age, absence of DM, and relatively higher BDNF contributed to a lower model output. In contrast, in a patient with a high predicted probability of treatment ineffectiveness, older age, DM, longer pain duration, higher TNF-α and IL-6 levels, and lower BDNF jointly increased the predicted risk. These results indicate that the RF model had good interpretability and could provide clinically meaningful explanations for individual predictions.
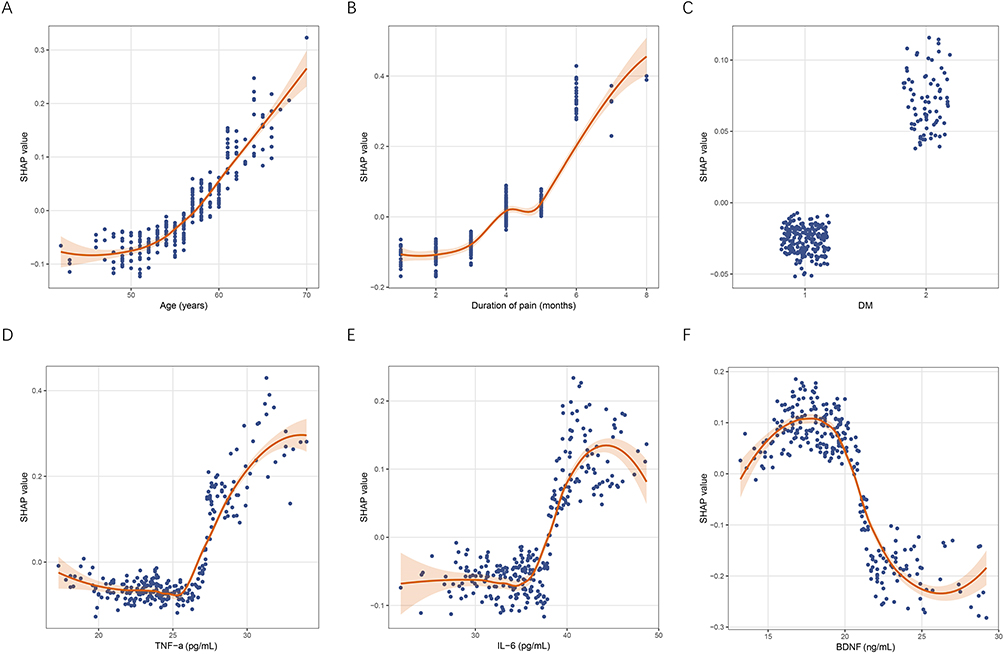 |
Figure 6 SHAP dependence plots of key predictors in the final model. (A) Age; (B) duration of pain; (C) DM; (D) TNF-α; (E) IL-6; and (F) BDNF. Each dot represents an individual observation. The SHAP value reflects the contribution of each feature to the prediction, with positive values indicating increased risk and negative values indicating decreased risk. The fitted curve represents the overall trend of the feature effect. Abbreviations: SHAP, SHapley Additive exPlanations; BDNF, brain-derived neurotrophic factor; TNF-α, tumor necrosis factor-α; IL-6, interleukin-6; DM, diabetes mellitus. |
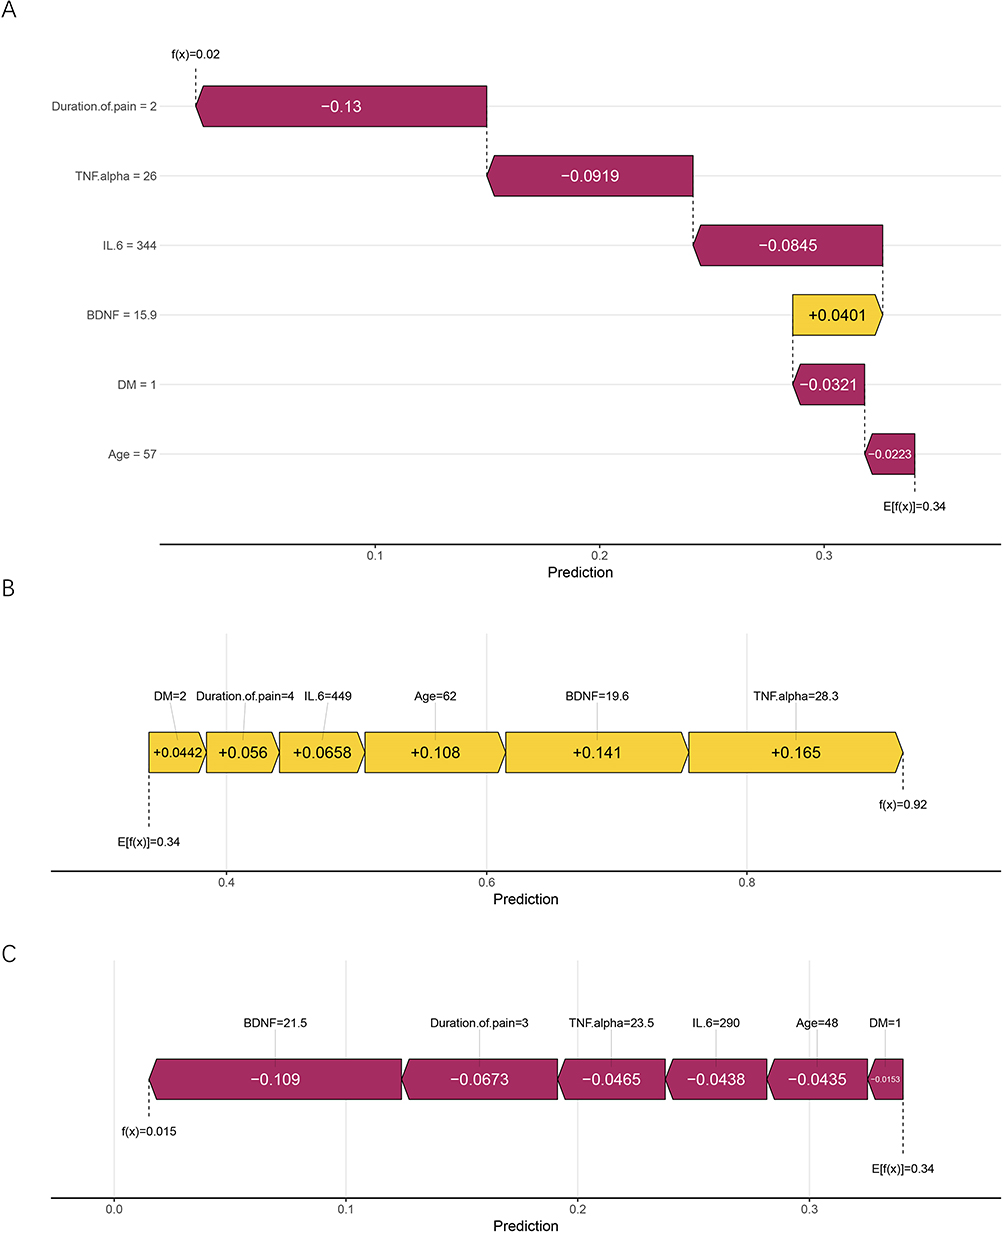 |
Figure 7 Individual prediction explanation using SHAP. (A) SHAP waterfall plot for the first sample, showing how each feature contributed to shifting the prediction from the baseline output to the final model output. (B) SHAP force plot for a high-risk sample. (C) SHAP force plot for a low-risk sample. E[f(x)] represents the baseline model output, and f(x) represents the final model output for the individual sample. |
Discussion
In this study, we developed and validated an explainable ML model to predict the efficacy of PRF in patients with PHN. By integrating LASSO regression and the Boruta algorithm, six key predictors were identified, including age, duration of pain, DM, TNF-α, IL-6, and BDNF. The RF model showed the greatest overall performance among many candidate algorithms, with favourable clinical usefulness, strong discrimination, and excellent calibration. More importantly, SHAP-based interpretation revealed a consistent pattern: higher inflammatory activity (TNF-α and IL-6), longer disease duration, older age, and the presence of DM were associated with an increased risk of poor PRF response, whereas higher BDNF was associated with better outcomes. These findings suggest that the efficacy of PRF is largely determined by the interplay between persistent neuroinflammation and the intrinsic capacity for neural repair, rather than by isolated clinical variables.
PHN is a clinically heterogeneous neuropathic pain disorder, and the response to PRF varies substantially across patients. Previous studies on PHN have mainly focused on epidemiology, pain mechanisms, and the efficacy of pharmacological or interventional therapies, whereas relatively few studies have attempted to establish predictive models for PRF treatment response.16,17 Against this background, recent studies on PHN have gradually shifted from evaluating the overall effectiveness of PRF to identifying factors associated with poor outcomes and developing prognostic models. Peng et al developed a prediction model for PRF effectiveness in patients with zoster-associated pain (ZAP) and found that disease stage, pregabalin dose, LYM, and several clinical and laboratory variables were associated with treatment response, suggesting that earlier intervention may improve outcomes.18 However, their study focused on the broader ZAP population rather than specifically on PHN, and the model showed only moderate discriminative ability, which may limit its applicability in more refractory patients. In a further analysis, Yuan et al identified several factors associated with worse prognosis in patients with zoster-associated neuralgia treated with interventional pain procedures. This study reinforced the concept that prognosis after interventional treatment is influenced by multiple clinical and inflammatory-related factors.19 Nevertheless, because different interventional procedures were analyzed together, the findings were not specific to PRF, and the study was mainly focused on identifying risk factors rather than establishing an individualized and explainable prediction model. Zhao et al subsequently showed that age, preoperative pain severity, and the 5 Hz current perception threshold ratio could predict prognosis in patients with acute herpetic neuralgia treated with PRF, and the nomogram they constructed demonstrated good discrimination and calibration.20 However, the target population consisted of patients at the acute stage rather than those with PHN, and the model was based on a relatively limited set of predictors, which may not fully reflect the biological and clinical complexity of chronic neuropathic pain. Compared with these previous reports, our study specifically focused on PHN patients receiving PRF, a more chronic and refractory population. Moreover, we integrated both clinical and laboratory variables, compared multiple ML algorithms, and identified an optimal RF model with SHAP-based interpretation. Therefore, our study extends prior work by providing a more specific and explainable framework for predicting PRF efficacy in PHN patients.
The predictors identified in the present study appear to reflect several core processes underlying treatment heterogeneity in PHN, including host vulnerability, disease chronicity, metabolic background, inflammatory burden, and neurotrophic support. Age was identified as an important predictor in our model, which is consistent with previous studies showing that older age is one of the most robust risk factors for the development and persistence of PHN.21,22 Older patients are more likely to exhibit reduced cell-mediated immunity, impaired neural repair capacity, and greater susceptibility to persistent sensitization after varicella-zoster virus reactivation, all of which may contribute to a poorer response to PRF.23,24 In addition, previous prognostic studies of PHN have also shown that advanced age is associated with less favorable outcomes after interventional treatment.19 Therefore, age in the present study may reflect not only baseline host vulnerability but also a reduced capacity for recovery following neuromodulatory intervention. Duration of pain was another important predictor in our model. A longer disease course may reflect more established peripheral and central sensitization, as well as more stable maladaptive plasticity within pain pathways, thereby reducing the effectiveness of PRF.25,26 This interpretation is supported by Kim et al, who reported that PRF applied within 90 days after zoster onset achieved greater pain reduction, a higher success rate, and more frequent medication discontinuation than PRF performed after progression to PHN.27 These findings suggest that earlier intervention may be associated with better neuromodulatory effects, whereas delayed treatment may be less effective once chronic pain mechanisms are established. Therefore, duration of pain may represent not only disease chronicity but also the extent of underlying neural remodeling that limits responsiveness to PRF. DM is a well-recognized risk factor for both HZ and PHN, likely due to metabolic dysfunction, microvascular compromise, oxidative stress, and chronic low-grade inflammation that can impair neural repair and exacerbate nerve vulnerability.28–30 In PHN patients undergoing PRF, these diabetes-related abnormalities may contribute to a reduced response to neuromodulatory intervention. Epidemiological and clinical studies have consistently shown that diabetic patients are more likely to develop PHN and exhibit poorer pain outcomes after interventional therapy, supporting the relevance of DM as a prognostic factor in our cohort.19,21 Thus, DM may reflect a biologically unfavorable background that limits the efficacy of PRF in PHN patients. TNF-α and IL-6 were positively associated with the risk of ineffective treatment in our model, which is biologically plausible given the established role of neuroinflammation in neuropathic pain. TNF-α is a key pro-inflammatory cytokine involved in nociceptor sensitization and amplification of pain signaling, whereas IL-6 participates in both peripheral inflammatory activation and central pain facilitation.31,32 Previous studies have shown that inflammatory cytokine profiles are altered in patients with HZ and postherpetic neuralgia, and elevated IL-6 levels have been associated with PHN and greater pain severity.33,34 Therefore, higher baseline TNF-α and IL-6 levels in the present study may reflect a sustained pro-inflammatory state in which PRF-induced neuromodulation is less effective. BDNF showed an inverse association with the predicted risk of ineffective treatment in our model. As an important neurotrophic factor, BDNF is involved in neuronal survival, synaptic plasticity, and nerve repair, and its dysregulation has been implicated in chronic pain states.35 Previous studies have reported reduced BDNF levels in patients with PHN and have also shown that serum BDNF may be modulated after treatment.36,37 In the present study, higher baseline BDNF levels were associated with a lower probability of poor PRF response, which may suggest that patients with better preserved neurotrophic support retain greater potential for neural recovery after neuromodulatory intervention. However, given the context-dependent role of BDNF in pain processing, this association should be interpreted cautiously and warrants further investigation.
Our study possesses several methodological strengths that enhance the reliability and clinical relevance of our findings. First, we employed a retrospective cohort of 404 PHN patients undergoing PRF, which is relatively large compared with most previous studies, providing sufficient statistical power for model development and validation. Second, multiple ML algorithms were evaluated under a unified framework, allowing an objective comparison of performance and the identification of the most suitable model. Third, SHAP-based interpretation enabled transparent visualization of both global feature importance and individual-level predictions, thereby bridging the gap between model performance and clinical interpretability. From a clinical perspective, the proposed model has practical implications. It may assist clinicians in identifying patients with a low probability of benefiting from PRF prior to intervention, thereby supporting more rational treatment selection. For example, patients characterized by high inflammatory burden, long disease duration, and metabolic comorbidities may require more aggressive or combined therapeutic strategies rather than PRF alone. In addition, the identification of modifiable factors, such as inflammatory status, raises the possibility of optimizing the biological environment before intervention. Therefore, this model not only serves as a predictive tool but also provides a basis for risk stratification and potential treatment optimization. Several limitations should be noted. First, given the observational nature of this study, our findings demonstrate associations rather than causality, and further prospective or interventional studies are needed to confirm these results. Second, the variables included in the model were limited to routinely collected clinical and laboratory data, and some potentially relevant factors, such as pain phenotype, psychological status, medication adherence, imaging findings, and electrophysiological indicators, were not incorporated. Third, only internal validation was performed, and no external validation cohort was available; therefore, the robustness and transportability of the model in other institutions and populations remain uncertain. Fourth, postoperative management of neuropathic pain medications was not standardized because of the retrospective nature of the study. Adjustments to medications were made according to individual clinical needs and physician judgment during follow-up. Therefore, the potential influence of medication-related factors on treatment outcomes could not be fully evaluated and should be considered in future prospective studies with standardized treatment protocols. Finally, the study was retrospective and conducted at a single center, which may limit the generalizability of the findings. Although the model demonstrated good predictive performance in both the training and validation cohorts, it should still be considered exploratory. External validation in independent multicenter cohorts is required to further assess its robustness, generalizability, and clinical applicability before routine clinical implementation.
Conclusion
This study developed an explainable ML model to predict treatment response to PRF in patients with PHN and identified age, duration of pain, DM, TNF-α, IL-6, and BDNF as key predictors. Among the candidate algorithms, the RF model showed the best overall predictive performance and demonstrated good discrimination, calibration, and potential clinical utility. The integration of predictive modeling and SHAP-based interpretation enables individualized risk assessment and enhances the transparency of model-driven decisions. These findings may facilitate more precise patient selection and optimization of PRF treatment strategies in clinical practice. Further external validation and prospective studies are required to confirm the generalizability of the model.
Data Sharing Statement
Data will be provided upon request to the corresponding author.
Ethics Approval and Consent to Participate
The study was approved by the Ethics Committee of The First Affiliated Hospital of Henan Medical University (No. 2025101221), and informed consent was obtained from all patients. This study was conducted in accordance with the Declaration of Helsinki.
Author Contributions
All authors made a significant contribution to the work reported, whether that is in the conception, study design, execution, acquisition of data, analysis and interpretation, or in all these areas; took part in drafting, revising or critically reviewing the article; gave final approval of the version to be published; have agreed on the journal to which the article has been submitted; and agree to be accountable for all aspects of the work.
Disclosure
The authors declare that they have no competing interests in this work.
References
1. Saguil A, Kane S, Mercado M, Lauters R. Herpes zoster and postherpetic neuralgia: prevention and management. Am Fam Physician. 2017;96(10):656–18.
2. Forstenpointner J, Rice ASC, Finnerup NB, Baron R. Up-date on clinical management of postherpetic neuralgia and mechanism-based treatment: new options in therapy. J Infect Dis. 2018;218(suppl_2):S120–s126. doi:10.1093/infdis/jiy381
3. Johnson RW, Bouhassira D, Kassianos G, Leplège A, Schmader KE, Weinke T. The impact of herpes zoster and post-herpetic neuralgia on quality-of-life. BMC Med. 2010;8:37. doi:10.1186/1741-7015-8-37
4. Kawai K, Gebremeskel BG, Acosta CJ. Systematic review of incidence and complications of herpes zoster: towards a global perspective. BMJ Open. 2014;4(6):e004833. doi:10.1136/bmjopen-2014-004833
5. Tang J, Zhang Y, Liu C, Zeng A, Song L. Therapeutic strategies for postherpetic neuralgia: mechanisms, treatments, and perspectives. Curr Pain Headache Rep. 2023;27(9):307–319. doi:10.1007/s11916-023-01146-x
6. Wang C, Dou Z, Yan M, Wang B. Efficacy and safety of pulsed radiofrequency in herpes zoster related trigeminal neuralgia: a systematic review and meta-analysis. J Pain Res. 2023;16:341–355. doi:10.2147/JPR.S396209
7. Byrd D, Mackey S. Pulsed radiofrequency for chronic pain. Curr Pain Headache Rep. 2008;12(1):37–41. doi:10.1007/s11916-008-0008-3
8. Jitsinthunun T, Li C, Ng TK, Zinboonyahgoon N. Pulsed radiofrequency treatment: evidence for and applications in chronic pain. Pain Physician. 2025;28(6):467–481.
9. Khosravi B, Weston AD, Nugen F, et al. Demystifying statistics and machine learning in analysis of structured tabular data. J Arthroplasty. 2023;38(10):1943–1947. doi:10.1016/j.arth.2023.08.045
10. Rudin C. Stop explaining black box machine learning models for high stakes decisions and use interpretable models instead. Nat Mach Intell. 2019;1(5):206–215. doi:10.1038/s42256-019-0048-x
11. Johnson RW, Rice AS. Clinical practice. Postherpetic neuralgia. N Engl J Med. 2014;371(16):1526–1533. doi:10.1056/NEJMcp1403062
12. Han Z, Hong T, Ding Y, Wang S, Yao P. CT-guided pulsed radiofrequency at different voltages in the treatment of postherpetic neuralgia. Front Neurosci. 2020;14:579486. doi:10.3389/fnins.2020.579486
13. Rui M, Ni H, Xie K, Xu L, Yao M. Progress in radiofrequency therapy for zoster-associated pain about parameters, modes, targets, and combined therapy: a narrative review. Pain Ther. 2024;13(1):23–32. doi:10.1007/s40122-023-00561-7
14. Hjermstad MJ, Fayers PM, Haugen DF, et al. Studies comparing numerical rating scales, verbal rating scales, and visual analogue scales for assessment of pain intensity in adults: a systematic literature review. J Pain Symptom Manage. 2011;41(6):1073–1093. doi:10.1016/j.jpainsymman.2010.08.016
15. Nohara Y, Matsumoto K, Soejima H, Nakashima N. Explanation of machine learning models using shapley additive explanation and application for real data in hospital. Comput Methods Programs Biomed. 2022;214:106584. doi:10.1016/j.cmpb.2021.106584
16. Johnson RW, Wasner G, Saddier P, Baron R. Postherpetic neuralgia: epidemiology, pathophysiology and management. Expert Rev Neurother. 2007;7(11):1581–1595. doi:10.1586/14737175.7.11.1581
17. Mallick-Searle T, Snodgrass B, Brant JM. Postherpetic neuralgia: epidemiology, pathophysiology, and pain management pharmacology. J Multidiscip Healthc. 2016;9:447–454. doi:10.2147/JMDH.S106340
18. Peng Z, Guo J, Zhang Y, et al. Development of a model for predicting the effectiveness of pulsed radiofrequency on zoster-associated pain. Pain Ther. 2022;11(1):253–267. doi:10.1007/s40122-022-00355-3
19. Yuan J, Yu Y, Liu H, Xu H, Li Y, Jin X. Risk factors for poor prognosis in patients with zoster-associated neuralgia who underwent interventional pain management. Front Mol Neurosci. 2024;17:1393219. doi:10.3389/fnmol.2024.1393219
20. Zhao C, Lu Z, Hua B, et al. Predictive value of current perception threshold for prognosis of pulsed radiofrequency in patients with acute herpetic neuralgia. J Pain Res. 2024;17:3241–3253. doi:10.2147/JPR.S472535
21. Forbes HJ, Thomas SL, Smeeth L, et al. A systematic review and meta-analysis of risk factors for postherpetic neuralgia. Pain. 2016;157(1):30–54. doi:10.1097/j.pain.0000000000000307
22. Drolet M, Brisson M, Schmader K, et al. Predictors of postherpetic neuralgia among patients with herpes zoster: a prospective study. J Pain. 2010;11(11):1211–1221. doi:10.1016/j.jpain.2010.02.020
23. Levin MJ, Smith JG, Kaufhold RM, et al. Decline in varicella-zoster virus (VZV)-specific cell-mediated immunity with increasing age and boosting with a high-dose VZV vaccine. J Infect Dis. 2003;188(9):1336–1344. doi:10.1086/379048
24. Scheib J, Höke A. Impaired regeneration in aged nerves: clearing out the old to make way for the new. Exp Neurol. 2016;284(Pt A):79–83.
25. Ji RR, Nackley A, Huh Y, Terrando N, Maixner W. Neuroinflammation and central sensitization in chronic and widespread pain. Anesthesiology. 2018;129(2):343–366.
26. Baron R, Binder A, Wasner G. Neuropathic pain: diagnosis, pathophysiological mechanisms, and treatment. Lancet Neurol. 2010;9(8):807–819. doi:10.1016/S1474-4422(10)70143-5
27. Kim K, Jo D, Kim E. Pulsed radiofrequency to the dorsal root ganglion in acute herpes zoster and postherpetic neuralgia. Pain Physician. 2017;20(3):E411–e418. doi:10.36076/ppj.2017.E418
28. Papagianni M, Metallidis S, Tziomalos K. Herpes zoster and diabetes mellitus: a review. Diabetes Ther. 2018;9(2):545–550. doi:10.1007/s13300-018-0394-4
29. Wen SY, Ou-Yang C, Chang C, Chen CC, Chang HY. Impact of type 1 versus type 2 diabetes on developing herpes zoster and post-herpetic neuralgia: a population-based cohort study. Acta Derm Venereol. 2023;103:adv9400.
30. Bosco D, Plastino M, De Bartolo M, et al. Role of impaired glucose metabolism in the postherpetic neuralgia. Clin J Pain. 2013;29(8):733–736. doi:10.1097/AJP.0b013e318274b2ed
31. Leung L, Cahill CM. TNF-alpha and neuropathic pain--a review. J Neuroinflammation. 2010;7:27. doi:10.1186/1742-2094-7-27
32. Zhou YQ, Liu Z, Liu ZH, et al. Interleukin-6: an emerging regulator of pathological pain. J Neuroinflammation. 2016;13(1):141.
33. Lin D, Zhong C, Jiang Q, Huang A, Liu Y. Serum interleukin-6 levels are increased in post-herpetic neuralgia: a single-center retrospective study. An Bras Dermatol. 2023;98(2):202–207. doi:10.1016/j.abd.2022.03.007
34. Gu J, Yuan Y, Wang J, Liu H, Zhang Z, Yan Y. Serum inflammatory cytokine levels in herpes zoster patients and their association with postherpetic neuralgia: a prospective study. Med Sci Monit. 2023;29:e941878. doi:10.12659/MSM.941878
35. Mazzitelli M, Kiritoshi T, Presto P, et al. BDNF signaling and pain modulation. Cells. 2025;14(7):476.
36. Saxena AK, Lakshman K, Sharma T, Gupta N, Banerjee BD, Singal A. Modulation of serum BDNF levels in postherpetic neuralgia following pulsed radiofrequency of intercostal nerve and pregabalin. Pain Manag. 2016;6(3):217–227.
37. Zhao W, Wang Y, Fang Q, et al. Changes in neurotrophic and inflammatory factors in the cerebrospinal fluid of patients with postherpetic neuralgia. Neurosci Lett. 2017;637:108–113. doi:10.1016/j.neulet.2016.11.041
 © 2026 The Author(s). This work is published and licensed by Dove Medical Press Limited. The
full terms of this license are available at https://www.dovepress.com/terms
and incorporate the Creative Commons Attribution
- Non Commercial (unported, 4.0) License.
By accessing the work you hereby accept the Terms. Non-commercial uses of the work are permitted
without any further permission from Dove Medical Press Limited, provided the work is properly
attributed. For permission for commercial use of this work, please see paragraphs 4.2 and 5 of our Terms.
© 2026 The Author(s). This work is published and licensed by Dove Medical Press Limited. The
full terms of this license are available at https://www.dovepress.com/terms
and incorporate the Creative Commons Attribution
- Non Commercial (unported, 4.0) License.
By accessing the work you hereby accept the Terms. Non-commercial uses of the work are permitted
without any further permission from Dove Medical Press Limited, provided the work is properly
attributed. For permission for commercial use of this work, please see paragraphs 4.2 and 5 of our Terms.
Recommended articles
Effect of Preoperative Level of Glycemic Control with Pulsed Radiofrequency on the Incidence of Postherpetic Neuralgia in Patients with Herpes Zoster Combined with Type 2 Diabetes Mellitus: A Cohort Study
Hua B, An M, Chen L, Ni H, Ni C, Yao M
Diabetes, Metabolic Syndrome and Obesity 2024, 17:3975-3987
Published Date: 24 October 2024
Novel Ultrasound-Guided Cervical Sympathetic Chain Pulsed Radiofrequency for Subacute Herpes Zoster Neuralgia
Lin S, Lin M, Wang F, Zhuo Y, Lin K, Wang J
Journal of Pain Research 2024, 17:3627-3637
Published Date: 7 November 2024

Effectiveness of High-Voltage, Long-Duration Pulsed Radiofrequency in the Treatment of Postherpetic Neuralgia in the Elderly: Protocol for a Randomized Clinical Trial
Li W, He L, Lin P, Chen R, Liu R
Journal of Pain Research 2025, 18:7087-7095
Published Date: 24 December 2025
Efficacy and Safety of Pulsed Radiofrequency Combined with Platelet-Rich Plasma in the Treatment of Postherpetic Neuralgia: A Systematic Review and Meta-Analysis
Lu Z, Zhao C, Ni H, Yao M
Journal of Pain Research 2025, 18:7213-7224
Published Date: 30 December 2025
A Study on the Efficacy and Safety of Intravenous Lidocaine Infusion Combined with Pulsed Radiofrequency in Preventing Postherpetic Neuralgia: A Randomized, Double-Blind, Controlled Trial
Xu P, Fan H, Yu M, Fei Y
Journal of Pain Research 2026, 19:562972
Published Date: 11 February 2026