Back to Journals » Psychology Research and Behavior Management » Volume 16
Perceived Stress, Psychological Flexibility Profiles, and Mental Health During COVID-19: A Latent Profile Analysis
Authors Deng Y, Huang P ![]() , Yang Q, Ye B
, Yang Q, Ye B ![]()
Received 20 February 2023
Accepted for publication 11 May 2023
Published 19 May 2023 Volume 2023:16 Pages 1861—1871
DOI https://doi.org/10.2147/PRBM.S409395
Checked for plagiarism Yes
Review by Single anonymous peer review
Peer reviewer comments 2
Editor who approved publication: Professor Mei-Chun Cheung
Yuhong Deng,1 Pengfei Huang,1 Qiang Yang,2 Baojuan Ye1
1School of Psychology, School of Education, Center of Mental Health Education and Research, Jiangxi Normal University, Nanchang, People’s Republic of China; 2School of Education, Jiangxi Normal University, Nanchang, People’s Republic of China
Correspondence: Baojuan Ye, School of Psychology, School of Education, Center of Mental Health Education and Research, Jiangxi Normal University, Nanchang, People’s Republic of China, Email [email protected]
Purpose: Although the link between psychological flexibility and healthy functioning has been widely analyzed, the employed measurements often lacked accuracy. The current study introduced a person-centered approach that identified subgroups of college students across the dimensions of the Personalized Psychological Flexibility Index (PPFI) and explored how these subgroups relate to a risk factor (perceived stress) and mental health outcomes (depression, anxiety, negative affect, and positive affect) in the context of COVID-19.
Methods: A sample of 659 participants (Mage = 19. 99, SD = 1.27; 57.97% females) completed the questionnaires online. Latent profile analysis (LPA) was employed to determine the optimal number of subgroups or profiles. Then, multinomial logistic regression and analyses of variance were used to identify variables associated with profile membership.
Results: LPA identified three distinct profiles (active strategy, inconsistent strategy, and passive strategy). Furthermore, multinomial logistic regressions indicated that students with high perceived stress were more likely to be in the passive strategy group than the active strategy group (β = − 0.104, OR = 0.901, p < 0.001) and the inconsistent strategy group (β = − 0.087, OR = 0.917, p < 0.001). Additionally, analyses of variance revealed that the three profiles differed in depression (η2 = 0.062, p < 0.001), anxiety (η2 = 0.059, p < 0.001), negative affect (η2 = 0.047, p < 0.001), and positive affect (η2 = 0.048, p < 0.001).
Conclusion: The current study employed LPA based on the PPFI to identify and confirm three profiles of psychological flexibility. We found that perceived stress and mental health outcomes were associated with these three profiles. This study offers a new perspective on understanding psychological flexibility through a person-centered approach. Furthermore, interventions aimed at reducing college students’ perceived stress during the COVID-19 crisis are critical for preventing the deterioration of psychological flexibility.
Keywords: SARS-CoV-2, Personalized Psychological Flexibility Index, stress, mental well-being, latent profile analysis
Introduction
The current outbreak of COVID-19, a novel coronavirus, has rapidly spread throughout the world. International concerns about health issues have arisen as a result of the ongoing coronavirus, which has posed serious threats to psychological health worldwide.1–4 Because of their almost ubiquitous transition to restricted social interactions and online study, college students have been overwhelmingly impacted by the current COVID-19 health crisis.5 Coping with these life transitions is often stressful and can exert a pronounced negative impact on students’ well-being.6 Thus, behaving in alignment with values may be more difficult and more likely to be psychologically inflexible. Psychological flexibility is described as “the pursuit of valued goals despite the presence of distress”.7 In the Acceptance and Commitment Therapy (ACT) model of behavior change, one of the primary therapy goals is to increase psychological flexibility.8 Numerous studies have shown that psychological flexibility is considered to be a key ingredient to psychological health and daily well-being.7 Nevertheless, a lack of psychological flexibility contributes to a variety of negative psychological issues, including anxiety, depression, emotional distress, interpersonal distress, and other issues.8–13
Based on the ACT model, researchers have developed various scales to assess psychological flexibility. There is no doubt that these commonly used measurements have important values and have contributed to our understanding of psychological flexibility, yet there are significant flaws and criticisms. In a nutshell, an increasing amount of empirical evidence has indicated that the measurement of psychological flexibility has primarily relied on scales with low construct validity and imprecise borders with negative emotionality and distress instead of psychological flexibility.14–19 For these reasons, Kashdan et al16 designed the Personalized Psychological Flexibility Index (PPFI), a new self-report scale to more accurately assess psychological flexibility. According to a scoping review, the PPFI is the superior measure that has made an effort to address the criticisms of psychological flexibility measures mentioned above.20
To date, the majority of psychological flexibility research has focused on how it affects people’s lives at the variable or group level, investigating the impacts of particular variables across all study participants. Compared with that, person-centered approaches like latent profile analyses (LPA) can help with the identification of distinct categories or subgroups of people based on personal response patterns on a variety of factors.21 Specifically, LPA divides respondents into heterogeneous groups, calculates all potential responses that could belong to a particular group, fits models using a variety of model fit metrics, identifies the number of profiles depending on those metrics, and explores intricate correlations between variables.22,23 To our knowledge, there are no articles have been published that thoroughly examine latent profiles across the PPFI dimensions. Although two studies have conducted person-centered approaches based on the ACT model’s core constructs,24,25 it’s crucial to emphasize that measurement attempts of psychological flexibility in these two studies lacked accuracy and have received aforementioned criticism.20 To verify the psychological flexibility subgroup patterns, more person-centered studies utilizing measures (such as the PPFI) that accurately capture the construct of psychological flexibility and possess strong psychometric properties are required. Accordingly, in the present study, we used the PPFI to assess psychological flexibility and employed LPA to explore subgroup patterns of psychological flexibility.
Some previous studies have demonstrated the links between psychological flexibility and the theory’s risk and outcome variables respectively. In terms of risk factors, prior studies have revealed that psychological flexibility in the ACT model is primarily reflected in cognitive fusion and experiential avoidance.14,19,26,27 Therefore, lower levels of cognitive fusion and experiential avoidance correspond to higher levels of psychological flexibility, and vice versa. According to certain studies, perceived stress is significantly related to cognitive fusion and experiential avoidance.28,29 Besides, some studies have discovered that work stress is negatively correlated with psychological flexibility.30 In terms of the outcome variables, the effects of low psychological flexibility on psychopathology and overall psychological ill-health have been widely explored.31–33 According to these findings, it is reasonable to hypothesize that psychological flexibility profiles based on the PPFI correlate with perceived stress and mental health outcomes during the COVID-19 crisis.
The main objective of the present study was to examine the psychological flexibility construct assessed by the PPFI from a person-centered approach. Additionally, utilizing the groups that were discovered in the LPA, the likelihood of profile membership according to the risk factor and mental health outcomes of psychological flexibility were compared. The current study represents an important addition to the literature by employing a superior measure of psychological flexibility that addressed the criticisms regarding its measurement and employing the person-centered approach to investigate the latent profiles of psychological flexibility as well as its relationships with antecedent and outcome variables. This could help us comprehend the literature on psychological flexibility and benefit organizations to formulate effective public health interventions for COVID-19.
Methods
Participants and Procedure
This cross-sectional survey was conducted in Eastern China during COVID‐19 (August 2021). In this study, we collected primary data on the Survey Star (an online survey platform) by disseminating questionnaires to potential participants through the QQ or WeChat groups (online social media platforms). Data were collected from participants who met the following criteria: (a) college students, (b) using social media, and (c) volunteering to take part in the research. A total of 718 college students were recruited for this study. 59 individuals were removed from the initial group for failing quality check items or failing attention check items. The effective response rate was 91.78%. Among the remaining 659 participants (Mage = 19. 99, SD = 1.27; 277 males and 382 females), 171 (25.94%) were freshmen, 204 (30.95%) were sophomores, 125 (18.96%) were juniors, 159 (24.12%) were seniors. As regards sample size calculation for LPA, there is no concrete guideline. Based on a general rule of thumb from the Pennsylvania State University Methodology Center, the sample should have a minimum of 300 participants.34 Therefore, the sample size of 659 participants in this study was reasonable. The study complied with the Declaration of Helsinki and was approved by the Research Ethics Committee of the first author’s university. All participants provided online informed consent. Figure 1 illustrates the study process in a sequence flowchart.
 |
Figure 1 Flowchart for study process. Abbreviations: AIC, Akaike Information Criterion; BIC, Bayesian Information Criteria; SSA-BIC, Sample-Size-Adjusted BIC; LMR, Lo–Mendell–Rubin Likelihood Ratio Test; BLRT, Bootstrap Likelihood Ratio Test. |
Measures
Perceived Stress Scale
The Chinese version35 of the Perceived Stress Scale36 with Mapi Research Trust permission was employed to evaluate the level of perceived stress over the past month. There are 10 items (eg, “In the last month, how often have you found that you could not cope with all the things that you had to do?”). Each item is evaluated on a 5-point Likert scale (0 = none, 4 = most of the time). The scale’s Cronbach’s α in this research was 0.80.
Personalized Psychological Flexibility Index
It is a 15-item scale used to evaluate levels of psychological flexibility across three dimensions: avoid, accept, and harness discomfort.16 Every item is assessed on a 7-point Likert scale. One of the sample items is “I avoid the most difficult goal-related tasks”. The items of PPFI were obtained by a translation/back-translation procedure performed by a professor majoring in English and other three professors whose majors were psychology. Given that the PPFI can indeed be tailored to meet the needs of the population,16 we classified item 6 “I accept the setbacks when pursuing this goal” from the acceptance subscale as the dimension of avoidance based on the exploratory factor analysis findings and Chinese culture. The scale’s validity was confirmed by the findings of the confirmatory factor analysis that all factor loadings ranged from 0.69 to 0.91 and that the three-factor model matched the data well (χ²/df = 1.164, CFI = 0.998, TLI = 0.997, RMSEA = 0.016, SRMR = 0.022). The Cronbach’s α of the total scale and its subscales in the current study were 0.89 (total PPFI), 0.92 (avoidance), 0.80 (acceptance), and 0.90 (harnessing).
Depression Anxiety and Stress Scale
The Chinese version37 of the Depression Anxiety Stress Scale38 was employed to assess participants’ levels of depression and anxiety, with seven items evaluating the perception of depression and seven items evaluating the perception of anxiety. All items (eg, “I found it hard to wind down”.) are scored on a 4-point Likert scale (0 = never, 3 = often, or always). In the current study, the Cronbach’s α of the depression subscale was 0.89 and the Cronbach’s α of the anxiety subscale was 0.86.
Positive and Negative Affect Schedule–Short Form
Positive affect and negative affect were assessed using the Chinese version39 of the Positive and Negative Affect Scale.40 The scale contains 10 items, five of which assess positive affect (eg, “Attentive”) and five of which assess negative affect (eg, “Nervous”). Items are evaluated on a 5-point Likert scale (1 = none, 5 = very much). In the current study, the Cronbach’s α of the positive affect subscale was 0.89, and the Cronbach’s α of the negative affect subscale was 0.87.
Analytical Approach
For the first step, we used Mplus 7.0 for LPA to derive patterns of participants’ psychological flexibility that best suited the data. Beginning with just two profiles, we tested models and progressively raised the number of profiles until there was no more significant difference in the model fit. We evaluated a number of metrics to figure out the appropriate number of profiles, including the Akaike Information Criterion (AIC), the Bayesian Information Criterion (BIC), the Sample-Size-Adjusted BIC (SSA-BIC), the Entropy, the Lo–Mendell–Rubin Likelihood Ratio Test (LMR), and the Bootstrap Likelihood Ratio Test (BLRT). Of these metrics, AIC, BIC, and SSA-BIC serve as model fit indicators, with smaller AIC, BIC, and SSA-BIC values indicating better model fit. Furthermore, the certainty of model classification was evaluated using the Entropy value. An Entropy value closer to 1 shows a good model fit.41 The LMR and BLRT are both indicators that can be used to compare two solutions, with a significant probability value suggesting that a k profile model performs better than a k-1 profile model in terms of model fit.22 Then, we used multinomial logistic regression in SPSS 21.0 to examine relationships between the risk factor (perceived stress) and psychological flexibility profiles. In the last step, we compared the degree of depression, anxiety, negative affect, and positive affect among the profiles identified in LPA using analyses of variance (ANOVAs) in SPSS 21.0.
Results
Preliminary Analyses
The variables’ means, standard deviations, and correlations are shown in Table 1. Psychological flexibility was detected to be negatively related to perceived stress, depression, anxiety, and negative affect. Meanwhile, a positive correlation was found between psychological flexibility and positive affect.
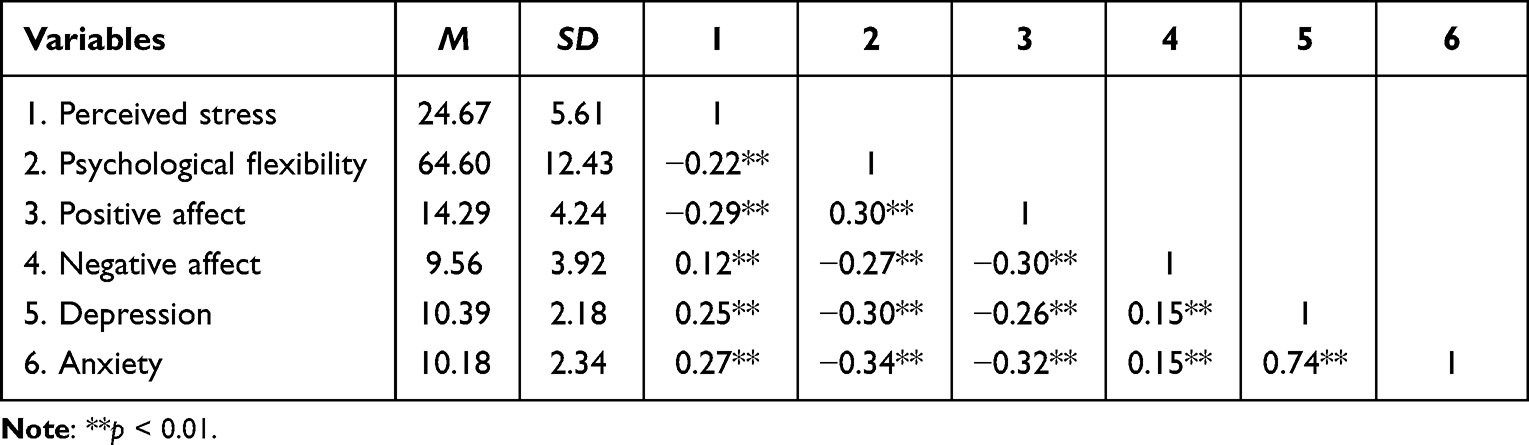 |
Table 1 Means, Standard Deviations, and Correlations Between Variables |
Latent Profile Analysis
Table 2 shows the fit statistics of potential profiles. With the increase of profile, the AIC, BIC, and SSA-BIC values decreased, confirming that the model fit improved. The four-profile model’s LMR(p) was not significant, suggesting that the three-profile model was superior to the four-profile model and excluding the four-profile model as a potential contender for the best solution. For these reasons, the three-profile model appeared to fit our data the best.
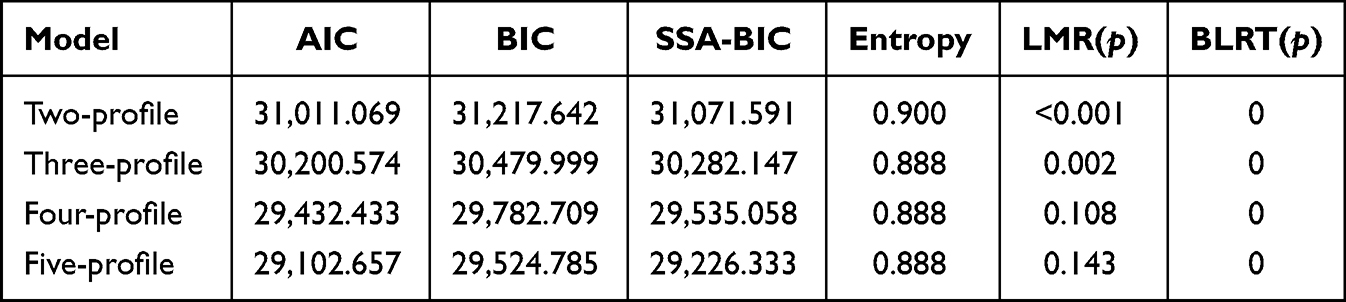 |
Table 2 Indicators of Fit for the Latent Profile Analysis |
Table 3 and Figure 2 show the means and standard deviations for each indicator of psychological flexibility. The largest profile of the three profiles was characterized by the lowest avoidance but the highest acceptance and harnessing and was labeled as the active strategy group (40.82%). The second largest profile was characterized by the lowest acceptance, harnessing, and intermediate levels of avoidance and was labeled as the passive strategy group (31.56%). The smallest profile was characterized by the highest avoidance, and intermediate levels of both acceptance and harnessing and was labeled as the inconsistent strategy group (27,62%).
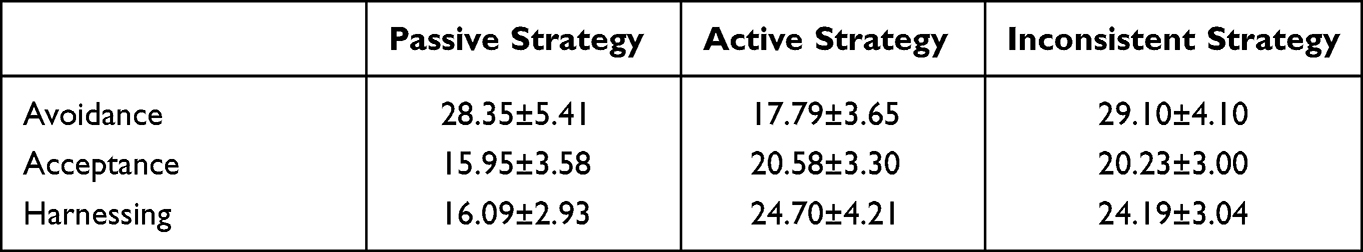 |
Table 3 Descriptive Results of the Three Profiles Across the Three Dimensions (M±SD) |
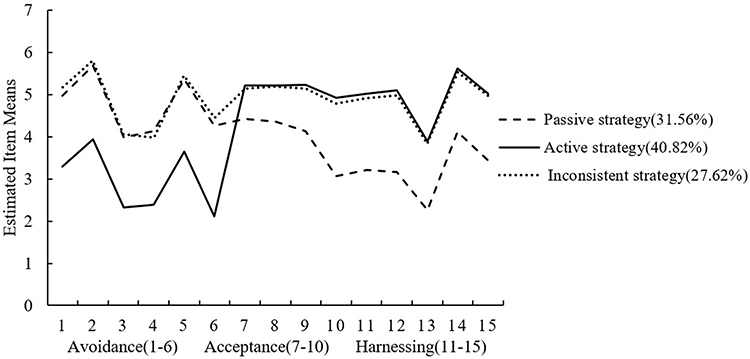 |
Figure 2 Latent profile analysis produced three profiles of psychological flexibility. Note: All differences are significant at p < 0.05. |
Associations Between Profile and Perceived Stress
To explore the group differences, we conducted multinomial logistic regressions to investigate how perceived stress affected the psychological flexibility profiles. The effect size was indicated by the Odds Ratio (OR). Table 4 shows that the perceived stress of the passive strategy group was higher than that of the active strategy group (β = −0.104, OR = 0.901, p < 0.001) and the inconsistent strategy group (β = −0.087, OR = 0.917, p < 0.001).
 |
Table 4 Multinomial Logistic Regression Results of Perceived Stress on Psychological Flexibility Profile Categories |
Correlations Between Profile and Mental Health Outcomes
The depression, anxiety, negative affect, and positive affect across psychological flexibility profiles were explored by ANOVAs. As presented in Table 5 and Figure 3, the findings show significant differences in the levels of depression, F (2, 659) = 21.77, p < 0.001; anxiety, F (2, 659) = 20.75, p < 0.001; negative affect, F (2, 659) = 16.18, p < 0.001; and positive affect, F (2, 659) = 16.54, p < 0.001. To find differences among the three profiles, post hoc tests were employed. The results show that there were significant differences across the three profiles for depression, anxiety, positive affect, and negative affect. So first of all, the passive strategy group had the lowest levels of positive affect (M = 13.11, SD = 3.83) and the highest levels of depression (M = 11.08, SD = 2.19), anxiety (M = 10.94, SD = 2.59), and negative affect (M = 10.43, SD = 4.00). Meanwhile, the inconsistent strategy group exhibited moderate levels of negative affect (M = 10.06, SD = 4.00), and positive affect (M = 14.14, SD = 3.92), in addition to moderate levels of depression (M = 10.47, SD = 2.25) and anxiety (M = 10.14, SD = 2.28). Finally, the active strategy group had the highest levels of positive affect (M = 15.30, SD = 4.54) and the lowest levels of negative affect (M = 8.55, SD = 3.57), depression (M = 9.80, SD = 1.95), and anxiety (M = 9.60, SD = 1.98).
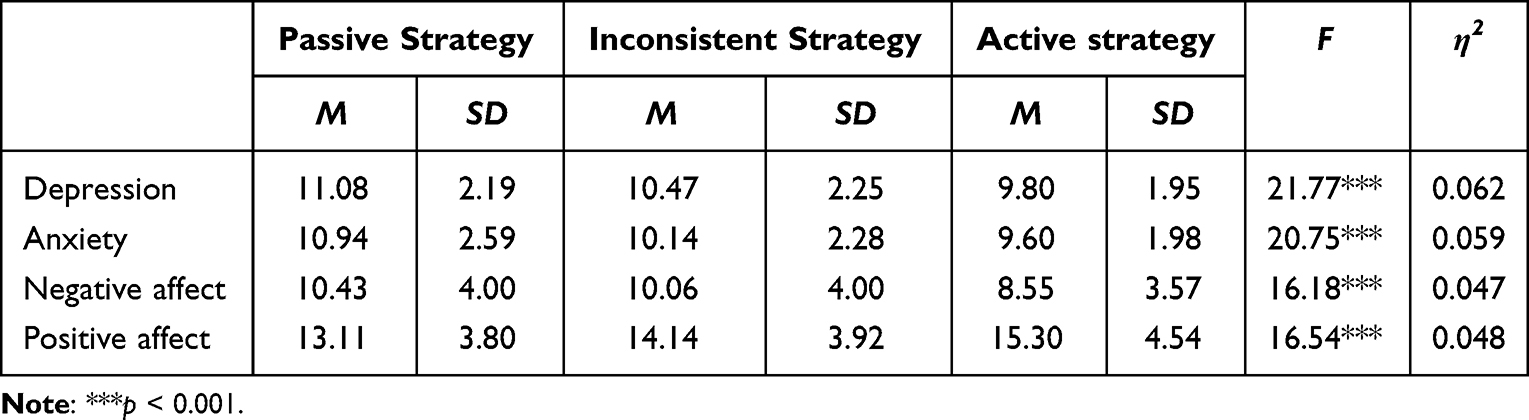 |
Table 5 Results of the Variance Analyses Performed on the Variables of Mental Health |
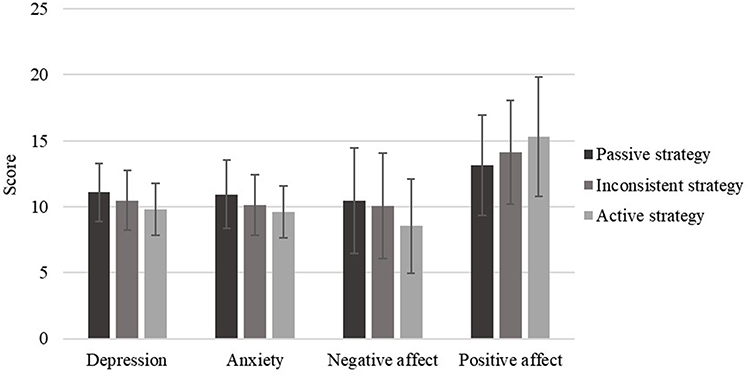 |
Figure 3 Results of the variance analyses conducted on the mental health outcomes of depression, anxiety, and negative and positive affect; means and standard deviations of the three profiles are displayed. |
Discussion
The outbreak of COVID-19 and related public health restrictions affected people widely and were associated with negative effects in terms of daily activity, mental health, and well-being.1–4 Our findings confirm that the COVID-19 pandemic is a common risk factor for healthy functioning across different populations and contexts. The current study represents the first published attempt to identify psychological flexibility profiles of individuals based on the three dimensions of the PPFI during COVID-19. Hence, the present study revealed basic patterns of strategies employed by college students to manage distress during the epidemic of COVID-19. The results showed that three different types with significantly different profiles consequently formed and were given the names (a) active strategy group, (b) inconsistent strategy group, and (c) passive strategy group. These groups showed differences in risk factor and self-reported symptoms of mental health outcomes. Our study sheds light on the patterns of different types of psychological flexibility and their links with other variables, which may have an impact on the development of tailored interventions to lessen the detrimental consequences of COVID-19.
Our findings implied that college students used different strategies to deal with the distress that arises while pursuing personally meaningful goals, which is different from previous studies that divided psychological flexibility into three types: high, medium, and low.24,25 In this study, the active strategy group was identified by low avoidance, and high acceptance and harnessing. The passive strategy group was identified by high avoidance, and low acceptance and harnessing. Interestingly, the inconsistent strategy group reported high levels of both avoidance and acceptance. Although this might seem contradictory, we would argue that the ways of managing distress could vary across contexts, situations, and times. Specifically, the same individual might exhibit high rigidity and inflexibility at work (employing high levels of avoidance) but might also be particularly flexible in personal relationships (engaging in high levels of acceptance). Thus, over the same period, the same individual might report high levels of both avoidance and acceptance. Accordingly, it appeared that the group with inconsistent strategy had a more mixed strategy for dealing with distress. The characteristics of the profiles in the current study are inconsistent with the findings of Tyndall et al25 and Bi and Li,24 possibly because the measurements of psychological flexibility were not identical or the cultural background is different. Thus, the findings of this study add to a growing number of research suggesting that clinicians and researchers could gain crucial insights into psychological flexibility by not only differentiating psychological inflexibility from psychological flexibility, but also by monitoring particular dimensions of psychological flexibility using a scale like the PPFI.
We found that college students who reported high levels of perceived stress were more likely to belong to the passive strategy group, while those with low perceived stress were more likely to belong to the inconsistent strategy group or the active strategy group. To be more specific, students who have experienced high levels of perceived stress are more likely to avoid discomfort during valued goal pursuit, while those with low perceived stress tend to accept and harness rather than avoid discomfort arising from obstacles during goal pursuit. Given the measurement of psychological flexibility we have used, there was no research to examine these results based on the PPFI. Whereas, Huang et al29 found that perceived stress is positively correlated with experiential avoidance and cognitive fusion, which to some extent corroborates the findings. The current data is also consistent with previous variable-centered studies which revealed that higher levels of stress are linked to lower levels of psychological flexibility.42 In addition, we found that although lower than that for the passive strategy group, the perceived stress of the inconsistent strategy group was significantly higher than that of the active strategy group. According to Kashdan et al,16 avoidance is a relatively unhealthy strategy when seeking a personally important goal and acceptance is a strategy that is increasingly active and healthy. Further, harnessing is a strategy for recognizing and utilizing painful emotions in order to motivate goal pursuit. It is worth reminding that harnessing may play an important role in tenaciously pursuing meaningful goals and has been identified as a defining characteristic of effective functioning.16 Based on the findings of Arble et al,43 perceived stress predicts dysfunctional strategies. Chan et al44 discovered that students who experienced higher levels of stress are more prone to employ avoidance coping strategies, instead of effective or useful coping strategies such as acceptance and harnessing.16 These explanations would also explain our result that the passive strategy group displayed a higher level of perceived stress, followed by the inconsistent strategy group and the active strategy group. Compared with previous studies, the current study further revealed that the profiles of psychological flexibility had unique patterns of associations with perceived stress, as well as what strategies people might use to manage their distress when perceiving different degrees of stress in the context of COVID-19. Accordingly, the results of this study implicate that intervention for the psychological flexibility of college students should take reducing stress during the COVID-19 crisis into account.
In terms of mental health outcomes, significant group differences emerged. We found that depression, anxiety, and negative affect were significantly higher in the passive and inconsistent strategy groups than in the active strategy group. We also noticed that the active strategy group had significantly higher levels of positive affect than the inconsistent strategy group and the passive strategy group. Both the inconsistent strategy group and active strategy group scored lower on depression, anxiety, and negative affect than the passive strategy group, indicating that low levels of psychological flexibility may be a cause of poor mental health. The results also showed that high psychological flexibility participants have better mental health but low psychological flexibility participants have poor mental health, indicating a relative weakness for those with low psychological flexibility. It reveals that psychological flexibility and mental health are strongly related, which is in line with the findings of studies that use a variable-oriented approach,14,31,45 and those of Tyndall et al25 conducted in Western participants. Additionally, associations between the profiles and mental health outcomes support the notion that psychological flexibility is fundamental to health and confirm that psychological flexibility is beneficial to a person and contributes to healthier outcomes.7 Our study extends these findings to Chinese college students and the COVID-19 global epidemic context, hence supporting the idea that psychological flexibility serves as a universally beneficial protective factor for mental health across a wide range of populations and situations.
Limitations and Future Directions
Although the current study is the first to provide insights into fundamental profiles of psychological flexibility based on the PPFI, some limitations should be addressed in subsequent research. First, the well-educated sample from college in China might limit the findings’ generalizability. Future research ought to involve people from various age and cultural groups. Second, as the current study relies solely on self-report data, future research should utilize measurements from various sources including more objective sources of data to enhance objectivity and validity in reports. Third, we are unable to examine changes in patterns of these profiles over time and draw causal conclusions because this study is a cross-sectional design. Therefore, longitudinal data or experimental designs would provide more refined conclusions.
Conclusion
The current study adds to the body of knowledge by being the first to use LPA to identify distinct profiles of psychological flexibility based on the PPFI. We found three types of psychological flexibility (active strategy, inconsistent strategy, and passive strategy) among Chinese college students during the COVID-19 pandemic. Further, the psychological flexibility subgroups were significantly associated with perceived stress and reported significantly different levels of depression, anxiety, and negative and positive affect. This could help researchers and clinicians understand an individual’s psychological flexibility level across subcomponents of psychological flexibility using a scale like the PPFI more accurately and formulate effective public health interventions for COVID-19.
Data Sharing Statement
The data that support the findings of this study are available from the corresponding author upon request.
Ethics Statement
The study complied with the Declaration of Helsinki and was approved by the Research Ethics Review Committee of Jiangxi Normal University’s School of Psychology. The ethics review approval number is IRB-JXNU-PSY-2020029. All participants provided online informed consent at the beginning of the questionnaire.
Acknowledgments
We are particularly grateful to the participants who took the time to complete our study. We also extend our gratitude to the editors and reviewers for their feedback and helpful comments on this article. Additionally, artificial intelligence was not used at any stage in writing this article.
Funding
This study was supported by the National Natural Science Foundation of China (72164018), National Social Science Fund Project (BFA200065), Jiangxi Social Science Foundation Project (21JY13).
Disclosure
The authors declare no conflict of interest.
References
1. Akbari HA, Pourabbas M, Yoosefi M, et al. How physical activity behavior affected well-being, anxiety and sleep quality during COVID-19 restrictions in Iran. Eur Rev Med Pharmacol Sci. 2021;25(24):7847–7857. doi:10.26355/eurrev_202112_27632
2. Dergaa I, Ammar A, Souissi A, et al. COVID-19 lockdown: impairments of objective measurements of selected physical activity, cardiorespiratory and sleep parameters in trained fitness coaches. EXCLI J. 2022;21:1084–1098. doi:10.17179/excli2022-4986
3. Trabelsi K, Ammar A, Masmoudi L, et al. Globally altered sleep patterns and physical activity levels by confinement in 5056 individuals: ECLB COVID-19 international online survey. Biol Sport. 2021;38(4):495–506. doi:10.5114/biolsport.2021.101605
4. Zhou Y, Draghici A, Abbas J, Mubeen R, Boatca ME, Salam MA. Social media efficacy in crisis management: effectiveness of non-pharmaceutical interventions to manage COVID-19 challenges. Front Psychiatry. 2022;12:626134. doi:10.3389/fpsyt.2021.626134
5. Hurlocker M, Madson MB, Lui PP, et al. Mental health risk profiles and related substance use during coronavirus pandemic among college students who use substances. Int J Ment Health Ad. 2022:1–18. doi:10.1007/s11469-022-00813-1
6. Lee J. Features Mental health effects of school closures during COVID-19. Lancet Child Adolesc Health. 2020;4(6):421. doi:10.1016/s2352-4642(20)30109-7
7. Kashdan TB, Rottenberg J. Psychological flexibility as a fundamental aspect of health. Clin Psychol Rev. 2010;30(7):865–878. doi:10.1016/j.cpr.2010.03.001
8. Hayes SC, Luoma JB, Bond FW, Masuda A, Lillis J. Acceptance and commitment therapy: model, processes and outcomes. Behav Res Ther. 2006;44(1):1–25. doi:10.1016/j.brat.2005.06.006
9. Bond FW, Bunce D. The role of acceptance and job control in mental health, job satisfaction, and work performance. J Appl Psychol. 2003;88(6):1057–1067. doi:10.1037/0021-9010.88.6.1057
10. Chapman AL, Gratz KL, Brown MZ. Solving the puzzle of deliberate self-harm: the experiential avoidance model. Behav Res Ther. 2006;44(3):371–394. doi:10.1016/j.brat.2005.03.005
11. Chawla N, Ostafin B. Experiential avoidance as a functional dimensional approach to psychopathology: an empirical review. J Clin Psychol. 2007;63(9):871–890. doi:10.1002/jclp.20400
12. Greco LA, Heffner M, Poe S, Ritchie S, Polak M, Lynch SK. Maternal adjustment following preterm birth: contributions of experiential avoidance. Behav Ther. 2005;36(2):177–184. doi:10.1016/s0005-7894(05)80066-8
13. Krafft J, Hicks ET, Mack SA, Levin M. Psychological inflexibility predicts suicidality over time in college students. Suicide Life Threat Behav. 2019;49(5):1488–1496. doi:10.1111/sltb.12533
14. Bond FW, Hayes SC, Baer RA, et al. Preliminary psychometric properties of the acceptance and action questionnaire-II: a revised measure of psychological inflexibility and experiential avoidance. Behav Ther. 2011;42(4):676–688. doi:10.1016/j.beth.2011.03.007
15. Doorley JD, Goodman FR, Kelso KC, Kashdan TB. Psychological flexibility: what we know, what we do not know, and what we think we know. Soc Personal Psychol Compass. 2020;14(12):1–11. doi:10.1111/spc3.12566
16. Kashdan TB, Disabato DJ, Goodman FR, Doorley JD, McKnight PE. Understanding psychological flexibility: a multimethod exploration of pursuing valued goals despite the presence of distress. Psychol Assess. 2020;32(9):829–850. doi:10.1037/pas0000834
17. Rochefort C, Baldwin AS, Chmielewski M. Experiential avoidance: an examination of the construct validity of the AAQ-II and MEAQ. Behav Ther. 2018;49(3):435–449. doi:10.1016/j.beth.2017.08.008
18. Tyndall I, Waldeck D, Pancani L, Whelan R, Roche B, Dawson DL. The Acceptance and Action Questionnaire-II (AAQ-II) as a measure of experiential avoidance: concerns over discriminant validity. J Contextual Behav Sci. 2019;12:278–284. doi:10.1016/j.jcbs.2018.09.005
19. Wolgast M. What does the acceptance and action questionnaire (AAQ-II) really measure? Behav Ther. 2014;45(6):831–839. doi:10.1016/j.beth.2014.07.002
20. Cherry KM, Vander Hoeven E, Patterson TS, Lumley MN. Defining and measuring “psychological flexibility”: a narrative scoping review of diverse flexibility and rigidity constructs and perspectives. Clin Psychol Rev. 2021;84:101973. doi:10.1016/j.cpr.2021.101973
21. Jung T, Wickrama KAS. An introduction to latent class growth analysis and growth mixture modeling. Soc Personal Psychol Compass. 2008;2(1):302–317. doi:10.1111/j.1751-9004.2007.00054.x
22. Nylund KL, Asparoutiov T, Muthen BO. Deciding on the number of classes in latent class analysis and growth mixture modeling: a Monte Carlo simulation study. Struct Equ Modeling. 2007;14(4):535–569. doi:10.1080/10705510701575396
23. Wang M, Hanges PJ. Latent class procedures: applications to organizational research. Organ Res Methods. 2011;14(1):24–31. doi:10.1177/1094428110383988
24. Bi DD, Li XY. Psychological flexibility profiles, college adjustment, and subjective well-being among college students in China: a latent profile analysis. J Contextual Behav Sci. 2021;20:20–26. doi:10.1016/j.jcbs.2021.01.008
25. Tyndall I, Waldeck D, Pancani L, Whelan R, Roche B, Pereira A. Profiles of psychological flexibility: a latent class analysis of the acceptance and commitment therapy model. Behav Modif. 2020;44(3):365–393. doi:10.1177/0145445518820036
26. Cobos-Sanchez L, Flujas-Contreras JM, Becerra IG. Relation between psychological flexibility, emotional intelligence and emotion regulation in adolescence. Curr Psychol. 2022;41(8):5434–5443. doi:10.1007/s12144-020-01067-7
27. Yasinski C, Hayes AM, Ready CB, Abel A, Gorg N, Kuyken W. Processes of change in cognitive behavioral therapy for treatment-resistant depression: psychological flexibility, rumination, avoidance, and emotional processing. Psychother Res. 2020;30(8):983–997. doi:10.1080/10503307.2019.1699972
28. Bardeen JR, Fergus TA. The interactive effect of cognitive fusion and experiential avoidance on anxiety, depression, stress and posttraumatic stress symptoms. J Contextual Behav Sci. 2016;5(1):1–6. doi:10.1016/j.jcbs.2016.02.002
29. Huang C, Xie JY, Owusua T, et al. Is psychological flexibility a mediator between perceived stress and general anxiety or depression among suspected patients of the 2019 coronavirus disease (COVID-19)? Pers Individ Dif. 2021;183:111132. doi:10.1016/j.paid.2021.111132
30. Singh RS, O’Brien WH. The impact of work stress on sexual minority employees: could psychological flexibility be a helpful solution? Stress Health. 2020;36(1):59–74. doi:10.1002/smi.2913
31. Karekla M, Panayiotou G. Coping and experiential avoidance: unique or overlapping constructs? J Behav Ther Exp Psychiatry. 2011;42(2):163–170. doi:10.1016/j.jbtep.2010.10.002
32. Kashdan TB, Barrios V, Forsyth JP, Steger MF. Experiential avoidance as a generalized psychological vulnerability: comparisons with coping and emotion regulation strategies. Behav Res Ther. 2006;44(9):1301–1320. doi:10.1016/j.brat.2005.10.003
33. Stange JP, Alloy LB, Fresco DM. Inflexibility as a vulnerability to depression: a systematic qualitative review. Clin Psychol-Sci Pr. 2017;24(3):245–276. doi:10.1111/cpsp.12201
34. LCA and LTA modeling FAQ. Pennsylvania State University methodology center; 2018.
35. Lu W, Bian Q, Wang W, Wu X, Wang Z, Zhao M. Chinese version of the perceived stress scale-10: a psychometric study in Chinese university students. PLoS One. 2017;12(12):e0189543. doi:10.1371/journal.pone.0189543
36. Cohen S, Kamarck T, Mermelstein R. A global measure of perceived stress. J Health Soc Behav. 1983;24:385–396. doi:10.2307/2136404
37. Gong X, Xie XY, Xu R, Luo YJ. Psychometric properties of the Chinese versions of DASS-21 in Chinese college students. Chin J Clin Psychol. 2010;18(4):443–446. doi:10.16128/j.cnki.1005-3611.2010.04.020
38. Lovibond PF, Lovibond SH. The structure of negative emotional states: comparison of the Depression Anxiety Stress Scales (DASS) with the beck depression and anxiety inventories. Behav Res Ther. 1995;33(3):335–343. doi:10.1016/0005-7967(94)00075-u
39. Liu J-D, You R-H, Liu H, Chung P-K. Chinese version of the international positive and negative affect schedule short form: factor structure and measurement invariance. Health Qual Life Out. 2020;18(1):1–8. doi:10.1186/s12955-020-01526-6
40. Thompson ER. Development and validation of an internationally reliable short-form of the positive and negative affect schedule (Panas). J Cross Cult Psychol. 2007;38(2):227–242. doi:10.1177/0022022106297301
41. Lubke G, Muthen BO. Performance of factor mixture models as a function of model size, covariate effects, and class-specific parameters. Struct Equ Modeling. 2007;14(1):26–47. doi:10.1207/s15328007sem1401_2
42. Wersebe H, Lieb R, Meyer AH, Hofer P, Gloster AT. The link between stress, well-being, and psychological flexibility during an Acceptance and Commitment Therapy self-help intervention. Int J Clin Health Psyc. 2018;18(1):60–68. doi:10.1016/j.ijchp.2017.09.002
43. Arble E, Daugherty AM, Arnetz BB. Models of first responder coping: police officers as a unique population. Stress Health. 2018;34(5):612–621. doi:10.1002/smi.2821
44. Chan CKL, So WKW, Fong DYT. Hong Kong baccalaureate nursing students’ stress and their coping strategies in clinical practice. J Prof Nurs. 2009;25(5):307–313. doi:10.1016/j.profnurs.2009.01.018
45. Dalrymple KL, Herbert JD. Acceptance and commitment therapy for generalized social anxiety disorder - A pilot study. Behav Modif. 2007;31(5):543–568. doi:10.1177/0145445507302037
 © 2023 The Author(s). This work is published and licensed by Dove Medical Press Limited. The
full terms of this license are available at https://www.dovepress.com/terms
and incorporate the Creative Commons Attribution
- Non Commercial (unported, 3.0) License.
By accessing the work you hereby accept the Terms. Non-commercial uses of the work are permitted
without any further permission from Dove Medical Press Limited, provided the work is properly
attributed. For permission for commercial use of this work, please see paragraphs 4.2 and 5 of our Terms.
© 2023 The Author(s). This work is published and licensed by Dove Medical Press Limited. The
full terms of this license are available at https://www.dovepress.com/terms
and incorporate the Creative Commons Attribution
- Non Commercial (unported, 3.0) License.
By accessing the work you hereby accept the Terms. Non-commercial uses of the work are permitted
without any further permission from Dove Medical Press Limited, provided the work is properly
attributed. For permission for commercial use of this work, please see paragraphs 4.2 and 5 of our Terms.
Recommended articles
Has the COVID-19 Pandemic Traumatized Us Collectively? The Impact of the COVID-19 Pandemic on Mental Health and Sleep Factors via Traumatization: A Multinational Survey
Holzinger B, Nierwetberg F, Chung F, Bolstad CJ, Bjorvatn B, Chan NY, Dauvilliers Y, Espie CA, Han F, Inoue Y, Leger D, Macêdo T, Matsui K, Merikanto I, Morin CM, Mota-Rolim SA, Partinen M, Plazzi G, Penzel T, Sieminski M, Wing YK, Scarpelli S, Nadorff MR, De Gennaro L
Nature and Science of Sleep 2022, 14:1469-1483
Published Date: 26 August 2022
Pre- and Post-Pandemic (COVID-19) Mental Health of International Students: Data from a Longitudinal Study
Jamshaid S, Bahadar N, Jamshed K, Rashid M, Imran Afzal M, Tian L, Umar M, Feng X, Khan I, Zong M
Psychology Research and Behavior Management 2023, 16:431-446
Published Date: 15 February 2023
The Relationship Between Psychological Flexibility and Depression, Anxiety and Stress: A Latent Profile Analysis
Wang J, Fang S, Yang C, Tang X, Zhu L, Nie Y
Psychology Research and Behavior Management 2023, 16:997-1007
Published Date: 24 March 2023
Health-Related Quality of Life for Jordanian-Recovered Individuals During Post-COVID-19 Era: A Cross-Sectional Study
Abuhammad S, Khabour OF, Alzoubi KH, Hamaideh S, Khassawneh BY, Mehrass AAO, Alsmadi BF, Ababneh AM
Patient Preference and Adherence 2023, 17:1303-1310
Published Date: 22 May 2023
Dietary Supplement Consumption and Mental Health in Indonesian Adults During Second Wave of COVID-19 Pandemic
Yusof J, d'Arqom A, Andriani AP, Nasution MZ, Fatimah N, Mustika A, Handayani S, Syed Abdul Kadir SZ
Patient Preference and Adherence 2023, 17:1799-1811
Published Date: 24 July 2023