Back to Journals » Journal of Inflammation Research » Volume 19
Paired Tear Fluid – Plasma Inflammatory Profiling Identifies Compartment-Specific Biomarkers for Diabetic Retinopathy and Diabetic Macular Edema
Authors Yu T ![]() , Li S, Cheng F, Liu Y, Hou G, Dong J, Huang Y, Qu S, Chen Q
, Li S, Cheng F, Liu Y, Hou G, Dong J, Huang Y, Qu S, Chen Q ![]()
Received 24 February 2026
Accepted for publication 27 May 2026
Published 30 June 2026 Volume 2026:19 604273
DOI https://doi.org/10.2147/JIR.S604273
Checked for plagiarism Yes
Review by Single anonymous peer review
Peer reviewer comments 2
Editor who approved publication: Dr Quan Zhang
Ting Yu
Sheng Li
Fang Cheng
Yanzi Liu
Guimei Hou
Jicheng Dong
Yanjie Huang
Shoufang Qu
Qiong Chen
Division of in vitro Diagnostics for Non-Infectious Diseases, National Institutes for Food and Drug Control, Beijing, People’s Republic of China
State Key Laboratory of Drug Regulatory Science, Beijing, People’s Republic of China
Dalian NO.3 People’s Hospital, Dalian, Liaoning, People’s Republic of China
School of Chemical Engineering, Dalian University of Technology, Dalian, Liaoning, People’s Republic of China
Guangdong Provincial Institute of Metrolog, Guangzhou, Guangdong, People’s Republic of China
Medical Research Center, Southern Medical University Nanfang Hospital, Guangzhou, Guangdong, People’s Republic of China
Correspondence to: Qiong Chen, Medical Research Center, Southern Medical University Nanfang Hospital, Guangzhou, Guangdong, People’s Republic of China, Email [email protected]
Shoufang Qu, State Key Laboratory of Drug Regulatory Science, Beijing, People’s Republic of China, Email [email protected]
Objective: Diabetic retinopathy (DR) is a primary contributor to vision loss worldwide and growing with an increase in the elderly population. Preventing or slowing DR progression remains a critical unmet need. Recognizing the significance of systemic and ocular chronic inflammation in the progression of DR, this study aimed to explore inflammatory factor profiles in plasma and tear samples to identify potential biomarkers and therapeutic targets.
Methods: Using Olink’s proximity extension assay, 92 inflammation-related proteins were measured in paired plasma and tear samples of 42 participants in type 2 diabetes mellitus (T2DM), DR and Diabetic Macular Edema (DME), followed by bioinformatic analysis for differentially expressed proteins (DEPs).
Results: Different expression patterns of inflammatory proteins were observed between plasma and tear level. Plasma DEPs was mainly decreased during DR development, while tears DEPs mainly upregulated. DME had more differential cytokines than DR in both samples. By multi-comparison analyses, 23 inflammatory factors exhibited differential expression in the three compared groups (DR vs T2DM, DME vs T2DM and DME vs DR) in plasma level, and 30 differential inflammatory cytokines in tear samples. GO and KEGG analysis enriched pathways were primarily associated with extracellular region, cytokine activity, IL17 signaling pathway and JAK-STAT signaling pathway.
Conclusion: Tears exhibit more DEPs than plasma during the progression of DR and DME, and the two sample types show opposite inflammatory factor expression trends. The DEPs in tears, especially the newly discovered inflammatory factors TNFSF14, CXCL11, IL6, CCL19, DNER and CXCL9 may serve as potential biomarkers for the diagnosis and progression monitoring of DR and DME.
Keywords:
diabetic retinopathy, diabetic macular edema, inflammatory factor, differential expression analysis, Olink proteomics, tear fluid
Introduction
DR constitutes a prevalent microvascular complication of diabetes mellitus (DM), resulting in visual impairment and blindness among nearly 40% of diabetic patients on a global scale.1 By 2045, the global prevalence of DR is projected to rise to 160.50 million.2,3 Prolonged hyperglycemia damages the retinal microvasculature, leading to heightened vascular permeability, inflammation activation, and oxidative stress.4,5 These pathological changes culminate in the transition from non-proliferative diabetic retinopathy (NPDR) to proliferative diabetic retinopathy (PDR).6 Additionally, DME, as a severe manifestation of DR, can detrimentally impact central vision at any DR stage, emerging as a prominent cause of vision loss among individuals of working age.7
Multiple studies have confirmed that the inflammatory mechanism plays a critical role in the pathogenesis of DR, and may serve as the initiating factor of the disease.8,9 This inflammatory cascade orchestrates several pathogenic processes associated with DR: (1) activating and facilitating the adhesion of recruited leukocytes to endothelial cells, (2) disrupting the blood-retinal barrier (BRB), (3) increasing vascular permeability, (4) causing capillary obstruction, and (5) promoting pathological neovascularization.10–12 Furthermore, inflammation is intricately linked to other pathological processes, including oxidative stress, the generation of advanced glycation end products (AGEs), and elevated levels of vascular endothelial growth factor (VEGF), thereby establishing a complex pathological network.13,14 However, DR is not solely an ocular disorder; it represents a local manifestation of systemic inflammation. Tear fluid interacts directly with the ocular surface microenvironment, reflecting the local retinal inflammatory status through compositional alterations, while plasma provides systemic inflammatory profiles.15,16 Nonetheless, the differential pathophysiological mechanisms between systemic inflammation and localized ocular inflammatory responses, and the extent to which tear fluid can serve as a surrogate indicator of retinal inflammatory status, remain to be elucidated.
A growing body of evidence supports a close mechanistic link between tear film dysfunction and diabetic retinal damage, mediated by shared neurovascular injury, oxidative stress, and inflammatory pathways.17 Chronic hyperglycemia impairs corneal innervation and lacrimal secretion, induces AGE accumulation and ROS overproduction, and concurrently damages retinal microvasculature and ocular surface structures.17 Furthermore, tear film impairment correlates with DR severity, and tear proteins have been recognized as sensitive indicators of local ocular pathology independent of systemic status.18,19
In this study, we utilized Olink technology to investigate inflammation-related mediators in DR by analyzing paired tear fluid and plasma samples from patients at various stages of DR progression. By multicomparison analyses of DEPs in paired plasma and tear fluid, this research revealed the key inflammatory regulatory factors in the progression of DR and DME. It aims to clarify the proteomic alterations associated with DR and DME, explore the mechanism of systemic-local inflammatory interaction, facilitate the identification of early diagnostic biomarkers and provide a theoretical basis for the early diagnosis, disease monitoring and targeted therapy of DR and DME.
Materials and Methods
Study Design and Participants
Experimental design is presented in Figure 1. A total of 42 participants were enrolled between August 2024 and March 2025 at the Dalian NO.3 People’s Hospital for the current study, including 13 patients with T2DM as control group, while 14 patients with DR and 15 patients with DME as the case groups. All DR and DME case in this study were non-proliferative type with T2DM.
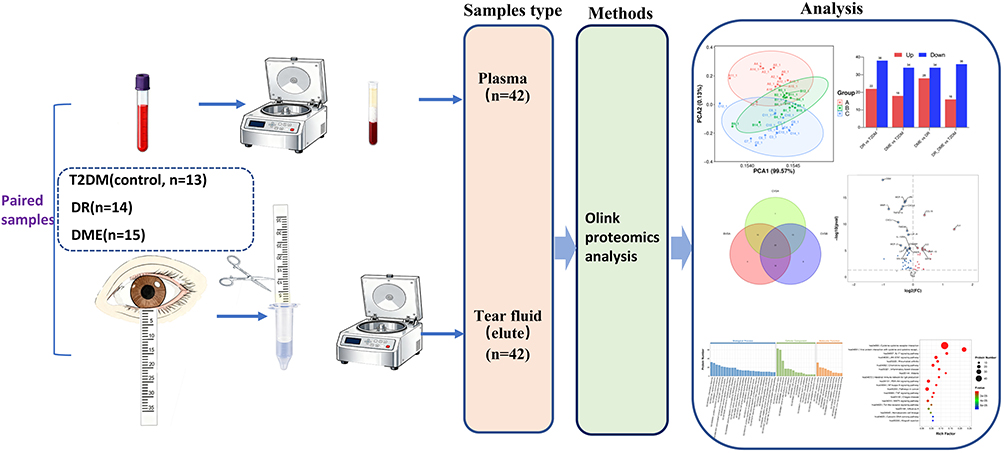 |
Figure 1 Schematic of Study design which includes the collection and processing of paired plasma and tear fluid during different stages of DR: T2DM (n=13), DR (n=14) and DME (n=15); followed by the measurement of Olink proteomics analysis. |
Exclusion criteria include: (1) active ocular infectious inflammation; (2) a history of ocular and/or adnexal trauma within the past year; (3) a history of any ocular surgery within the preceding 12 months; (4) ocular autoimmune diseases; (5) severe dry eye syndrome; (6) systemic infectious diseases with recovery within three months prior to enrollment; (7) rheumatic or autoimmune disorders; (8) malignancy of any organ system; (9) systemic or topical use of medications known to alter systemic or ocular inflammatory profiles, including corticosteroids, nonsteroidal anti-inflammatory drugs, or immunosuppressants; and (10) any other conditions that could confound the interpretation of tear or blood inflammatory markers.
Approval was obtained from the Ethics Committee of Dalian NO.3 People’s Hospital, following the principles of the Declaration of Helsinki (Approval number: 2024–071-001). All participants received a detailed explanation of the study’s background and content and provided written informed consent.
Examination Procedures
All participants underwent a comprehensive routine medical examination and a detailed ophthalmic assessment, including slit-lamp biomicroscopy, best-corrected visual acuity (BCVA), color fundus photography, intraocular pressure (noncontact tonometer), and optical coherence tomography (OCT). DR was classified according to the International Clinical Diabetic Retinopathy Disease Severity Scale. The evaluation of DR was conducted by ophthalmologists. The values of patients’ glycosylated hemoglobin A1c (HbA1C), total cholesterol (TC), triglyceride (TG), low-density lipoproteins cholesterol (LDL-C) and high-density lipoproteins cholesterol (HDL-C) were also collected.
Sample Collection
Peripheral blood (3mL) was collected fasting and centrifuged within 30min at 1500×g for 10min in 4°C. The plasma samples were transferred into cryovial tubes and stored at – 80°C immediately.
Tear samples were collected from one eye of subjects using sterile Schirmer paper strips without fluorescein sodium (Tianjin Jingming new technological development Co., Ltd). The Schirmer strips were positioned without anesthesia at the juncture of the outer and central regions of the lower eyelid and left in place for 5 minutes with the participants’ eyes closed. Subsequently, the tear fluid collected on the strip was promptly frozen at −80°C. Prior to the experiment, all strips were transferred to individual Spin-X tubes. To each Spin-X tube, 400μL of 0.9% NaCl solution was added, followed by gentle inversion 5–6 times to ensure complete coverage of the Schirmer strips. The tubes were then incubated at room temperature at 100×g for 2 hours. After centrifugation at 16,000×g for 10 minutes, the supernatant was decanted, and the contents of the tubes were harvested for subsequent analysis.
Proteomic Analysis
Plasma and tear inflammatory markers were evaluated using the commercially available Olink® Target 96 Inflammation panels from Olink (Uppsala, Sweden). The target protein demonstrates high specificity in binding to the double oligonucleotide-labeled antibody probe, followed by quantitative detection of the resulting DNA sequence through microfluidic real-time PCR amplification of the oligonucleotide sequence. The threshold cycle (Ct) data underwent processing for quality control and normalization using both internal and external controls. Normalized Protein Expression (NPX) values, which represent protein levels on a log2 scale, were obtained as the final assay output. A control sample that did not meet quality control standards was excluded from subsequent analysis. Principal component analyses (PCAs) were generated on the NPX values and visually inspected to identify possible outliers and assess the consistency of plasma and tear data.
The proteomic data from the samples underwent analysis through two-tailed t-tests for two groups analysis. Proteins that exhibited differential expression (DEPs) with P values <0.05 were chosen for subsequent investigation. The examination of the DEPs involved the utilization of Volcano plots, Heat map visualization, and Spearman correlation analysis. The biological function of DEPs was classified by GO annotation and Encyclopedia of Genes and Genomes (KEGG) enrichment.
Statistical Analysis
All proteomic bioinformatic analysis was performed using the OmicStudio tools at https://www.omicstudio.cn/tool.20
SPSS version 27 (IBM) was used to perform clinical characteristics’ statistics. Values were expressed as mean ± standard deviation, number, or median (Q1–Q3). Normally distributed data were expressed as mean ± standard deviation, while non-normally distributed data were described by median (25th–75th percentiles). P < 0.05 was considered statistically significant. We used t tests or analysis of variance if the data met the normality criteria; otherwise, we applied the Mann−Whitney U-test for between-group analyses. For count data, the chi-square test was used.
Results
Characteristics of Participants
The clinical characteristics of the T2DM group, DR group, and DME group are presented in Table 1. No significant differences were observed in sex, age, BMI, HbA1c, TG, or HDL among the three groups (P > 0.05). However, SBP, TC, and LDL showed significant differences between the three groups of T2DM, DR, and DME (P < 0.05).
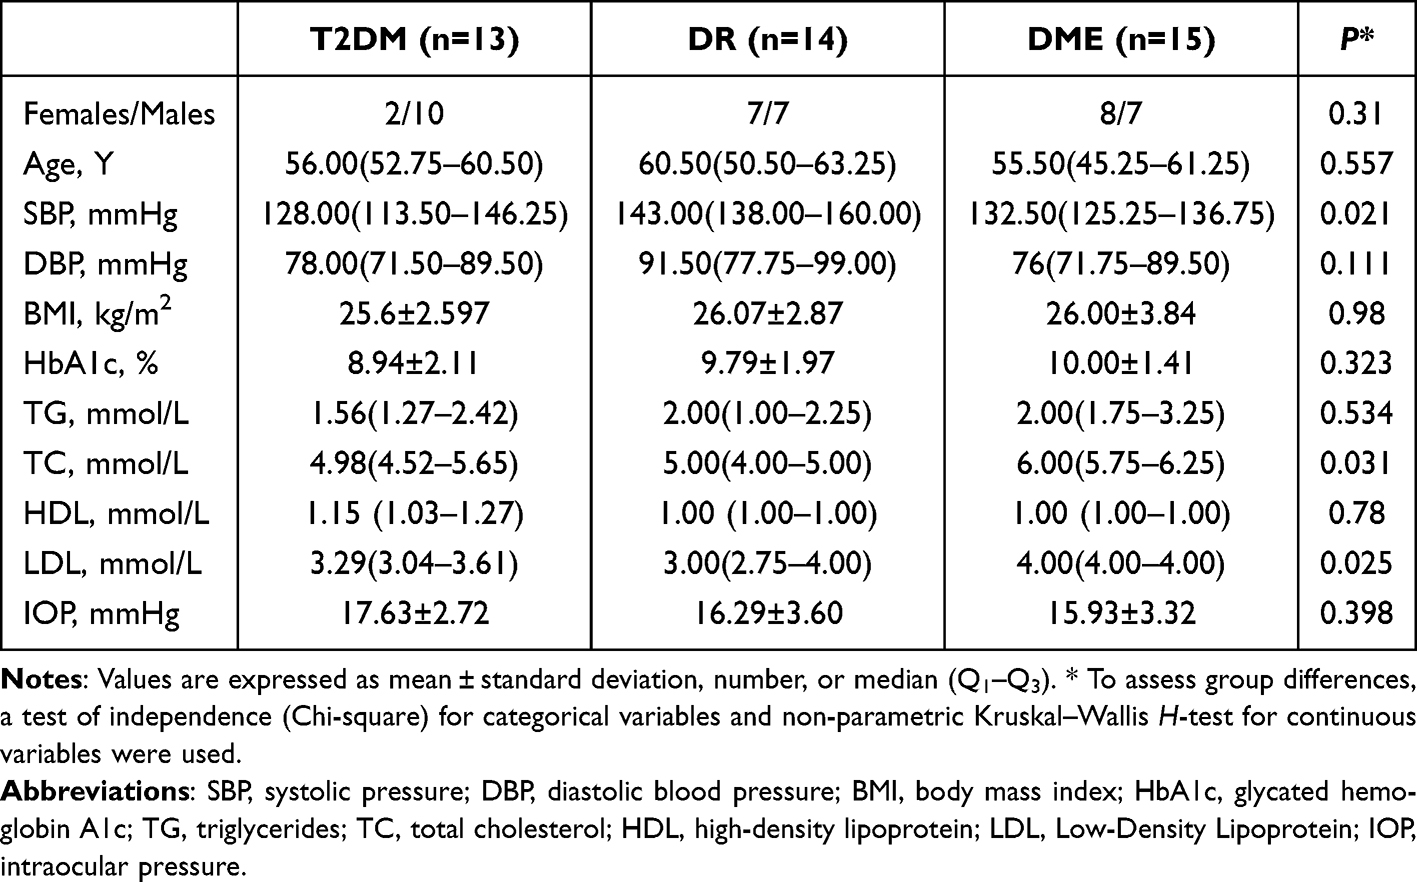 |
Table 1 Clinical Characteristics of Patients |
Characteristic Expression Patterns of Inflammatory Proteins in Plasma and Tears of T2DM, DR and DME Groups
To investigate the role of inflammation proteins in the development of DR, we performed differential expression analysis using Olink proteomics technology. Considering the clinical characteristics, data processing and identification of DEPs were carried out using R-based statistical packages, with adjustment for SBP, TC and LDL. Principal component analysis (PCA) (Figure 2A and D) and hierarchical clustering (heatmap) (Figure 2C and F) revealed distinct separation among T2DM, DR and DME groups, indicating substantial differences in the inflammation profiles in both plasma level and tear fluid level. Histogram of DEPs in plasma (Figure 2B) and tear fluids (Figure 2E) shown the significantly different numbers and expression patterns of inflammatory proteins in pairwise comparisons (DR vs T2DM, DME vs T2DM, DME vs DR) and combined analysis (DR&DME vs T2DM). The expression of DEPs in plasma samples was mainly decreased in the development of DR, while in tears, it was mainly upregulated.
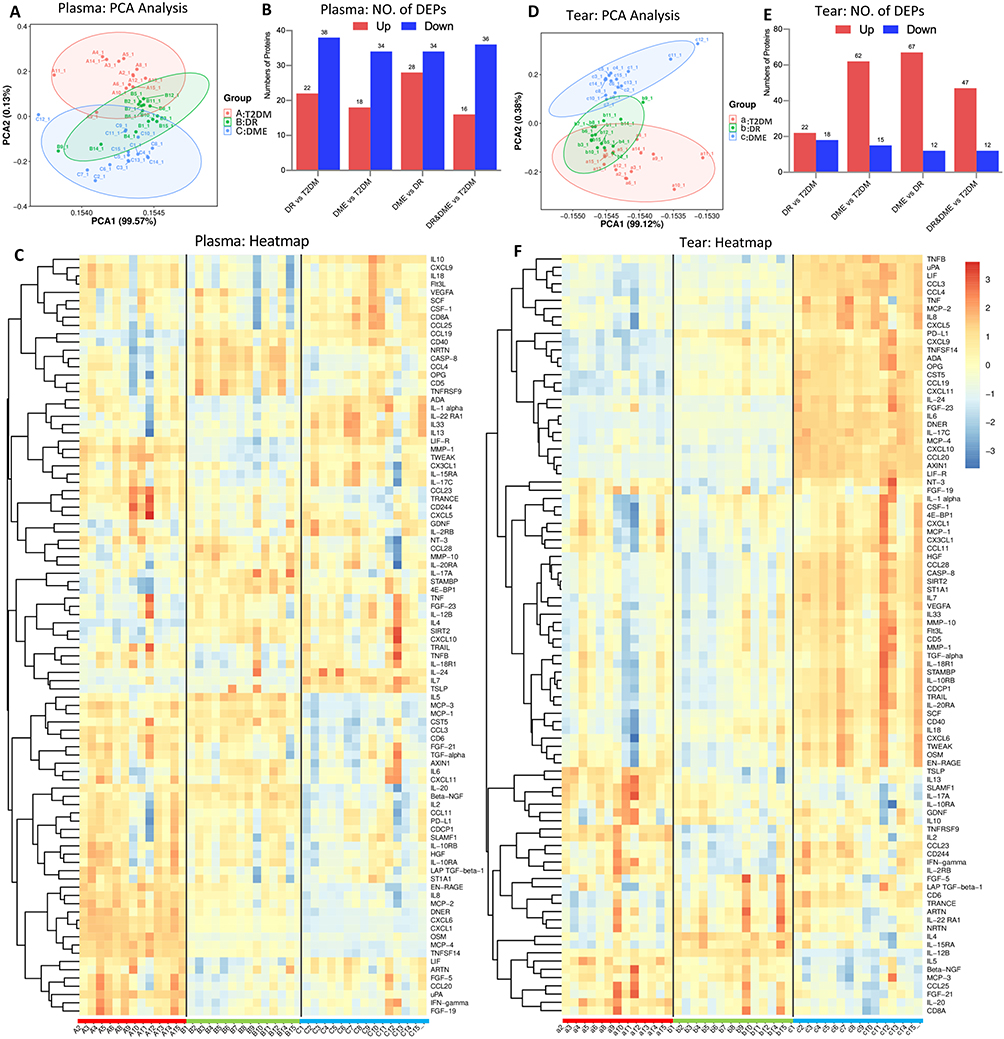 |
Figure 2 Protein expression profiles of inflammatory proteins in Plasma and Tear samples. (A and D) PCA of proteomics profile among T2DM, DR and DME in plasma data and tear data. The X and Y axis indicates the two principal components. Each data point indicates a sample. (B and E) Histogram of the numbers of DEPs among the four compared groups. (C and F) Heatmap of abundance variation profile for each group in plasma and tear, by hierarchical clustering with complete linkage, with distance determined by the Euclidean method. |
Inflammatory factors alterations among the three groups of plasma samples and tear samples
Venn diagram showed that 23 inflammatory factors exhibited differential expression in the three compared groups (DR vs T2DM, DME vs T2DM and DME vs DR) in plasma level (Figure 3A). These 23 inflammatory factors consist of STAMBP, IL5, 4E-BP1, TSLP upregulation, uPA, MCP-4, CXCL6, TNFSF14, MMP-1, CXCL1, TWEAK, MCP-2, DNER, EN-RAGE, CCL23, IL8, IFN-γ, TRANCE downregulation, and IL10, IL1 alpha, IL20 reduced expression in DR vs T2DM, and increased expression in DME vs T2DM and DME vs DR, β-NGF, MCP-1 increased expression in DR vs T2DM, and reduced expression in DME vs T2DM and DME vs DR (Figure 3A, C and Supplementary Table 1). In tear samples, 30 differential inflammatory cytokines were found in the three compared groups (Figure 3B). These 30 DEPs included TNFSF14, CXCL11, IL6, CCL19, DNER, CXCL9, OPG, IL15RA, ADA, CCL4, CCL20, IL18, LIF, SLAMF1, CST5, IL17A, CD40, TNFB, CD6, SCF upregulation, and TNFRSF9, IL20, NT-3, IL5 downregulation. The other inflammatory factors were shown CASP-8, CCL23, CCL11, CCL28 reduced expression in DR vs T2DM, and increased expression in DME vs T2DM and DME vs DR, while IL12B were increased in DR vs T2DM, and decreased in DME vs T2DM and DME vs DR (Figure 3B, C and Supplementary Table 2).
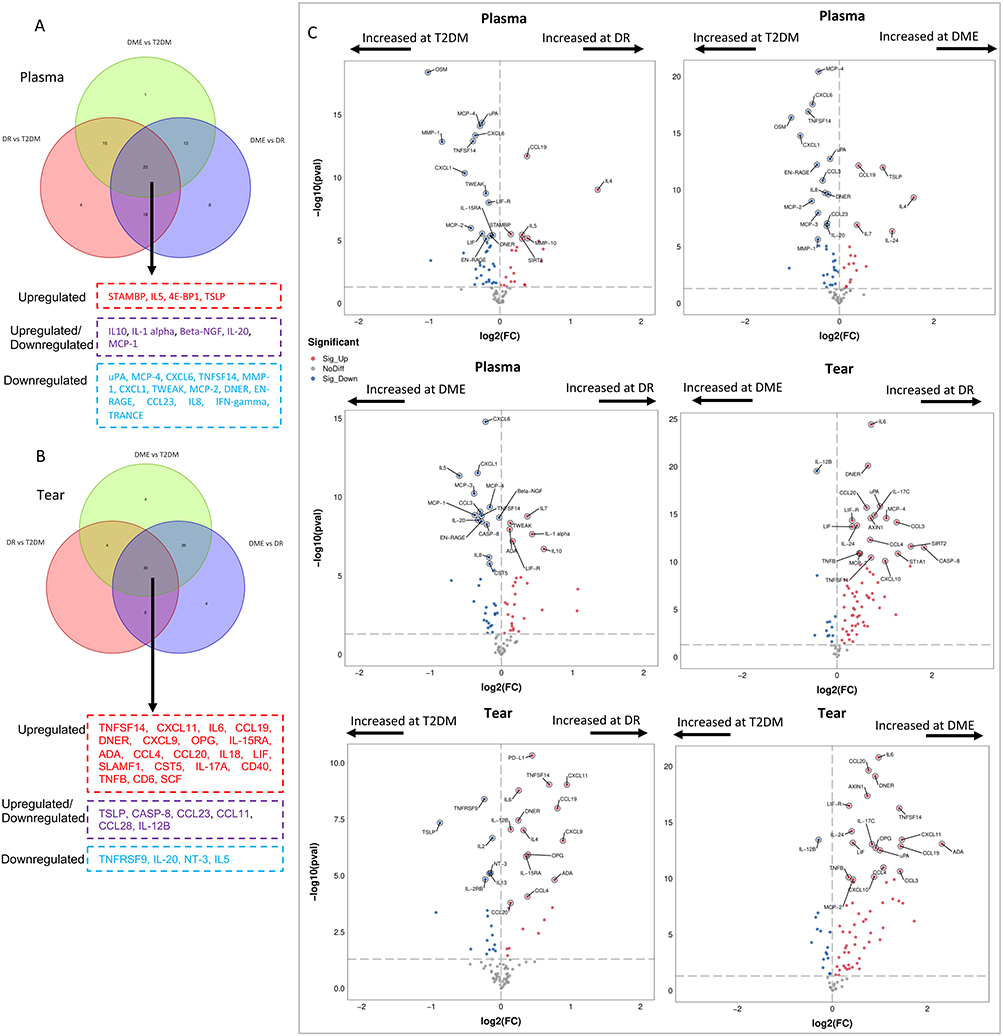 |
Figure 3 Olink proteomic analysis comparing the DR, and DME groups with the T2DM group. (A and B) Venn diagram of DEPs between the pairwise comparisons (DR vs T2DM, DME vs T2DM, DME vs DR) in plasma data (A) and tear data (B). Proteins in the red boxes are DEPs that are co-upregulated in the three groups, proteins in the blue boxes are DEPs that are co downregulated, and proteins in the purple boxes are DEPs that are partly upregulated or downregulated in three groups. (C) Volcano plot depicting the DEPs of pairwise comparisons (DR vs T2DM, DME vs T2DM, DME vs DR). Red dots represent upregulated DEPs, while blue dots represent downregulated DEPs. Arrow represent increased log2(FC) at corresponding group. |
When comparing the regulatory patterns of TNFSF14 in plasma and tears among the three groups, it was observed that TNFSF14 exhibited downregulation in plasma but upregulated expression in tears as the transition occurred from T2DM to DR and DME (Figure 3A and B). Furthermore, elevated levels of TSLP were detected in the plasma of DR and DME groups, whereas reduced concentrations were observed in the tear fluid of DR and DME patients when compared to those with T2DM. Tear fluid levels of IL20 uniformly downregulated in the DR and DME groups, compared to T2DM, but increased in plasma of DR vs T2DM, and decreased in other plasma comparisons. IL24, IL7 are dual upregulation in plasma and tears of DME patients, when compared to T2DM or DR. CCL19 is pronounced increased in both plasma and tears of DR and DME patients when compared with T2DM. VEGFA is higher expression in DME vs T2DM or DR in tear samples, but no plasma level differences. Similarly, CXCL11 were only up-regulated in tear level, with no differences in plasma level between the three groups. CASP8 is upregulated in DME tears but downregulated in DR tears vs. T2DM; in plasma, upregulated in DR vs T2DM but reduced in DME vs DR (Figure 3, Supplementary Figure 1, Supplementary Tables 1 and 2).
In plasma samples, volcano plot analysis identified 60 DEPs between DR and T2DM groups with CCL19, IL4, STAMBP, IL5 and MMP-10 significantly upregulated, and OSM, uPA, MCP-4, CXCL-6, TNFSF14 significantly downregulated; 52 DEPs between DME and T2DM groups, including CCL19, TSLP, IL4 notably upregulated, and MCP-4, CXCL6, TNFSF14, OSM pronounced decreasing; 62 DEPs between DME and DR groups, with IL7, TWEAK, ADA, IL1α upregulated, CXCL6, CXCL1, TNFSF14 and DNER downregulated (Figure 3C and Supplementary Table 1). In tear samples, 40 DEPs were found between DR and T2DM groups, 77 DEPs between DME and T2DM groups, and 79 DEPs between DME and DR groups. Among these DEPs, PD-L1, TNFSF14 and CXCL11 were the most significant increased expression inflammatory factors in DR group when compared with T2DM. IL6 and DNER were the foremost upregulated inflammation cytokines in DME groups, when compared with T2DM or DR group. These may suggest that IL6 and DNER may be one of the key driving factors for the progression of DR to DME in the ocular inflammatory environment (Figure 3C and Supplementary Table 2).
Functional Enrichment Analysis of DEPs in Plasma and Tear Samples
Based on the results of differential expression analysis of cytokines in plasma and tear between DR, DME and T2DM, we performed GO and KEGG enrichment analysis (Figure 4). The results of GO analysis showed that the genes of differential proteins were mainly enriched in Cellular Component with extracellular region and extracellular space. The Molecular Function category was mainly enriched in cytokine activity (Figure 4A and C). KEGG analysis showed that the functions of the differential proteins in both plasma and tear were mainly focused on IL17 signaling pathway and JAK-STAT signaling pathway (Figure 4B and D).
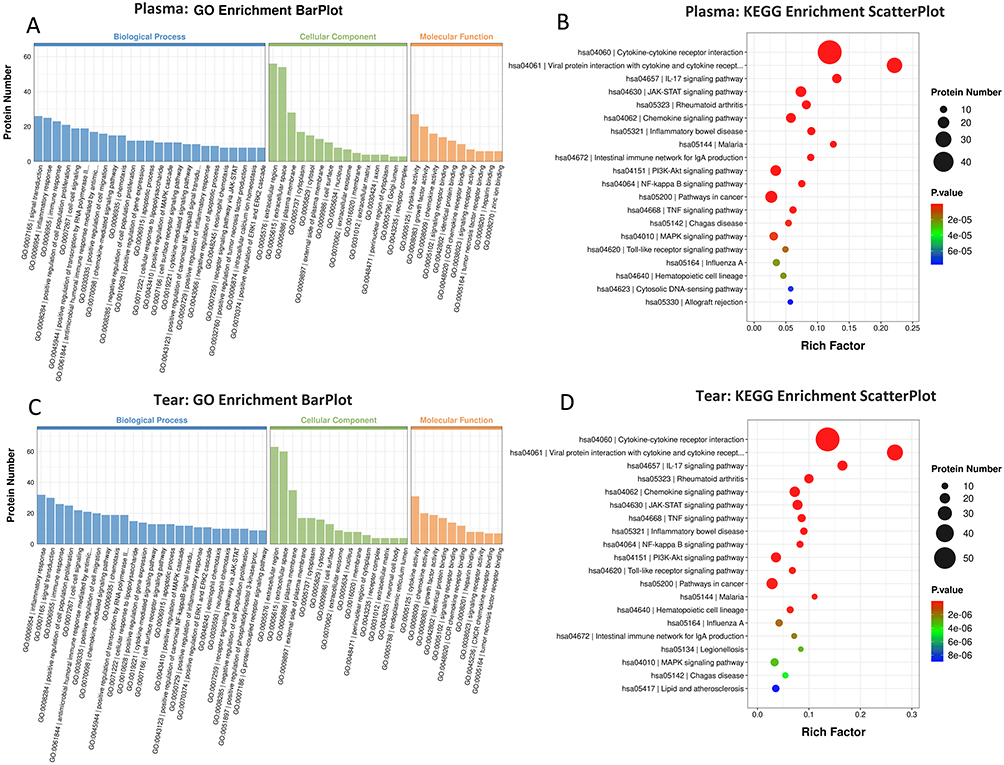 |
Figure 4 GO and KEGG enrichment analysis of the inflammation proteins in plasma (A and B) and tear data (C and D), between DR, DME and T2DM respectively. By GO, the enrichment analysis of biological processes, cell components, and molecular functions is performed. The abscissa indicates the enrichment to GO functional classification. By KEGG, the ordinate represents the significantly enriched KEGG pathways and the abscissa represents rich factor. Enrichment factor indicates the proportion of the number of differentially expressed proteins involved in a certain GO term or KEGG pathway among all identified proteins; the color of bubbles indicates the significance of the enriched GO terms or KEGG pathway; the bubble sizes represents the number of proteins enriched in each KEGG pathway. |
Discussion
The pathophysiology of DR and DME involves complex interplay between systemic and localized ocular inflammation.21–25 However, how inflammatory responses differ between the circulation and the ocular surface, and how tear fluid abnormalities reflect retinal pathophysiology, remains poorly understood. Using Olink proteomics assays to profile inflammatory proteins in paired plasma and tear samples from patients with T2DM, DR, and DME, we identified a fundamental divergence between systemic and ocular-localized inflammatory landscapes. This disparity suggests that local intraocular inflammatory dysregulation may primarily drive advanced complications, with systemic changes reflecting secondary or compensatory responses.
Notably, tear fluid exhibited more DEPs than plasma, a disparity that became most pronounced during progression to DME.26–31 This suggests that the local ocular inflammatory microenvironment may undergo more substantial and disease-specific alterations than the systemic circulation. Moreover, inflammatory proteins in tears were predominantly upregulated with disease progression, whereas plasma showed a notable proportion of downregulation, indicating distinct regulatory mechanisms in each compartment. The BRB and blood–aqueous barrier (BAB) physically separate the ocular microenvironment from the systemic circulation, allowing local production, retention, or consumption of cytokines independent of plasma. Besides, chronic systemic inflammation in diabetes may trigger feedback inhibition or immune exhaustion, reducing plasma cytokine levels, while the retina and ocular surface remain in a progressive pro-inflammatory state. What’s more, tear cytokines reflect direct secretion from activated retinal glia, corneal cells, lacrimal glands, and infiltrated immune cells, whereas plasma cytokines are diluted by multiple tissues and organs. Together, these factors create divergent, often opposing, inflammatory signatures between the two compartments.
The most intriguing finding was discordant cytokine expression between plasma and tears. First, TNFSF14 and DNER were downregulation in plasma but upregulation in tears, suggesting active sequestration or local production within the eyes, highlighting ocular inflammation as a relatively insulated process. And this process might be regulated by the BRB and BAB. Second, systemic chronic low-grade inflammation in diabetes may trigger compensatory anti-inflammatory or exhaustion responses, leading to decreased circulating levels of some mediators. Consistent with this, TNFSF14 was elevated in tears of DME and DR patients versus T2DM, while previous studies have reported reduced TNFSF14 in plasma of non-proliferative DR compared to diabetes and healthy controls.32 Patients with DME exhibit substantial oxidative stress, whose accumulation may suppress certain inflammatory factors through negative feedback mechanism.33 The diminished release of pro-inflammatory mediators, including TNFSF14, at the plasma level could be linked to the inhibition of signaling pathways caused by oxidative damage within cells. This connection may clarify the lower TNFSF14 expression observed in plasma of DR and DME patients.
Additionally, IL-20 levels decreased in tears but showed variable plasma expression, possibly reflecting local lymphocytopenia or an immunosuppressive microenvironment in the diabetic eye, consistent with prior clinical observations.9 Similarly, TSLP levels were elevated in the plasma of patients with DR and DME. This finding aligns with the established paradigm of heightened systemic inflammation driving diabetic complications. TSLP, an epithelial-derived cytokine, initiates and enhances type 2 inflammatory responses; hence, its elevated plasma levels may signify not only systemic inflammatory activation but also contribute to inflammatory cascades that worsen retinal vascular damage. Conversely, reduced TSLP in tears of DR/DME patients may reflect disrupted local immune regulation, potentially related to documented changes in the ocular microenvironment such as enhanced vascular permeability and lowered lymphocyte levels.9
Beyond the discordant expression patterns, our data also revealed factors co-upregulated in both compartments in DME. Patients with DME showed increased concentrations of CCL19, IL7 and IL24 in both plasma and tears. CCL19 promotes inflammatory responses via NF-κB activation in various inflammatory diseases.34 IL7 maintains immune cell homeostasis by supporting T-cell function and regulating mucosal immunity.35,36 Concurrent increases in CCL19 and IL7 may suggest coordinated activation of both innate and adaptive immune axes systemically and locally. IL24 inhibits angiogenesis37 and may contribute to DME pathology through regulation of factors including VEGFR-1/flt-1,38 potentially explaining its upregulation in DME. The coexistence of these factors reflects the complex, dysregulated inflammatory microenvironment characteristic of DME.
Notably, certain factors exhibited marked changes exclusively or predominantly in tears, underscoring their value as local disease sentinels. IL-6, as a central driver of retinal vascular permeability and VEGF induction, was elevated in tears of DR and DME patients compared to T2DM. This aligns with previous studies that substantial increases in IL6 in serum, vitreous humor, and aqueous humor, with concentrations correlating with DR severity, and with its established pathogenic role in DR and DME progress.38–40 VEGFA, a core pathogenic factor of DME, was significantly elevated only in tear fluid of DME patients, closely reflecting its clinical relevance.41–43 Similarly, the angiostatic chemokine CXCL11 was specifically upregulated in tears. Its presence may reflect an endogenous attempt to counteract VEGF-driven angiogenesis, or conversely, contribute to blood-retinal barrier breakdown via pro-inflammatory Th1 responses.43,44 The selective appearance of these proteins in tears supports the value of local sampling in capturing key pathogenic events.
Despite divergent inflammatory profiles between plasma and tears, functional enrichment analysis yielded convergent findings. KEGG pathway analysis identified IL17/JAK/STAT signaling pathway as the most critical pathway underlying DR pathogenesis. The JAK/STAT pathway is a well-established regulator of inflammatory responses and VEGF production, both of which play central roles in pathological angiogenesis and vascular permeability in DR.45 Inhibiting this pathway has been shown to slow DR progression and reduce VEGF in diabetes models,46 consistent with our results linking abnormal cytokine signaling to retinal vascular damage. Importantly, our data further highlight IL17 signaling as a key an upstream trigger of JAK/STAT activation in DR. Taken together, these findings support that the IL17/JAK/STAT axis is a critical driver of inflammation injury and vascular dysfunction in the progression from DR to DME.47
Our comparative analysis nominates TNFSF14, CXCL11, IL6, CCL19, DNER and CXCL9 as promising tear-based candidate biomarkers, which could be developed into a non-invasive panel for DR/DME risk stratification, early detection, and longitudinal monitoring, reducing reliance on retinal imaging for community screening and follow-up. Despite these promising findings, several limitations should be acknowledged. First, this was an exploratory proof-of-concept study without a priori sample size calculation, which is common and acceptable in preliminary biomarker discovery and proteomic profiling research. The sample size was determined by clinical feasibility and the aim to generate initial hypotheses, yet the relatively small sample size may still limit the statistical power and generalizability of the findings. Future large-scale and longitudinal cohort studies with formal sample size calculation are warranted to validate the diagnostic and prognostic value of these tear biomarkers. Second, this study utilized the Olink® PEA technology, with DEPs levels reported as NPX. Although this platform has been validated for tear and plasma analysis in ophthalmic research,48 relative quantification may restrict cross-study comparability. Future investigations should employ more unbiased proteomics approaches alongside targeted assays providing absolute concentration measurements. Third, although our findings confirmed divergent inflammatory profiles between tear fluid and plasma and supported that tear fluid reflects local ocular pathophysiology independently of systemic changes, the precise anatomical and physiological connections between the tear microenvironment and retinal tissue remain to be fully elucidated.
We therefore propose a unifying hypothesis to explain how tear fluid may serve as a surrogate indicator of retinal pathology. Under diabetic inflammatory conditions, activated retinal cells including microglia, glia, and vascular endothelial cells secrete inflammatory mediators into the retina, vitreous cavity, and aqueous humor. These mediators diffuse anteriorly toward the anterior chamber, cross the BAB, and reach the ocular surface, thereby entering the tear film. In parallel, hyperglycemia and ocular inflammation also impair lacrimal gland function, corneal innervation, and conjunctival integrity, which directly modulate tear composition. Thus, tear fluid acts as an integrated sentinel of overall intraocular inflammation that indirectly reflects retinal pathophysiology. Further mechanistic studies are needed to clarify this connection. If validated in larger cohorts, inflammatory profiling of tears may represent a more sensitive and non-invasive approach than systemic plasma analysis for monitoring local ocular pathophysiology and providing early warning of DR and DME.
In conclusion, this comparative analysis of inflammatory factors in the plasma and tears from patients with T2DM, DR and DME revealed distinct compartment-specific profiles. Tears exhibited a more pronounced inflammatory signature than plasma, suggesting that progression from DR to DME is driven primarily by local ocular dysregulation, with systemic changes reflecting secondary responses. These findings highlight tear fluid as a promising non-invasive sample for detecting DR/DME-associated pathophysiological changes and support further investigation of tear-derived candidates as early diagnostic biomarkers or therapeutic targets.
Data Sharing Statement
Data described in the manuscript will be made available upon request pending application and approval from the corresponding author. The data are not publicly available due to privacy or ethical restrictions.
Acknowledgments
We thank Hangzhou LC-BIO Co., Ltd for the technical assistance and help with the data analysis. T.Y is the guarantor of this work and, as such, had full access to all the data in the study and takes responsibility for the integrity of the data and the accuracy of the data analysis. We would like to thank Zhiwei Guo for his guidance and assistance with the statistical analysis in this study.
Author Contributions
Ting Yu: Conceptualization, Data curation, Formal analysis, Writing – original draft, Writing – review & editing. Sheng Li: Formal analysis, Data curation, Writing – review & editing. Fang Cheng: Formal analysis, Data curation, Writing – review & editing. Yanzi Liu: Resources, Investigation, Writing – review & editing. Guimei Hou: Resources, Investigation, Writing – review & editing. Jicheng Dong: Investigation, Methodology, Writing – review & editing. Yanjie Huang: Validation, Writing – review & editing. Shoufang Qu: Supervision, Project administration, Writing – review & editing. Qiong Chen: Formal analysis, Writing – original draft, Writing – review & editing. All authors have read and agreed to the published version of the manuscript.
Funding
This work was supported by the Guangdong Provincial Science and Technology Project (2023A1111120024) and the Fundamental Research Funds for the Central Universities, China (DUT25YG270).
Disclosure
The authors declare that there are no competing interests.
References
1. Kaur A, Kumar R, Sharma A. Diabetic retinopathy leading to blindness- a review. Curr Diabetes Rev. 2024;20(9):e240124225997. doi:10.2174/0115733998274599231109034741
2. Teo ZL, Tham YC, Yu M, et al. Global prevalence of diabetic retinopathy and projection of burden through 2045. Ophthalmology. 2021;128(11):1580–13. doi:10.1016/j.ophtha.2021.04.027
3. Zhu H, Li B, Huang T, et al. Update in the molecular mechanism and biomarkers of diabetic retinopathy. Biochim Biophys Acta BBA - Mol Basis Dis. 2025;1871(5):167758. doi:10.1016/j.bbadis.2025.167758
4. Cai K, Liu Y, Wang D. Prevalence of diabetic retinopathy in patients with newly diagnosed type 2 diabetes: a systematic review and meta-analysis. Diabet Metab Res Rev. 2023;39(1):e3586. doi:10.1002/dmrr.3586
5. Tang L, Xu GT, Zhang JF. Inflammation in diabetic retinopathy: possible roles in pathogenesis and potential implications for therapy. Neural Regen Res. 2023;18(5):976. doi:10.4103/1673-5374.355743
6. Wong TY, Cheung CMG, Larsen M, Sharma S, Simó R. Diabetic retinopathy. Nat Rev Dis Primer. 2016;2(1):16012. doi:10.1038/nrdp.2016.12
7. Kataria P, Sethi NK, Brar GK, Singh N, Bagga M, Chadha C. A study of association of ocular biometric parameters with various grades of diabetic macular edema and severity of diabetic retinopathy. J Fam Med Prim Care. 2025;14(5):1980–1984. doi:10.4103/jfmpc.jfmpc_1919_24
8. Forrester JV, Kuffova L, Delibegovic M. The role of inflammation in diabetic retinopathy. Front Immunol. 2020;11:583687. doi:10.3389/fimmu.2020.583687
9. Zhu Y, Cai Q, Li P, Zhou Y, Xu M, Song Y. The relationship between peripheral blood inflammatory markers and diabetic macular edema in patients with severe diabetic retinopathy. Ann Palliat Med. 2022;11(3):984–992. doi:10.21037/apm-22-102
10. Li J, Zhao T, Sun Y. Interleukin-17A in diabetic retinopathy: the crosstalk of inflammation and angiogenesis. Biochem Pharmacol. 2024;225:116311. doi:10.1016/j.bcp.2024.116311
11. Lee SJ, Noh S, Jo DH, Cho CS, Park K, Kim JH.
12. Sigurdardottir S, Zapadka TE, Lindstrom SI, et al. Diabetes-mediated IL-17A enhances retinal inflammation, oxidative stress, and vascular permeability. Cell Immunol. 2019;341:103921. doi:10.1016/j.cellimm.2019.04.009
13. Georgescu A, Dascalu A, Stana D, et al. The role of inflammation in diabetic retinopathy in patients with type II diabetes; potential therapeutic perspectives. J Mind Med Sci. 2024;11(1):17–23. doi:10.22543/2392-7674.1485
14. Qian HY. Inflammatory mechanisms in diabetic retinopathy: pathogenic roles and therapeutic perspectives. Am J Transl Res. 2025;17(8):6262–6274. doi:10.62347/GBFO5856
15. Yoon SP, Yu Z, Pflugfelder SC, De Paiva CS. Differentially expressed tear proteins in sjögren’s syndrome keratoconjunctivitis sicca. Transl Vis Sci Technol. 2023;12(6):8. doi:10.1167/tvst.12.6.8
16. Harkness BM, Hegarty DM, Saugstad JA, et al. Experimental design considerations for studies of human tear proteins. Ocul Surf. 2023;28:58–78. doi:10.1016/j.jtos.2023.02.005
17. Quintana-Pérez JC, Tamay-Cach F, Guillen-Castro SA, et al. Alterations of the ocular surface during diabetes: molecular mechanisms and therapeutic strategies. Int Ophthalmol. 2025;46(1):3. doi:10.1007/s10792-025-03865-z
18. Yu L, Chen X, Qin G, Xie H, Lv P. Tear film function in type 2 diabetic patients with retinopathy. Ophthalmologica. 2008;222(4):284–291. doi:10.1159/000140256
19. Ponzini E. Tear biomarkers. Adv Clin Chem. 2024;120:69–115. doi:10.1016/bs.acc.2024.03.002
20. Lyu F, Han F, Ge C, et al. OmicStudio: a composable bioinformatics cloud platform with real-time feedback that can generate high-quality graphs for publication. iMeta. 2023;2(1):e85. doi:10.1002/imt2.85
21. Wang FY, Kang EYC, Liu CH, et al. Diabetic patients with rosacea increase the risks of diabetic macular edema, dry eye disease, glaucoma, and cataract. Asia-Pac J Ophthalmol. 2022;11(6):505–513. doi:10.1097/APO.0000000000000571
22. Hein M, Vukmirovic A, Constable IJ, et al. Angiographic biomarkers are significant predictors of treatment response to intravitreal aflibercept in diabetic macular edema. Sci Rep. 2023;13(1):8128. doi:10.1038/s41598-023-35286-2
23. Lyons CE, Zhu I, Gill MK. Accelerated progression of diabetic retinopathy following severe COVID-19 infection. Am J Ophthalmol Case Rep. 2023;32:101911. doi:10.1016/j.ajoc.2023.101911
24. Sheemar A, Goel P, Thakur PS, et al. Diabetes, diabetic retinopathy, and inflammatory disorders. Ocul Immunol Inflamm. 2024;32(7):1155–1168. doi:10.1080/09273948.2023.2203742
25. Storti F, Pulley J, Kuner P, Abt M, Luhmann UFO. Circulating biomarkers of inflammation and endothelial activation in diabetic retinopathy. Transl Vis Sci Technol. 2021;10(12):8. doi:10.1167/tvst.10.12.8
26. Chen H, Zhang X, Liao N, Wen F. Assessment of biomarkers using multiplex assays in aqueous humor of patients with diabetic retinopathy. BMC Ophthalmol. 2017;17(1):176. doi:10.1186/s12886-017-0572-6
27. Oh IK, Kim SW, Oh J, Lee TS, Huh K. Inflammatory and angiogenic factors in the aqueous humor and the relationship to diabetic retinopathy. Curr Eye Res. 2010;35(12):1116–1127. doi:10.3109/02713683.2010.510257
28. Taghavi Y, Hassanshahi G, Kounis NG, Koniari I, Khorramdelazad H. Monocyte chemoattractant protein-1 (MCP-1/CCL2) in diabetic retinopathy: latest evidence and clinical considerations. J Cell Commun Signal. 2019;13(4):451–462. doi:10.1007/s12079-018-00500-8
29. Zarbin M, Tabano D, Ahmed A, et al. Efficacy of faricimab versus aflibercept in diabetic macular edema in the 20/50 or worse vision subgroup in phase III YOSEMITE and RHINE trials. Ophthalmology. 2024;131(11):1258–1270. doi:10.1016/j.ophtha.2024.05.025
30. Merchant ML, Klein JB. Proteomics and diabetic retinopathy. Clin Lab Med. 2009;29(1):139–149. doi:10.1016/j.cll.2009.01.008
31. Zeng Y, Cao D, Yu H, et al. Comprehensive analysis of vitreous humor chemokines in type 2 diabetic patients with and without diabetic retinopathy. Acta Diabetol. 2019;56(7):797–805. doi:10.1007/s00592-019-01317-6
32. Dong M, Cao WY, Deng XX, Zhang WX, Xing YQ, Yang N. Assessment of causality between circulating inflammatory proteins and subtypes of diabetic retinopathy. Int J Ophthalmol. 2025;18(10):1971–1979. doi:10.18240/ijo.2025.10.22
33. Petkova-Parlapanska K, Draganova V, Georgieva E, Goycheva P, Nikolova G, Karamalakova Y. Systematic inflammation and oxidative stress elevation in diabetic retinopathy and diabetic patients with macular edema. Int J Mol Sci. 2025;26(8):3810. doi:10.3390/ijms26083810
34. Kochumon S, Madhoun AA, Al-Rashed F, et al. Adipose tissue gene expression of CXCL10 and CXCL11 modulates inflammatory markers in obesity: implications for metabolic inflammation and insulin resistance. Ther Adv Endocrinol Metab. 2020;11:2042018820930902. doi:10.1177/2042018820930902
35. Tilsed CM, Sadiq BA, Papp TE, et al. IL7 increases targeted lipid nanoparticle–mediated mRNA expression in T cells in vitro and in vivo by enhancing T cell protein translation. Proc Natl Acad Sci. 2024;121(13):e2319856121. doi:10.1073/pnas.2319856121
36. Choi YW, Kang MC, Seo YB, et al. Intravaginal administration of fc-fused il7 suppresses the cervicovaginal tumor by recruiting HPV DNA vaccine-induced CD8 T cells. Clin Cancer Res. 2016;22(23):5898–5908. doi:10.1158/1078-0432.CCR-16-0423
37. Persaud L, Zhong X, Alvarado G, et al. eIF2α phosphorylation mediates IL24-induced apoptosis through inhibition of translation. Mol Cancer Res. 2017;15(8):1117–1124. doi:10.1158/1541-7786.MCR-16-0454
38. Kaliberova LN, Krendelchtchikova V, Harmon DK, et al. CRAdRGDflt-IL24 virotherapy in combination with chemotherapy of experimental glioma. Cancer Gene Ther. 2009;16(10):794–805. doi:10.1038/cgt.2009.23
39. Gui R, Ren Y, Wang Z, et al. Deciphering interleukin-18 in diabetes and its complications: biological features, mechanisms, and therapeutic perspectives. Obes Rev. 2024;25(11):e13818. doi:10.1111/obr.13818
40. Thazhe Poyil NJ, Vadakkekuttical RJ, Radhakrishnan C. Correlation of periodontal inflamed surface area with glycated hemoglobin, interleukin-6 and lipoprotein(a) in type 2 diabetes with retinopathy. World J Diabet. 2024;15(4):686–696. doi:10.4239/wjd.v15.i4.686
41. Xie H, Huang S, Liu Q, et al. The Fundus Structural and Functional Predictions of DME Patients After Anti-VEGF Treatments. Front Endocrinol. 2022;13:865211. doi:10.3389/fendo.2022.865211
42. J TYL, Mohd Zain A, Naffi AA, Mustapha M, Wan Abdul Halim WH. Determination of factors influencing the Health Belief Model (HBM) and adherence to intravitreal anti-vascular Endothelial Growth Factor (VEGF) among patients with Diabetic Macular Edema (DME). Cureus. 2023;15. doi:10.7759/cureus.34669
43. Shimura M, Kitano S, Muramatsu D, et al. Real-world management of treatment-naïve diabetic macular oedema in Japan: two-year visual outcomes with and without anti-VEGF therapy in the STREAT-DME study. Br J Ophthalmol. 2020;104(9):1209–1215. doi:10.1136/bjophthalmol-2019-315199
44. Tortelli F, Pisano M, Briquez PS, Martino MM, Hubbell JA. Fibronectin binding modulates CXCL11 activity and facilitates wound healing. PLoS One. 2013;8(10):e79610. doi:10.1371/journal.pone.0079610
45. Liu ZL, Chen HH, Zheng LL, Sun LP, Shi L. Angiogenic signaling pathways and anti-angiogenic therapy for cancer. Signal Transduct Target Ther. 2023;8(1):198. doi:10.1038/s41392-023-01460-1
46. Cho CH, Roh KH, Lim NY, Park SJ, Park S, Kim HW. Role of the JAK/STAT pathway in a streptozotocin-induced diabetic retinopathy mouse model. Graefes Arch Clin Exp Ophthalmol. 2022;260(11):3553–3563. doi:10.1007/s00417-022-05694-7
47. Yue T, Shi Y, Luo S, Weng J, Wu Y, Zheng X. The role of inflammation in immune system of diabetic retinopathy: molecular mechanisms, pathogenetic role and therapeutic implications. Front Immunol. 2022;13:1055087. doi:10.3389/fimmu.2022.1055087
48. Chen Y, Zhang S, Zhong Q, et al. Inflammatory proteins profiling in tear fluid in polypoidal choroidal vasculopathy and neovascular age-related macular degeneration. J Ocul Pharmacol Ther. 2026:10807683251384447. doi:10.1177/10807683251384447
 © 2026 The Author(s). This work is published and licensed by Dove Medical Press Limited. The
full terms of this license are available at https://www.dovepress.com/terms
and incorporate the Creative Commons Attribution
- Non Commercial (unported, 4.0) License.
By accessing the work you hereby accept the Terms. Non-commercial uses of the work are permitted
without any further permission from Dove Medical Press Limited, provided the work is properly
attributed. For permission for commercial use of this work, please see paragraphs 4.2 and 5 of our Terms.
© 2026 The Author(s). This work is published and licensed by Dove Medical Press Limited. The
full terms of this license are available at https://www.dovepress.com/terms
and incorporate the Creative Commons Attribution
- Non Commercial (unported, 4.0) License.
By accessing the work you hereby accept the Terms. Non-commercial uses of the work are permitted
without any further permission from Dove Medical Press Limited, provided the work is properly
attributed. For permission for commercial use of this work, please see paragraphs 4.2 and 5 of our Terms.
Recommended articles
The Economic Burden of Diabetic Retinopathy in Jordan: Cost Analysis and Associated Factors
Al-Dwairi RA, Aleshawi A, Abu-zreig L, Al-Shorman W, Al Beiruti S, Alshami AO, Allouh MZ
ClinicoEconomics and Outcomes Research 2024, 16:161-171
Published Date: 15 March 2024
Brolucizumab versus Aflibercept in Patients with Diabetic Macular Edema: A Meta-Analysis of Randomized Controlled Trials
Justino LB, Justino GB, Graffunder FP, Binotti WW, Khodor A, Caranfa JT
Clinical Ophthalmology 2024, 18:3679-3690
Published Date: 10 December 2024
Non-Linear Relationship Between Fasting C-Peptide and Retinopathy in Patients with Type 2 Diabetes Mellitus - A Retrospective Study
Ma J, Han C, Lv Y, Cai H
Diabetes, Metabolic Syndrome and Obesity 2025, 18:1035-1045
Published Date: 7 April 2025
Association Between Serum Vitamin D3 Levels and Diabetic Macular Edema in Patients with Type 2 Diabetes: A Retrospective Case-Control Study
Al-latayfeh M, Shatnawi RA, Abu-Ain MS, Alotaibi TM, Albazee E, Al-balawi M, Alnifise MH
Diabetes, Metabolic Syndrome and Obesity 2026, 19:588850
Published Date: 20 February 2026