Back to Journals » Journal of Hepatocellular Carcinoma » Volume 13
Noninvasive Prediction of High Ki-67 Expression in Hepatocellular Carcinoma Using Multiparametric MRI and Clinical Biomarkers
Authors Zhang F, Chen G, Huang M, Yang Y, Wang Z, Shen Y ![]() , Luo Y, Hu X
, Luo Y, Hu X ![]() , Li Z
, Li Z ![]()
Received 18 October 2025
Accepted for publication 20 January 2026
Published 17 February 2026 Volume 2026:13 574222
DOI https://doi.org/10.2147/JHC.S574222
Checked for plagiarism Yes
Review by Single anonymous peer review
Peer reviewer comments 2
Editor who approved publication: Dr Mohamed Shaker
Fan Zhang,1,2,* Gen Chen,1,* Mengqi Huang,1 Yang Yang,1 Zixiong Wang,1 Yaqi Shen,1 Yan Luo,1,* Xuemei Hu,1,* Zhen Li1
1Department of Radiology, Tongji Hospital, Tongji Medical College, Huazhong University of Science and Technology, Wuhan, Hubei, People’s Republic of China; 2Department of Radiology, The First Affiliated Hospital of Xi’an Jiaotong University, Xi’an, Shaanxi, People’s Republic of China
*These authors contributed equally to this work
Correspondence: Xuemei Hu, Department of Radiology, Tongji Hospital, Tongji Medical College, Huazhong University of Science and Technology, 1095 Jiefang Avenue, Qiaokou District, Wuhan, Hubei, 430030, People’s Republic of China, Tel +86-13647201714, Email [email protected] Yan Luo, Department of Radiology, Tongji Hospital, Tongji Medical College, Huazhong University of Science and Technology, 1095 Jiefang Avenue, Qiaokou District, Wuhan, Hubei, 430030, People’s Republic of China, Tel +86-13476867839, Email [email protected]
Purpose: This study aimed to develop and validate a noninvasive multiparametric magnetic resonance imaging (MRI) model integrating hepatobiliary-phase T1 mapping (T1HBP), tumor-to-liver R2-star ratio (TLRR2*), and clinical biomarkers to predict high Ki-67 expression (> 30%) in patients with hepatocellular carcinoma (HCC).
Patients and Methods: In this retrospective study, 60 patients with histopathologically confirmed HCC who underwent preoperative multiparametric MRI—including T1 mapping, proton density fat fraction (PDFF), and R2-star sequences—were enrolled. Based on immunohistochemical analysis, patients were classified into high (n=22) and low (n=38) Ki-67 expression groups. Clinical data and quantitative MRI parameters were compared between groups. Univariate and multivariate logistic regression analyses were conducted to identify independent predictors of high Ki-67 expression. The diagnostic performance of each parameter and the combined model was evaluated using receiver operating characteristic (ROC) curve analysis.
Results: Multivariate analysis identified serum total bilirubin (TBil; OR=1.109, p=0.032), T1HBP (OR=1.004, p=0.026), and TLRR2* (OR=5.428, p=0.034) as independent predictors of high Ki-67 expression. The multiparametric model incorporating TBil, T1HBP, and TLRR2* achieved superior predictive performance, with an area under the ROC curve (AUC) of 0.813 (95% CI: 0.704– 0.923), significantly outperforming individual parameters (T1HBP AUC=0.682, TLRR2* AUC=0.671, TBil AUC=0.664; all p< 0.05). Interobserver agreement for imaging measurements was excellent (ICC > 0.80).
Conclusion: The combined multiparametric MRI model incorporating T1HBP, TLRR2*and TBil provides a noninvasive approach for predicting high proliferative activity in HCC, representing a promising tool for preoperative risk stratification and personalized treatment planning.
Keywords: hepatocellular carcinoma, magnetic resonance imaging, Ki-67, prognosis, biomarkers, tumor microenvironment
Introduction
Hepatocellular carcinoma (HCC) is a leading cause of cancer-related mortality worldwide, with over 800,000 new cases annually and generally poor patient outcomes, representing a persistent major global health burden.1,2 For patients with intermediate-stage HCC as defined by the Barcelona Clinic Liver Cancer (BCLC) staging system, transarterial chemoembolization (TACE) remains the standard treatment, applied in over 50% of cases; however, treatment responses are highly variable.3–5 This variability is primarily due to the tumor’s biological behavior, particularly its marked heterogeneity in invasiveness and proliferative activity, which are central to treatment resistance and long-term prognosis.6,7
The Ki-67 nuclear antigen is a key marker of cellular proliferation, with expression levels closely correlating with histological grade, risk of early recurrence, and poor survival outcomes in HCC, thus offering well-established prognostic value.8–10 Alongside other histopathological features like microvascular invasion (MVI), Ki-67 status is crucial for risk stratification.11 However, current clinical assessment relies on immunohistochemical analysis of biopsy or surgical specimens.12 This invasive approach carries risks such as bleeding and needle-track seeding. Moreover, the inherent intratumoral heterogeneity of HCC introduces sampling bias, limiting accurate assessment of global proliferative status.13 Consequently, this method does not fulfill clinical requirements for precise preoperative risk evaluation or dynamic post-treatment monitoring.
Therefore, there is an urgent unmet need for an imaging biomarker capable of noninvasively, comprehensively, and reproducibly quantifying tumor proliferative activity. Advances in quantitative magnetic resonance imaging (MRI) offer a promising avenue. Several tissue-sensitive techniques are now clinically available for precise quantification of distinct pathophysiological features of the tumor microenvironment: T1 mapping quantifies tissue longitudinal relaxation time, providing sensitivity to cellularity, fibrosis, and extracellular matrix changes; prior studies have demonstrated an association between T1 values and HCC pathological grade.14,15 Proton density fat fraction (PDFF) precisely measures tissue triglyceride content and is valuable for detecting metabolic reprogramming—a hallmark of cancer linked to proliferation, varying with tumor differentiation and genetic phenotype.16,17 R2-star mapping, by assessing blood oxygen level-dependent (BOLD) effects and paramagnetic substances such as hemosiderin, sensitively reflects the hypoxic tumor microenvironment and secondary hemorrhage; hypoxia is a central driver of malignant progression, angiogenesis, and therapy resistance in HCC.18,19
Although these techniques have each demonstrated utility in liver disease assessment, prior studies evaluating imaging biomarkers for Ki-67 expression have primarily focused on single parameters (eg, ADC value or T1 value), often yielding inconsistent results and limited predictive performance, failing to capture the complexity of tumor biology.20 Notably, there is a paucity of studies rigorously and concurrently comparing T1 mapping, PDFF, and R2-star mapping—three modalities reflecting complementary biological domains (structural, metabolic, and hypoxic)—to systematically assess their individual and combined value in predicting Ki-67 expression in HCC.21–23 This study aims to address this gap. We hypothesize that an MRI model integrating these multiparametric data will provide additive predictive value beyond any single parameter, enabling more comprehensive and accurate characterization of tumor proliferative activity and mitigating sampling errors caused by intratumoral heterogeneity in biopsies. As an initial exploratory investigation, this study seeks to develop and provide preliminary evidence for such a multiparametric model. This study is anticipated to deliver a powerful imaging tool for noninvasive preoperative identification of highly proliferative HCC, optimization of individualized treatment strategies, and improvement of patient outcomes.
Materials and Methods
Study Design and Patient Selection
This retrospective study was approved by the Institutional Review Board of Tongji Hospital (approval number: TJ-IRB20231133). A waiver of informed consent was granted. Eligible patients (n = 215) were identified by a systematic search of the electronic medical record system for cases between September 2021 and September 2023. Inclusion criteria comprised: (1) histopathological confirmation of HCC; (2) preoperative multiparametric MRI, including T1 mapping, PDFF, and R2-star sequences; and (3) availability of a complete Ki-67 IHC report. Exclusion criteria were: (1) history of any locoregional or systemic therapy for HCC (eg, TACE, ablation, or targeted therapy) (n = 98); (2) severe MRI artifacts precluding quantitative analysis (n = 12); and (3) insufficient pathological specimen or missing Ki-67 report (n = 45).
A total of 60 patients met all eligibility criteria and were included in the final analysis. Based on postoperative Ki-67 index values, using a clinically relevant cutoff of 30%,24 patients were categorized into a high-expression group (>30%; n = 22) and a low-expression group (≤30%; n = 38). The patient selection process is summarized in the flowchart (Figure 1).
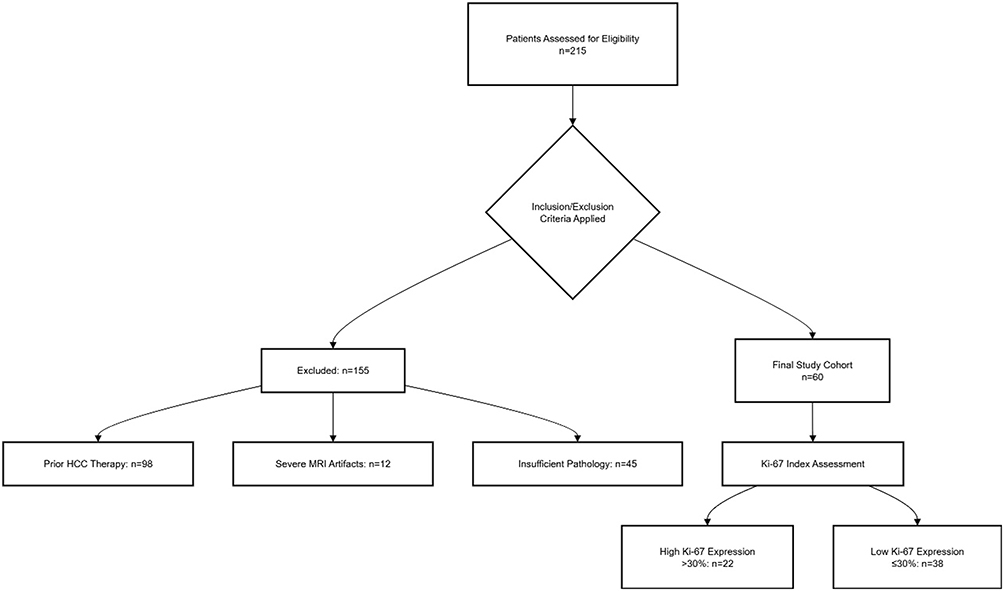 |
Figure 1 Flowchart of the study population. |
Data Collection
Clinical, laboratory, and pathological data were retrospectively extracted from the institutional electronic medical record system. The following variables were collected: demographic data (age, sex); laboratory parameters (alanine aminotransferase [ALT], aspartate aminotransferase [AST], albumin, serum total bilirubin [TBil], creatinine, prothrombin time [PT], international normalized ratio [INR], alpha-fetoprotein [AFP]); viral infection status (hepatitis B virus [HBV], hepatitis C virus [HCV]); and pathological characteristics (tumor type, Ki-67 index). All data were anonymized upon extraction in strict accordance with institutional protocols for data security and patient privacy.
MRI Acquisition
All examinations were performed on a 3.0T MRI system (MAGNETOM Skyra, Siemens Healthineers) equipped with an 18-channel phased-array body coil. Patients were imaged in the supine, feet-first position. The imaging protocol comprised routine clinical sequences and dedicated quantitative sequences as follows:
T1 Mapping: Acquired using a B1-corrected dual flip-angle volumetric interpolated breath-hold examination (VIBE) sequence; parameters: repetition time (TR), 5.01 ms; echo time (TE), 2.3 ms; field of view (FOV), 380×380 mm; slice thickness, 4.0 mm; voxel size, 0.8×0.8 × 4.0 mm; flip angles, 3° and 15°. T1 maps were automatically generated by the scanner.
Multi-echo DIXON Sequence: Employed for simultaneous PDFF and R2-star quantification during a single breath-hold (duration ~20 s); parameters: TR, 9.00 ms; TEs: 1.05, 2.46, 3.69, 4.92, 6.15, and 7.38 ms; FOV, 450×450 mm; slice thickness, 3.5 mm; voxel size, 1.4×1.4 × 3.5 mm; flip angle, 4°.
Gadoxetic acid (Primovist, Bayer) was administered intravenously at a dose of 0.1 mL/kg body weight, at a rate of 1.0 mL/s, followed by a 30 mL saline flush. Hepatobiliary phase T1-weighted VIBE images were acquired 20 minutes post-injection.
Image Analysis
Image postprocessing was performed using the 3D Slicer platform (version 5.2.1). All analyses were conducted by a radiologist with more than five years of experience in abdominal imaging. Tumor volumes of interest (VOIs) were delineated on source and water images of the T1 mapping sequence using a semi-automatic threshold-based seed-growing algorithm. The initial seed point was placed centrally within the solid tumor region, carefully excluding necrosis, hemorrhage, major vessels, and image artifacts. The resulting VOI from the water images was transferred to rigidly co-registered PDFF and R2-star maps. Slice-by-slice verification of tumor boundaries was performed, with minimal manual correction as needed. Mean T1, PDFF, and R2-star values within the VOI were automatically computed. Representative MRI examples are provided in Figures 2 and 3.
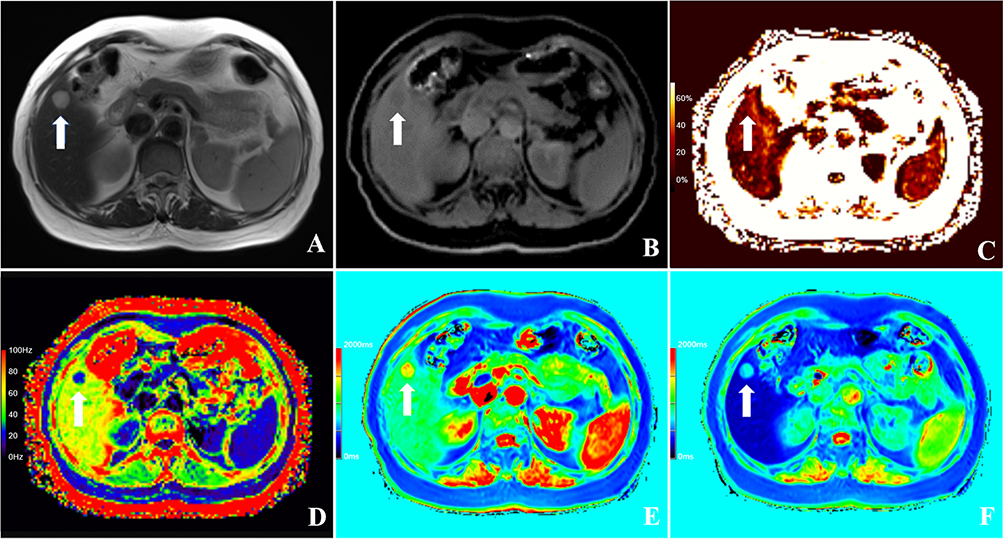 |
Figure 2 Multi-parametric MRI and corresponding histopathological images of a 60-year-old female patient with HCC, with a Ki-67 LI of 5%. Notes All arrows (A–F) point to the same tumor location in the corresponding anatomical slice, facilitating cross-sequence correlation. (A) T2-weighted axial image for tumor localization, with the arrow marking the largest cross-sectional diameter of the neoplasm. (B) Axial water-phase image used to outline the region of interest (ROI) for subsequent replication onto PDFF and R2* quantitative maps. (C) Axial PDFF map quantifying hepatic steatosis. (D) Axial R2* map assessing tissue iron deposition through signal intensity decay rates. (E) Axial precontrast T1 map for calculating T1 relaxation times. (F) Axial hepatobiliary-phase T1 map post Gd-EOB-DTPA administration, delineating hepatocellular function and lesion contrast uptake. The color bars in panels (C–F) indicate the quantitative scale for the respective parametric maps (PDFF in %, R2* in Hz, T1 in ms). |
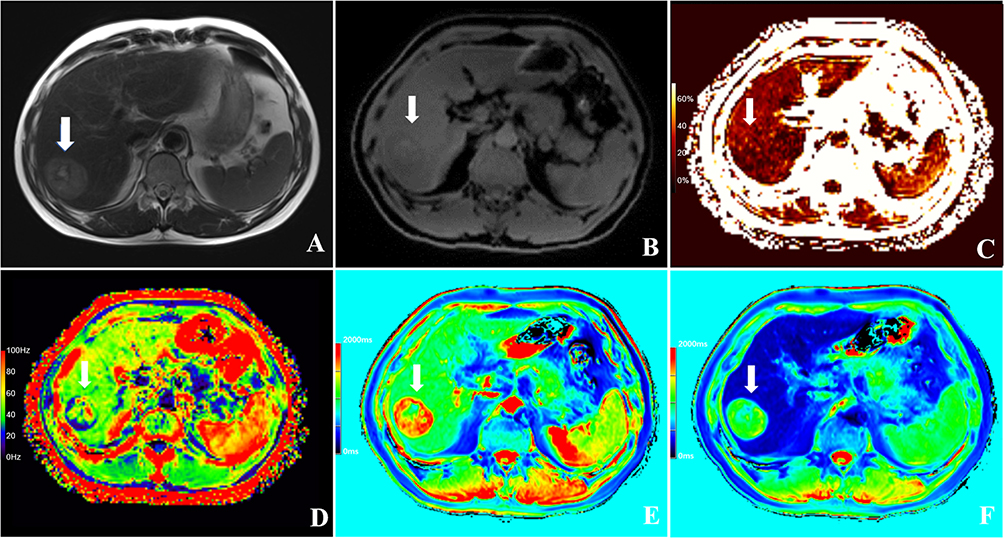 |
Figure 3 Multi-parametric MRI and corresponding histopathological images of a 51-year-old male patient with HCC, with a Ki-67 LI of 40%. Notes All arrows (A–F) point to the same tumor location in the corresponding anatomical slice, facilitating cross-sequence correlation. (A) T2-weighted axial image for tumor localization, with the arrow marking the largest cross-sectional diameter of the neoplasm. (B) Axial water-phase image used to outline the region of interest (ROI) for subsequent replication onto PDFF and R2* quantitative maps. (C) Axial PDFF map quantifying hepatic steatosis. (D) Axial R2* map assessing tissue iron deposition through signal intensity decay rates. (E) Axial precontrast T1 map for calculating T1 relaxation times within hepatic parenchyma and neoplasm. (F) Axial hepatobiliary-phase T1 map post Gd-EOB-DTPA administration, delineating hepatocellular function and lesion contrast uptake. The color bars in panels (C–F) indicate the quantitative scale for the respective parametric maps (PDFF in %, R2* in Hz, T1 in ms). |
Interobserver agreement was evaluated by an independent second radiologist, who repeated VOI delineation and quantitative measurements in a randomly selected subset of 30 cases (50%), blinded to clinical and pathological data. For background liver assessment, three circular regions of interest (ROIs; each approximately 100 mm2) were manually positioned on non-tumorous hepatic parenchyma on T1 maps, avoiding the liver edge, major vessels, bile ducts, and visible lesions. The mean of these measurements was recorded as the background liver value.
To enhance the reproducibility of this study, the calculation methods for the derived parameters are explicitly provided as follows:
- ΔT1% (Percentage change in T1 after contrast administration):
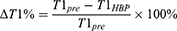
where T1pre is the pre-contrast T1 value and T1HBP is the hepatobiliary phase T1 value.
- Tumor-to-Liver Ratio (TLR):
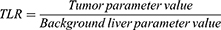
This formula was applied to calculate both TLRPDFF (based on PDFF) and TLRR2* (based on R2*).
Statistical Analysis
Statistical analyses were performed using SPSS (version 22.0; IBM Corp.) and MedCalc (version 20.0; MedCalc Software Ltd). Normality of continuous variables was assessed with the Shapiro–Wilk test. Data are reported as mean ± standard deviation (SD) for normally distributed variables, or median (interquartile range [IQR]) for non-normally distributed variables. Categorical variables are presented as frequencies (percentages). Interobserver agreement was quantified using the intraclass correlation coefficient (ICC) with 95% confidence intervals (CI); an ICC > 0.75 was considered indicative of good agreement. Group differences were assessed using the independent samples t-test (normal distribution) or Mann–Whitney U-test (non-normal distribution) for continuous variables, and the chi-square test or Fisher’s exact test for categorical variables. Variables with a univariate p value < 0.10 were included in the initial multivariate logistic regression model. Diagnostic performance of individual imaging parameters and a combined logistic regression model for prediction of high Ki-67 expression was evaluated by receiver operating characteristic (ROC) curve analysis. The area under the curve (AUC) was calculated; comparisons between AUCs were performed with DeLong’s test. A two-tailed p-value < 0.05 was considered statistically significant.
Results
Patient Baseline Characteristics
A total of 60 patients who met all inclusion and exclusion criteria were included in the final analysis (High Ki-67 group: n = 22; Low Ki-67 group: n = 38). The patient selection process is detailed in Figure 1.
No statistically significant differences were observed between the two groups regarding age, hepatic and renal function (ALT, AST, albumin, creatinine), coagulation profile (PT, INR), or underlying viral hepatitis status (HBV, HCV) (all p > 0.05). However, the proportion of male patients was significantly higher in the high Ki-67 expression group (100.0% vs 84.2%, p = 0.049). Additionally, the high Ki-67 group exhibited significantly elevated TBil (median: 14.30 mg/dL vs 11.00 mg/dL, p = 0.043) and AFP (median: 350.00 ng/mL vs 11.37 ng/mL, p = 0.004). The baseline demographic and clinical characteristics of both groups are summarized in Table 1.
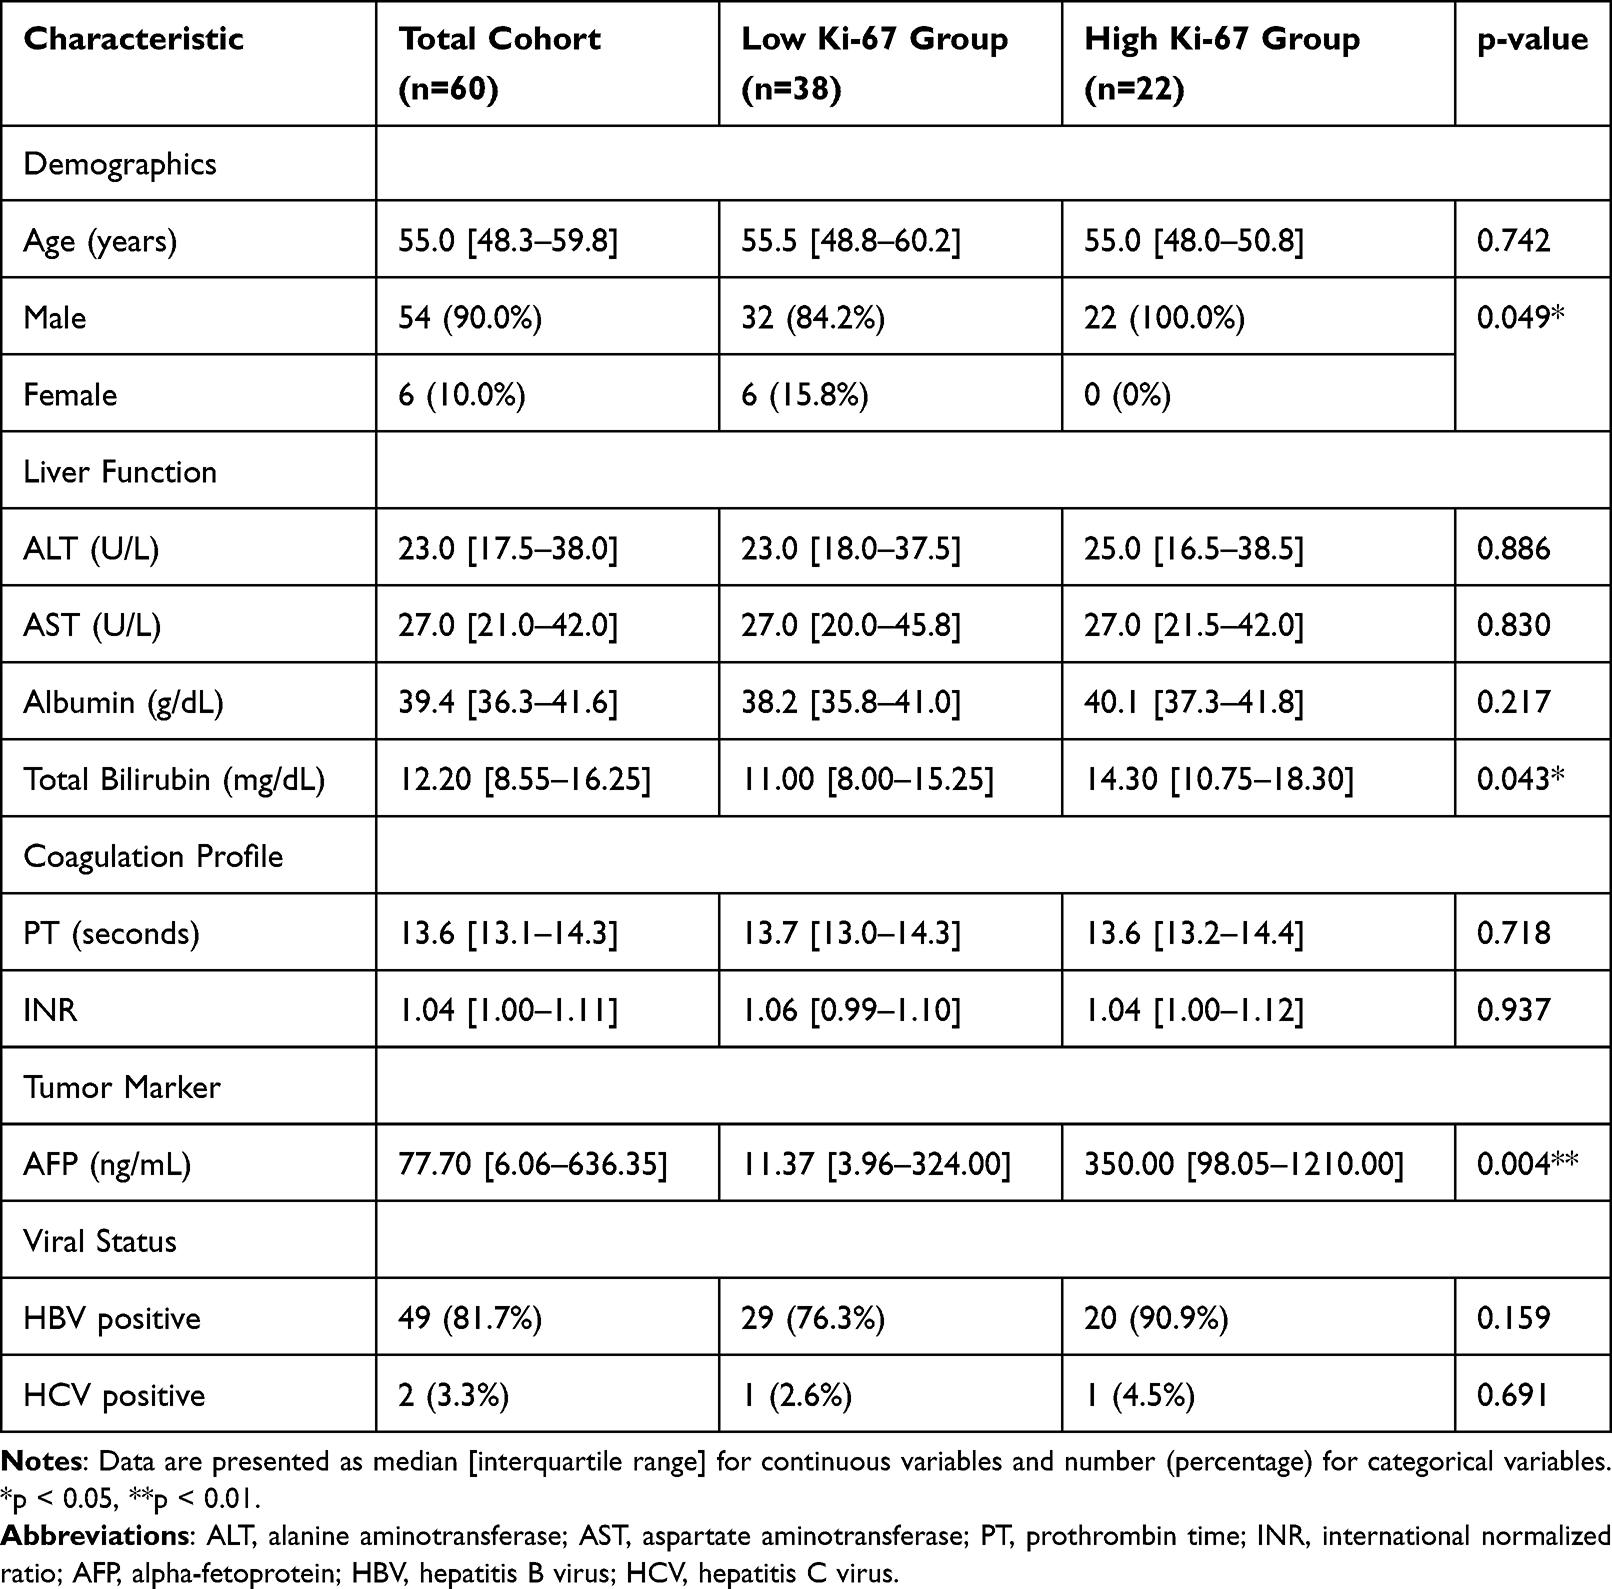 |
Table 1 Baseline Characteristics of HCC Patients Stratified by Ki-67 Expression |
Intergroup Analysis of Quantitative MRI Parameters
Comparative results of quantitative MRI parameters between the high and low Ki-67 expression groups are presented in Table 2. No significant differences were found in precontrast T1 values (T1pre) or the percentage change in T1 after contrast administration (ΔT1%) (p > 0.05). In contrast, the hepatobiliary phase T1 value (T1HBP) was significantly higher in the high Ki-67 group (median: 936.0 ms vs 796.0 ms, p = 0.019). The tumor proton density fat fraction (PDFFtumor) was significantly lower in the high Ki-67 group (median: 3.1% vs 4.0%, p = 0.044), whereas background liver PDFF (PDFFliver) and the tumor-to-liver PDFF ratio (TLRPDFF) showed no significant intergroup differences. For the R2-star parameter, which reflects tissue hypoxia and hemorrhage, neither the absolute tumor R2-star value (R2*tumor) nor the background liver R2-star value (R2*liver) demonstrated statistically significant differences. However, the tumor-to-liver R2-star ratio (TLRR2*) was significantly higher in the high Ki-67 expression group (median: 1.06 vs 0.75, p = 0.028), suggesting a greater burden of paramagnetic substances or hypoxia within highly proliferative tumors relative to the adjacent liver parenchyma. ICC analysis for all parameters yielded values exceeding 0.80, indicating excellent reproducibility of the image segmentation and parameter extraction methodology employed in this study.
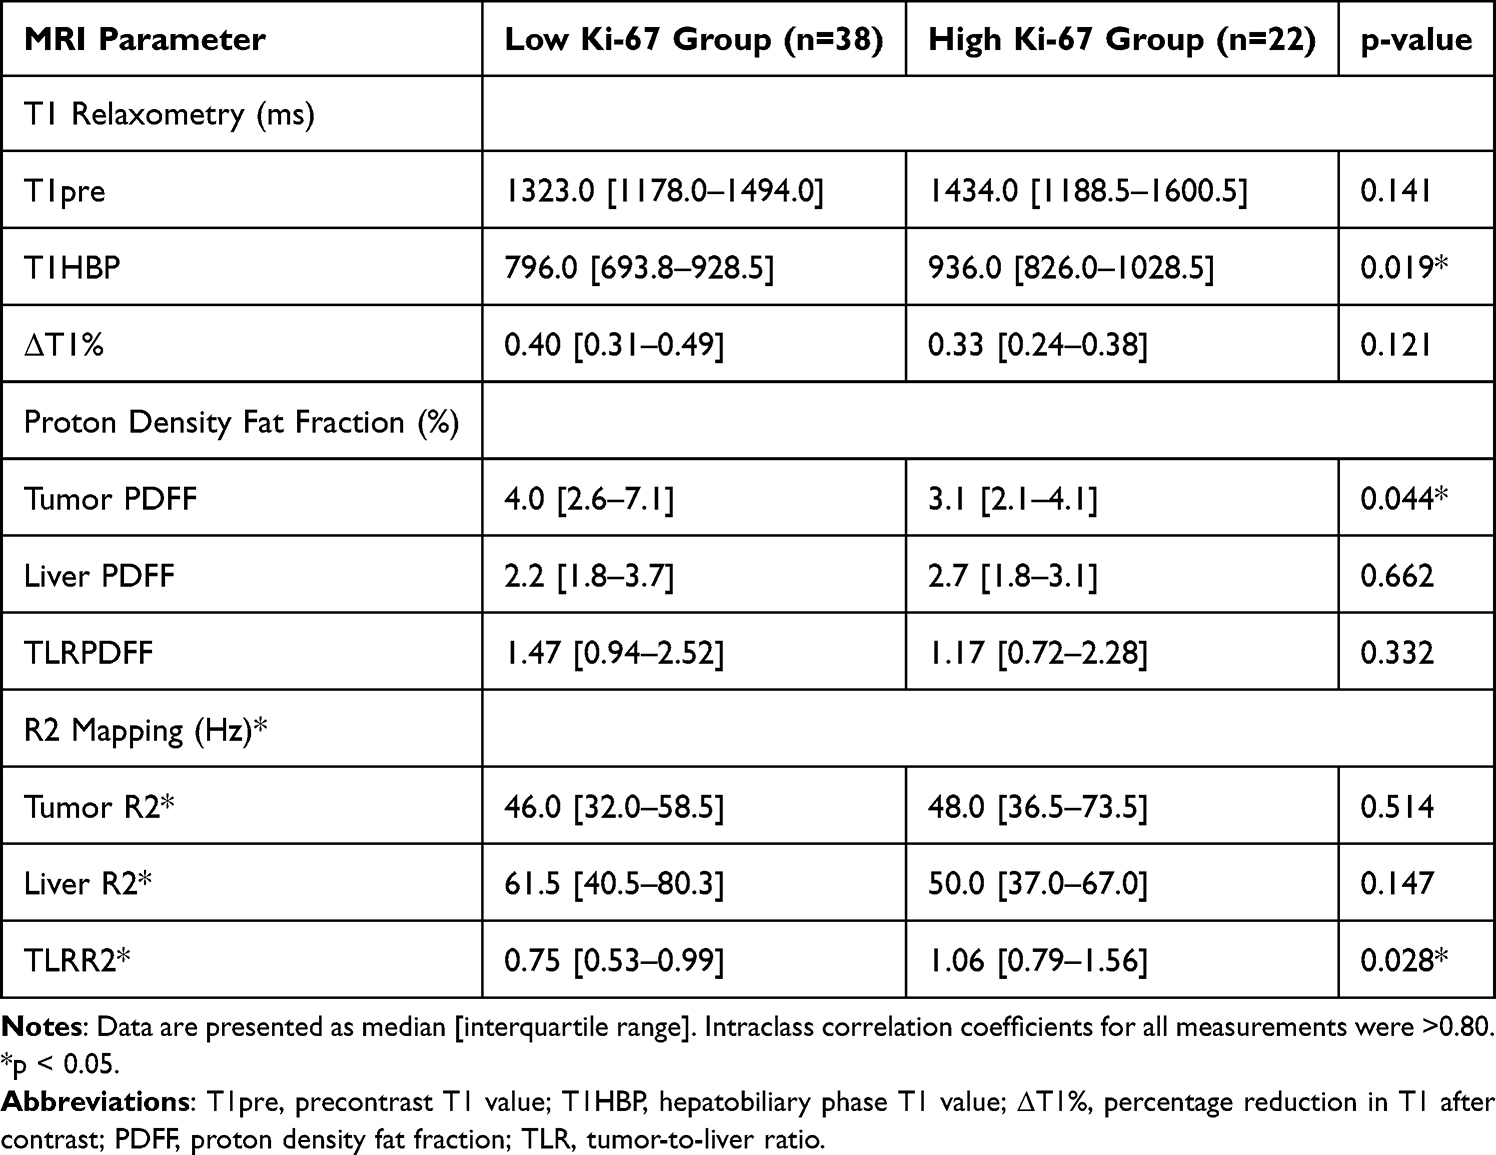 |
Table 2 Quantitative MRI Parameters in Low Vs High Ki-67 Expression Groups |
Predictive Analysis for Ki-67 Expression
Univariate and multivariate logistic regression analyses were performed to identify independent predictors of high Ki-67 expression; the results are shown in Table 3. Univariate analysis identified elevated TBil (p = 0.068, marginal significance), AFP (p = 0.027), T1HBP (p = 0.013), and TLRR2* (p = 0.015) as significant predictors of high Ki-67 expression. Of note, although PDFFtumor differed significantly between groups, its predictive value in univariate analysis was not statistically significant; it was therefore excluded from the multivariate model. The multivariate logistic regression model (incorporating variables with p < 0.1) confirmed TBil (OR = 1.109, 95% CI: 1.008–1.183; p = 0.032), T1HBP (OR = 1.004, 95% CI: 1.001–1.008; p = 0.026), and TLRR2* (OR = 5.428, 95% CI: 1.135–25.956; p = 0.034) as independent predictors of high Ki-67 expression. Although AFP was a significant predictor in univariate analysis (p=0.027), it did not retain independent significance in the multivariate model (p=0.204). Based on these independent predictors, a nomogram was constructed for individualized risk prediction (Figure 4).
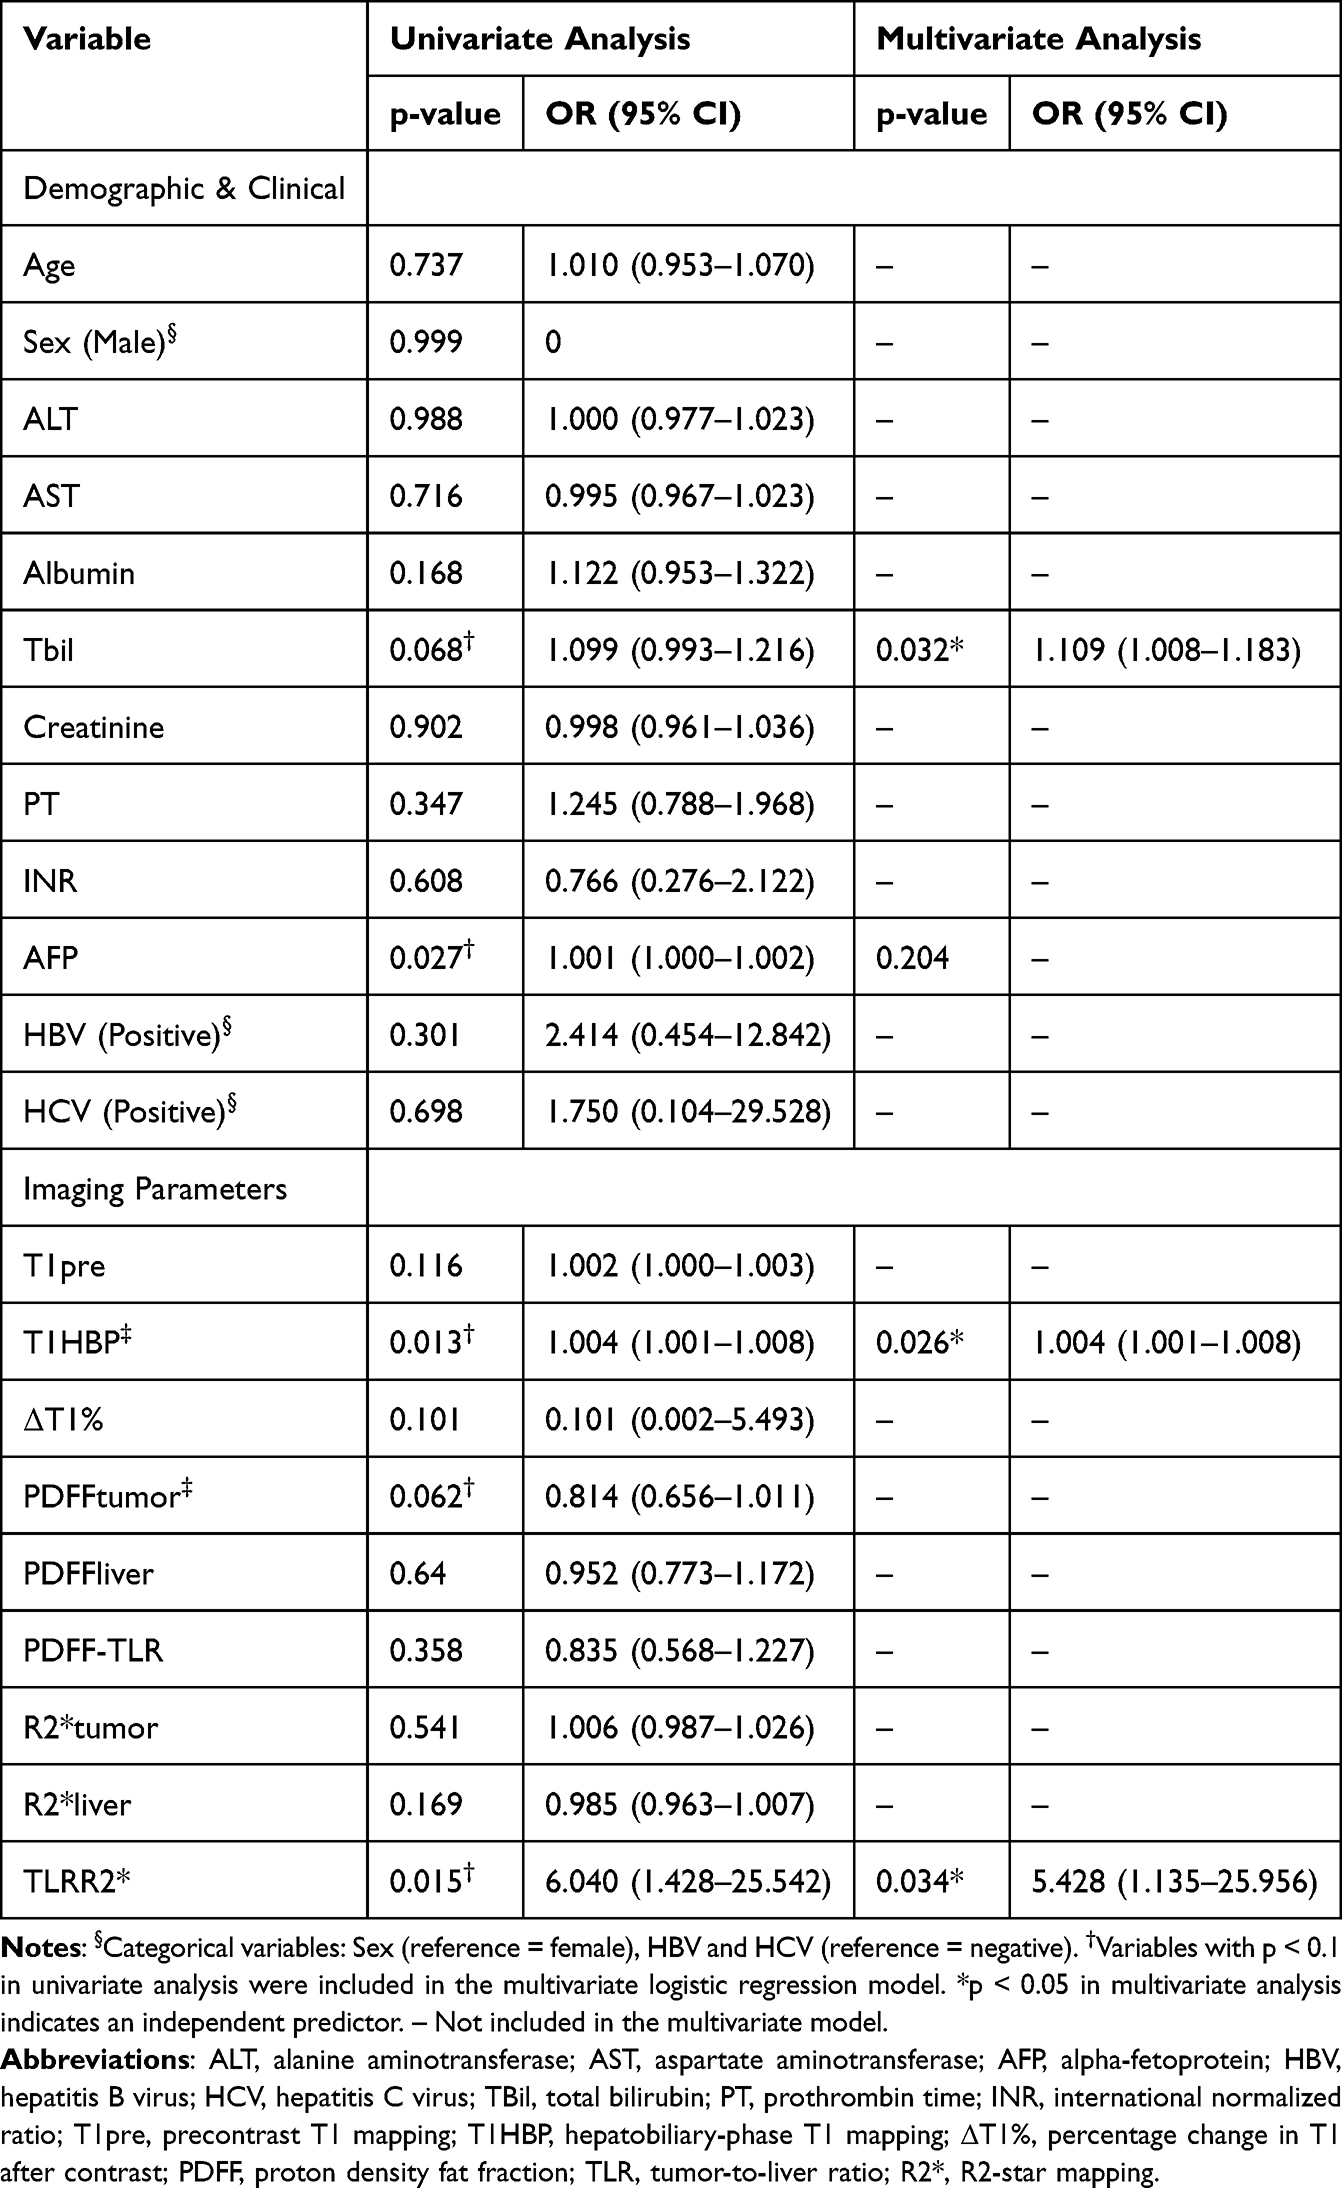 |
Table 3 Univariate and Multivariable Logistic Regression Analyses for Predicting High Ki-67 Expression |
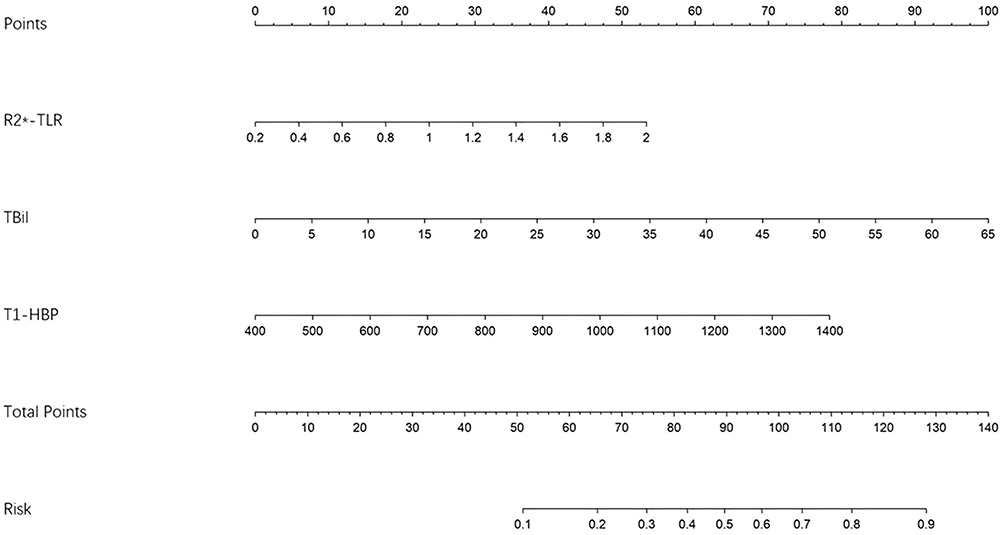 |
Figure 4 A predictive nomogram for HCC incorporating R2*-TLR, TBil, and T1-HBP, translating total points into a probability of high Ki-67 LI. |
The predictive performance of individual parameters and combined models was evaluated using ROC curve analysis (Figure 5). Among the single predictors, T1HBP demonstrated the highest diagnostic efficacy (AUC = 0.682), with TLRR2* and TBil showing comparable performance (AUC = 0.671 and 0.664, respectively). Pairwise comparisons revealed no significant differences between these AUC values (DeLong’s test, p > 0.05). Combination models significantly enhanced predictive performance. A model integrating the two imaging parameters (T1HBP + TLRR2*) achieved an AUC of 0.761. The most robust predictive model incorporated all three independent predictors (TBil + T1HBP + TLRR2*), yielding an AUC of 0.813 (95% CI: 0.704–0.923) and demonstrating strong discriminatory power for identifying highly proliferative HCC.
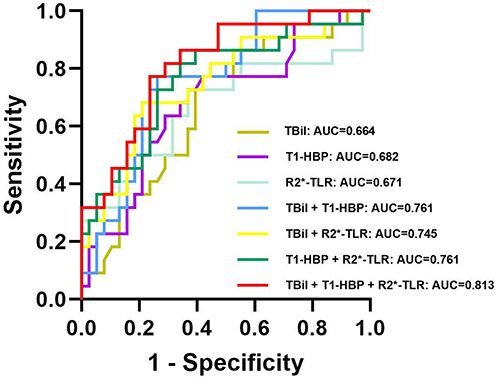 |
Figure 5 ROC curve analysis of TBil, T1-HBP, and R2*-TLR as individual and combined predictors for Ki-67 LI in HCC. Notes: The ROC curves illustrating the predictive performance of various parameters and their combinations for high Ki-67 expression in HCC patients. The AUC values for each parameter and combination are as follows: TBil: AUC=0.664 (95% CI, 0.523 to 0.805); T1-HBP: AUC=0.682 (95% CI, 0.541 to 0.824); R2*-TLR: AUC=0.671 (95% CI, 0.516 to 0.826); TBil + T1-HBP: AUC=0.761 (95% CI, 0.639 to 0.883); TBil + R2*-TLR: AUC=0.745 (95% CI, 0.613 to 0.880); T1-HBP + R2*-TLR: AUC=0.761 (95% CI, 0.631 to 0.890); TBil + T1-HBP + R2*-TLR: AUC=0.813 (95% CI, 0.704 to 0.923). |
Discussion
This study demonstrates that a multiparametric MRI model—integrating derived parameters such as T1HBP and TLRR2* measured from gadoxetic acid-enhanced T1 and R2-star mapping—shows promising potential for predicting high proliferative activity in HCC. The combined model demonstrated superior diagnostic accuracy compared to individual parameters in diagnostic accuracy, offering a robust, non-invasive alternative that helps to circumvent the sampling bias associated with biopsy-based Ki-67 assessment.
The observed imaging phenotypes are closely aligned with underlying tumor biology. Firstly, tumors exhibiting high Ki-67 expression demonstrated significantly prolonged T1HBP, consistent with previous studies.20,25–27 This observation likely reflects the aggressive pathological features characteristic of highly proliferative HCC, typified by downregulation or functional loss of OATP1B3/B1 transporters, which mediate hepatocellular uptake of gadoxetic acid disodium.21,28,29 Furthermore, the abnormal and disorganized intratumoral neovasculature and arteriovenous shunting in these tumors can lead to impaired perfusion, which hinders the delivery of contrast agents.29,30 The combined effect of reduced transporter expression and impaired perfusion ultimately diminishes contrast uptake in aggressive HCCs, manifesting as a prolonged T1HBP2.
Secondly, an elevated TLRR2* was strongly associated with increased Ki-67 expression and heightened proliferative activity. R2-star values reflect tissue magnetic susceptibility, primarily influenced by paramagnetic compounds such as deoxyhemoglobin (a marker of hypoxia) and hemosiderin (indicative of hemorrhage).31 A higher TLRR2* ratio suggests a greater concentration of these materials within tumors relative to the surrounding liver. Rapidly proliferating tumors have increased oxygen consumption, predisposing them to chronic hypoxia.32,33 This microenvironment stimulates vascular endothelial growth factor (VEGF) overexpression, facilitating angiogenesis and epithelial-mesenchymal transition (EMT)—processes intrinsically linked to tumor invasion and metastatic potential.34,35 Thus, TLRR2* serves as a non-invasive imaging biomarker indicative of a more aggressive tumor microenvironment. Notably, although univariate analysis revealed differences in tumor PDFF between groups, PDFF was not an independent predictor in the multivariate model. This finding highlights the complex, potentially non-linear relationship between lipid metabolic reprogramming and proliferation in HCC, which likely varies across molecular subtypes and warrants further investigation.36–38
The principal innovation of our study lies in its comprehensive approach. Unlike prior research that predominantly focused on individual parameters, we concurrently and systematically evaluated multiple MRI indices reflecting diverse biological aspects—including hepatocellular function, hypoxic microenvironment, and liver function—within the same patient cohort.39 Through rigorous statistical analyses, we quantitatively demonstrated the superior predictive value of the combined model compared to any single parameter, thereby providing compelling evidence for a multiparametric diagnostic strategy. Furthermore, we are the first to introduce the TLRR2* ratio in this context, which may better mitigate inter-individual variability than absolute R2-star values and consequently enhance model robustness.
In this study, serum TBil was identified as an independent predictor for high Ki-67 expression. The pathophysiological rationale may lie in the role of TBil as a systemic marker reflecting the overall hepatic pathological state and the severity of a pro‑tumor microenvironment. Elevated TBil levels typically indicate a background of progressive liver fibrosis/cirrhosis and diminished functional reserve.40 Such chronic liver disease is characterized by sustained inflammation, oxidative stress, and cytokine dysregulation, which are key microenvironmental drivers of hepatocarcinogenesis and the shaping of a highly proliferative tumor phenotype.41–43 Furthermore, as an endogenous metabolite, bilirubin accumulation may interact with the heightened oxidative stress faced by tumor cells adapting to rapid proliferation, potentially influencing proliferation‑related signaling pathways.44,45 Therefore, within our predictive model, TBil is not merely a routine liver‑function parameter but also serves as a systemic surrogate that links the severity of underlying liver disease with local tumor biological behavior, thereby providing an important systemic dimension that complements the local assessment based on MRI.
The clinical implications of our model are considerable. It offers a non-invasive means of personalizing HCC management, especially for patients with BCLC intermediate-stage disease.46,47 While MVI remains a cornerstone prognostic factor, the Ki-67 index provides direct and complementary insight into tumor proliferative activity, which is particularly relevant to assessing potential sensitivity to locoregional therapies such as TACE.48,49 By pretherapeutically identifying morphologically intermediate-stage tumors with occult biological aggressiveness (high Ki-67), our model can directly inform clinical decision-making.50,51 For these high-risk individuals, initial TACE may be suboptimal; our model provides an objective rationale for upfront consideration of combination therapies or first-line systemic treatments (eg, targeted agents or immunotherapy), potentially avoiding treatment delays and improving clinical outcomes.52–57 Moreover, our model may serve as a novel biomarker for dynamic, non-invasive monitoring of changes in proliferative activity following therapeutic intervention.58–60
Several limitations of our study should be acknowledged. First, its retrospective single-center design introduces the potential for selection bias.61,62 Furthermore, to safeguard the integrity of the primary endpoint, 45 patients were excluded owing to missing Ki-67 data, a decision that, while methodologically necessary, may limit generalizability. Second, the limited sample size of this study, with a relatively small number of cases in the high Ki‑67 group (22 out of 60), may compromise the stability of the multivariate model and increase the risk of overfitting. Therefore, although the model demonstrates promising predictive performance, the results should be interpreted with caution. The findings are considered preliminary and await external validation in prospective, larger‑scale, multicenter cohorts to further confirm their generalizability and clinical applicability.63 Third, despite stringent quality control protocols for MRI data acquisition, measurement accuracy may be influenced by scanner performance, sequence parameters, and operator expertise.64 Lastly, our analysis was based on mean region-of-interest measurements;65 future studies should employ radiomics approaches to extract high-throughput features throughout the entire tumor volume, thereby more comprehensively capturing intratumoral spatial heterogeneity and potentially further enhancing predictive performance.
In conclusion, we developed and preliminarily validated a combined model based on widely available clinical multiparametric MRI sequences that non-invasively and accurately predicts HCC proliferative activity, outperforming traditional single-parameter approaches. This tool provides robust support for non-invasive, preoperative assessment of tumor aggressiveness and holds significant potential to optimize personalized treatment strategies. Subsequent prospective, multi-center validation is essential to facilitate clinical translation of these findings.
Conclusion
We developed a noninvasive model integrating T1HBP, TLRR2*and serum TBil for predicting high Ki-67 expression in HCC. This multiparametric approach demonstrated improved diagnostic performance compared to individual parameters in our cohort, suggesting its potential as a preoperative tool for assessing tumor proliferative activity. While our findings are promising, they are based on a single-center retrospective study with a limited sample size. Therefore, further validation in larger, prospective multicenter studies is warranted before clinical application.
Abbreviations
AFP, alpha-fetoprotein; ALT, alanine aminotransferase; AST, aspartate aminotransferase; AUC, area under the curve; BCLC, Barcelona Clinic Liver Cancer; BOLD, blood oxygen level-dependent; CI, confidence interval; EMT, epithelial-mesenchymal transition; FOV, field of view; HBV, hepatitis B virus; HCC, hepatocellular carcinoma; HCV, hepatitis C virus; ICC, intraclass correlation coefficient; INR, international normalized ratio; IQR, interquartile range; MRI, magnetic resonance imaging; MVI, microvascular invasion; PDFF, proton density fat fraction; PDFFliver, liver PDFF; PDFFtumor, tumor proton density fat fraction; PT, prothrombin time; R2*liver, background liver R2-star value; R2*tumor, absolute tumor R2-star value; ROC, receiver operating characteristic; ROIs, regions of interest; SD, standard deviation; TACE, transarterial chemoembolization; TBil, serum total bilirubin; TE, echo time; TR, repetition time; T1HBP, hepatobiliary phase T1 value; T1pre, precontrast T1 values; ΔT1%, percentage change in T1 after contrast administration; TLRPDFF, tumor-to-liver PDFF ratio; TLRR2*tumor-to-liver R2-star ratio; VEGF, vascular endothelial growth factor; VIBE, volumetric interpolated breath-hold examination; VOIs, volumes of interest.
Statement of Ethics
This retrospective cohort study was conducted in accordance with the Declaration of Helsinki and approved by the Institutional Review Board of Tongji Hospital, Tongji Medical College, Huazhong University of Science and Technology (approval number: TJ-IRB20231133). The requirement for informed consent was waived by the IRB due to the retrospective nature of the study, the use of fully anonymized data, and the minimal risk to participants. Patient data confidentiality was strictly maintained throughout the study, and no identifiable information was disclosed.
Acknowledgments
Fan Zhang and Gen Chen contributed equally as first authors; Yan Luo and Xuemei Hu contributed equally as corresponding authors. We thank DeepSeek-V3 for language editing. The tool was used solely for linguistic refinement and not for the generation of any scholarly content.
Funding
This work was supported by the National Natural Science Foundation of China [Grant Number 82001786].
Disclosure
The authors have no conflicts of interest to disclose.
References
1. Rumgay H, Arnold M, Ferlay J, et al. Global burden of primary liver cancer in 2020 and predictions to 2040. J Hepatol. 2022;77(6):1598–14. doi:10.1016/j.jhep.2022.08.021
2. Gerbes A, Zoulim F, Tilg H, et al. Gut roundtable meeting paper: selected recent advances in hepatocellular carcinoma. Gut. 2018;67(2):380–388. doi:10.1136/gutjnl-2017-315068
3. Galle PR, Tovoli F, Foerster F, et al. The treatment of intermediate stage tumours beyond TACE: from surgery to systemic therapy. J Hepatol. 2017;67(1):173–183. doi:10.1016/j.jhep.2017.03.007
4. Lim JY, Lee M, Kim TH. Is transarterial chemoembolization only treatment option in patients with intermediate stage of hepatocellular carcinoma?: in perspectives of surgery. J Liver Cancer. 2020;20(2):113–119. doi:10.17998/jlc.20.2.113
5. Zhang D, Zhang Z, Luo J, et al. Efficacy and safety of transarterial chemoembolization alone compared to its combination with anlotinib among patients with intermediate or advanced stage hepatocellular carcinoma: a Phase II randomized controlled trial. J Gastrointest Oncol. 2024;15(4):1627–1635. doi:10.21037/jgo-24-497
6. Elshaarawy O, Gomaa A, Omar H, Rewisha E, Waked I. Intermediate stage hepatocellular carcinoma: a summary review. J Hepatocell Carcinoma. 2019;6:105–117. doi:10.2147/JHC.S168682
7. L TFDL, Broszczak D, Zhang X, et al. The use of minimally invasive biomarkers for the diagnosis and prognosis of hepatocellular carcinoma. Biochim Biophys Acta Rev Cancer. 2020;1874(2):188451. doi:10.1016/j.bbcan.2020.188451
8. Sykaras AG, Pergaris A, Challenging TS. Accurate and feasible: CAF-1 as a tumour proliferation marker of diagnostic and prognostic value. Cancers. 2021;13(11):2575. doi:10.3390/cancers13112575
9. Masuda D, Masuda R, Matsuzaki T, et al. Ki-67 labeling index affects tumor infiltration patterns of lung squamous cell carcinoma. Mol Med Rep. 2015;12(5):7303–7309. doi:10.3892/mmr.2015.4354
10. Karabulut E, Akbulut S, Samdanci ET, et al. Are Ki-67 and procalcitonin expression levels useful in predicting the biological behavior of hepatocellular carcinoma after liver transplantation? J Clin Med. 2024;14(1):144. doi:10.3390/jcm14010144
11. Ma L, Zhang C, Wen Y, et al. Imaging-based surrogate classification for risk stratification of hepatocellular carcinoma with microvascular invasion to adjuvant hepatic arterial infusion chemotherapy: a multicenter retrospective study. Int J Surg. 2025;111(1):872–883. doi:10.1097/JS9.0000000000001903
12. Ng IO, Na J, Lai EC, Fan ST, Ng M. Ki-67 antigen expression in hepatocellular carcinoma using monoclonal antibody MIB1. A comparison with proliferating cell nuclear antigen. Am J Clin Pathol. 1995;104(3):313–318. doi:10.1093/ajcp/104.3.313
13. Fernebro J, Engellau J, Persson A, Rydholm A, Nilbert M. Standardizing evaluation of sarcoma proliferation- higher Ki-67 expression in the tumor periphery than the center. APMIS. 2007;115(6):707–712. doi:10.1111/j.1600-0463.2007.apm_650.x
14. Dahlqvist Leinhard O, Dahlstrom N, Kihlberg J, et al. Quantifying differences in hepatic uptake of the liver specific contrast agents Gd-EOB-DTPA and Gd-BOPTA: a pilot study. Eur Radiol. 2012;22(3):642–653. doi:10.1007/s00330-011-2302-4
15. Zhang Z, Liu J, Zhang Y, et al. T1 mapping as a quantitative imaging biomarker for diagnosing cervical cancer: a comparison with diffusion kurtosis imaging. BMC Med Imaging. 2024;24(1):16. doi:10.1186/s12880-024-01191-x
16. Hui RW, Chan AC, Lo G, et al. Magnetic resonance elastography and proton density fat fraction predict adverse outcomes in hepatocellular carcinoma. Hepatol Int. 2022;16(2):371–380. doi:10.1007/s12072-022-10305-y
17. Liang Y, Han X, Wang Z, et al. MRI proton density fat fraction for estimation of biological characteristics in hepatocellular carcinoma. BMC Med Imaging. 2025;25(1):221. doi:10.1186/s12880-025-01789-9
18. Doyle E, Ghugre N, Coates TD, Wood JC. Fixing the MRI R2-iron calibration in liver. Am J Hematol. 2020;95(5):E120–E122. doi:10.1002/ajh.25754
19. Obmann VC, Berzigotti A, Catucci D, et al. T1 mapping of the liver and the spleen in patients with liver fibrosis-does normalization to the blood pool increase the predictive value? Eur Radiol. 2021;31(6):4308–4318. doi:10.1007/s00330-020-07447-8
20. Qiu G, Chen J, Liao W, et al. Gadoxetic acid-enhanced MRI combined with T1 mapping and clinical factors to predict Ki-67 expression of hepatocellular carcinoma. Front Oncol. 2023;13:1134646. doi:10.3389/fonc.2023.1134646
21. Kitao A, Matsui O, Yoneda N, et al. Gadoxetic acid-enhanced MR imaging for hepatocellular carcinoma: molecular and genetic background. Eur Radiol. 2020;30(6):3438–3447. doi:10.1007/s00330-020-06687-y
22. Thompson RB, Sherrington R, Beaulieu C, et al. Reference values for water-specific T1 of the liver at 3 T: T2*-compensation and the confounding effects of fat. J Magn Reson Imaging. 2024;60(5):2063–2075. doi:10.1002/jmri.29262
23. O’Connor JPB, Boult JKR, Jamin Y, et al. Oxygen-enhanced MRI accurately identifies, quantifies, and maps tumor hypoxia in preclinical cancer models. Cancer Res. 2016;76(4):787–795. doi:10.1158/0008-5472.CAN-15-2062
24. Du Y, Li C, Mao L, et al. A nomogram incorporating Ki67 to predict survival of acral melanoma. J Cancer Res Clin Oncol. 2023;149(14):13077–13085. doi:10.1007/s00432-023-05127-w
25. Liang Y, Xu F, Mou Q, et al. A gadoxetic acid-enhanced MRI-based model using LI-RADS v2018 features for preoperatively predicting Ki-67 expression in hepatocellular carcinoma. BMC Med Imaging. 2024;24(1):27. doi:10.1186/s12880-024-01204-9
26. Liu Z, Yang S, Chen X, et al. Nomogram development and validation to predict Ki-67 expression of hepatocellular carcinoma derived from Gd-EOB-DTPA-enhanced MRI combined with T1 mapping. Front Oncol. 2022;12:954445. doi:10.3389/fonc.2022.954445
27. Hu X, Yang Z, Liang H, et al. Whole-tumor MRI histogram analyses of hepatocellular carcinoma: correlations with Ki-67 labeling index. J Magn Reson Imaging. 2017;46(2):383–392. doi:10.1002/jmri.25555
28. Poetter-Lang S, Bastati N, Messner A, et al. Quantification of liver function using gadoxetic acid-enhanced MRI. Abdom Radiol. 2020;45(11):3532–3544. doi:10.1007/s00261-020-02779-x
29. Choi JW, Lee JM, Kim SJ, et al. Hepatocellular carcinoma: imaging patterns on gadoxetic acid-enhanced MR Images and their value as an imaging biomarker. Radiology. 2013;267(3):776–786. doi:10.1148/radiol.13120775
30. Haradome H, Unno T, Morisaka H, et al. Gadoxetic acid disodium-enhanced MR imaging of cholangiolocellular carcinoma of the liver: imaging characteristics and histopathological correlations. Eur Radiol. 2017;27(11):4461–4471. doi:10.1007/s00330-017-4811-2
31. Soe K, Hishikawa Y, Fukuzawa Y, et al. Possible correlation between iron deposition and enhanced proliferating activity in hepatitis C virus-positive hepatocellular carcinoma in Myanmar (Burma). J Gastroenterol. 2007;42(3):225–235. doi:10.1007/s00535-006-1993-9
32. Jing X, Yang F, Shao C, et al. Role of hypoxia in cancer therapy by regulating the tumor microenvironment. Mol Cancer. 2019;18(1):157. doi:10.1186/s12943-019-1089-9
33. Shi Z, Hu C, Zheng X, Sun C, Li Q. Feedback loop between hypoxia and energy metabolic reprogramming aggravates the radioresistance of cancer cells. Exp Hematol Oncol. 2024;13(1):55. doi:10.1186/s40164-024-00519-1
34. Yang X, Wu M, Kong X, et al. Exosomal miR-3174 induced by hypoxia promotes angiogenesis and metastasis of hepatocellular carcinoma by inhibiting HIPK3. iScience. 2024;27(2):108955. doi:10.1016/j.isci.2024.108955
35. Yang M, Mu Y, Yu X, et al. Survival strategies: how tumor hypoxia microenvironment orchestrates angiogenesis. Biomed Pharmacother. 2024;176:116783. doi:10.1016/j.biopha.2024.116783
36. Dai P, Feng J, Dong Y, et al. Metabolic reprogramming in hepatocellular carcinoma: an integrated omics study of lipid pathways and their diagnostic potential. J Transl Med. 2025;23(1):644. doi:10.1186/s12967-025-06698-7
37. Yan J, Zhang Y, Zheng X, et al. A novel in-depth “static- dynamic” lipidomics workflow to reveal lipids reprogramming in hepatocellular carcinoma. J Pharm Biomed Anal. 2025;262:116880. doi:10.1016/j.jpba.2025.116880
38. Liu Q, Zhang X, Qi J, et al. Comprehensive profiling of lipid metabolic reprogramming expands precision medicine for HCC. Hepatology. 2025;81(4):1164–1180. doi:10.1097/HEP.0000000000000962
39. Li H, Zhang J, Liu B, Zheng Z, Xu Y. Histogram analysis of multiple mathematical diffusion-weighted imaging models for preoperative prediction of Ki-67 expression in hepatocellular carcinoma. Front Oncol. 2025;15:1531236. doi:10.3389/fonc.2025.1531236
40. Carr BI, Guerra V. A hepatocellular carcinoma aggressiveness index and its relationship to liver enzyme levels. Oncology. 2016;90(4):215–220. doi:10.1159/000444394
41. Luedde T, Schwabe RF. NF-κB in the liver--linking injury, fibrosis and hepatocellular carcinoma. Nat Rev Gastroenterol Hepatol. 2011;8(2):108–118. doi:10.1038/nrgastro.2010.213
42. Yadav P, Singh SK, Rajput S, et al. Therapeutic potential of stem cells in regeneration of liver in chronic liver diseases: current perspectives and future challenges. Pharmacol Ther. 2024;253:108563. doi:10.1016/j.pharmthera.2023.108563
43. Lin X, Zhang J, Chu Y, Nie Q, Zhang J. Berberine prevents NAFLD and HCC by modulating metabolic disorders. Pharmacol Ther. 2024;254:108593. doi:10.1016/j.pharmthera.2024.108593
44. Pericàs JM, Anstee QM, Augustin S, et al. A roadmap for clinical trials in MASH-related compensated cirrhosis. Nat Rev Gastroenterol Hepatol. 2024;21(11):809–823. doi:10.1038/s41575-024-00955-8
45. Pomacu MM, Trașcă MD, Pădureanu V, et al. Interrelation of inflammation and oxidative stress in liver cirrhosis. Exp Ther Med. 2021;21(6):602. doi:10.3892/etm.2021.10034
46. Ruff SM, Manne A, Cloyd JM, et al. Current landscape of immune checkpoint inhibitor therapy for hepatocellular carcinoma. Curr Oncol. 2023;30(6):5863–5875. doi:10.3390/curroncol30060439
47. Kotsifa E, Vergadis C, Vailas M, et al. Transarterial Chemoembolization for Hepatocellular Carcinoma: why, When, How? J Pers Med. 2022;12(3):436. doi:10.3390/jpm12030436
48. Xiang C, Shen X, Zeng X, et al. Effect of transarterial chemoembolization as postoperative adjuvant therapy for intermediate-stage hepatocellular carcinoma with microvascular invasion: a multicenter cohort study. Int J Surg. 2024;110(1):315–323. doi:10.1097/JS9.0000000000000805
49. Li H, Qi L, Ma L, et al. Effect of KI-67 positive cellular index on prognosis after hepatectomy in Barcelona Clinic Liver Cancer stage A and B hepatocellular carcinoma with microvascular invasion. Onco Targets Ther. 2018;11:4747–4754. doi:10.2147/OTT.S165244
50. Jones A, Kroneman TN, Blahnik AJ, et al. Ki-67 “hot spot” digital analysis is useful in the distinction of hepatic adenomas and well-differentiated hepatocellular carcinomas. Virchows Arch. 2021;478(2):201–207. doi:10.1007/s00428-020-02868-8
51. Wang S, Zhang X, Chen Q, et al. A novel neutrophil-to-lymphocyte ratio and sarcopenia based TACE-predict model of hepatocellular carcinoma patients. J Hepatocell Carcinoma. 2023;10:659–671. doi:10.2147/JHC.S407646
52. Finn RS, Qin S, Ikeda M, et al. Atezolizumab plus Bevacizumab in unresectable hepatocellular carcinoma. N Engl J Med. 2020;382(20):1894–1905. doi:10.1056/NEJMoa1915745
53. You R, Cheng Y, Diao L, et al. Immune-targeted therapy with or without transarterial chemoembolization (TACE) for Advanced Hepatocellular Carcinoma with Portal Vein Tumor Thrombosis (PVTT): a multicenter retrospective study. Biomedicines. 2024;12(9):2124. doi:10.3390/biomedicines12092124
54. Liu S, Liu K, Lv W, et al. The efficacy and prognostic factors of the combination of TACE and APATINIB FOR THE TREATMEnt of BCLC stage C hepatocellular carcinoma. Front Med Lausanne. 2021;8:774345. doi:10.3389/fmed.2021.774345
55. Li J, Xian L, Wang X, Liu Y, Li J. The role of TACE in the era of immune-targeted therapy for hepatocellular carcinoma: a meta-analysis based on PSM. Front Immunol. 2025;16:1573834. doi:10.3389/fimmu.2025.1573834
56. Huang Z, Wu Z, Zhang L, et al. The safety and efficacy of TACE combined with HAIC, PD-1 inhibitors, and tyrosine kinase inhibitors for unresectable hepatocellular carcinoma: a retrospective study. Front Oncol. 2024;14:1298122. doi:10.3389/fonc.2024.1298122
57. Wang Z, Zhang C, Yin J, Li N. Conversion therapy with TACE, TKIs, and ICIs for unresectable BCLC stage B and C hepatocellular carcinoma. Front Immunol. 2025;16:1451965. doi:10.3389/fimmu.2025.1451965
58. Ameli S, Shaghaghi M, Ghasabeh MA, et al. Does the change in volumetric functional MR metrics post-TACE predict histopathologic grading of hepatocellular carcinoma? Eur Radiol. 2020;30(12):6709–6720. doi:10.1007/s00330-020-07052-9
59. Mao X, Guo Y, Lu Z, et al. Enhanced CT textures derived from computer mathematic distribution analysis enables arterial enhancement fraction being an imaging biomarker option of hepatocellular carcinoma. Front Oncol. 2020;10:1337. doi:10.3389/fonc.2020.01337
60. Shaghaghi M, Aliyari Ghasabeh M, Ameli S, et al. Post-TACE changes in ADC histogram predict overall and transplant-free survival in patients with well-defined HCC: a retrospective cohort with up to 10 years follow-up. Eur Radiol. 2021;31(3):1378–1390. doi:10.1007/s00330-020-07237-2
61. Fu Q, Liu SL, Hao DP, et al. CT radiomics model for predicting the Ki-67 index of lung cancer: an exploratory study. Front Oncol. 2021;11:743490. doi:10.3389/fonc.2021.743490
62. Bleker J, Roest C, Yakar D, Huisman H, Kwee TC. The effect of image resampling on the performance of radiomics-based artificial intelligence in multicenter prostate MRI. J Magn Reson Imaging. 2024;59(5):1800–1806. doi:10.1002/jmri.28935
63. Gygi JP, Kleinstein SH, Guan L. Predictive overfitting in immunological applications: pitfalls and solutions. Hum Vaccin Immunother. 2023;19(2):2251830. doi:10.1080/21645515.2023.2251830
64. Combes B, Monteau L, Bannier E, et al. Measurement of magnetization transfer ratio (MTR) from cervical spinal cord: multicenter reproducibility and variability. J Magn Reson Imaging. 2019;49(6):1777–1785. doi:10.1002/jmri.26537
65. Fan Y, Yu Y, Wang X, Hu M, Hu C. Radiomic analysis of Gd-EOB-DTPA-enhanced MRI predicts Ki-67 expression in hepatocellular carcinoma. BMC Med Imaging. 2021;21(1):100. doi:10.1186/s12880-021-00633-0
 © 2026 The Author(s). This work is published and licensed by Dove Medical Press Limited. The
full terms of this license are available at https://www.dovepress.com/terms
and incorporate the Creative Commons Attribution
- Non Commercial (unported, 4.0) License.
By accessing the work you hereby accept the Terms. Non-commercial uses of the work are permitted
without any further permission from Dove Medical Press Limited, provided the work is properly
attributed. For permission for commercial use of this work, please see paragraphs 4.2 and 5 of our Terms.
© 2026 The Author(s). This work is published and licensed by Dove Medical Press Limited. The
full terms of this license are available at https://www.dovepress.com/terms
and incorporate the Creative Commons Attribution
- Non Commercial (unported, 4.0) License.
By accessing the work you hereby accept the Terms. Non-commercial uses of the work are permitted
without any further permission from Dove Medical Press Limited, provided the work is properly
attributed. For permission for commercial use of this work, please see paragraphs 4.2 and 5 of our Terms.
Recommended articles
Decaprenyl Diphosphate Synthase Subunit 1 (PDSS1): A Potential Prognostic Biomarker and Immunotherapy-Target for Hepatocellular Carcinoma
Yang Y, Li J, Tang M, Nie B, Huang W
Cancer Management and Research 2022, 14:1627-1639
Published Date: 3 May 2022
Prognosis of Primary Liver Cancer Based on LI-RADS Classification with Extracellular Agent-Enhanced MRI
Li Y, Ni X, Liu X, Yang C, Wang Y, Lu X, Zhou C
Journal of Hepatocellular Carcinoma 2023, 10:399-411
Published Date: 9 March 2023
Estimating Microvascular Invasion in Patients with Resectable Multinodular Hepatocellular Carcinoma by Using Preoperative Contrast-Enhanced MRI: Establishment and Validation of a Risk Score
Wu F, Sun H, Shi Z, Zhou C, Huang P, Xiao Y, Yang C, Zeng M
Journal of Hepatocellular Carcinoma 2023, 10:1143-1156
Published Date: 20 July 2023
Development and Validation of a Propionate Metabolism-Related Gene Signature for Prognostic Prediction of Hepatocellular Carcinoma
Xiao J, Wang J, Zhou C, Luo J
Journal of Hepatocellular Carcinoma 2023, 10:1673-1687
Published Date: 2 October 2023
Construction of a Prognostic Model for Hepatocellular Carcinoma Based on Macrophage Polarization-Related Genes
Chen H, Li J, Cao D, Tang H
Journal of Hepatocellular Carcinoma 2024, 11:857-878
Published Date: 11 May 2024