
Back to Journals » International Journal of Women's Health » Volume 18
Multiparametric MRI-Based Prediction Model for Sentinel Lymph Node Metastasis in Breast Cancer: Integrating Quantitative Imaging Parameters and Reproductive History
Authors Zhang Y, Wang Z, Li Z  , Yuan Z, Liu T, Hou H, Ye Z, Wang W, Zhang X
Received 7 March 2026
Accepted for publication 13 June 2026
Published 8 July 2026 Volume 2026:18 606005
DOI https://doi.org/10.2147/IJWH.S606005
Checked for plagiarism Yes
Review by Single anonymous peer review
Peer reviewer comments 2
Editor who approved publication: Dr Marta Barba
Yao Zhang, Zipei Wang, Zhichao Li, Ziwei Yuan, Tao Liu, Haohao Hou, Zhi Ye, Weibing Wang, Xiulan Zhang
Department of Radiology, Jingzhou No.1 People’s Hospital, The First Affiliated Hospital of Yangtze University, Jingzhou, Hubei, 434000, People’s Republic of China
*These authors contributed equally to this work
Correspondence: Xiulan Zhang, Department of Radiology, Jingzhou No.1 People’s Hospital, The First Affiliated Hospital of Yangtze University, Jingzhou, Hubei, 434000, People’s Republic of China, Email [email protected] Weibing Wang, Department of Radiology, Jingzhou No.1 People’s Hospital, The First Affiliated Hospital of Yangtze University, Jingzhou, Hubei, 434000, People’s Republic of China, Email [email protected]
Background: Sentinel lymph node metastasis (SLNM) status guides axillary staging and treatment planning in breast cancer, but conventional imaging has limited preoperative predictive accuracy.
Methods: This retrospective study included 125 consecutive women with pathologically confirmed invasive breast cancer who underwent preoperative multiparametric MRI and sentinel lymph node biopsy between January 2022 and December 2024. Candidate predictors were assessed by univariate analysis and selected with least absolute shrinkage and selection operator regression using 5-fold cross-validation. A multivariable logistic regression model was evaluated for discrimination, calibration, and clinical utility, with internal validation by 1000 bootstrap resamples.
Results: SLNM was present in 57 of 125 patients (45.6%). The final model retained ADC, T1 Map_post, T2* Map, and parity. The model showed excellent discrimination (AUC, 0.960; 95% CI, 0.927– 0.985), good calibration (Brier score, 0.082), and positive net clinical benefit across threshold probabilities of approximately 10%-80%. Bootstrap validation yielded an optimism-corrected AUC of 0.956.
Conclusion: A multiparametric MRI-based model incorporating ADC, T1 Map_post, T2* Map, and parity showed strong performance for preoperative SLNM prediction and may support individualized surgical planning after external validation.
Keywords: breast cancer, sentinel lymph node metastasis, multiparametric MRI, prediction model, reproductive history
Introduction
Breast cancer remains the most common malignancy among women worldwide, with lymph node status serving as a cornerstone of staging and treatment planning.1 Sentinel lymph node biopsy (SLNB) has become the standard of care for axillary staging in clinically node-negative breast cancer, offering a minimally invasive alternative to complete axillary lymph node dissection.2 However, the preoperative prediction of sentinel lymph node metastasis (SLNM) remains challenging, with conventional imaging modalities demonstrating limited accuracy.3 Accurate preoperative identification of SLNM could potentially guide surgical planning, inform decisions regarding neoadjuvant therapy, and improve patient counseling, yet current clinical tools lack sufficient predictive power to reliably stratify patients preoperatively.4
Several previous studies have attempted to predict SLNM using clinical factors, conventional MRI features, or radiomics approaches, with reported area under the curve (AUC) values ranging from 0.70 to 0.88.5–9 For instance, Baltzer et al developed a model combining conventional MRI features with diffusion-weighted imaging, achieving an AUC of 0.82 in a cohort of 152 patients.5 More recently, radiomics-based approaches have shown promise, with Liang et al reporting an AUC of 085 using features extracted from T2-weighted images and apparent diffusion coefficient (ADC) maps.6 However, these studies have primarily relied on conventional imaging parameters or extracted radiomics features, which may not fully capture the underlying tumor biology. Moreover, most existing models have focused exclusively on imaging characteristics, overlooking potentially informative clinical and reproductive factors that may influence metastatic behavior.10–12
The emergence of multiparametric quantitative MRI techniques, including T1 Map, T2* Map, and advanced diffusion imaging, offers new opportunities to characterize tumor microenvironment and predict metastatic potential.13,14 Unlike conventional qualitative MRI features, quantitative parameters provide objective, reproducible measurements that reflect distinct biological properties: ADC values correlate with tumor cellularity and tissue microstructure,15,16 T1 relaxation times after contrast enhancement reflect vascular permeability and extracellular volume fraction,17,18 and T2* mapping captures tissue oxygenation and hemorrhage.19,20 The integration of these complementary quantitative parameters may provide a more comprehensive assessment of tumor aggressiveness and metastatic potential than any single parameter alone.8,9,13 However, to our knowledge, no previous study has systematically evaluated the combined predictive value of T1 Map, T2* Map, and ADC for SLNM prediction, nor has any study incorporated reproductive history as a potential predictor despite emerging evidence suggesting reproductive factors may influence tumor biology and metastatic behavior.21,22
Therefore, we aimed to develop and internally validate a multiparametric MRI-based prediction model that integrates quantitative imaging parameters (ADC, T1 Map_post, T2* Map) with clinical factors, including reproductive history, for preoperative identification of SLNM in breast cancer patients. We hypothesized that: (1) the combination of multiple quantitative MRI parameters would provide superior predictive performance compared with single-parameter approaches; (2) reproductive factors, specifically parity, may serve as independent predictors of SLNM; and (3) a comprehensive model incorporating both imaging and clinical factors would achieve excellent discrimination and calibration suitable for clinical application.
Materials and Methods
Clinical Data
A total of 125 female patients with breast masses were retrospectively enrolled from the Department of Breast Surgery, Jingzhou First People’s Hospital (the First Affiliated Hospital of Yangtze University), between January 2022 and December 2024, with a mean age of 49.86 years (range: 28–74 years). The data collection time point was standardized as follows: for reproductive-aged female patients, data were collected approximately one week after the end of menstruation; for postmenopausal female patients, data could be collected at any time point. The data collection process, inclusion criteria, and exclusion criteria are illustrated in Figure 1. All patients had pathologically confirmed breast cancer and underwent sentinel lymph node biopsy or axillary pathological evaluation, providing definitive sentinel lymph node metastasis (SLNM) status. Among them, 57 cases had SLNM, and 68 cases had no metastasis. This study was approved by the Ethics Committee of the First Affiliated Hospital of Yangtze University, with the ethical approval number LL202280.
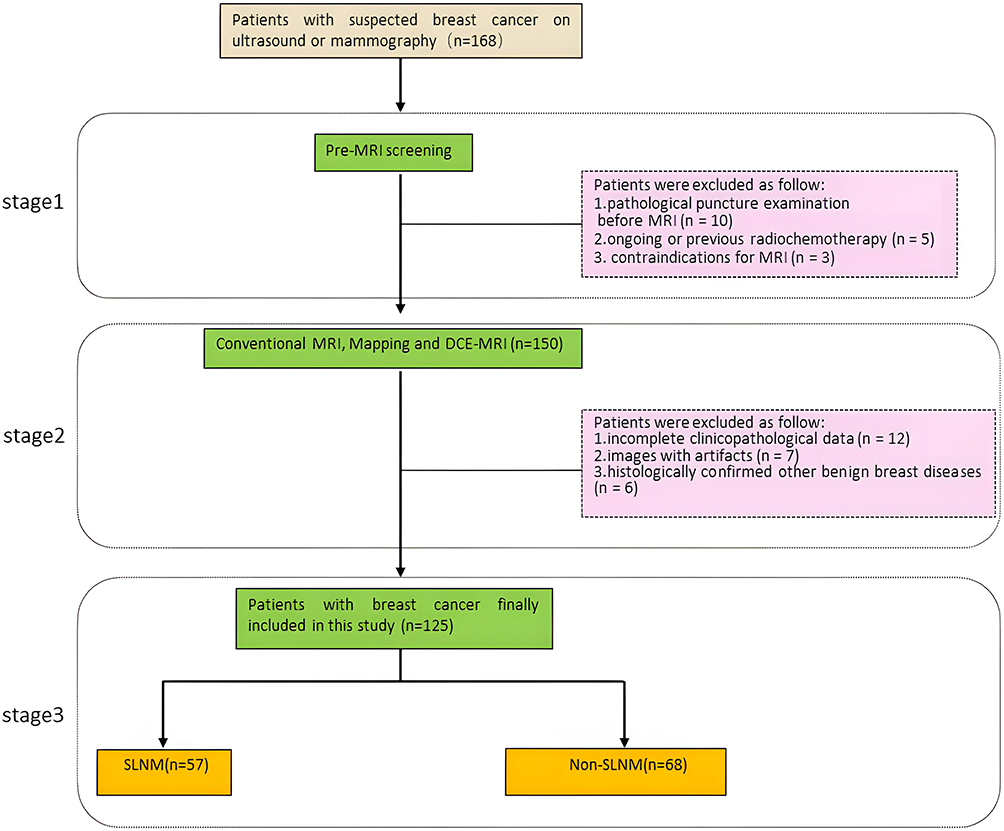 |
Figure 1 Process of experimental case collection. Patients were retrospectively enrolled between January 2022 and December 2024. |
MRI Scanning Methods and Parameters
A Siemens Skyra 3.0 T magnetic resonance (MR) scanner was used. The scanning sequences included conventional breast MRI sequences, as well as diffusion-weighted imaging (DWI), pre-contrast T1 mapping (T1 Map_pre), T2 mapping (T2 Map), T2* mapping (T2* Map), dynamic contrast-enhanced MRI (DCE-MRI), and post-contrast T1 mapping (T1 Map_post). Gadopentetate dimeglumine contrast agent (Gd-DTPA, Bayer Schering Pharma, Germany) was administered via a high-pressure injector through the left cubital vein at a rate of 3 mL/s, with a total dosage of 0.1 mmol/kg. The T1 Map_post was acquired at 9 minutes and 40 seconds after contrast enhancement. DWI was performed with three b-values: 0 s/mm2, 400 s/mm2, and 800 s/mm2.
The scanning modes adopted were as follows: variable-flip-angle short-TR three-dimensional spoiled gradient-echo (3D-VFA-SPGR) for T1 Map_pre and T1 Map_post; two-dimensional multi-echo spin-echo technique (2D-MC-SE) for T2 Map; and two-dimensional FLASH gradient-echo (2D-FLASH) for T2* Map. The scanning parameters of DWI, mapping sequences (T1 Map_pre, T1 Map_post, T2 Map, T2* Map), and DCE-MRI are summarized in Table 1.
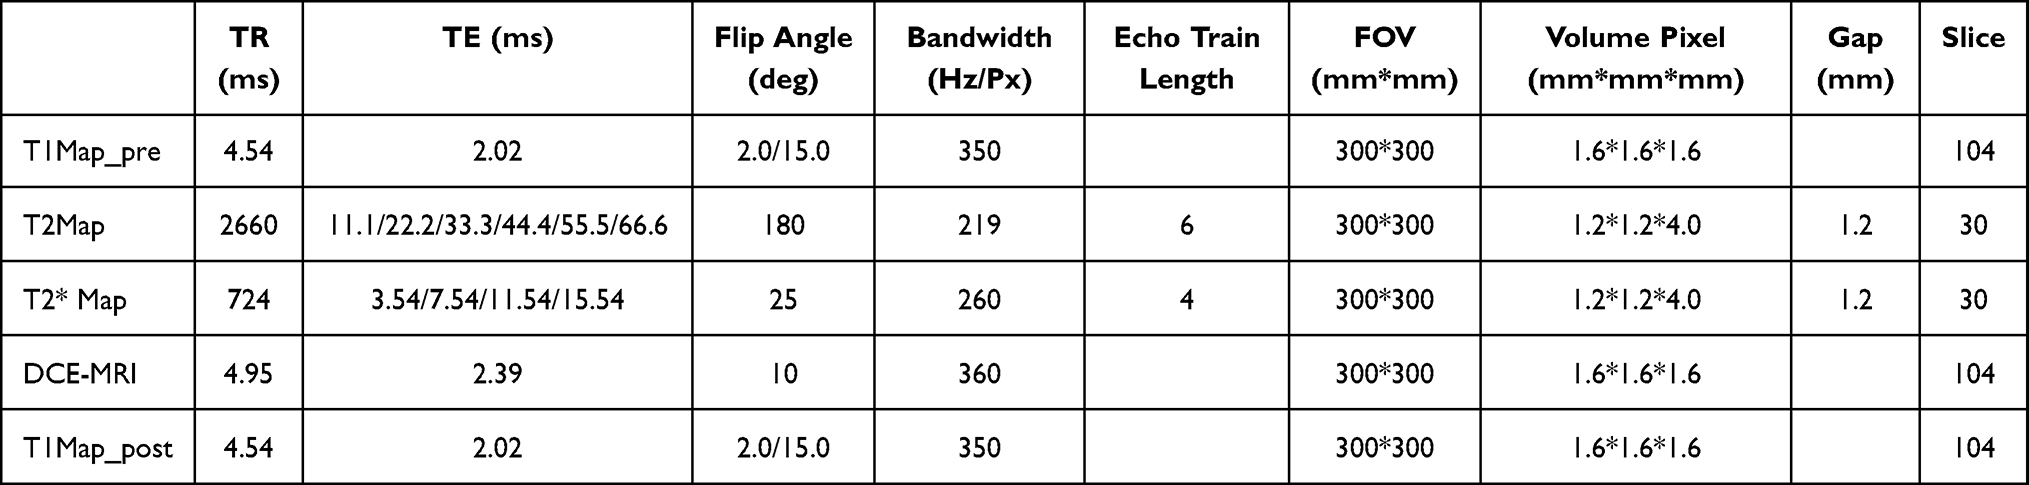 |
Table 1 Scanning Parameters of DWI, Mapping Sequences, and DCE-MRI |
Image Processing and Analysis
The post-processing platform was Siemens Syngo MR E11, with the following workflows:
T1 Map: 1. B1 field inhomogeneity correction: on-line Bloch-Siegert B1 map (6 s, same positioning as subsequent maps); 2. Application of MotionCor non-rigid registration to dual-flip-angle images; 3. Linearized Ernst equation: S/sin α = a·(S/tan α) + b; T1 = -TR/ln(a); 4. Optional noise floor offset (disabled in this study; phantom CV < 1.2%); 5. Output: T1 map (in ms). In this equation, S represents signal intensity, alpha is the flip angle, a is the fitted slope of the linearized Ernst equation, b is the intercept, and TR is repetition time.
T2 Map: 1. Application of MotionCor non-rigid registration across echo times (TE); 2. Monoexponential fitting: S(TE) = A·e^(-TE/T2) + n (noise floor n was set as the mean value of the region of interest [ROI] in air and fixed); 3. Output: T2 map (in ms). In this equation, A represents the fitted signal amplitude and S(TE) represents the measured signal intensity at each echo time.
T2* Map: 1. Combined channel combination (sum of squares); 2. Monoexponential fitting: S(TE) = A·e^(-TE/T2*) + n; 3. Truncation: discard voxels when the signal-to-noise ratio (SNR) of the last echo < 5 (< 2% of total voxels); 4. Output: T2* Map (in ms). CV refers to the coefficient of variation used to assess measurement repeatability.
DWI (ADC): 1. Image loading and registration; 2. Artifact and distortion correction; 3. Noise and threshold processing; 4. Voxel-wise fitting and ADC map generation; 5. ROI delineation on ADC maps, with the fitting model formula: S(b) = S0⋅e^(−b⋅ADC). In the diffusion equation, S(b) represents signal intensity at a given b value, S0 is the signal intensity when b = 0, and b is the diffusion weighting factor.
Principles of ROI Delineation
ROI delineation for ADC, T1 Map_pre, T2 Map, T2* Map, and T1 Map_post was based on axial DCE-MRI images. Selection of reference plane: On axial DCE-MRI images after contrast agent injection, the plane corresponding to the maximum cross-section of the tumor was selected for ROI delineation. Determination of time point: Based on the dynamic enhancement curve, the time point when tumor enhancement reached its peak (usually 60–120 seconds after injection) was prioritized. Delineation principles: 1. Delineate regions with the most obvious tumor enhancement; 2. Exclude obvious necrotic or cystic areas (if present); 3. Avoid including excessive normal glandular tissue to reduce partial volume effect; 4. Verify the representativeness of the selected plane using the time-signal intensity curve.
Confirmation of Longest Diameter and Short Axis
On dynamic contrast-enhanced MRI (DCE-MRI) images, the “solid component” of the mass was identified first. The reference plane of the maximum cross-section was located using multi-planar reconstruction (MPR). The Longest diameter (maximum linear distance in any orientation) was measured with the rotating caliper method, and then the short axis (maximum linear distance) was determined on the same plane, perpendicular to the Longest diameter.
ROI Value Measurement and Validation
To guarantee independence, two senior radiologists with over 5 years of clinical experience independently performed region of interest (ROI) delineation, measurement, and subsequent parameter extraction on all imaging sequences and metrics of the same patient, including ADC, T1 Map_pre, T2 Map, T2* Map, T1 Map_post, short axis, and long diameter. Each radiologist conducted three repeated measurements for each metric: the data from Radiologist A were labeled as a1, a2, and a3, while those from Radiologist B were labeled as b1, b2, and b3. To resolve discrepancies, if the difference between the measurement results of the two radiologists for the same metric exceeded 10%, a joint review of the images was conducted to determine a unified measurement value.
Furthermore, to ensure the consistency of ROI delineation and measurement between the two radiologists, a consistency test was performed: the measurement results of 50 randomly selected patients were analyzed. First, the average values were calculated using the formulas A = (a 1+a 2+a3)/3 and B = (b 1+b 2+b3)/3. Subsequently, a two-way random-effects model was adopted to assess the consistency between A and B by calculating the intraclass correlation coefficient for absolute agreement (ICC2,1).
The results showed that the ICC2,1 values for ADC, T1 Map_pre, T2 Map, T2* Map, T1 Map_post, short axis, and long diameter were 0.88, 0.98, 0.87, 0.86, 0.85, 0.86, and 0.84, respectively (all p<0.001). According to the criteria proposed by Cicchetti (1994), these results indicate “excellent” consistency between the two radiologists in terms of ROI delineation and measurement (see Figure 2 for the workflow of the ICC consistency test). Representative multiparametric MR images from a patient with SLNM positivity are shown in Figure 3. The between-group distributions of the significant clinical and MRI variables are presented in Figure 4.
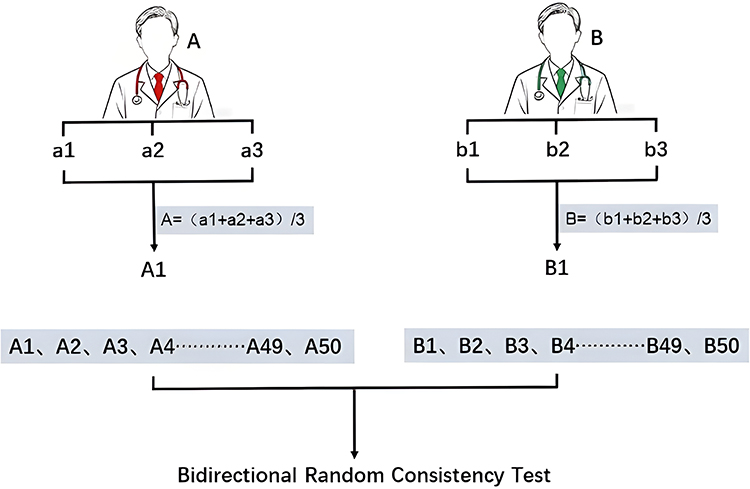 |
Figure 2 Two radiologists independently measured MRI parameters in triplicate (a1-a3 and b1-b3) for each patient. The average values (A and B) derived from these measurements were calculated for a cohort of 50 randomly selected patients. Consistency between the two observers was evaluated using an intraclass correlation coefficient. |
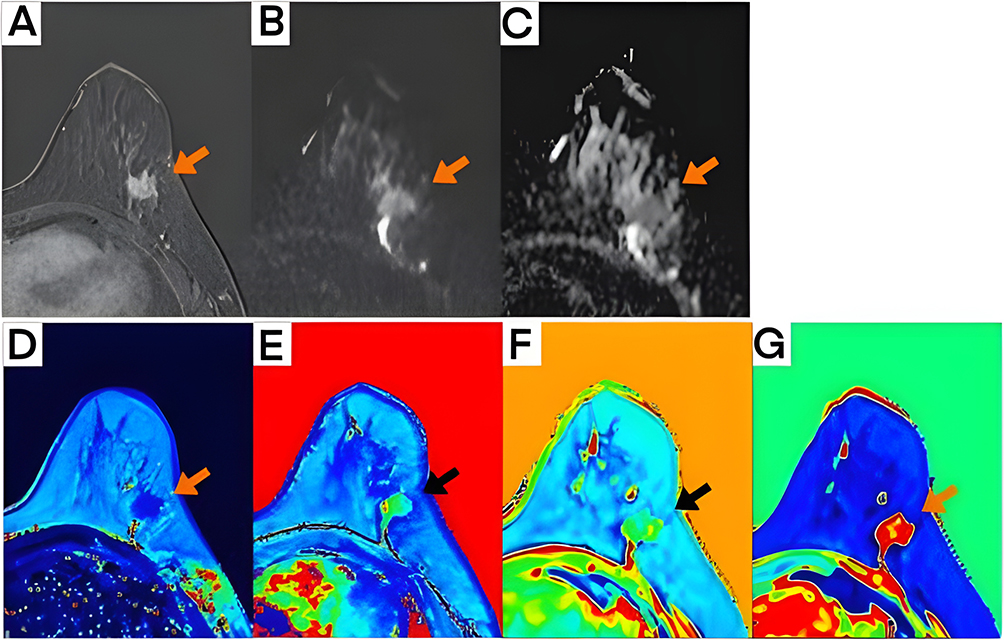 |
Figure 3 Representative images from a 54-year-old woman with non-specific invasive breast cancer in the upper outer quadrant of the left breast and SLNM positivity. Orange arrows indicate the primary tumor focus in panels (A–C) and (G), whereas black arrows indicate the corresponding lesion location in panels (D–F). (A) DCE-MRI; (B) DWI; (C) ADC; (D) T2 Map; (E) T2* Map; (F) T1 Map_post; (G) T1 Map_pre. |
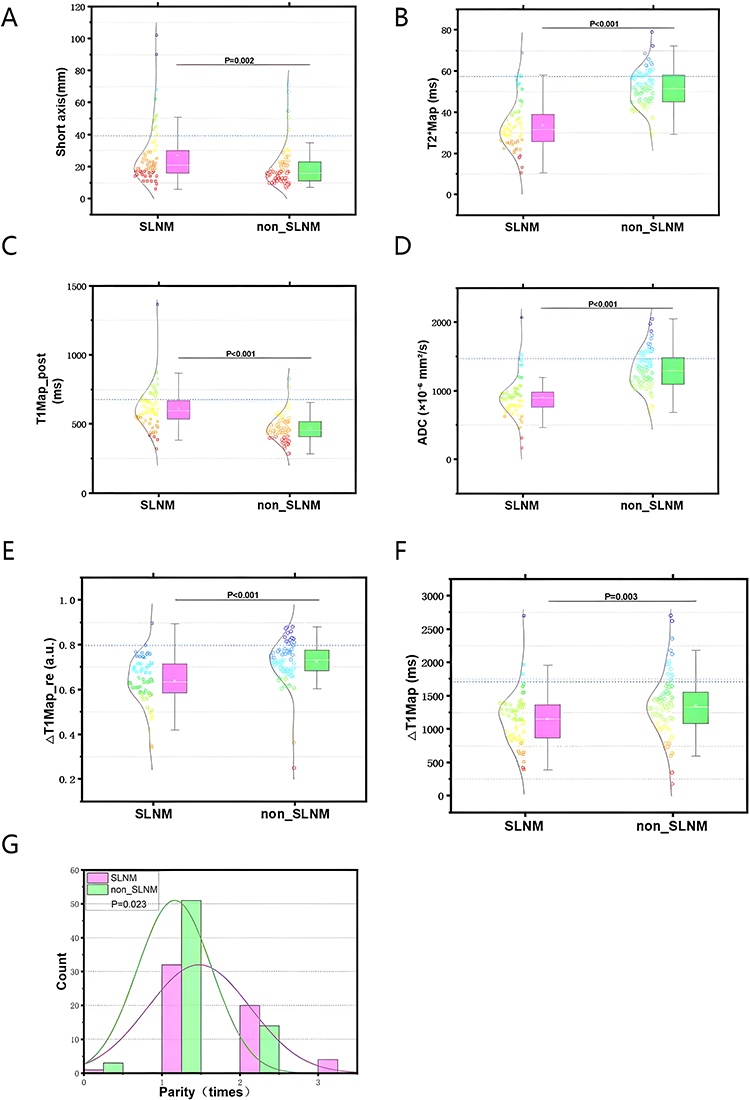 |
Figure 4 Comparison of significant clinical and MRI parameters between patients with and without sentinel lymph node metastasis (SLNM). (A–F) Raincloud plots combining box plots, jittered scatter plots, and density distributions for continuous variables. Pink/red indicates the SLNM-positive group and green/blue indicates the SLNM-negative group. (A) tumor short axis (P = 0.002); (B) T2* Map (P < 0.001); (C) T1 Map_post (P < 0.001); (D) ADC (P < 0.001); (E) Delta T1 Map_re (P < 0.001); (F) Delta T1 Map (P = 0.003). (G) histograms with fitted distribution curves showing parity distribution in both groups (P = 0.023). |
The calculation formulas for two derived indicators (ΔT1 Map and ΔT1 Map_re) are as follows: ΔT1 Map= (T1 Map_pre) - (T1 Map_post); ΔT1 Map_re =(T1 Map_pre−T1 Map_post)/ T1 Map_pre.
Statistical Analysis
Data analysis was executed using the Python programming environment (Version 3.11.5; Python Software Foundation). The visualization of results was accomplished using either Python or OriginPro 2024 (OriginLab Corporation, Northampton, MA, USA).
Sample Size Justification
An a priori power analysis was not undertaken given the exploratory nature of this investigation. With 57 events (sentinel lymph node metastasis) and five estimated model coefficients representing four predictor domains, the events-per-coefficient ratio was 11.4, meeting the minimum requirement for logistic regression modeling.
Univariate Analysis
Continuous variables were tested for normality using the Shapiro–Wilk test. Normally distributed variables are presented as mean ± standard deviation (SD) and compared using independent-samples t-test for equal variances (assessed by Levene test) or Welch t-test for unequal variances. Variables exhibiting non-normal distribution were summarized by their medians and interquartile ranges (IQR), with between-group comparisons conducted via the Mann–Whitney U-test. Categorical data were expressed as frequencies (percentages) and analyzed using the χ2-test; however, Fisher’s exact test was employed if expected cell counts fell below 5. To quantify the magnitude of differences, we calculated Cohen’s d for parametric tests, r for non-parametric assessments, and odds ratios (OR) with 95% confidence intervals (CI) for categorical associations.
Multivariate Analysis
We constructed ROC curves for continuous variables that showed significant associations (P <0.05) in the univariate analysis. Bootstrapping (1000 replications) was used to calculate the AUC and 95% CIs, with the Youden index identifying optimal cutoff points. Prior to modeling, we standardized continuous variables-specifically ADC, T1 Map_post, and T2* Map-using Z-scores (mean=0, SD=1) to eliminate scale discrepancies. A multivariable logistic regression model was then developed to identify independent predictors. Variable selection relied on the least absolute shrinkage and selection operator (LASSO) method with 5-fold cross-validation to minimize overfitting. For categorical variables, dummy coding was applied using the lowest category as the baseline. We evaluated multicollinearity using the variance inflation factor (VIF), accepting values below 10. Finally, model performance was validated through discrimination metrics (AUC, 95% CI), calibration measures (Brier score, calibration curves), and clinical utility assessment (decision curve analysis).
Model Validation and Clinical Application
To derive optimism-corrected performance metrics, internal validation was conducted via bootstrap resampling (1000 iterations). Furthermore, the final multivariate model was visualized as a nomogram to enable personalized risk assessment.
Statistical Testing
Statistical significance was defined as a two-sided P value <0.05. Data analyses were conducted using the Python environment (version 3.11.5; libraries: scikit-learn 1.3.0, statsmodels 0.14.0) and R software (version 4.3.1; R Foundation for Statistical Computing). Specific R packages employed included pROC (v 1.18.4), glmnet (v 4.1–8), and rms (v 6.7–1).
Result
Patient Characteristics and Univariate Analysis
This retrospective study analyzed 125 consecutive patients with histologically confirmed invasive breast cancer who were recruited between January 2022 and December 2024. All participants underwent preoperative multiparametric MRI followed by sentinel lymph node biopsy (SLNB). The cohort exhibited a median age of 50 years (IQR: 42–56) and a median body mass index (BMI) of 22.7 kg/m2 (IQR: 21.6–25.5). Based on pathological results, 57 patients (45.6%) were identified as SLNM-positive, while 68 (54.4%) were SLNM-negative.
Univariate analysis revealed that, compared to the non-metastatic group, patients with SLNM exhibited significantly larger tumor short-axis diameters (P=0.002) and elevated post-contrast T1 mapping values (P<0.001). Conversely, the SLNM-positive group demonstrated significantly reduced ADC values (median: 899.3 vs 1293.8 × 10−6 mm2/s; P<0.001) and lower T2* mapping values (P<0.001). Significant differences were also observed in ΔT1 Map and ΔT1 Map_re indices (P=0.003 and P<0.001, respectively). Regarding clinical factors, parity showed a significant association with nodal status (P=0.023), with notable differences in distribution among nulliparous women and those with one or two births. No other baseline characteristics differed significantly (Table 2). These between-group distributions are summarized in Figure 4.
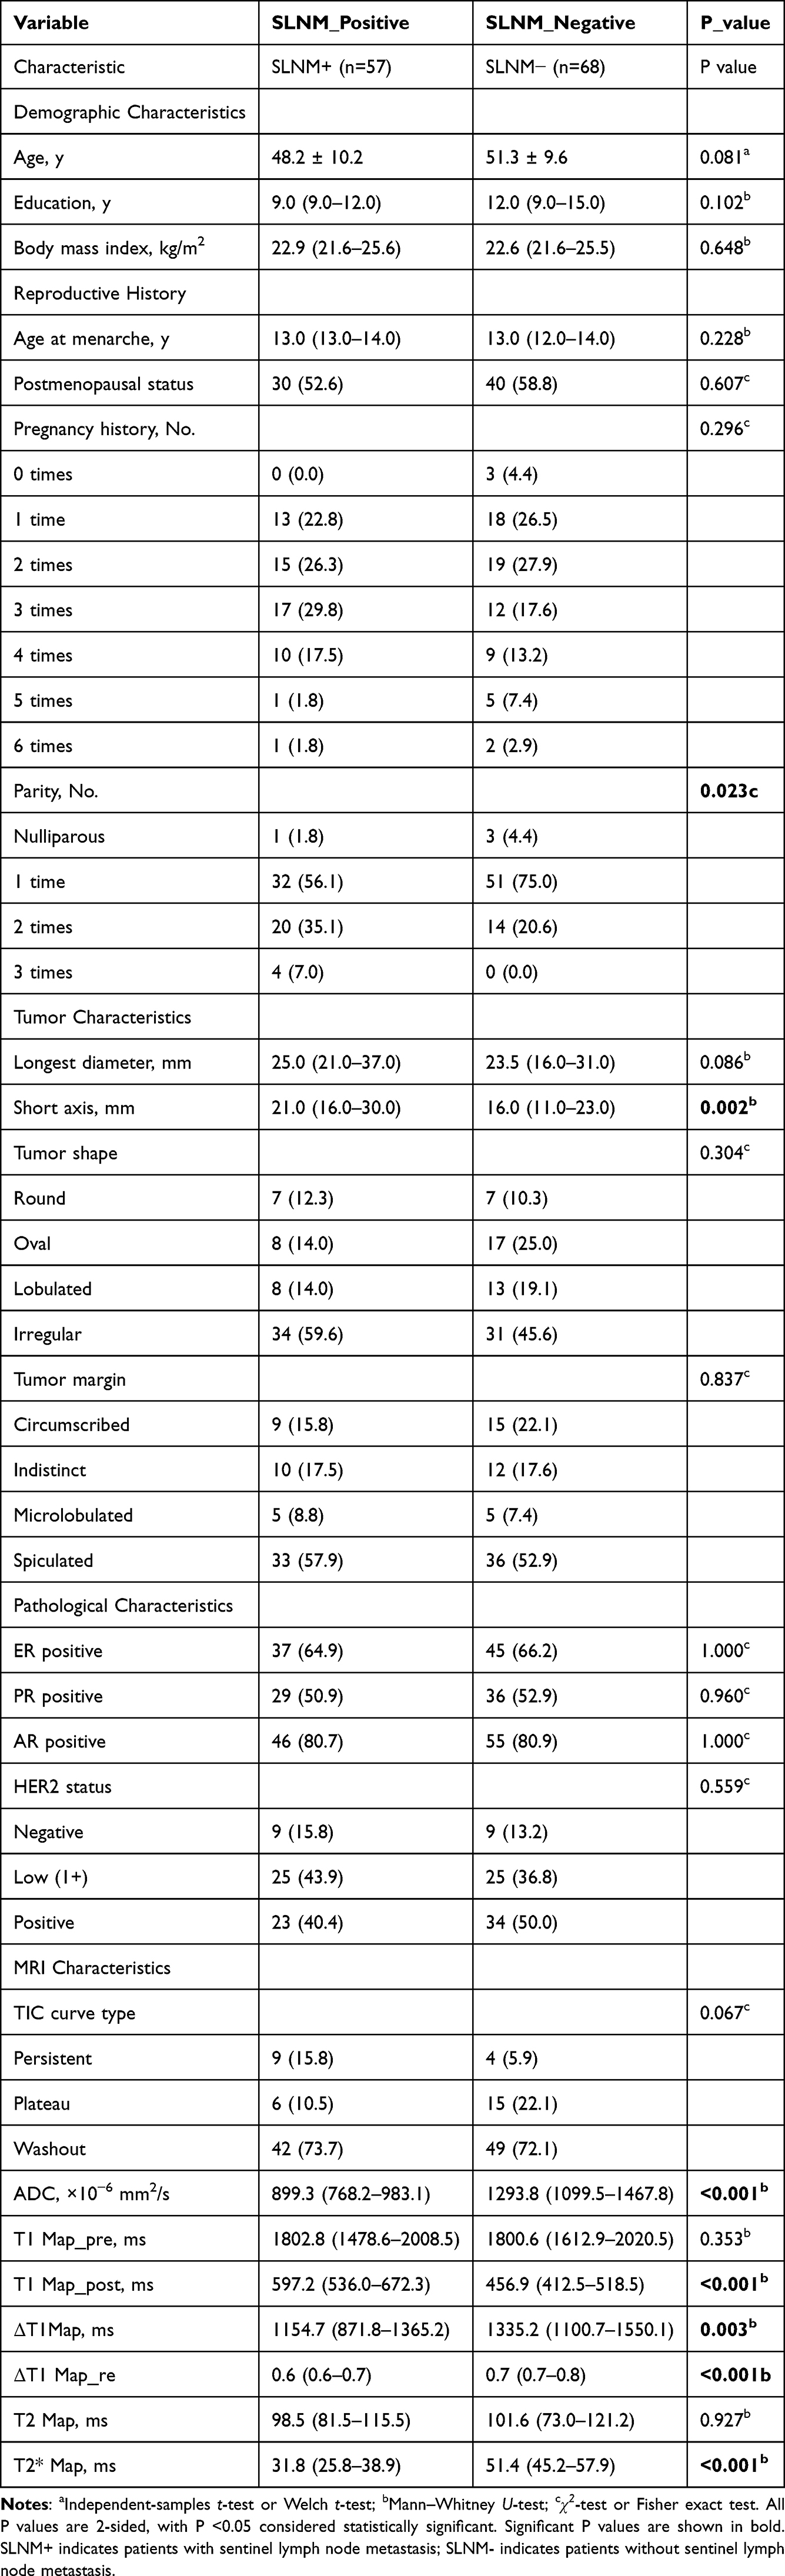 |
Table 2 Baseline Characteristics and Univariate Analysis of Patients with and without Sentinel Lymph Node Metastasis |
Univariate Predictive Performance
We assessed the individual predictive performance of the six significant continuous variables using ROC curve analysis. As illustrated in Figure 5A and D, T2* Map exhibited the superior discriminative capacity, achieving an area under the curve (AUC) of 0.879 (95% CI, 0.809–0.949). This was followed closely by ADC (AUC, 0.854; 95% CI, 0.779–0.918) and post-contrast T1 mapping (T1 Map_post; AUC, 0.814; 95% CI, 0.728–0.890). In contrast, the tumor short axis demonstrated only moderate diagnostic potential, with an AUC of 0.659 (95% CI, 0.567–0.752).
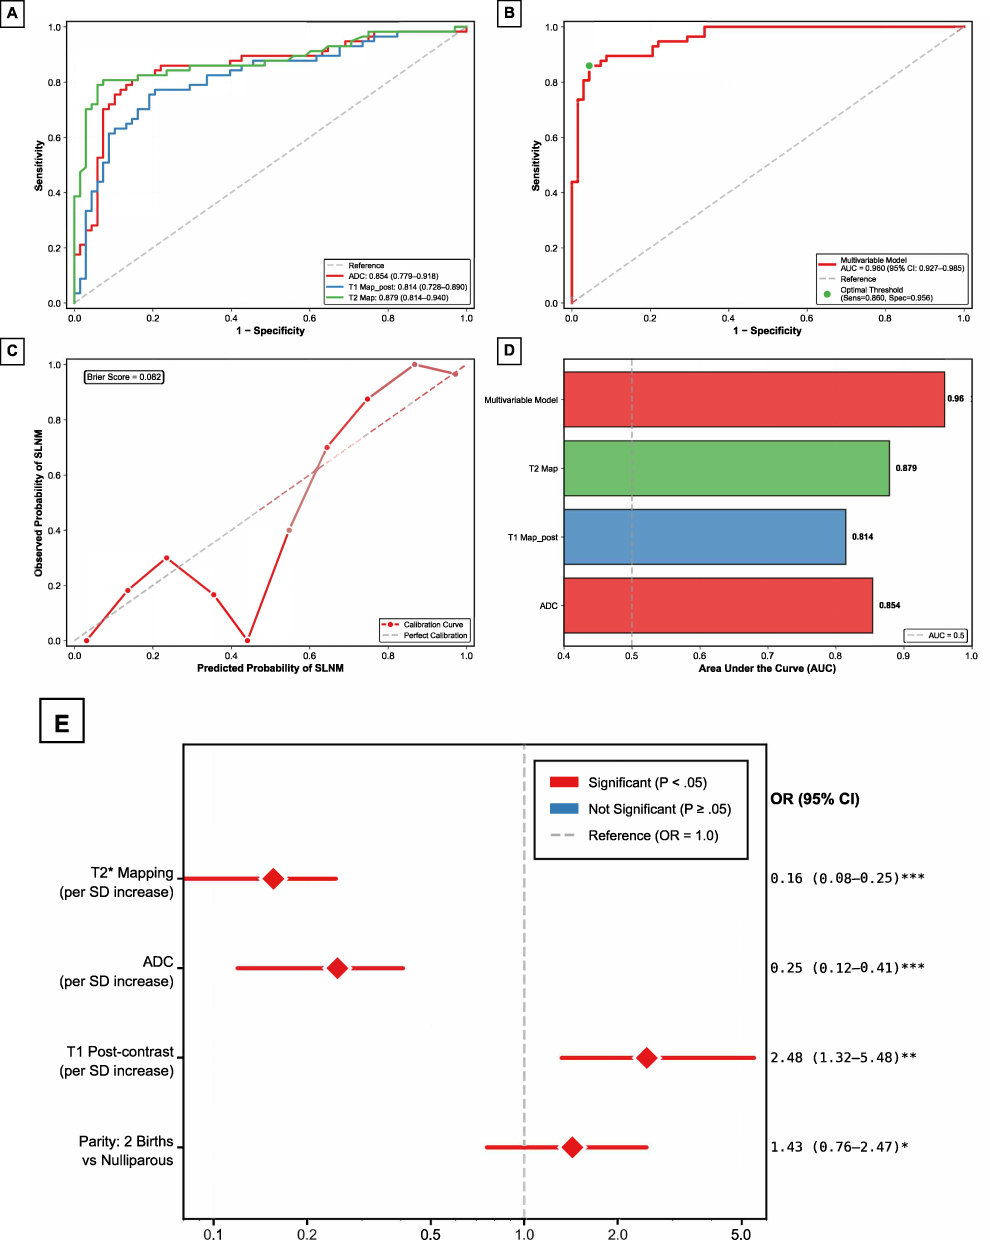 |
Figure 5 Performance evaluation and multivariable analysis of the prediction model. (A) ROC curves for individual MRI quantitative parameters. T2* Map (green) demonstrated the highest discriminative ability, followed by ADC (red) and T1 Map_post (blue). (B) ROC curve of the multivariable model, with AUC = 0.960 (95% CI, 0.927–0.985); the green point indicates the optimal threshold (sensitivity = 0.877, specificity = 0.956). (C) calibration curve of the multivariable model, with Brier score = 0.082. (D) comparison of AUC values for the multivariable model and individual MRI parameters. (E) forest plot of the multivariable logistic regression analysis. Red markers indicate statistically significant predictors. *P <0.05, **P <0.01, ***P <0.001. |
Multivariable Logistic Regression Analysis
To isolate robust predictors and mitigate the risk of overfitting, we implemented the Least Absolute Shrinkage and Selection Operator (LASSO) algorithm with 5-fold cross-validation on seven variables identified as significant in the univariate analysis, including tumor short axis, ADC, T1 Map_post, T2* Map, Delta T1 Map, Delta T1 Map_re, and parity. Delta T1 Map and Delta T1 Map_re were excluded to avoid mathematical redundancy and multicollinearity (variance inflation factors [VIF] of 5.6 and 8.8, respectively), and tumor short axis did not remain in the final prediction model after multivariable selection. The final model retained four predictor domains: ADC, T1 Map_post, T2* Map, and parity. In the final model, collinearity was negligible, with all VIF values remaining below 3.
Subsequent multivariable logistic regression identified four independent predictor domains for SLNM (Table 3). Specifically, ADC acted as a protective factor, where each standard deviation (SD) increase correlated with a 74% reduction in SLNM odds (OR, 0.26; 95% CI, 0.14–0.47; P <0.001). Similarly, T2* mapping showed the strongest protective effect, with a one-SD increase associated with an 85% decrease in odds (OR, 0.15; 95% CI, 0.09–0.27; P <0.001). Conversely, post-contrast T1 mapping was a significant risk factor (OR, 2.27; 95% CI, 1.26–4.08; P =0.006), implying a 127% increase in odds per SD elevation. Regarding reproductive history, parity showed a significant global effect (P =0.043); parity of 2 births significantly increased risk compared with nulliparity (OR, 1.84; 95% CI, 1.02–3.31; P =0.043), whereas parity of 1 birth was not statistically significant (P =0.137). The subgroup with 3 births was not assigned an independent coefficient because all four patients in this category were SLNM-positive, resulting in perfect separation.
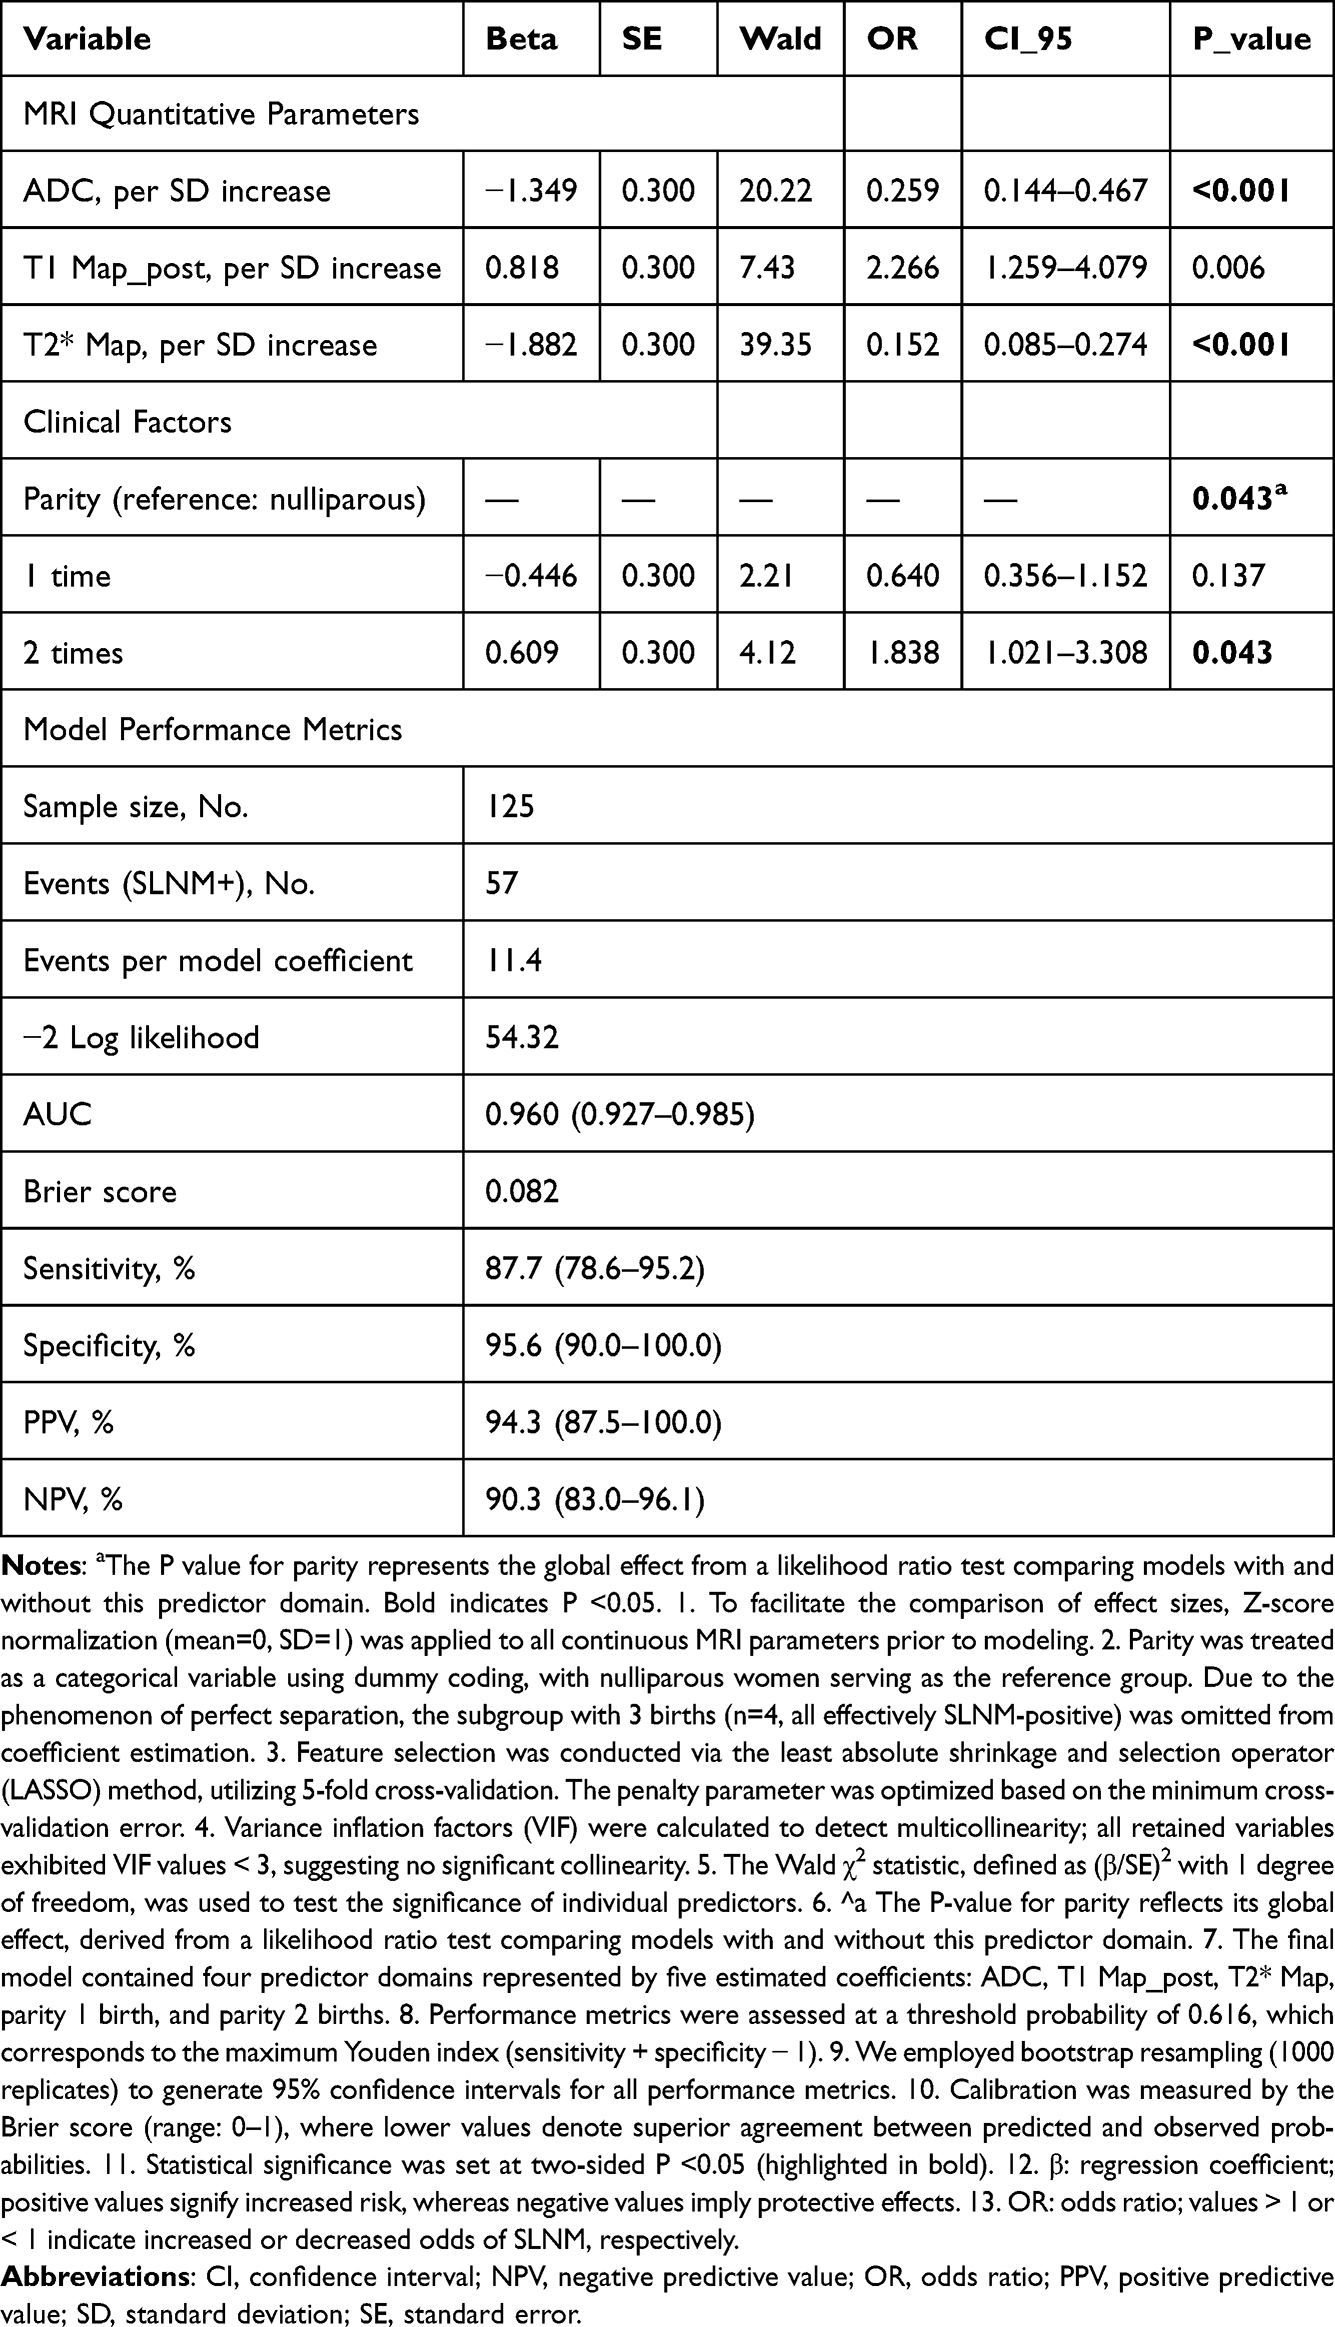 |
Table 3 Independent Predictors of Sentinel Lymph Node Metastasis in Multivariate Logistic Regression Analysis |
Model Performance and Validation
As illustrated in Figure 5B, the multivariable model exhibited robust discriminative ability, achieving an AUC of 0.960 (95% CI, 0.927–0.985). Based on the maximal Youden index, the optimal probability threshold was identified as 0.616. At this cutoff, the model attained a sensitivity of 87.7% and specificity of 95.6%, alongside positive and negative predictive values of 94.3% and 90.3%, respectively (Table 4). The diagnostic capability was further evidenced by a positive likelihood ratio of 19.88 and a diagnostic odds ratio of 154.8, indicating a strong overall predictive effect. Independent effects of the predictors in the multivariable logistic regression model are summarized in Figure 5E.
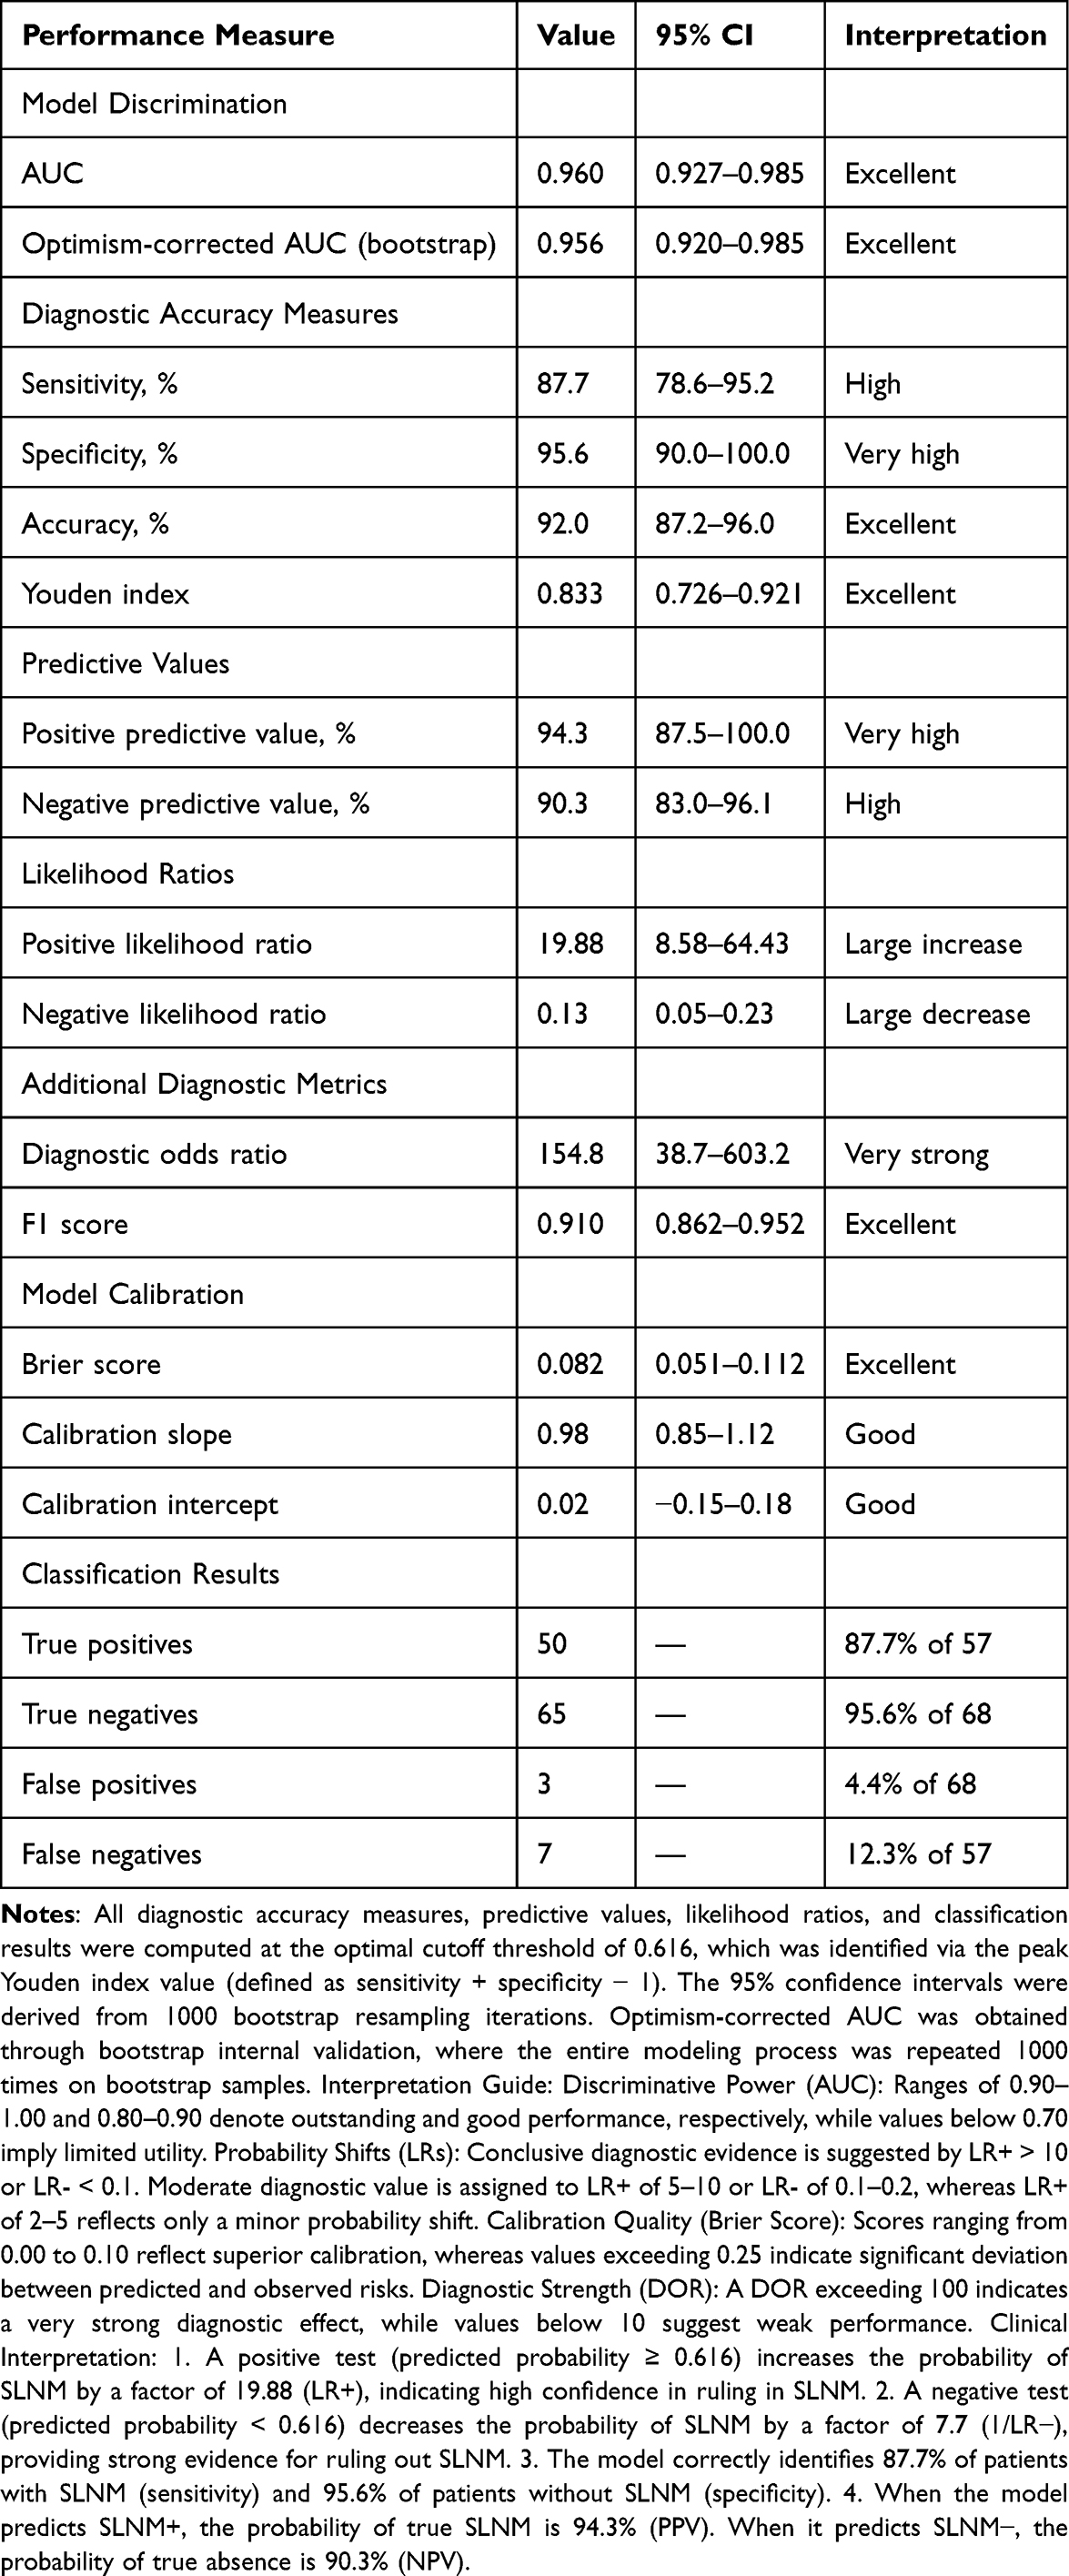 |
Table 4 Performance Characteristics of the Multivariate Prediction Model for Sentinel Lymph Node Metastasis |
Regarding calibration (Figure 5C), the model showed high agreement between predicted and observed risks, characterized by a low Brier score (0.082), a slope near unity (0.98), and a minimal intercept (0.02). Decision curve analysis (Figure 6B) confirmed clinical utility, showing a net benefit over default strategies across a broad probability range (10%-80%). Finally, internal validation using 1000 bootstrap resamples demonstrated model stability, yielding an optimism-corrected AUC of 0.956 and corrected sensitivity/specificity of 86.7% and 95.4%, respectively.
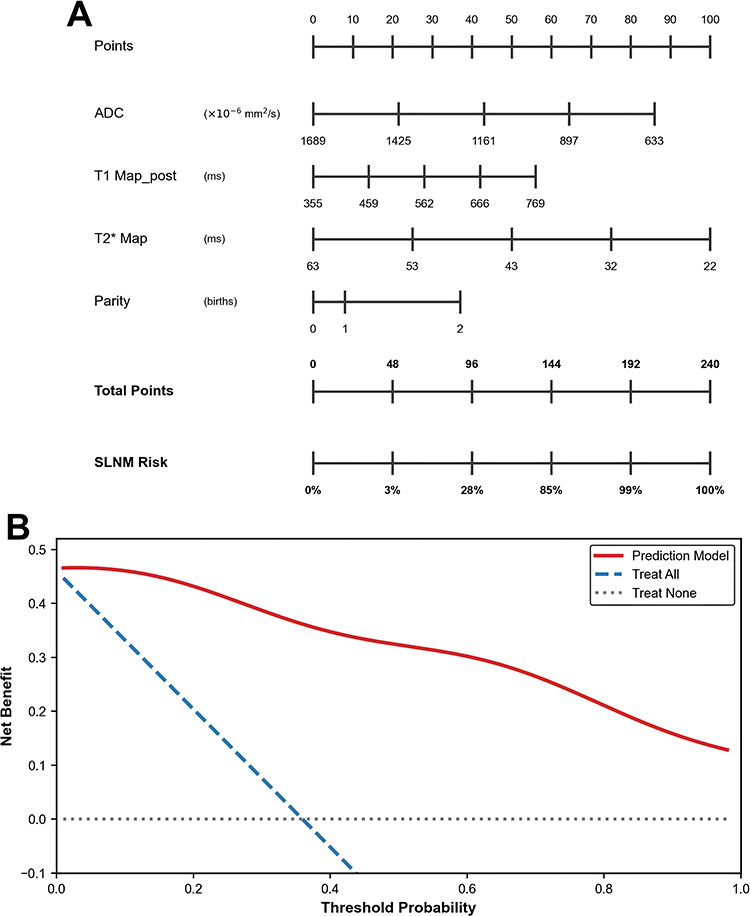 |
Figure 6 Clinical application tools for predicting sentinel lymph node metastasis (SLNM). (A) Nomogram for individualized risk assessment. The nomogram integrates ADC, T1 Map_post, T2* Map, and parity. Bold text in panel (A) denotes the nomogram axis headings used to assign points and read the predicted SLNM risk. Because the 3-birth subgroup had perfect separation and was omitted from coefficient estimation, the nomogram is intended for the estimable parity categories used in the final model. Total points are mapped to the SLNM risk axis to obtain the predicted probability of metastasis. (B) Decision curve analysis of the prediction model. The red line represents the net benefit of using the multiparametric MRI-based nomogram, while the blue dashed line and gray dotted line represent treat-all and treat-none strategies, respectively. The model demonstrates positive net benefit across threshold probabilities of approximately 10%-80%. |
Clinical Application Tool
A nomogram incorporating the 4 independent predictors was developed to facilitate individualized SLNM risk prediction in clinical practice (Figure 6A). The nomogram allows clinicians to calculate a patient’s probability of SLNM based on preoperative MRI parameters (ADC, T1 Map_post, T2* Map) and reproductive history (parity). For example, a patient with ADC of 897 x 10^-6 mm2/s, T1 Map_post of 666 ms, T2* Map of 32 ms, and parity of 2 births would have a total score of approximately 144 points, corresponding to an estimated SLNM probability of approximately 85%.
Discussion
The primary objective of this investigation was to construct and internally validate a comprehensive prediction tool for the preoperative stratification of sentinel lymph node metastasis (SLNM). By integrating three quantitative MRI metrics-specifically ADC, T1 Map_post, and T2* Map-with parity, the proposed model exhibited superior discriminative performance (AUC: 0.960; 95% CI: 0.927–0.985). The robustness of these results was confirmed via internal validation, yielding an optimism-corrected AUC of 0.956. A pivotal discovery of our study is the independent predictive value of reproductive history; specifically, individuals with a parity of two demonstrated an 84% increase in metastatic risk compared to nulliparous women (OR: 1.84; 95% CI: 1.02–3.31; P =0.043). To our knowledge, this represents a novel insight into the interplay between reproductive factors and lymphatic metastasis in breast cancer.
Comparison with Existing Literature. Prior research has explored MRI-based SLNM prediction, with reported diagnostic accuracies generally ranging from 0.70 to 0.88. For instance, Baltzer et al achieved an AUC of 0.82 in a 152-patient cohort by combining diffusion-weighted imaging with conventional MRI features, Liang et al reported an AUC of 0.85 using radiomics from T2-weighted imaging and ADC maps, and Liu et al improved prediction to an AUC of 0.88 by merging clinical variables with morphological MRI data. The higher performance of our model is likely related to the combined use of quantitative MRI markers and reproductive history, although external validation is still required.
First, the integration of multiple quantitative MRI parameters (T1, T2*and ADC) captures complementary aspects of tumor biology that cannot be fully represented by conventional qualitative features or single-parameter approaches. While most previous studies relied on conventional ADC measurements,5–7,23 our study incorporated T1 and T2* Map, which provide additional information about tumor microenvironment, vascularity, and tissue composition. Pinker et al13 demonstrated that multiparametric quantitative MRI could improve characterization of breast lesions, and our findings extend this concept to the prediction of nodal metastasis. The superior performance of our model may also reflect the rigorous LASSO variable selection approach that minimizes overfitting, a critical consideration given the relatively modest sample size compared with some previous studies.
Second, our model’s performance improvement may be partially explained by the inclusion of reproductive history, which has not been previously evaluated in SLNM prediction models. This represents a novel dimension of risk stratification that complements imaging-based assessment. The identification of parity as an independent predictor suggests that reproductive factors influence not only breast cancer development but also metastatic behavior, a finding that warrants further investigation.
To the best of our knowledge, this represents the inaugural investigation identifying parity as an independent prognostic factor for sentinel lymph node metastasis (SLNM) in breast carcinoma. Although the correlation between reproductive history and breast cancer susceptibility is well-documented,10,24 the specific interplay between parity and lymphatic dissemination has remained unexplored. Our results indicate that women with a history of two births exhibit a significantly elevated risk of SLNM (OR, 1.84; P =0.043), implying that reproductive factors may influence metastatic progression distinct from their impact on tumorigenesis.
Several biological mechanisms may explain this association, though definitive evidence is lacking and requires further investigation. First, repeated pregnancy-associated hormonal exposures, particularly elevated estrogen and progesterone levels, may promote tumor cell proliferation and lymphovascular invasion.11,25 Lyons et al12 demonstrated that pregnancy-associated breast cancer exhibits more aggressive biological features and higher rates of lymph node involvement, possibly due to pregnancy-induced immune modulation and angiogenic changes in the breast microenvironment. The hormonal milieu during pregnancy and lactation creates a pro-angiogenic and pro-inflammatory environment that may persist and influence subsequent tumor behavior, potentially facilitating lymphatic spread.26
Second, multiple lactation periods may alter breast lymphatic drainage patterns through repeated tissue remodeling.21 The extensive architectural changes that occur during pregnancy and lactation involve not only glandular tissue but also the supporting stroma and lymphatic network. These structural modifications may create pathways that facilitate tumor cell dissemination to sentinel lymph nodes, particularly in women who have experienced multiple cycles of tissue remodeling.22 Additionally, the mechanical and biochemical changes associated with repeated lactation may influence the expression of adhesion molecules and chemokines that guide tumor cell migration.27
Third, parity may be associated with specific molecular subtypes or gene expression profiles that predispose to lymphatic metastasis. Asztalos et al21 demonstrated distinct gene expression signatures in breast cancers diagnosed following pregnancy, with enrichment of pathways related to invasion and metastasis. Callihan et al22 reported that postpartum breast cancers exhibit higher rates of lymph node involvement and more aggressive histopathological features, suggesting that pregnancy-associated changes may create a permissive microenvironment for metastatic spread. The observation that parity of 2 births showed a significant association may reflect a complex dose-response relationship between cumulative reproductive exposure and metastatic potential. The 3-birth subgroup could not be estimated as an independent model coefficient because all four patients were SLNM-positive; therefore, this subgroup should be interpreted as a sparse-data limitation rather than evidence of no association.
The independent predictive value of ADC, T1 Map_post, and T2* Map likely reflects distinct biological properties of metastatic versus non-metastatic tumors, each parameter capturing a different aspect of tumor aggressiveness. Lower ADC values in SLNM+ patients (OR, 0.26) are consistent with higher tumor cellularity and restricted diffusion, features associated with more aggressive tumor biology.15,28 Research by Martincich et al16 indicated that decreased ADC values are associated with elevated histological grades and the presence of lymphovascular invasion. These findings substantiate the biological rationale for utilizing ADC as a prognostic marker for nodal involvement. The strong association we observed (r = 0.609 in univariate analysis) suggests that cellular density and tissue microstructure are fundamental determinants of metastatic potential, possibly reflecting increased cell-cell adhesion, reduced extracellular space, or altered membrane permeability that facilitates cell migration.29
Higher T1 values T1 Map_post in SLNM+ patients (OR, 2.27) may reflect increased tumor vascularity and capillary permeability, both hallmarks of aggressive tumors with metastatic potential.17,18 Post-contrast T1 relaxation metrics essentially serve as a surrogate for the accumulation of gadolinium within the extravascular-extracellular space (EES). This accumulation is physiologically modulated by the interplay of tissue perfusion, capillary permeability, and the fractional volume of the extracellular matrix. Tumors with high metastatic potential typically exhibit chaotic neovasculature with high permeability,29 leading to greater contrast accumulation and elevated T1 T1 Map_post values. This finding aligns with the well-established role of angiogenesis in metastasis, where leaky, immature vessels facilitate tumor cell intravasation and dissemination.29
Native T1 mainly reflects intrinsic tissue properties, whereas post-contrast T1 reflects vascular function and extracellular volume status. In our cohort, T1 Map_pre was not significantly associated with SLNM, while T1 Map_post retained strong predictive value, supporting the relevance of contrast-related vascular information for metastatic risk assessment.
Lower T2* values in SLNM+ patients (OR, 0.15) may be attributed to increased intratumoral iron deposition, hemorrhage, or deoxygenated hemoglobin in regions of hypoxia.19,20 Hypoxia is a well-recognized driver of metastasis through upregulation of hypoxia-inducible factors and promotion of epithelial- mesenchymal transition.20,30 Teruel et al31 demonstrated that T2* Map could identify regions of tumor hypoxia in breast cancer, supporting its potential as a biomarker of metastatic risk. The strong protective effect we observed (OR, 0.15) suggests that T2* Map may be particularly sensitive to the hypoxic microenvironment that characterizes aggressive, metastatic tumors.
The combination of these 3 MRI parameters provides complementary information: ADC reflects cellularity and microstructure, T1 Map_post reflects vascularity and perfusion, and T2* reflects oxygenation and hemorrhage. This multiparametric approach captures the multifaceted biology of metastatic breast cancer more comprehensively than any single parameter alone.
The established predictive tool offers significant utility in optimizing patient management and tailoring therapeutic strategies. Primarily, accurate preoperative stratification of SLNM risk is essential for guiding surgical extent, specifically in navigating the choice between sentinel lymph node biopsy (SLNB) and axillary lymph node dissection (ALND).32,33 This is particularly pertinent in the post-ACOSOG Z0011 era, where the necessity of ALND for limited nodal disease remains a subject of intense debate,32 highlighting the critical need for precise risk assessment tools. Clinically, the model’s robust specificity (95.6%) supports surgical de-escalation for patients with low predicted risk, potentially sparing them from extensive procedures. Conversely, its high sensitivity (87.7%) ensures that patients requiring comprehensive axillary evaluation are accurately identified.
Second, the model facilitates the selection of patients eligible for neoadjuvant systemic therapy, given that SLNM status serves as a pivotal determinant in therapeutic planning.32,34 Patients predicted to have high SLNM risk might be considered for neoadjuvant therapy to downstage axillary disease, potentially avoiding axillary dissection. Third, the nomogram (Figure 6A) provides a user-friendly tool for individualized risk assessment at the point of care, facilitating patient counseling and shared decision-making. The visual representation of risk factors and their relative contributions helps both clinicians and patients understand the basis for risk estimates, enhancing informed consent and treatment planning.
Decision curve analysis (Figure 6B) substantiated the model’s clinical value, showing a positive net benefit across a broad range of threshold probabilities (10%-80%). This wide interval underscores the model’s adaptability to various risk preferences. Specifically, at a 20% threshold, employing the model conferred a net gain of approximately 35 true detections per 100 patients relative to the “treat-none” strategy, while maintaining a negligible increase in the false-positive rate. This represents meaningful clinical value, as accurate preoperative SLNM prediction can reduce the need for two-stage surgical procedures and associated morbidity.33 The excellent calibration of our model (Brier score, 0.082; calibration slope, 0.98) indicates that predicted probabilities closely match observed frequencies, enhancing the reliability of risk estimates provided to individual patients. This is particularly important for clinical decision-making, where miscalibrated models may lead to inappropriate treatment choices.35
This study has several methodological strengths that enhance confidence in the findings. First, we employed LASSO regularization with cross-validation for variable selection, which is superior to traditional stepwise regression methods that are prone to instability and overfitting.36,37 The LASSO approach appropriately excluded mathematically dependent variables (ΔT1 and ΔT1 relative change, VIF > 5) while retaining the most informative predictors, demonstrating its ability to handle multicollinearity effectively. Second, we performed a thorough model evaluation covering discrimination (AUC), calibration (Brier score, slope, and intercept), and clinical utility (DCA), adhering to the methodological standards for prediction modeling.38,39 This tripartite assessment provides a more complete picture of model performance than discrimination alone.
Third, rigorous internal validation using bootstrap resampling with 1000 iterations provided optimism-corrected performance estimates, enhancing confidence in the model’s generalizability.38,40 The minimal optimism, with the AUC decreasing from 0.960 to 0.956, suggests that overfitting is well-controlled despite the relatively modest sample size. Fourth, we strictly followed the TRIPOD statement to ensure the transparency and completeness of our reporting.41 This rigorous approach is essential for facilitating study replication and supporting future external validation for clinical translation.
This study has several limitations that should be acknowledged. First, this was a single-center retrospective study, and external validation in independent cohorts from different institutions and geographic regions is needed to confirm the model’s generalizability.39 We are currently collaborating with other institutions to collect external validation data, which will be essential for establishing the model’s performance across diverse patient populations and imaging protocols. Second, the sample size of 125 patients, while yielding an acceptable events-per-model-coefficient ratio of 11.4, is relatively modest. Although LASSO regularization and bootstrap validation mitigated overfitting risk, larger prospective studies would provide more precise parameter estimates and allow evaluation of potential effect modifiers and nonlinear relationships.42
Third, the biological mechanisms underlying the association between parity and SLNM remain speculative and require further investigation through molecular profiling, immune microenvironment analysis, and lymphangiogenesis marker studies. Future research should explore whether parity-associated changes in gene expression, immune cell composition, or lymphatic architecture directly influence metastatic potential, or whether parity serves as a marker for other underlying biological factors. Fourth, while our model demonstrated excellent performance, it was developed in patients undergoing sentinel lymph node biopsy and may not be directly applicable to all breast cancer patients, particularly those with clinically node-positive disease or those receiving neoadjuvant therapy. The model’s performance in these subgroups requires separate evaluation.
Fifth, although inter-reader reliability was evaluated in 50 randomly selected patients and showed excellent agreement for all measured MRI parameters (ICC2,1 = 0.84–0.98), further multicenter reader-assessment studies are warranted to confirm reproducibility across institutions with varying MRI protocols and reader expertise. Sixth, our model included only preoperative variables and did not incorporate intraoperative findings or molecular biomarkers. Integration of additional predictors, such as circulating tumor cells, tumor-infiltrating lymphocytes, or genomic signatures,43,44 might further improve predictive performance and provide insights into the biological basis of metastasis.
Seventh, the relatively low prevalence of 3 births (n = 4) precluded robust analysis of this category, and larger studies are needed to fully characterize the dose-response relationship between parity and SLNM risk. Finally, we did not evaluate the model’s impact on clinical outcomes, surgical decision-making, or cost-effectiveness. Implementation studies assessing real-world utility and clinical impact are needed before widespread adoption.45
Future research should focus on several key areas: (1) prospective external validation in multicenter cohorts with diverse patient populations and imaging protocols; (2) investigation of biological mechanisms linking parity to lymphatic metastasis through molecular and immunological studies, including gene expression profiling, immune cell phenotyping, and lymphangiogenesis assessment; (3) evaluation of the model in diverse patient subgroups stratified by molecular subtypes, age, or menopausal status; (4) integration of additional biomarkers (eg, liquid biopsy, genomic classifiers, immune markers) to further enhance performance and provide mechanistic insights; and (5) prospective implementation trials to assess the model’s impact on clinical decision-making, patient outcomes, and healthcare economics.
Conclusions
In conclusion, this retrospective study developed and internally validated a multiparametric MRI-based prediction model for preoperative SLNM assessment in breast cancer. By integrating ADC, T1 Map_post, T2* Map, and parity, the model achieved strong discrimination, acceptable calibration, and positive decision-curve performance, supporting its potential use as an individualized preoperative risk-stratification tool. Because the study was single-center and internally validated, multicenter external validation is needed before routine clinical application.
Abbreviations
ADC, apparent diffusion coefficient; AUC, area under the receiver operating characteristic curve; CI, confidence interval; HER2, human epidermal growth factor receptor 2; IQR, interquartile range; MRI, magnetic resonance imaging; NPV, negative predictive value; OR, odds ratio; PPV, positive predictive value; SD, standard deviation; SE, standard error; SLNM, sentinel lymph node metastasis; TIC, time-intensity curve.
Data Sharing Statement
The experimental data used to support the findings of this study are available from the corresponding author, Xiulan Zhang, upon reasonable request.
Ethics Approval and Consent to Participate
All experimental protocols were approved by the Ethics Committee of the First Affiliated Hospital of Yangtze University (approval number: LL202280), which waived the requirement for written informed consent due to the retrospective nature of the study and the use of anonymized patient data. The study was conducted in accordance with the Declaration of Helsinki.
Funding
This work was funded by the Guidance Project of Jingzhou Municipal Science and Technology Bureau (2025HD138).
Disclosure
The authors declare that they have no conflicts of interest regarding this work.
References
1. Mao Q, Han H, Li L, et al. Tumor site, stage, and receptor-specific efficacy of radiation therapy in asian breast cancer patients aged 60 years and older: a SEER database survival analysis incorporating clinicopathological features and nomograms. Breast. 2025;82:104518. doi:10.1016/j.breast.2025.104518
2. Yermagambetova A, Makishev A, Imanbayev K. The role of sentinel lymph nodes in breast cancer. The current state of the problem. J Clin Med Kaz. 2017;2(44):15–20. doi:10.23950/1812-2892-JCMK-00444
3. Shahriarirad R, Meshkati Yazd SM, Fathian R, Fallahi M, Ghadiani Z, Nafissi N. Prediction of sentinel lymph node metastasis in breast cancer patients based on preoperative features: a deep machine learning approach. Sci Rep. 2024;14(1):1351. doi:10.1038/s41598-024-51244-y
4. Keelan S. Translational and clinical research identifies novel therapeutic targets and surgical advances in the modern management of breast cancer. 2025:7586564. doi:10.25419/RCSI.25039913.V1.
5. Baltzer A, Dietzel M, Kaiser CG, Baltzer PA. Combined reading of contrast enhanced and diffusion weighted magnetic resonance imaging by using a simple sum score. Eur Radiol. 2015;26(3):884–891. doi:10.1007/s00330-015-3886-x
6. Liang C, Cheng Z, Huang Y, et al. An MRI-based radiomics classifier for preoperative prediction of ki-67 status in breast cancer. Acad Radiol. 2018;25(9):1111–1117. doi:10.1016/j.acra.2018.01.006
7. Liu J, Sun D, Chen L, et al. Radiomics analysis of dynamic contrast-enhanced magnetic resonance imaging for the prediction of sentinel lymph node metastasis in breast cancer. Front Oncol. 2019;9:980. doi:10.3389/fonc.2019.00980
8. Chai R, Ma H, Xu M, et al. Differentiating axillary lymph node metastasis in invasive breast cancer patients: a comparison of radiomic signatures from multiparametric breast MR sequences. J Magn Reson Imag. 2019;50(4):1125–1132. doi:10.1002/jmri.26701
9. Dong Y, Feng Q, Yang W, et al. Preoperative prediction of sentinel lymph node metastasis in breast cancer based on radiomics of T2-weighted fat-suppression and diffusion-weighted MRI. Eur Radiol. 2017;28(2):582–591. doi:10.1007/s00330-017-5005-7
10. Collaborative Group on Hormonal Factors in Breast Cancer. Breast cancer and breastfeeding: collaborative reanalysis of individual data from 47 epidemiological studies in 30 countries, including 50 302 women with breast cancer and 96 973 women without the disease. Lancet. 2002;360(9328):187–195. doi:10.1016/s0140-6736(02)09454-0
11. Schedin P. Pregnancy-associated breast cancer and metastasis. Nat Rev Cancer. 2006;6(4):281–291. doi:10.1038/nrc1839
12. Lyons TR, Schedin PJ, Borges VF. Pregnancy and breast cancer: when they collide. J Mammary Gland Biol Neoplasia. 2009;14(2):87–98. doi:10.1007/s10911-009-9119-7
13. Pinker K, Chin J, Melsaether AN, Morris EA, Moy L. Precision medicine and radiogenomics in breast cancer: new approaches toward diagnosis and treatment. Radiology. 2018;287(3):732–747. doi:10.1148/radiol.2018172171
14. Iima M, Le Bihan D. Clinical intravoxel incoherent motion and diffusion MR imaging: past, present, and future. Radiology. 2016;278(1):13–32. doi:10.1148/radiol.2015150244
15. Surov A, Meyer HJ, Wienke A. Associations between apparent diffusion coefficient (ADC) and KI 67 in different tumors: a meta-analysis. Part 1: aDCmean. Oncotarget. 2017;8(43):75434–75444. doi:10.18632/oncotarget.20406
16. Martincich L, Deantoni V, Bertotto I, et al. Correlations between diffusion-weighted imaging and breast cancer biomarkers. Eur Radiol. 2012;22(7):1519–1528. doi:10.1007/s00330-012-2403-8
17. Jain RK. Normalization of tumor vasculature: an emerging concept in antiangiogenic therapy. Science. 2005;307(5706):58–62. doi:10.1126/science.1104819
18. Carmeliet P, Jain RK. Principles and mechanisms of vessel normalization for cancer and other angiogenic diseases. Nat Rev Drug Discov. 2011;10(6):417–427. doi:10.1038/nrd3455
19. Yablonskiy DA, Haacke EM. Theory of NMR signal behavior in magnetically inhomogeneous tissues: the static dephasing regime. Magnetic Resonance Med. 1994;32(6):749–763. doi:10.1002/mrm.1910320610
20. Vaupel P, Mayer A. Hypoxia in cancer: significance and impact on clinical outcome. Cancer Metastasis Rev. 2007;26(2):225–239. doi:10.1007/s10555-007-9055-1
21. Asztalos S, Pham TN, Gann PH, et al. High incidence of triple negative breast cancers following pregnancy and an associated gene expression signature. SpringerPlus. 2015;4(1). doi:10.1186/s40064-015-1512-7
22. Callihan EB, Gao D, Jindal S, et al. Postpartum diagnosis demonstrates a high risk for metastasis and merits an expanded definition of pregnancy-associated breast cancer. Breast Cancer Res Treat. 2013;138(2):549–559. doi:10.1007/s10549-013-2437-x
23. Fornasa F, Nesoti MV, Bovo C, Bonavina MG. Diffusion-weighted magnetic resonance imaging in the characterization of axillary lymph nodes in patients with breast cancer. J Magn Reson Imag. 2012;36(4):858–864. doi:10.1002/jmri.23706
24. Lambertini M, Santoro L, Del Mastro L, et al. Reproductive behaviors and risk of developing breast cancer according to tumor subtype: a systematic review and meta-analysis of epidemiological studies. Cancer Treat Rev. 2016;49:65–76. doi:10.1016/j.ctrv.2016.07.006
25. Borges VF, Schedin PJ. Pregnancy-associated breast cancer. Cancer. 2011;118(13):3226–3228. doi:10.1002/cncr.26643
26. Russo J, Russo IH. The role of the basal stem cell of the human breast in normal development and cancer. Adv Exp Med Biol. 2011;121–134. doi:10.1007/978-1-4614-0254-1_10
27. Fabiano ED, Poole JM, Reinhart-King CA. Mechanometabolism: recent findings on the intersection of cell adhesion, cell migration, and metabolism. Am J Physiol Cell Physiol. 2025;328(6):C1866–C1879. doi:10.1152/ajpcell.00892.2024
28. Kuroda. In vitro experimental study of the relationship between the apparent diffusion coefficient and changes in cellularity and cell morphology. Oncol Rep. 2009;22(03). doi:10.3892/or_00000484
29. Hanahan D, Weinberg RA. Hallmarks of cancer: the next generation. Cell. 2011;144(5):646–674. doi:10.1016/j.cell.2011.02.013
30. Semenza GL. Hypoxia-inducible factors in physiology and medicine. Cell. 2012;148(3):399–408. doi:10.1016/j.cell.2012.01.021
31. Teruel JR, Goa PE, Sjøbakk TE, Østlie A, Fjøsne HE, Bathen TF. A simplified approach to measure the effect of the microvasculature in diffusion-weighted MR imaging applied to breast tumors: preliminary results. Radiology. 2016;281(2):373–381. doi:10.1148/radiol.2016151630
32. Carlson RW, Anderson BO, Burstein HJ, et al. NCCN invasive breast cancer clinical practice guidelines in oncology. J National Compr Cancer Network. 2007;5(3):246. doi:10.6004/jnccn.2007.0025
33. Giuliano AE, Ballman KV, McCall L, et al. Effect of axillary dissection vs no axillary dissection on 10-year overall survival among women with invasive breast cancer and sentinel node metastasis. JAMA. 2017;318(10):918. doi:10.1001/jama.2017.11470
34. Kuehn T, Bauerfeind I, Fehm T, et al. Sentinel-lymph-node biopsy in patients with breast cancer before and after neoadjuvant chemotherapy (SENTINA): a prospective, multicentre cohort study. Lancet Oncol. 2013;14(7):609–618. doi:10.1016/s1470-2045(13)70166-9
35. Vickers AJ, Elkin EB. Decision curve analysis: a novel method for evaluating prediction models. Med Decis Mak. 2006;26(6):565–574. doi:10.1177/0272989x06295361
36. Tibshirani R. Regression shrinkage and selection via the lasso. J Royal Statis Soc Series B. 1996;58(1):267–288. doi:10.1111/j.2517-6161.1996.tb02080.x
37. Steyerberg EW, Vickers AJ, Cook NR, et al. Assessing the performance of prediction models. Epidemiology. 2010;21(1):128–138. doi:10.1097/ede.0b013e3181c30fb2
38. Altman DG, Vergouwe Y, Royston P, Moons KGM. Prognosis and prognostic research: validating a prognostic model. BMJ. 2009;338(may28 1):b605–b605. doi:10.1136/bmj.b605
39. Moons KGM, Altman DG, Vergouwe Y, Royston P. Prognosis and prognostic research: application and impact of prognostic models in clinical practice. BMJ. 2009;338(jun04 2):b606–b606. doi:10.1136/bmj.b606
40. Steyerberg EW, Harrell FE, Borsboom GJJM, Eijkemans MJC, Vergouwe Y, Habbema JDF. Internal validation of predictive models. J Clin Epidemiol. 2001;54(8):774–781. doi:10.1016/s0895-4356(01)00341-9
41. Collins GS, Reitsma JB, Altman DG, Moons KGM. Transparent reporting of a multivariable prediction model for individual prognosis or diagnosis (TRIPOD): the TRIPOD statement. BMJ. 2015;350(jan07 4):g7594–g7594. doi:10.1136/bmj.g7594
42. Peduzzi P, Concato J, Kemper E, Holford TR, Feinstein AR. A simulation study of the number of events per variable in logistic regression analysis. J Clin Epidemiol. 1996;49(12):1373–1379. doi:10.1016/s0895-4356(96)00236-3
43. Wang Z, Liu W, Chen C, Yang X, Luo Y, Zhang B. Low mutation and neoantigen burden and fewer effector tumor infiltrating lymphocytes correlate with breast cancer metastasization to lymph nodes. Sci Rep. 2019;9(1):253. doi:10.1038/s41598-018-36319-x
44. Salgado R, Denkert C, Demaria S, et al. The evaluation of tumor-infiltrating lymphocytes (TILs) in breast cancer: recommendations by an international TILs working group 2014. Ann Oncol. 2015;26(2):259–271. doi:10.1093/annonc/mdu450
45. Candido Dos Reis FJ, Wishart GC, Dicks EM, et al. An updated PREDICT breast cancer prognostication and treatment benefit prediction model with independent validation. Breast Cancer Res. 2017;19(1). doi:10.1186/s13058-017-0852-3
 © 2026 The Author(s). This work is published and licensed by Dove Medical Press Limited. The
full terms of this license are available at https://www.dovepress.com/terms
and incorporate the Creative Commons Attribution
- Non Commercial (unported, 4.0) License.
By accessing the work you hereby accept the Terms. Non-commercial uses of the work are permitted
without any further permission from Dove Medical Press Limited, provided the work is properly
attributed. For permission for commercial use of this work, please see paragraphs 4.2 and 5 of our Terms.
© 2026 The Author(s). This work is published and licensed by Dove Medical Press Limited. The
full terms of this license are available at https://www.dovepress.com/terms
and incorporate the Creative Commons Attribution
- Non Commercial (unported, 4.0) License.
By accessing the work you hereby accept the Terms. Non-commercial uses of the work are permitted
without any further permission from Dove Medical Press Limited, provided the work is properly
attributed. For permission for commercial use of this work, please see paragraphs 4.2 and 5 of our Terms.
Recommended articles

Validation of a Disease-Free Survival Prediction Model Using UBE2C and Clinical Indicators in Breast Cancer Patients
Shen J, Yan H, Yang C, Lin H, Li F, Zhou J
Breast Cancer: Targets and Therapy 2023, 15:295-310
Published Date: 25 April 2023
ABVS-Based Radiomics for Early Predicting the Efficacy of Neoadjuvant Chemotherapy in Patients with Breast Cancers
Jiang W, Deng X, Zhu T, Fang J, Li J
Breast Cancer: Targets and Therapy 2023, 15:625-636
Published Date: 15 August 2023
The Clinical Study of Intratumoral and Peritumoral Radiomics Based on DCE-MRI for HER-2 Positive and Low Expression Prediction in Breast Cancer
Shang Y, Wang Y, Guo Y, Li S, Liao J, Hai M, Wang M, Tan H
Breast Cancer: Targets and Therapy 2024, 16:957-972
Published Date: 14 December 2024
Development and Validation of a Predictive Model for Anxiety Trajectories in Patients with Breast Cancer: A Retrospective Study
Li X, Wei BK, Li F, Yan HH, Shen J
Psychology Research and Behavior Management 2025, 18:315-329
Published Date: 15 February 2025
Interpretable Dynamic MRI-ITH Model for Predicting Neoadjuvant Chemotherapy Response in Breast Cancer: A Multicenter Study
Wang M, Liu X, Ding W, Xu K, Feng J, Lyu D
Journal of Multidisciplinary Healthcare 2026, 19:616424
Published Date: 3 July 2026