Back to Journals » Journal of Inflammation Research » Volume 18
Modified Naples Prognostic Score for Postoperative Prognostic Stratification in Patients with Oral Squamous Cell Carcinoma
Authors Ran J, Liu Y, Yi X, Zhang F
Received 10 June 2025
Accepted for publication 30 July 2025
Published 24 August 2025 Volume 2025:18 Pages 11593—11610
DOI https://doi.org/10.2147/JIR.S537870
Checked for plagiarism Yes
Review by Single anonymous peer review
Peer reviewer comments 2
Editor who approved publication: Dr Junhao Wang
Jingyi Ran, Yalian Liu, Xiaoxi Yi, Fujun Zhang
Department of Oral and Maxillofacial Surgery, The First Affiliated Hospital of Chongqing Medical University, Chongqing, People’s Republic of China
Correspondence: Fujun Zhang, Department of Oral and Maxillofacial Surgery, The First Affiliated Hospital of Chongqing Medical University, Chongqing, 400016, People’s Republic of China, Email [email protected]
Background: The Naples Prognostic Score (NPS) is a composite index that combines serum albumin (ALB), total cholesterol (TC), neutrophil-to-lymphocyte ratio (NLR), and lymphocyte-to-monocyte ratio (LMR). It has proven prognostic value across various cancers. However, its use in oral squamous cell carcinoma (OSCC) has not been sufficiently recognized for disease-specific characteristics. This study aimed to create and validate a modified NPS (mNPS) specifically for OSCC, comparing its prognostic effectiveness to that of the conventional NPS and other established indices.
Methods: A total of 479 patients with histologically confirmed OSCC who underwent curative-intent surgery between 2012 and 2019 were enrolled. Patients were randomly assigned to development (n=335) and validation (n=144) cohorts. Cohort-specific optimal cut-off values for ALB, TC, NLR, and LMR were determined using X-Tile software to construct the mNPS. Prognostic performance of mNPS was compared with conventional NPS, SII, SIRI, and CONUT using ROC analysis, C-index, and Cox regression. A nomogram incorporating mNPS and other independent risk factors was constructed and validated.
Results: Multivariate Cox regression confirmed mNPS as an independent predictor of OS (Group 1: HR 2.18; Group 2: HR 3.10; P< 0.01). The mNPS-based nomogram showed superior prognostic accuracy for 1-, 3-, and 5-year OS with AUCs of 0.83, 0.80, and 0.83 in the development cohort, and 0.80, 0.79, and 0.82 in the validation cohort. Corresponding C-index values were 0.73 (OS), 0.72 (DFS), and 0.73 (DSS) in the development cohort, and 0.74, 0.71, and 0.76 in the validation cohort, all outperforming the NPS-based model. Calibration and decision curve analyses confirmed the model’s robustness and clinical utility.
Conclusion: Through OSCC-specific threshold recalibration, mNPS demonstrated improved prognostic discrimination compared with conventional indices. Incorporating mNPS into a nomogram enhances individualized risk stratification and provides a practical tool for guiding clinical decision-making in OSCC.
Keywords: oral squamous cell carcinoma, modified Naples prognostic score, overall survival, nomogram, risk stratification
Introduction
Oral squamous cell carcinoma (OSCC), accounting for approximately 90% of oral malignancies, represents the predominant neoplasm of the head and neck region, with a notably higher incidence in Southeast Asia.1 Despite advances in surgical and chemotherapeutic modalities, long-term outcomes remain suboptimal, with a 5-year survival rate of approximately 41%, imposing substantial societal and familial burdens.2,3 Accordingly, early identification of patients at elevated risk for poor prognosis is essential to inform individualized, multidisciplinary treatment strategies, wherein the investigation of prognostic biomarkers holds growing clinical relevance.4
The initiation and progression of OSCC are intricately associated with immune dysfunction, chronic inflammation, and nutritional compromise,5–7 prompting increasing interest in composite prognostic indices incorporating immune, inflammatory, and nutritional parameters.8 Among these, preoperative peripheral blood markers have demonstrated consistent prognostic utility across multiple malignancies.9,10 The Naples Prognostic Score (NPS) is a composite index based on serum albumin, total cholesterol, neutrophil-to-lymphocyte ratio, and lymphocyte-to-monocyte ratio. It was first introduced by Galizia et al as an independent prognostic factor in colorectal cancer,11 and has since been validated in several other malignancies, including esophageal, cholangiocarcinoma, hepatocellular, and lung cancers.12–15
Nevertheless, the conventional NPS has been applied across heterogeneous tumor types, including OSCC, without accounting for disease-specific biological variability.16 Accumulating evidence suggests that tumor-adapted threshold modifications enhance the prognostic discrimination of NPS-derived models.17,18 In this context, we developed and validated a modified NPS (mNPS) calibrated to an OSCC-specific cohort, aiming to refine risk stratification and improve predictive performance within this population.
Materials and Methods
Patient Cohort and Follow-Up
This retrospective cohort study included patients with histopathologically confirmed OSCC who underwent radical surgical resection with curative intent at the First Affiliated Hospital of Chongqing Medical University between January 2012 and September 2019. (Figure 1). Inclusion criteria were as follows: (1) newly diagnosed, primary OSCC without prior treatment; (2) completion of curative-intent surgical resection; (3) availability of comprehensive pathological documentation; and (4) availability of complete preoperative laboratory data and follow-up records. Exclusion criteria included: (1) receipt of any treatment prior to surgery; (2) presence of distant metastases at initial diagnosis; (3) diagnosis of multiple primary malignancies; (4) incomplete clinical, pathological, or laboratory data; and (5) a history of immune system or hematologic disorders. Follow-up assessments were conducted via outpatient visits or structured telephone interviews, employing standardized questionnaires to record survival status, disease recurrence, and treatment modifications. Follow-up frequency was scheduled as once every three months during the first two years postoperatively, every six months from years three to five, and annually thereafter. Deaths were confirmed using hospital records, interviews with family members, or official death registries. Overall survival (OS) was defined as the interval from surgery to death from any cause; disease-free survival (DFS) as the time from surgery to the first occurrence of local recurrence, regional or distant metastasis, or death from any cause; and disease-specific survival (DSS) as the duration from surgery to death directly attributable to OSCC. Follow-up data were censored as of September 30, 2024. The study protocol received approval from the Institutional Review Board of the First Affiliated Hospital of Chongqing Medical University (Approval No. 2024–496-01) and was conducted in accordance with the Declaration of Helsinki.
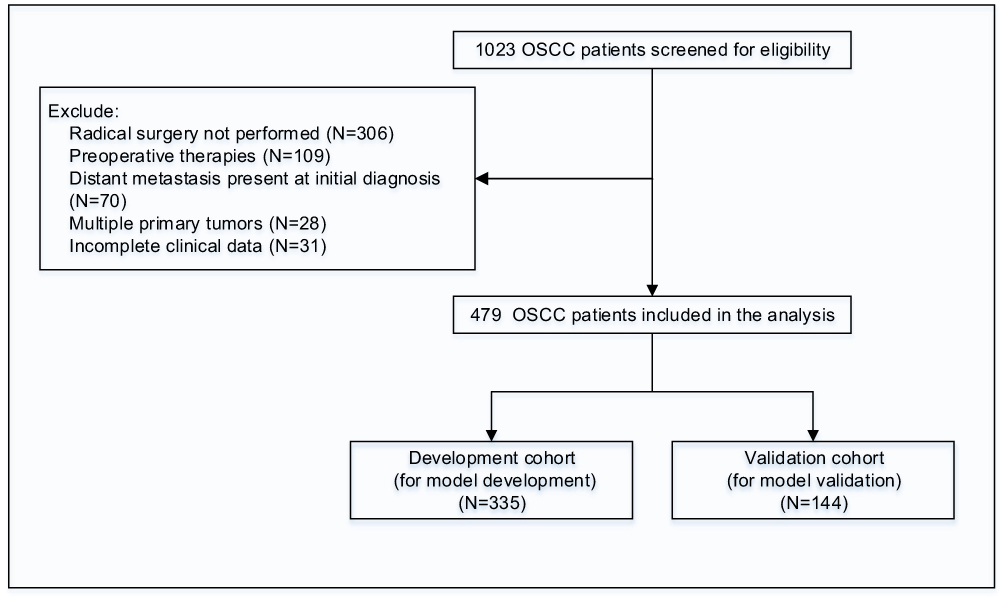 |
Figure 1 Study Design and Patient Selection Flowchart. |
Data Collection
Clinicopathological and laboratory data were retrospectively extracted from electronic medical records. Collected variables included demographic and clinical characteristics (age, sex, body mass index [BMI], disease duration, smoking and alcohol history, diabetes mellitus, and hypertension), tumor-related features (anatomical site, histological grade, extranodal extension [ENE], perineural invasion [PNI], depth of invasion [DOI], and AJCC stage according to the 8th edition of the AJCC Cancer Staging Manual), and receipt of adjuvant therapy. Laboratory indices comprised preoperative serum ALB, TC, and complete blood count–derived parameters, including neutrophil, lymphocyte, monocyte, and platelet counts, among others. Peripheral blood samples were obtained within 3 days prior to surgery as part of routine preoperative assessments. All tests were conducted in the hospital’s central laboratory using standardized protocols, with results reported in internationally recognized units.
Modified NPS Development and Evaluation of Prognostic Scoring Systems
To enhance prognostic stratification reflective of cohort-specific characteristics, a modified NPS (mNPS) was constructed by redefining optimal cut-off values for ALB, TC, NLR, and LMR using X-Tile software (version 3.6.1; Yale University, New Haven, CT, USA). For comparison, the conventional NPS was calculated using established thresholds: ALB ≥40 g/L (score = 0) vs <40 g/L (score = 1); TC>4.65 mmol/L (score = 0) vs ≤4.65 mmol/L (score = 1); NLR <2.96 (score = 0) vs ≥2.96 (score = 1); and LMR >4.44 (score = 0) vs ≤4.44 (score = 1). Based on the cumulative score, patients were stratified into three groups: Group 0 (score = 0), Group 1 (score = 1 or 2), and Group 2 (score = 3 or 4).
In addition to NPS and mNPS, several other systemic inflammatory and nutritional indices were assessed. The systemic inflammation response index (SIRI) was defined as (neutrophil count × monocyte count) / lymphocyte count, and the systemic immune-inflammation index (SII) as (platelet count × neutrophil count) / lymphocyte count. The Controlling Nutritional Status (CONUT) score, derived from ALB, total lymphocyte count, and TC, was used to evaluate nutritional risk, with higher scores indicating poorer nutritional status (Supplementary Table 1).
Statistical Methods
Continuous variables were expressed as median with interquartile range (IQR), depending on data distribution. Categorical variables were presented as frequencies and percentages. Between-group comparisons were performed using the Mann–Whitney U-test for two groups and the Kruskal–Wallis test for multiple groups. Categorical variables were compared using the Pearson chi-square test or Fisher’s exact test, as appropriate. Certain continuous variables were dichotomized based on established clinical thresholds or cohort-specific median values. Survival outcomes (OS, DFS, and DSS) were analyzed using the Kaplan–Meier method, and differences between groups were assessed using the log-rank test. Prognostic factors were identified through univariate Cox proportional hazards regression analysis. Variables with a P value <0.05 in univariate analysis were subsequently entered into multivariate Cox regression models to identify independent predictors of survival outcomes. Hazard ratios (HRs) and 95% confidence intervals (CIs) were reported. The proportional hazards assumption was assessed for all variables included in the Cox regression models using Schoenfeld residuals, and no significant violations were observed.
The discriminatory ability of prognostic models was assessed using receiver operating characteristic (ROC) curve analysis, and the corresponding areas under the curve (AUCs) were calculated. Calibration curves were generated to evaluate the agreement between predicted and observed survival probabilities. Decision curve analysis (DCA) was performed to assess the net clinical benefit across a range of threshold probabilities. In addition, a nomogram was constructed based on independent prognostic factors to visually predict individual patient survival probabilities. All statistical analyses were performed using R software version 4.3.3. All statistical tests were two-sided, and a P value <0.05 was considered statistically significant.
Results
Baseline Characteristics
sA total of 479 patients with OSCC were included, comprising 184 females (38.4%) and 295 males (61.6%) (Table 1). Among them, 214 (44.7%) were aged <60 years, and 265 (55.3%) were ≥60 years. In terms of body mass index (BMI), 266 patients (55.5%) had a BMI of 18.5–24.0 kg/m², whereas 115 (24.0%) were underweight (<18.5 kg/m²) and 98 (20.5%) were overweight (≥24.0 kg/m²). A history of smoking and alcohol consumption was reported in 245 (51.2%) and 199 (41.5%) patients, respectively. Comorbidities included hypertension (24.0%) and diabetes mellitus (13.4%). The tongue represented the most common primary tumor site (42.8%), followed by the buccal mucosa (25.3%) and gingiva (13.2%). Histologically, 267 tumors (55.7%) were well differentiated, 134 (28.0%) moderately differentiated, and 78 (16.3%) poorly differentiated. According to the 8th edition of the American Joint Committee on Cancer (AJCC) staging system, 45 patients (9.4%) had Stage I disease, 181 (37.8%) Stage II, 150 (31.3%) Stage III, and 103 (21.5%) Stage IV. Positive ENE and DOI ≥10 mm were identified in 37 (7.7%) and 162 (33.8%) patients, respectively, while PNI was present in 139 (29.0%). Laboratory assessments demonstrated a median serum ALB of 43.00 g/L (IQR, 39.00–46.00), a median TC level of 4.98 mmol/L (IQR, 4.38–5.72), a median NLR of 2.66 (IQR, 1.87–3.33), and a median LMR of 4.41 (IQR, 3.76–5.18). SII and SIRI values were 523.30 ×10⁹/L (IQR, 369.80–712.65) and 1.11 (IQR, 0.74–1.62), respectively. Based on the CONUT score, 442 patients (92.3%) had scores <3, and 37 (7.7%) had scores ≥3. Patients were randomly allocated into a development cohort (n=335) and a validation cohort (n=144), with baseline demographic, clinicopathological, and laboratory characteristics well balanced across cohorts, as no statistically significant differences were observed, indicating effective randomization.
 |
Table 1 Clinicopathologic Characteristics of the Study Cohort |
Determination of Cohort-Specific Cut-off Values and Clinicopathological Characteristics According to mNPS Stratification
Cohort-specific optimal cut-off values for ALB, TC, NLR, and LMR were determined in the development cohort using X-Tile software. The identified thresholds were 42 g/L for ALB, 5.12 mmol/L for TC, 2.74 for NLR, and 3.96 for LMR, respectively. These thresholds, compared with conventional NPS values (ALB 40 g/L, TC 4.66 mmol/L, NLR 2.96, and LMR 4.44), were incorporated to construct the mNPS for prognostic stratification.
Following mNPS stratification, 68 patients (20.3%) were assigned to Group 0 (mNPS = 0), 165 (49.3%) to Group 1 (mNPS = 1–2), and 102 (30.5%) to Group 2 (mNPS = 3–4). Baseline demographic and clinicopathological characteristics were broadly balanced across groups, as detailed in Table 2. Briefly, sex distribution and BMI categories were comparable among groups. Although a higher proportion of patients in Group 0 were aged <60 years compared with Groups 1 and 2, the difference was not statistically significant. Histories of smoking, alcohol consumption, diabetes mellitus, and hypertension, as well as primary tumor location, showed no significant variation. Of note, poorly differentiated tumors were more frequent in Group 2 (24.5%) compared with Groups 1 (17.6%) and 0 (17.7%). A higher proportion of advanced AJCC stages (III–IV) was also observed in Group 2, although without statistical significance. Rates of adjuvant therapy, positive PNI, DOI<10 mm, and positive ENE were similar across groups. Collectively, although baseline profiles were generally comparable, Group 2 exhibited a greater burden of poor differentiation and advanced disease.
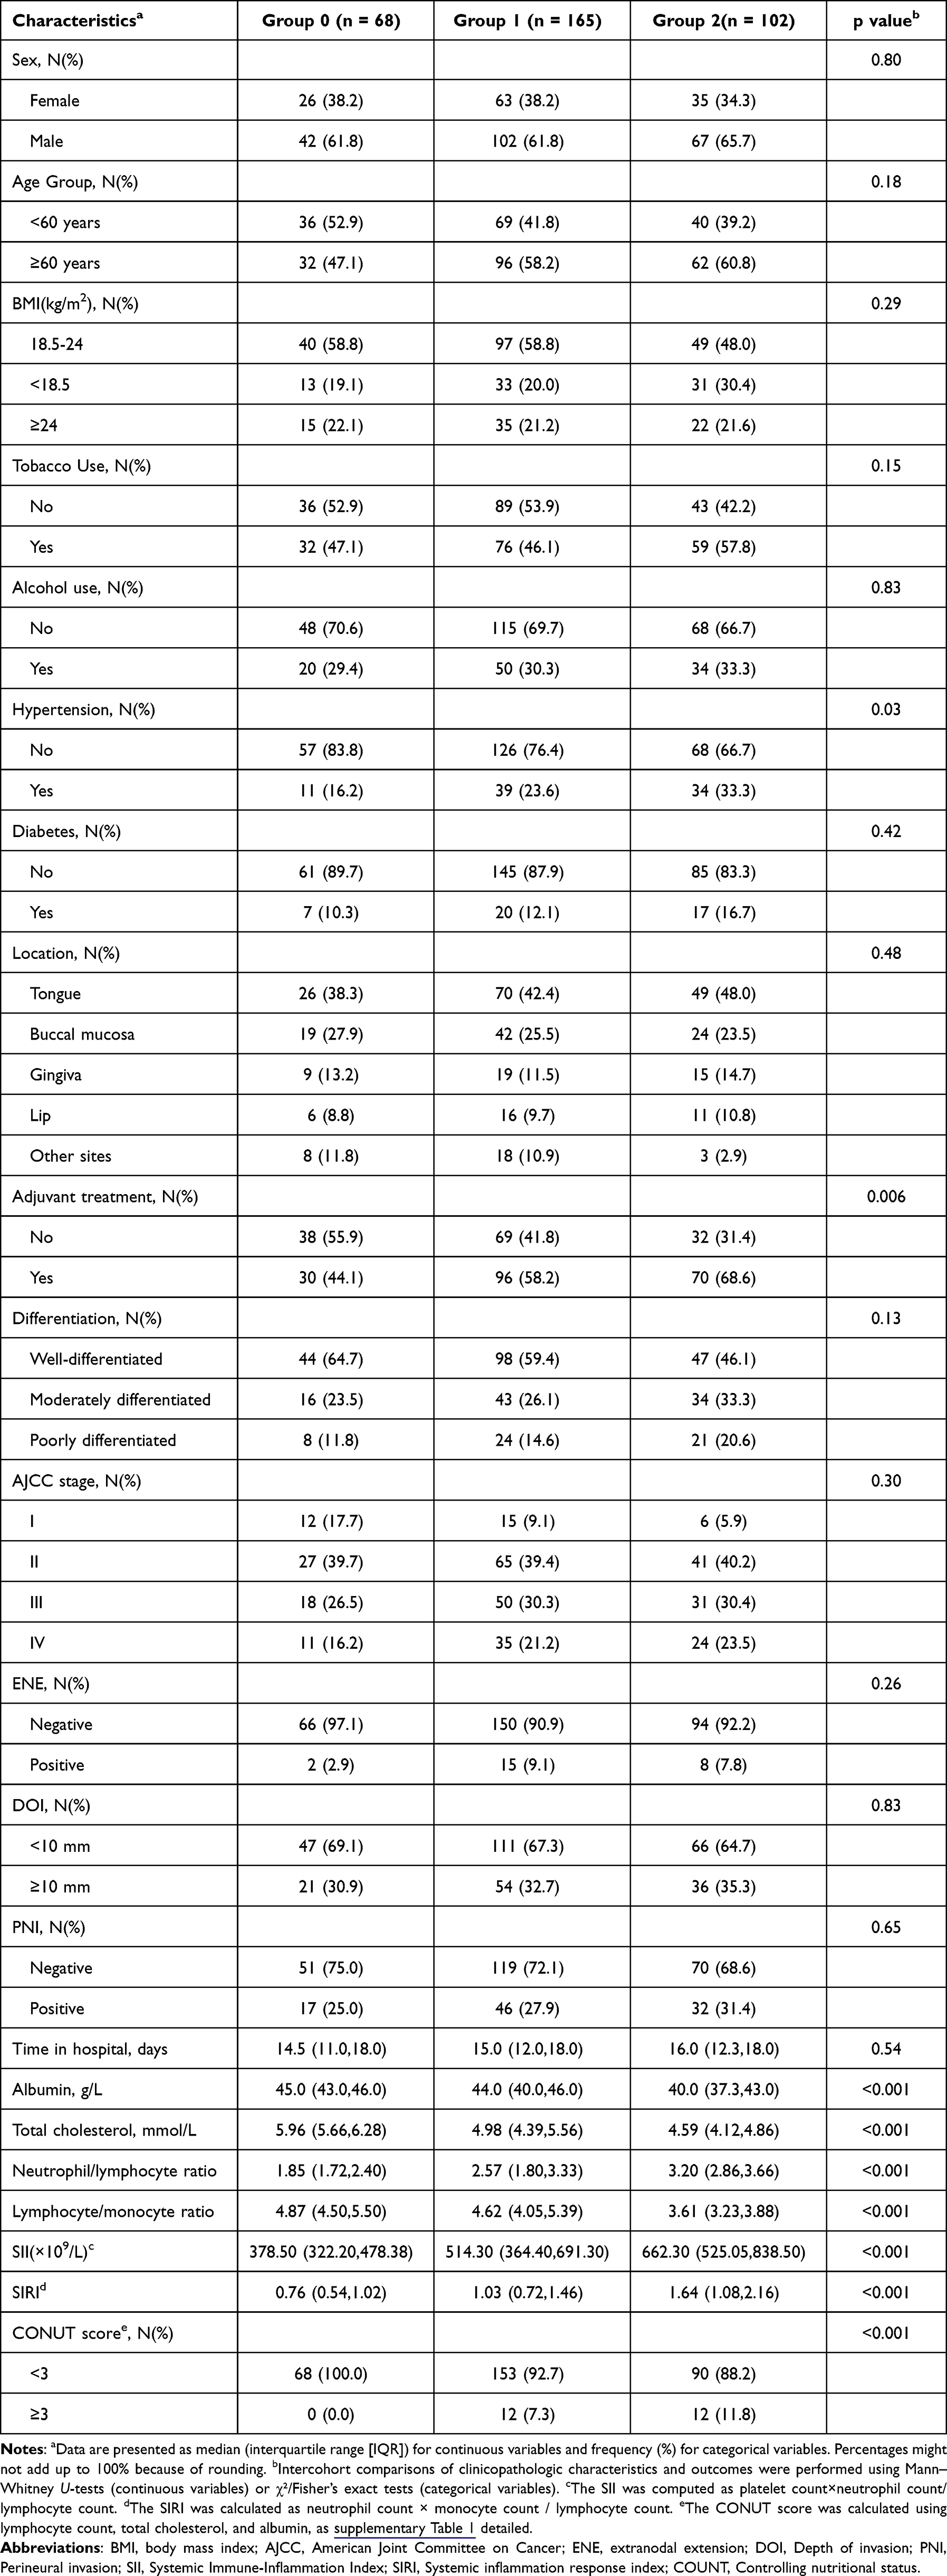 |
Table 2 Clinicopathologic Characteristics of the Development Cohort |
Comparison of Prognostic Scoring Systems
ROC curve analyses at 1, 3, and 5 years were conducted to compare the prognostic accuracy of mNPS, conventional NPS, SIRI, SII, and CONUT for OS (Figure 2). At 1 year, the AUC for mNPS was 0.67, higher than that of NPS (0.54), SIRI (0.55), SII (0.58), and CONUT (0.55). At 3 years, mNPS maintained the highest AUC at 0.66, compared with 0.60, 0.60, 0.59, and 0.52, respectively. At 5 years, mNPS continued to show superior discrimination (AUC=0.60) compared with the other scoring systems. Among the evaluated scoring systems, mNPS consistently exhibited superior prognostic accuracy.
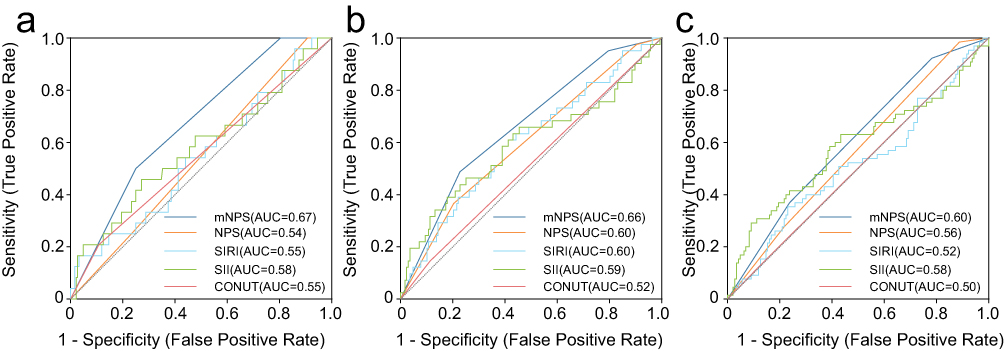 |
Figure 2 ROC Curve Analyses of mNPS, Conventional NPS, SIRI, SII, and CONUT for Predicting 1-, 3-, and 5-Year Overall Survival. Receiver operating characteristic (ROC) curve analyses comparing the predictive performance of the modified Naples Prognostic Score (mNPS), conventional Naples Prognostic Score (NPS), systemic immune-inflammation index (SII), systemic inflammation response index (SIRI), and Controlling Nutritional Status (CONUT) score for overall survival at 1 year (a), 3 years (b), and 5 years (c). The area under the curve (AUC) was calculated for each index to assess prognostic discrimination. |
Survival Analysis and Independent Prognostic Significance of mNPS
In the development cohort, higher mNPS scores were significantly associated with poorer survival outcomes (Figure 3). Log-rank tests demonstrated significant differences in OS, disease-free survival (DFS), and disease-specific survival (DSS) across mNPS groups (all P<0.001). These findings were consistently validated in the validation cohort, with significant stratification observed for OS (P<0.001), DFS (P=0.001), and DSS (P=0.003), confirming the robust discriminatory ability of mNPS (Figure 3).
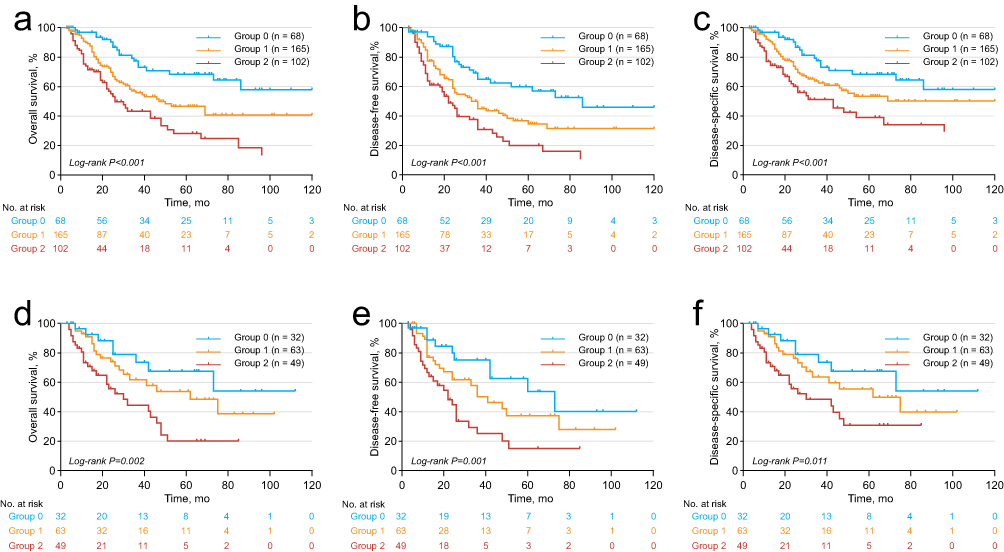 |
Figure 3 Kaplan–Meier Curves for OS, DFS, and DSS According to mNPS Stratification in the Development (a–c) and Validation (d–f) Cohorts. Kaplan–Meier survival analyses illustrating overall survival (OS), disease-free survival (DFS), and disease-specific survival (DSS) according to modified Naples Prognostic Score (mNPS) stratification. (a–c) represent OS, DFS, and DSS, respectively, in the development cohort. (d–f) represent the corresponding survival outcomes in the validation cohort. Patients were categorized into three mNPS risk groups: Group 0 (score = 0), Group 1 (score = 1–2), and Group 2 (score = 3–4). |
Univariate and multivariate Cox regression analyses were performed to identify independent predictors of OS (Table 3). In multivariate analysis, compared with Group 0, patients in Group 1 (hazard ratio [HR], 2.18; 95% CI, 1.25–3.82; P=0.006) and Group 2 (HR, 3.10; 95% CI, 1.67–5.77; P<0.001) demonstrated progressively higher risks of mortality. Other independent predictors included age ≥60 years (HR, 1.60; 95% CI, 1.10–2.33; P=0.015), BMI <18.5 kg/m² (HR, 1.90; 95% CI, 1.24–2.92; P=0.003), BMI ≥24 kg/m² (HR, 1.60; 95% CI, 1.01–2.52; P=0.045), poor tumor differentiation (HR, 2.48; 95% CI, 1.53–4.03; P<0.001), AJCC Stage IV (HR, 2.55; 95% CI, 1.10–5.88; P=0.029), and positive PNI (HR, 1.64; 95% CI, 1.15–2.36; P=0.007). The results of univariate and multivariate Cox regression analyses based on DFS and DSS are presented in Supplementary Tables 2 and 3, respectively, demonstrating similar patterns of association.
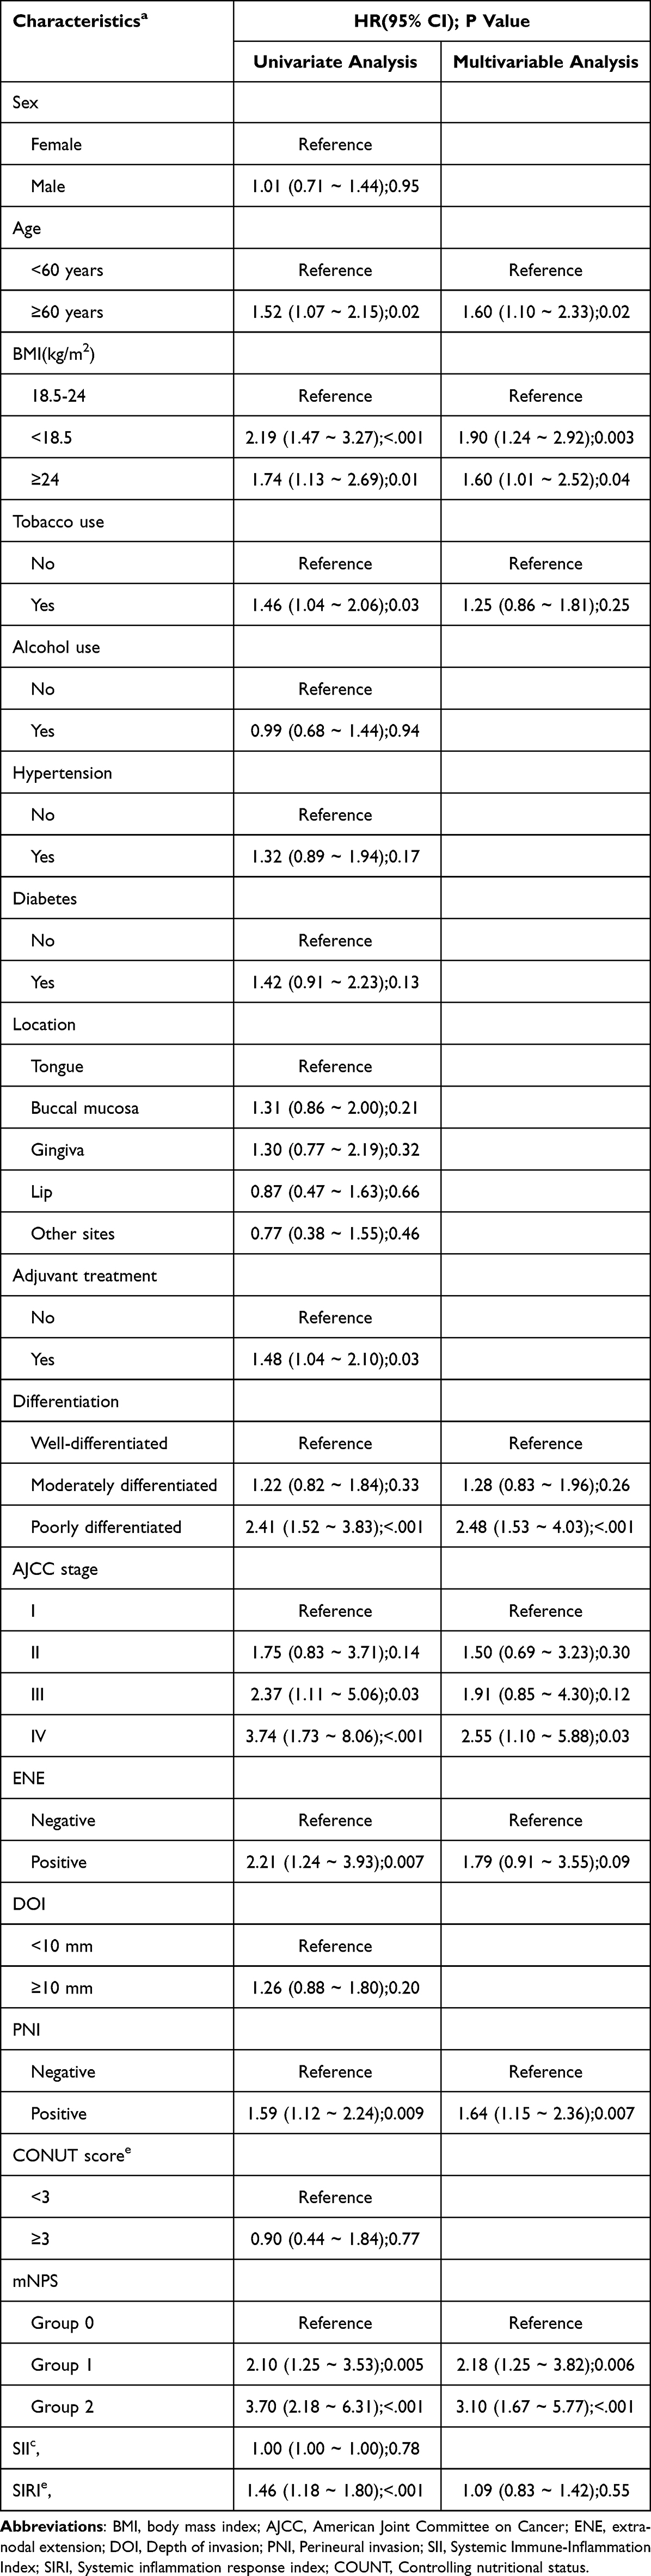 |
Table 3 Univariable and Multivariable Cox Regression Analyses of Risk Factors Associated with Overall Survival for OSCC |
Development and Validation of the Nomogram Model
A prognostic nomogram incorporating independent risk factors identified from multivariate Cox regression analysis—including mNPS, age group, tumor differentiation, BMI, ENE, AJCC stage, and PNI—was constructed to predict OS (Figure 4). The model exhibited favorable discriminatory performance, with AUCs of 0.83 (95% CI, 0.76–0.90), 0.80 (95% CI, 0.72–0.88), and 0.83 (95% CI, 0.76–0.90) for 1-, 3-, and 5-year OS, respectively, in the development cohort. Consistent results were observed in the validation cohort, with corresponding AUCs of 0.80 (95% CI, 0.67–0.93), 0.79 (95% CI, 0.69–0.90), and 0.82 (95% CI, 0.72–0.92) (Figure 5). In addition, the concordance indices (C-index) for the nomogram were 0.73 (95% CI, 0.69–0.78), 0.72 (95% CI, 0.68–0.76), and 0.73 (95% CI, 0.68–0.79) for OS, DFS, and DSS, respectively, in the development cohort, and 0.74 (95% CI, 0.66–0.82), 0.71 (95% CI, 0.64–0.79), and 0.76 (95% CI, 0.68–0.83) in the validation cohort (Supplementary Table 4). Calibration curves demonstrated good concordance between predicted and observed survival at 1, 3, and 5 years in both development and validation cohorts (Figure 6). DCA further indicated a superior net clinical benefit of the nomogram compared with the treat-all and treat-none strategies across a wide range of threshold probabilities (Figure 7).
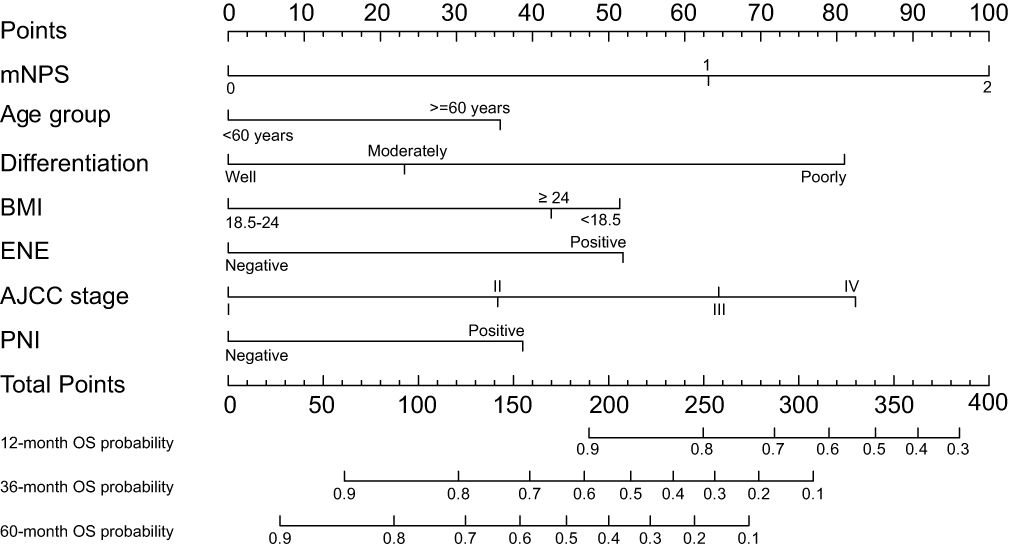 |
Figure 4 Nomogram based on independent prognostic factors identified in multivariate Cox regression analysis, developed to predict 1-, 3-, and 5-year OS in patients with resected OSCC. The model integrates mNPS, BMI, ENE, AJCC stage, PNI, and other key clinical variables. Each parameter is assigned a weighted point value, and the cumulative score corresponds to predicted survival probabilities at specified time points. Abbreviations: mNPS, modified Naples Prognostic Score; BMI, body mass index; ENE, extranodal extension; AJCC, American Joint Committee on Cancer; PNI, perineural invasion; OS, overall survival. |
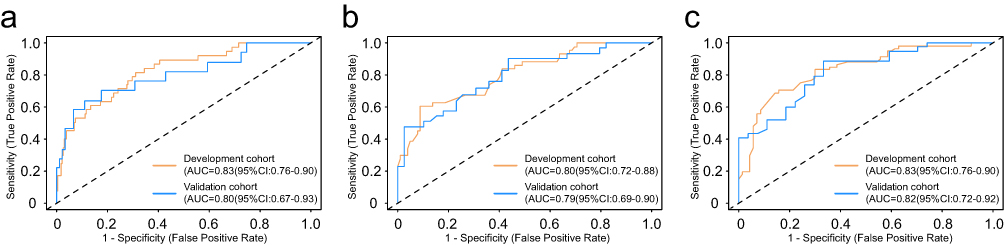 |
Figure 5 ROC Curve Analyses of the Full Nomogram Model Incorporating mNPS and Additional Prognostic Factors for Predicting 1-, 3-, and 5-Year Overall Survival. Receiver operating characteristic (ROC) curve analyses evaluating the discriminatory performance of the full nomogram model, which incorporates the mNPS along with age, BMI, tumor differentiation, AJCC stage, extranodal extension (ENE), and perineural invasion (PNI), for predicting overall survival at 1 year (a), 3 years (b), and 5 years (c). Each panel includes curves for both the development and validation cohorts. |
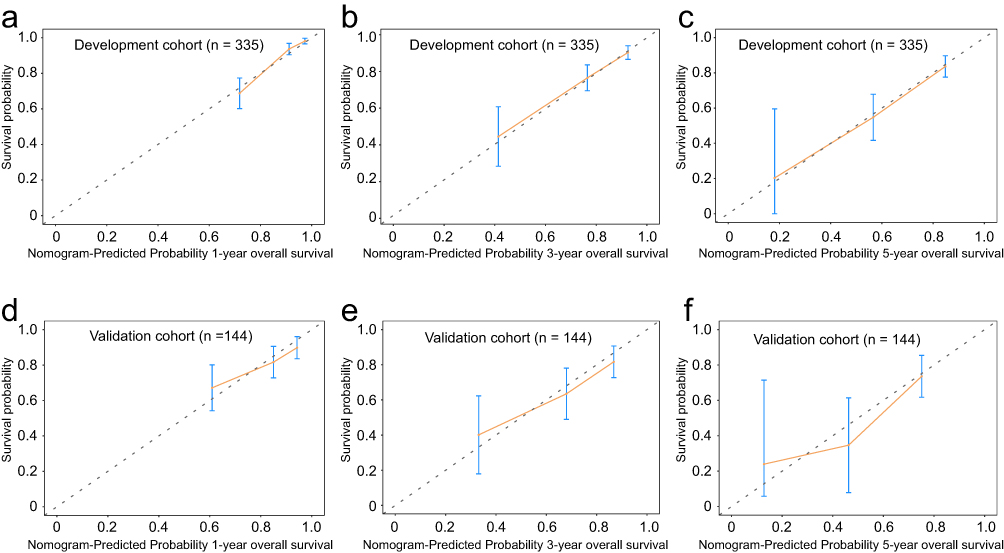 |
Figure 6 Calibration Curves for the Nomogram Model at 1, 3, and 5 Years in the Development and Validation Cohorts. Calibration curves illustrating the agreement between predicted and observed probabilities of overall survival (OS) at 1 year (a and d), 3 years (b and e), and 5 years (c and f). (a–c) represent results from the development cohort, and (d–f) correspond to the validation cohort. The x-axis indicates nomogram-predicted survival probability, and the y-axis shows actual survival probability estimated by the Kaplan–Meier method. The 45-degree diagonal line represents perfect prediction. Close alignment of the curves with the reference line indicates good calibration of the nomogram across both cohorts and time points. |
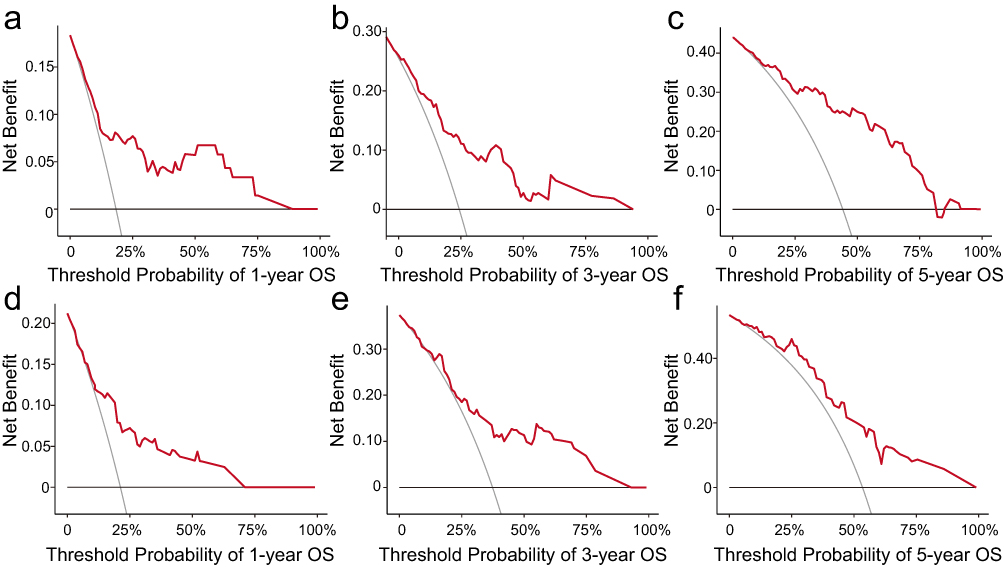 |
Figure 7 Decision Curve Analyses of the Nomogram Model at 1, 3, and 5 Years in the Development and Validation Cohorts. Decision curve analyses (DCA) comparing the net clinical benefit of the nomogram model for predicting overall survival (OS) at 1 year (a and d), 3 years (b and e), and 5 years (c and f). (a–c) present results from the development cohort, and (d–f) from the validation cohort. The y-axis represents the net benefit, and the x-axis indicates the threshold probability. The nomogram consistently demonstrated higher clinical utility than the “treat-all” and “treat-none” strategies across a wide range of thresholds in both cohorts. |
Comparative Prognostic Performance of mNPS Versus Conventional NPS
Independent multivariate Cox regression models were constructed to assess the prognostic utility of the conventional NPS for OS, DFS and DSS, with detailed results presented in Supplementary Tables 5–7. In the OS model (Supplementary Table 5), the HRs for Group 1 and Group 2 were 2.03 (95% CI, 1.21–3.43; P=0.008) and 2.05 (95% CI, 1.04–4.05; P=0.04), respectively, indicating only marginal incremental risk between intermediate- and high-risk groups. A similar trend was observed in the DFS (Supplementary Table 6) and DSS (Supplementary Table 7) models. In contrast, the modified NPS (mNPS) yielded a more distinct risk gradient, thereby demonstrating enhanced discriminatory capacity and superior prognostic performance.
ROC analyses further confirmed the superior discriminative performance of the mNPS compared with the conventional NPS across both development and validation cohorts (Supplementary Figure 1). In the development cohort, the mNPS yielded areas under the curve (AUCs) of 0.83 (95% CI, 0.76–0.90), 0.80 (95% CI, 0.72–0.88), and 0.83 (95% CI, 0.76–0.90) for 1-, 3-, and 5-year OS, respectively, whereas the conventional NPS exhibited lower AUCs of 0.77 (95% CI, 0.70–0.84), 0.75 (95% CI, 0.68–0.81), and 0.78 (95% CI, 0.71–0.84). This inferior predictive accuracy of the conventional NPS persisted in the validation cohort, with AUCs of 0.73 (95% CI, 0.60–0.87), 0.71 (95% CI, 0.60–0.82), and 0.74 (95% CI, 0.62–0.86) for 1-, 3-, and 5-year OS, respectively, compared with corresponding AUCs of 0.80 (95% CI, 0.67–0.93), 0.79 (95% CI, 0.69–0.90), and 0.82 (95% CI, 0.72–0.92) achieved by the mNPS. The C-index values for nomograms incorporating conventional NPS were slightly lower than those for mNPS-based models across all endpoints in both cohorts (Supplementary Table 4).
Discussion
To our knowledge, this study represents the first evaluation of the prognostic utility of the mNPS in patients with OSCC. The mNPS demonstrated superior discriminatory capacity compared with conventional indices—including the conventional NPS, PNI, SII, and CONUT—by enabling refined risk stratification for OS. Notably, the mNPS improved prognostic performance relative to the conventional NPS, underscoring the necessity of disease-specific threshold optimization in clinically heterogeneous populations.
Despite therapeutic advancements, OSCC continues to exhibit suboptimal five-year survival rates, with disease-related impairments in oropharyngeal function, thereby substantially diminishing quality of life.3 While molecular biomarkers such as RNAs and proteins hold potential, clinically actionable prognostic markers remain undefined.4,19 In this context, pretreatment host-related characteristics, particularly composite indices integrating nutritional, inflammatory, and immune parameters, have emerged as independent prognostic factors and offer a cost-effective means of preoperative risk stratification.20–22 However, commonly utilized indices—including the C-reactive protein/albumin ratio (CAR), CALLY index, and SII—present notable limitations. These include an oversimplified biological focus (eg, exclusion of adaptive immunity in CAR; omission of metabolic markers in SII) and substantial methodological heterogeneity (eg, a 16-fold variation in CAR thresholds across studies).23–26 To address these limitations, the NPS was developed, incorporating ALB, TC, NLR, and LMR, thereby improving prognostic stability across multiple cancer types.11 Nevertheless, its original thresholds, established in Italian colorectal cancer cohorts, may not fully account for interpopulation heterogeneity stemming from differences in disease biology, ethnicity, and healthcare systems.17,18 In the present study, by recalibrating the NPS thresholds specifically for OSCC, we significantly enhanced prognostic discrimination and independent survival prediction, thereby capturing the distinct interplay between systemic inflammation and metabolic dysregulation characteristic of this malignancy.
Observational and prospective studies corroborate the prognostic value of serum ALB and TC in OSCC.9,10,22,24,25,27–30 Mechanistically, ALB functions as a major extracellular antioxidant, scavenging reactive oxygen species and thereby mitigating oxidative stress within the tumor microenvironment.31,32 Given that oxidative stress is a key driver of DNA damage, epithelial-mesenchymal transition, and tumor invasiveness, hypoalbuminemia may indirectly facilitate OSCC progression. In addition to its antioxidant role, ALB is critical for maintaining endothelial integrity and oncotic pressure, essential for vascular homeostasis.32,33 Consequently, low ALB levels may disrupt vascular barriers, enhance vascular permeability, and potentiate metastatic dissemination independent of nutritional status. Furthermore, ALB serves as a principal carrier of endogenous substances, such as hormones and fatty acids, as well as exogenous chemotherapeutic agents.34 Reduced ALB concentrations may impair drug transport and pharmacokinetics, limiting effective drug delivery to tumor sites and contributing to therapeutic resistance. Collectively, these mechanistic insights suggest that hypoalbuminemia not only reflects systemic disease burden but may actively drive OSCC progression and treatment failure. Accordingly, strategies aimed at restoring serum ALB levels—through targeted nutritional support or anti-inflammatory interventions—warrant further investigation as adjunctive measures to improve clinical outcomes in OSCC.
TC, traditionally regarded as a biomarker of nutritional status, is increasingly recognized as a dynamic regulator of tumor biology. In OSCC, hypocholesterolemia has been associated with adverse clinical outcomes, highlighting a complex interplay between lipid metabolism and cancer progression.35 Mechanistically, cholesterol depletion disrupts lipid raft integrity, impairs immune synapse formation, and attenuates cytotoxic T-cell activation, thereby facilitating immune evasion by tumor cells.36 Moreover, reduced systemic cholesterol levels may compromise membrane fluidity and cellular stability, enhancing tumor cell plasticity and promoting epithelial-mesenchymal transition, a critical driver of metastasis.36 Given these mechanistic links between cholesterol homeostasis, immune surveillance, and tumor progression, therapeutic strategies aimed at restoring or modulating systemic cholesterol levels warrant further investigation as adjunctive approaches in OSCC management.37
The NLR, a readily accessible marker derived from peripheral blood counts, has been extensively investigated as a prognostic indicator in various malignancies, including OSCC.38 Elevated NLR, reflecting concurrent neutrophilia and lymphopenia, denotes a pathological state characterized by persistent systemic inflammation and impaired immune surveillance. Neutrophils, activated through tumor necrosis factor–α-mediated paracrine signaling, promote tumor proliferation, angiogenesis, and immune evasion by disrupting tissue homeostasis, thereby worsening survival outcomes.39 Conversely, lymphopenia correlates with diminished cell-mediated cytotoxicity, a critical component of antitumor immunity.40 Moreover, monocytes, upon differentiation into tumor-associated macrophages or dendritic cells under proinflammatory cytokine and chemokine stimuli, exacerbate carcinogenesis and metastatic dissemination.41 Collectively, elevated NLR and decreased lymphocyte-to-monocyte ratio (LMR) may serve as integrative biomarkers of tumor-driven immune dysregulation and inflammatory activation, correlating with reduced OS and DFS.42,43 However, substantial heterogeneity exists in reported cut-off values for NLR and LMR across OSCC cohorts, with NLR thresholds ranging from 1.31 to 4.08 and LMR thresholds from 2.6 to 4.85.26,44–46 Although intrinsic tumor biology and demographic heterogeneity—including genetic variation and etiological diversity—may partially account for this variability, the extent of discrepancy highlights the imperative to develop validated NPS criteria specifically tailored to distinct cancer subtypes and anatomical sites.
Clinically, the recalibrated mNPS improves prognostic discrimination through several mechanisms. The adoption of a higher albumin threshold (42 g/L vs 40 g/L) facilitates earlier identification of subclinical malnutrition and impaired systemic immunity, conditions prevalent among OSCC patients with chronic inflammation and nutritional deficits. By elevating the TC cut-off (5.12 mmol/L vs 4.65 mmol/L), the mNPS more precisely reflects metabolic reserve capacity, a critical determinant of host resilience under the catabolic stress characteristic of OSCC. The reduction of the NLR threshold (2.74 vs 2.97) enhances sensitivity to low-grade systemic inflammatory responses that may substantially influence survival even in the absence of overt inflammatory disease. Conversely, lowering the LMR threshold (3.96 vs 4.44) mitigates overreliance on a single protective immune marker, acknowledging that minor variations in lymphocyte or monocyte counts may lack sufficient discriminatory power in OSCC. Collectively, these refinements allow the mNPS to better align with the pathophysiological attributes of OSCC, thereby improving risk stratification and enhancing its clinical utility compared with the conventional NPS.
Beyond composite indices, anthropometric parameters such as BMI merit rigorous prognostic evaluation in OSCC. Multivariate analysis revealed a nonlinear mortality association, with underweight (BMI <18.5 kg/m²; HR 1.90) and overweight (BMI ≥24 kg/m²; HR 1.60) independently predictive of adverse prognoses, suggesting a J-curve mortality relationship.47 Pathophysiological mechanisms likely underpin these extremes: low BMI reflects cancer-associated cachexia, marked by skeletal muscle atrophy, chronic inflammation, and immunosuppression, compromising therapeutic tolerance and survival.48,49 In elderly populations, low BMI correlates with sarcopenia, postural instability, and fracture susceptibility,50,51 while obesity may exacerbate OSCC progression via insulin dysregulation, adipokine-driven oncogenesis, and subclinical inflammation.52,53 Furthermore, elevated BMI correlates with heightened perioperative complication risks, potentially attenuating long-term survival benefits. However, as a surrogate measure of body composition, BMI fails to distinguish fat mass from lean mass, limiting its capacity to delineate divergent prognostic pathways—notably in differentiating sarcopenic from nonsarcopenic obesity phenotypes.54 Furthermore, fluid retention frequently observed in advanced-stage disease may compromise the validity of BMI-based nutritional and metabolic status evaluations. Collectively, these constraints underscore the insufficiency of BMI as a standalone prognostic indicator. Subsequent investigations should integrate direct body composition quantification modalities, such as skeletal muscle index determination or dual-energy X-ray absorptiometry, to optimize prognostic stratification accuracy in OSCC.
Conclusions
In summary, this study demonstrates that the mNPS, through recalibrated, OSCC-specific thresholds, offers superior prognostic discrimination compared with conventional indices and improves risk stratification in patients with OSCC. Our findings underscore the necessity of population- and disease-specific optimization of composite indices to enhance their clinical applicability. Collectively, the mNPS provides a promising, cost-effective tool for individualized risk assessment in OSCC and may inform the development of tailored perioperative and adjuvant treatment strategies.
Data Sharing Statement
Except for the patients’ privacy, data and deidentified results of these analyses are available for scientific researchers upon reasonable request.
Ethics Statement
This study was conducted in accordance with the Declaration of Helsinki and approved by the Ethics Committees of the First Affiliated Hospital of Chongqing Medical University. Written informed consent was obtained from all participants.
Acknowledgments
We gratefully acknowledge all participants for their involvement in this study.
Author Contributions
All authors made a significant contribution to the work reported, whether that is in the conception, study design, execution, acquisition of data, analysis and interpretation, or in all these areas; took part in drafting, revising or critically reviewing the article; gave final approval of the version to be published; have agreed on the journal to which the article has been submitted; and agree to be accountable for all aspects of the work.
Disclosure
The authors declare that they have no conflicts of interest.
References
1. Chi AC, Day TA, Neville BW. Oral cavity and oropharyngeal squamous cell carcinoma--an update. CA Cancer J Clin. 2015;65(5):401–421. doi:10.3322/caac.21293
2. Yaniv D, Seiwert TY, Margalit DN, et al. Neoadjuvant chemotherapy for advanced oral cavity cancer. CA Cancer J Clin. 2024;74(3):213–223. doi:10.3322/caac.21829
3. Tan Y, Wang Z, Xu M, et al. Oral squamous cell carcinomas: state of the field and emerging directions. Int J Oral Sci. 2023;15(1):44. doi:10.1038/s41368-023-00249-w
4. Radaic A, Kamarajan P, Cho A, et al. Biological biomarkers of oral cancer. Periodontol 2000. 2023;96:250–280. doi:10.1111/prd.12542
5. Rodriguez-Vita J, Lawrence T. The resolution of inflammation and cancer. Cytokine Growth Factor Rev. 2010;21(1):61–65. doi:10.1016/j.cytogfr.2009.11.006
6. Li C, Zhang J, Pan P, et al. Humanistic health management and cancer: associations of psychology, nutrition, and exercise with cancer progression and pathogenesis. Adv Sci. 2024;11(22):e2400665. doi:10.1002/advs.202400665
7. Li B, Severson E, Pignon JC, et al. Comprehensive analyses of tumor immunity: implications for cancer immunotherapy. Genome Biol. 2016;17(1):174. doi:10.1186/s13059-016-1028-7
8. Zhu J, Wang D, Liu C, et al. Development and validation of a new prognostic immune-inflammatory-nutritional score for predicting outcomes after curative resection for intrahepatic cholangiocarcinoma: a multicenter study. Front Immunol. 2023;14:1165510. doi:10.3389/fimmu.2023.1165510
9. Yang M, Lin SQ, Liu XY, et al. Association between C-reactive protein-albumin-lymphocyte (CALLY) index and overall survival in patients with colorectal cancer: from the investigation on nutrition status and clinical outcome of common cancers study. Front Immunol. 2023;14:1131496. doi:10.3389/fimmu.2023.1131496
10. Yoshimura T, Suzuki H, Takayama H, et al. Prognostic value of inflammatory biomarkers in aged patients with oral squamous cell carcinoma. Front Pharmacol. 2022;13:996757. doi:10.3389/fphar.2022.996757
11. Galizia G, Lieto E, Auricchio A, et al. Naples prognostic score, based on nutritional and inflammatory status, is an independent predictor of long-term outcome in patients undergoing surgery for colorectal cancer. Dis Colon Rectum. 2017;60(12):1273–1284. doi:10.1097/DCR.0000000000000961
12. Feng JF, Zhao JM, Chen S, et al. Naples prognostic score: a novel prognostic score in predicting cancer-specific survival in patients with resected esophageal squamous cell carcinoma. Front Oncol. 2021;11:652537. doi:10.3389/fonc.2021.652537
13. Xu B, Zhu J, Wang R, et al. Clinical implications of Naples prognostic score for patients with resected cholangiocarcinoma: a real-world experience. J Inflamm Res. 2024;17:655–667. doi:10.2147/JIR.S446735
14. Xie YM, Lu W, Cheng J, et al. Naples prognostic score is an independent prognostic factor in patients undergoing hepatectomy for hepatocellular carcinoma. J Hepatocell Carcinoma. 2023;10:1423–1433. doi:10.2147/JHC.S414789
15. Chen S, Xu S, Liu S, et al. Naples prognostic score is an independent prognostic factor in patients with small cell lung cancer and nomogram predictive model established. J Inflamm Res. 2022;15:3719–3731. doi:10.2147/JIR.S371545
16. Xu XL, Cheng H. Development of a prognostic nomogram incorporating the Naples prognostic score for postoperative oral squamous cell carcinoma patients. J Inflamm Res. 2025;18:325–345. doi:10.2147/JIR.S500518
17. Li X, Cheng C, Huo X, et al. Clinical significance of the modified Naples prognostic score in patients with stage II-III colon cancer undergoing curative resection: a retrospective study from the real world. Front Oncol. 2024;14:1403666. doi:10.3389/fonc.2024.1403666
18. Gu J, Deng S, Jiang Z, et al. Modified Naples prognostic score for evaluating the prognosis of patients with obstructive colorectal cancer. BMC Cancer. 2023;23(1):941. doi:10.1186/s12885-023-11435-8
19. Rivera C, Oliveira AK, Costa R, et al. Prognostic biomarkers in oral squamous cell carcinoma: a systematic review. Oral Oncol. 2017;72:38–47. doi:10.1016/j.oraloncology.2017.07.003
20. Valero C, Zanoni DK, Pillai A, et al. Host factors independently associated with prognosis in patients with oral cavity cancer. JAMA Otolaryngol Head Neck Surg. 2020;146(8):699–707. doi:10.1001/jamaoto.2020.1019
21. Kubota K, Ito R, Narita N, et al. Utility of prognostic nutritional index and systemic immune-inflammation index in oral cancer treatment. BMC Cancer. 2022;22(1):368. doi:10.1186/s12885-022-09439-x
22. Bao X, Liu F, Lin J, et al. Nutritional assessment and prognosis of oral cancer patients: a large-scale prospective study. BMC Cancer. 2020;20(1):146. doi:10.1186/s12885-020-6604-2
23. Wu M, Ye P, Zhang W, et al. Prognostic role of an inflammation scoring system in radical resection of oral squamous cell carcinoma. BMC Oral Health. 2022;22(1):226. doi:10.1186/s12903-022-02261-8
24. Yamagata K, Fukuzawa S, Ishibashi-Kanno N, et al. Association between the C-reactive protein/albumin ratio and prognosis in patients with oral squamous cell carcinoma. Sci Rep. 2021;11(1):5446. doi:10.1038/s41598-021-83362-2
25. Wang Q, Song X, Zhao Y, et al. Preoperative high c-reactive protein/albumin ratio is a poor prognostic factor of oral squamous cell carcinoma. Future Oncol. 2019;15(19):2277–2286. doi:10.2217/fon-2019-0063
26. Zhuang Z, Li Y, Hong Y, et al. A novel prognostic score based on systemic inflammatory biomarkers for patients with oral squamous cell carcinoma. Oral Dis. 2022;28(3):631–638. doi:10.1111/odi.13774
27. Ito Y, Abe A, Hayashi H, et al. Prognostic impact of preoperative geriatric nutritional risk index in oral squamous cell carcinoma. Oral Dis. 2023;29(5):2076–2085. doi:10.1111/odi.14255
28. Tsai YT, Ko CA, Chen HC, et al. Prognostic value of CRP-albumin-lymphocyte (CALLY) index in patients undergoing surgery for oral cavity cancer. J Cancer. 2022;13(10):3000–3012. doi:10.7150/jca.74930
29. Fang KH, Lai CH, Hsu CM, et al. A retrospective study on the prognostic value of preoperative C-reactive protein to albumin ratio in patients with oral cavity squamous cell carcinoma. PeerJ. 2020;8:e9361. doi:10.7717/peerj.9361
30. Qian L, Qian B, Xu J, et al. Clinical relevance of serum lipids in the carcinogenesis of oral squamous cell carcinoma. BMC Oral Health. 2023;23(1):200. doi:10.1186/s12903-023-02859-6
31. Roche M, Rondeau P, Singh NR, et al. The antioxidant properties of serum albumin. FEBS Lett. 2008;582(13):1783–1787. doi:10.1016/j.febslet.2008.04.057
32. Ishimaru Y, Adachi T, Ashikawa H, et al. Association between the redox state of human serum albumin and exercise capacity in patients with cardiac disease. Am J Cardiol. 2023;189:56–60. doi:10.1016/j.amjcard.2022.11.034
33. Singh-Zocchi M, Andreasen A, Zocchi G. Osmotic pressure contribution of albumin to colloidal interactions. Proc Natl Acad Sci U S A. 1999;96(12):6711–6715. doi:10.1073/pnas.96.12.6711
34. Fanali G, Di Masi A, Trezza V, et al. Human serum albumin: from bench to bedside. Mol Aspects Med. 2012;33(3):209–290. doi:10.1016/j.mam.2011.12.002
35. Acharya S, Rai P, Hallikeri K, et al. Serum lipid profile in oral squamous cell carcinoma: alterations and association with some clinicopathological parameters and tobacco use. Int J Oral Maxillofac Surg. 2016;45(6):713–720. doi:10.1016/j.ijom.2016.01.015
36. Abdulla N, Vincent CT, Kaur M. Mechanistic insights delineating the role of cholesterol in epithelial mesenchymal transition and drug resistance in cancer. Front Cell Dev Biol. 2021;9:728325. doi:10.3389/fcell.2021.728325
37. Tsai YT, Tsai MH, Kudva A, et al. The prognostic value of preoperative total cholesterol in surgically treated oral cavity cancer. Biomedicines. 2024;12(12):2898. doi:10.3390/biomedicines12122898
38. Takenaka Y, Oya R, Kitamiura T, et al. Prognostic role of neutrophil-to-lymphocyte ratio in head and neck cancer: a meta-analysis. Head Neck. 2018;40(3):647–655. doi:10.1002/hed.24986
39. Glogauer JE, Sun CX, Bradley G, et al. Neutrophils increase oral squamous cell carcinoma invasion through an invadopodia-dependent pathway. Cancer Immunol Res. 2015;3(11):1218–1226. doi:10.1158/2326-6066.CIR-15-0017
40. Gajewski TF, Schreiber H, Fu YX. Innate and adaptive immune cells in the tumor microenvironment. Nat Immunol. 2013;14(10):1014–1022. doi:10.1038/ni.2703
41. Cassetta L, Fragkogianni S, Sims AH, et al. Human tumor-associated macrophage and monocyte transcriptional landscapes reveal cancer-specific reprogramming, biomarkers, and therapeutic targets. Cancer Cell. 2019;35(4):588–602. doi:10.1016/j.ccell.2019.02.009
42. Diao P, Wu Y, Li J, et al. Preoperative systemic immune-inflammation index predicts prognosis of patients with oral squamous cell carcinoma after curative resection. J Transl Med. 2018;16(1):365. doi:10.1186/s12967-018-1742-x
43. Wu HX, Cheng S, Liu F, et al. Nomogram incorporating potent inflammatory indicators for overall survival estimation of patients with primary oral squamous cell carcinoma. Front Oncol. 2023;13:1197049. doi:10.3389/fonc.2023.1197049
44. Ruiz-Ranz M, Lequerica-Fernandez P, Rodriguez-Santamarta T, et al. Prognostic implications of preoperative systemic inflammatory markers in oral squamous cell carcinoma, and correlations with the local immune tumor microenvironment. Front Immunol. 2022;13:941351. doi:10.3389/fimmu.2022.941351
45. Jariod-Ferrer UM, Arbones-Mainar JM, Gavin-Clavero MA, et al. Are comorbidities associated with overall survival in patients with oral squamous cell carcinoma? J Oral Maxillofac Surg. 2019;77(9):1906–1914. doi:10.1016/j.joms.2019.03.007
46. Eltohami YI, Kao HK, Lao WW, et al. The prediction value of the systemic inflammation score for oral cavity squamous cell carcinoma. Otolaryngol Head Neck Surg. 2018;158(6):1042–1050. doi:10.1177/0194599817751678
47. Bhaskaran K, Dos-Santos-Silva I, Leon DA, et al. Association of BMI with overall and cause-specific mortality: a population-based cohort study of 3.6 million adults in the UK. Lancet Diabetes Endocrinol. 2018;6(12):944–953. doi:10.1016/S2213-8587(18)30288-2
48. Chang WC, Yang CY, Lin CS, et al. Pretreatment body mass index as a prognostic predictor in patients with oral squamous cell carcinoma. Clin Oral Investig. 2020;24(8):2781–2788. doi:10.1007/s00784-019-03141-2
49. Argiles JM, Busquets S, Stemmler B, et al. Cancer cachexia: understanding the molecular basis. Nat Rev Cancer. 2014;14(11):754–762. doi:10.1038/nrc3829
50. Yeung S, Reijnierse EM, Pham VK, et al. Sarcopenia and its association with falls and fractures in older adults: a systematic review and meta-analysis. J Cachexia Sarcopenia Muscle. 2019;10(3):485–500. doi:10.1002/jcsm.12411
51. Ansari E, Chargi N, van Gemert J, et al. Low skeletal muscle mass is a strong predictive factor for surgical complications and a prognostic factor in oral cancer patients undergoing mandibular reconstruction with a free fibula flap. Oral Oncol. 2020;101:104530. doi:10.1016/j.oraloncology.2019.104530
52. Iyengar NM, Kochhar A, Morris PG, et al. Impact of obesity on the survival of patients with early-stage squamous cell carcinoma of the oral tongue. Cancer. 2014;120(7):983–991. doi:10.1002/cncr.28532
53. Park J, Morley TS, Kim M, et al. Obesity and cancer--mechanisms underlying tumour progression and recurrence. Nat Rev Endocrinol. 2014;10(8):455–465. doi:10.1038/nrendo.2014.94
54. Sweatt K, Garvey WT, Martins C. Strengths and limitations of BMI in the diagnosis of obesity: what is the path forward? Curr Obes Rep. 2024;13(3):584–595. doi:10.1007/s13679-024-00580-1
 © 2025 The Author(s). This work is published and licensed by Dove Medical Press Limited. The
full terms of this license are available at https://www.dovepress.com/terms
and incorporate the Creative Commons Attribution
- Non Commercial (unported, 4.0) License.
By accessing the work you hereby accept the Terms. Non-commercial uses of the work are permitted
without any further permission from Dove Medical Press Limited, provided the work is properly
attributed. For permission for commercial use of this work, please see paragraphs 4.2 and 5 of our Terms.
© 2025 The Author(s). This work is published and licensed by Dove Medical Press Limited. The
full terms of this license are available at https://www.dovepress.com/terms
and incorporate the Creative Commons Attribution
- Non Commercial (unported, 4.0) License.
By accessing the work you hereby accept the Terms. Non-commercial uses of the work are permitted
without any further permission from Dove Medical Press Limited, provided the work is properly
attributed. For permission for commercial use of this work, please see paragraphs 4.2 and 5 of our Terms.
Recommended articles
Evaluation of Lactate Dehydrogenase and Alkaline Phosphatase as Predictive Biomarkers in the Prognosis of Hepatocellular Carcinoma and Development of a New Nomogram
Su K, Huang W, Li X, Xu K, Gu T, Liu Y, Song J, Qian K, Xu Y, Zeng H, Yang Y, Guo L, Han Y
Journal of Hepatocellular Carcinoma 2023, 10:69-79
Published Date: 14 January 2023
Clinical Analysis and Prognostic Prediction Model for Patients with Uterine Leiomyosarcoma at FIGO Stage I
Chen S, Deng Y, Zhai Y, Zhan Y, Li X, Wang J, Bai H
International Journal of Women's Health 2023, 15:545-557
Published Date: 11 April 2023
Development and Validation of a Novel Prognosis Model Based on a Panel of Three Immunogenic Cell Death-Related Genes for Non-Cirrhotic Hepatocellular Carcinoma
Gong J, Yu R, Hu X, Luo H, Gao Q, Li Y, Tan G, Luo H, Qin B
Journal of Hepatocellular Carcinoma 2023, 10:1609-1628
Published Date: 25 September 2023
Prognostic Value of Body Composition and Systemic Inflammatory Markers in Patients with Locally Advanced Cervical Cancer Following Chemoradiotherapy
Guo H, Feng S, Li Z, Yin Y, Lin X, Yuan L, Sheng X, Li D
Journal of Inflammation Research 2023, 16:5145-5156
Published Date: 10 November 2023
Development of a Prognostic Nomogram for Nonneutropenic Invasive Pulmonary Aspergillosis Based on Machine Learning
Du W, Ji W, Luo T, Zhang Y, Guo W, Liang J, Lv Y
Journal of Inflammation Research 2024, 17:9823-9835
Published Date: 26 November 2024