Back to Journals » International Journal of General Medicine » Volume 19
Machine Learning-Based Diagnostic Models for Early Gastric Cancer Using Clinical Laboratory Indicators
Authors Ji R ![]() , Yang R, Yao J, Dai S, Zhu X
, Yang R, Yao J, Dai S, Zhu X ![]() , Ye Q
, Ye Q
Received 7 August 2025
Accepted for publication 14 January 2026
Published 28 January 2026 Volume 2026:19 559103
DOI https://doi.org/10.2147/IJGM.S559103
Checked for plagiarism Yes
Review by Single anonymous peer review
Peer reviewer comments 3
Editor who approved publication: Prof. Dr. Gopal Krishna Dhali
Runbi Ji,1,2 Ruoyu Yang,1,2 Jun Yao,1 Shenglan Dai,1 Xin Zhu,1 Qiang Ye1
1The Affiliated People’s Hospital of Jiangsu University, Zhenjiang, Jiangsu, 212002, People’s Republic of China; 2Jiangsu Key Laboratory of Medical Science and Laboratory Medicine, School of Medicine, Jiangsu University, Zhenjiang, Jiangsu, 212013, People’s Republic of China
Correspondence: Runbi Ji, The Affiliated People’s Hospital of Jiangsu University, Zhenjiang, Jiangsu, 212002, People’s Republic of China, Tel +86 511 88915575, Fax +86 511 85234387, Email [email protected]
Background: The occurrence of gastric cancer is a complex pathological process leading to multiple abnormalities in clinical laboratory indicators. Machine learning techniques can make it easy to handle millions of variables to make more accurate predictions and diagnoses of diseases.
Methods: Clinical data from gastric cancer patients in a single-center who underwent surgery between 2016 and 2023 were collected. Five machine learning algorithms (extreme gradient boosting, XGBoost; random forest, RF; support vector machine-recursive feature elimination, SVM-RFE; light gradient boosting machine, LGBM; and recursive partitioning, rpart) were utilized to develop diagnostic models. Among the date, 60% were randomly selected to train the models, while the remaining 40% were used for testing. We used the area under the receiver operating characteristic curve (AUROC), F1-score value, sensitivity, and specificity to evaluate the performance of models.
Results: The XGBoost algorithm showed the best performance in gastric cancer diagnosis, with significantly higher area under curve (AUC) (combining blood indicators and pathological parameters, AUC=0.9909) value than other models. Glutathione reductase (GR), carbohydrate antigen 724 (CA724), erythrocytes (RBC), carbohydrate antigen 242 (CA242), and albumin (ALB) contributed the most to the diagnosis. The tumor size were independent risk factors for early gastric cancer.
Conclusion: Machine learning combined blood indicators and pathological parameters could predict gastric cancer risk more accurately. The XGBoost model had the best diagnostic performance. The study provides confirmatory data support for the preclinical implementation of the model.
Keywords: early gastric cancer, machine learning, diagnostic model, clinical laboratory indicators, glutathione reductase
Introduction
Gastric cancer (GC) remains one of the most prevalent malignant tumors worldwide, ranks as the fifth in incidence rate and the fourth in mortality.1,2 Early gastric cancer (EGC) refers to lesions confined to the mucosal and submucosal, regardless of size or lymph node metastasis. There are often no obvious symptoms in EGC, occasionally accompanied by discomfort similar to chronic gastritis or gastric ulcers. Because of the atypical symptoms, the diagnosis rate of EGC is relatively low.3–5
The 5-year survival rate of EGC after surgery (or endoscopic resection) can reach 90% to 95%, much higher than that of advanced gastric cancer (AGC). Early screening and diagnosis are crucial to early management. The methods for early screening and diagnosis include X-ray barium contrast examination, endoscopic examination, serological examination and pathological diagnosis.6 Upper gastrointestinal X-ray barium contrast examination is radioactive and has a low positive rate, which has gradually been phased out in clinical practice. Gastroscopy and histopathological examination are currently considered as the gold standard for diagnosing GC. But the acceptance of this technology is relatively low for its high cost, limitation of equipment and physician skills, as well as causing discomfort to patients.3,7 The commonly tumor markers used in serological examination, such as CEA, CA199, CA724, CA125, CA242, have a positive detection rate of only 20%~30% in AGC and <10% in EGC. Their sensitivity and specificity are insufficient.8,9 Exploring effective screening methods for EGC has significant clinical implications.
Machine learning, a subset of AI, in combination with clinical laboratory data has shown great promise in aiding the diagnosis, prediction, monitoring, and prognosis of diseases.10 Compared with traditional regression methods, machine learning algorithms are characterized by their superior performance in predicting results within large databases.3,11,12 For example, Wang et al constructed multiple models using 50 features from the blood routine and biochemical detection data for the diagnosis of various circulation system diseases.13 At present, serological examination for tumor diagnosis mainly focuses on the detection of tumor markers, with less attention paid to routine testing items. Blood routine examination is often used for diagnosis of hematological diseases. Biochemical indicators are commonly used for evaluations such as liver and kidney function. There are few reports exploring the relationship between conventional test indicators and EGC. The occurrence of gastric cancer is a complex pathological process involving multiple factors and steps. It is unknown whether this persistent pathological state can be predicted early through a combination of conventional laboratory indicators.
Therefore, this study intends to use machine learning to explore the potential relationship between 75 conventional testing indicators and EGC, establish a diagnostic model composed of routine testing indicators, evaluating its feasibility in early diagnosis of gastric cancer, and to provide clinicians with specialized insights for diagnosis and disease prevention.
Materials and Methods
Data Collection and Preprocessing
After deleting incomplete clinical data, we obtained 73 blood routine, biochemical and tumor marker indicators, as well as their age and gender, totally 75 variables of 1652 patients who came for the Affiliated People’s Hospital of Jiangsu University for treatment. In addition to the control samples, we also collected pathological information from patients with early gastric cancer (EGC) and advanced gastric cancer (AGC), including tumor distribution area, differentiation degree, histological type, lymph node involvement, invasion depth, tumor size, and TNM stage. For the classification indicators of gender and pathological information, we transformed them into dummy variables using the “dummyVars” function in subsequent analysis. In addition, we used the R package “missForest” to fill in missing information. We used R package “tableone” to statistically analyze the gender, age, and 73 indicators of all patients. Binary logistic regression was used to identify risk factors for early gastric cancer. The R package “autoReg” was used to calculate the odds ratios (ORs) and 95% confidence intervals (CIs) for each indicator, and establish different prediction models.
Model Training and Evaluation
All samples were randomly divided into a training set and a validation set according to the principle of 6:4. We used five machine learning methods, including extreme gradient boosting (XGBoost), random forest (RF), support vector machine-recursive feature elimination (SVM-RFE), light gradient boosting machine (LGBM), and recursive partitioning (rpart) to construct diagnostic models for 75 variables. During the training process, 10 cross validations were conducted for each model to maintain its stability, and random search was used to select the best hyperparameters. We ranked the importance of each feature in the model after adjusting the optimal parameters for 5 machine learning methods, and divided the 75 variables into 5 levels (A-E) based on their importance from high to low. We selected features that were at the (A, B, C) level among at least three methods as the filtered features. In the validation set, the F1 score, area under the receiver operating characteristic curve (AUROC), sensitivity and specificity were used to evaluate each model comprehensively. We also compared the performance differences of different prediction models, and conducted difference tests. DCA curve and calibration curve were used to assess models. We will upload all the code used in this analysis to GitHub (https://github.com/Bon-jour/Identification-of-Early-Gastric-Cancer-Markers.git) for further discussion.
Results
Clinical Baseline Characteristics
A total of 1652 patients were included in the study (male/female: 934/718), with average age of 59.96±13.92 years old. According to their states of illnesses, they were divided into three groups including healthy controls (n=616), early gastric cancer (EGC) patients (n=509), and advanced gastric cancer (AGC) patients (n=527) (Figure 1). The clinical baseline characteristics and 75 variables are summarized (Supplementary Table 1). And the abbreviations of the variables are presented (Supplementary Table 1).
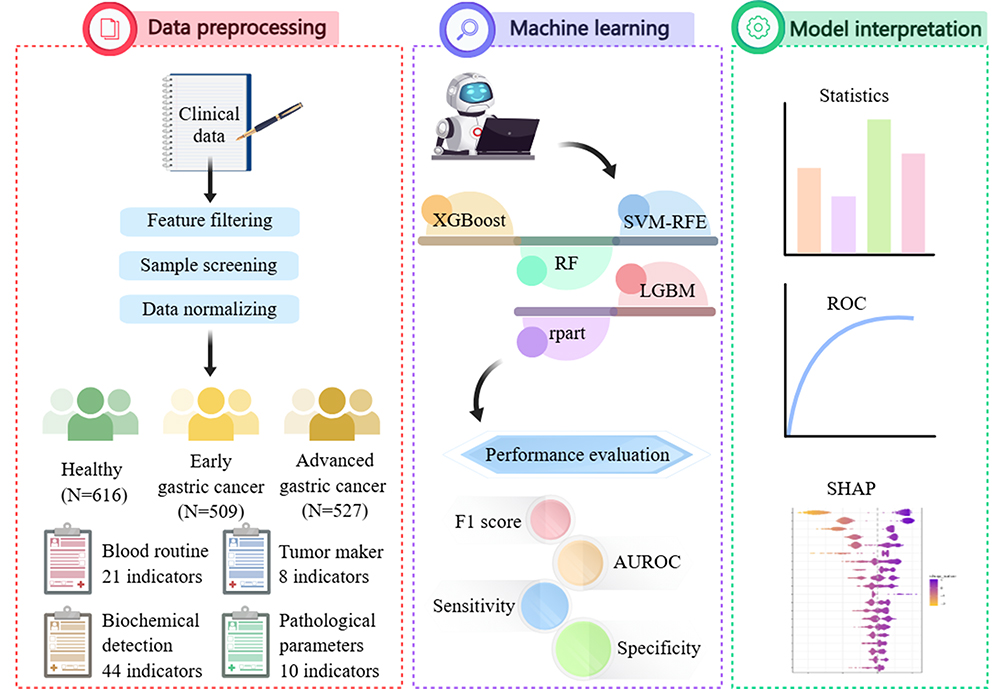 |
Figure 1 Study design. |
Specifically, the proportion of males is significantly higher than that of females (P<0.001) in both EGC (57.8%) and AGC (73.2%) groups (Figure 2A). Traditional tumor markers cannot distinguish EGC patients from healthy individuals, and only AFP, CEA, CA199, CA242 and CA724 have significant statistical significance in the AGC group compared to both the control group and the EGC group (Figure 2B). The expression of inflammatory indicators, such as CRP are increased in GC patients. Especially in the AGC group, the average level of CRP (8.6 ± 17.9 mg/L) is about twice that of normal individuals (4.7 ± 5.4 mg/L) (Figure 2C). The expression of anemia indicators (RBC, HCT, HGB) gradually decreases, while RDW gradually increases, from healthy individuals to the EGC and then the AGC group (Figure 2D). Liver function indicators, such as TP, ALB, GLB and PAB, which reflect the nutritional status of the body, significantly reduce in GC patients (Figure 2E). The expression of liver injury markers (ADA, AFU, ALP and GR) increased in GC patients (Figure 2F). The expression of eGFR showed decrease, while CREA increased in GC patients (Figure 2G). The risk factors for coronary heart disease, the reduction of ApoA1, are also common in patients with GC (Figure 2H).
 |
Figure 2 Identification of differential laboratory indicators with consistent trends in healthy controls, early and advanced gastric cancer patients. (A) Gender. (B) Traditional tumor markers. (C) Inflammatory indicators CRP. (D) Anemia indicators. (E) Liver function indicators. (F) Liver injury indicators. (G) Renal function indicators. (H) Blood lipid indicators. *P < 0.05; **P < 0.01; ***P < 0.001. |
Analysis of Risk or Protective Factors for EGC
We defined the control group as 0 (no event occurred) and the EGC group as 1 (event occurred group). The results of multivariable logistic regression were summarized (Table 1). After multiple tests and corrections (Supplementary Table 2), 4 indicators could serve as protective factors. They were ApoA1 (OR=0.11, P<0.001), eGFR (OR=0.89, P<0.001), AFU (OR=0.91, P=0.017) and CREA (OR = 0.95, P< 0.001). Another 3 indicators could serve as risk factors for EGC. They were male gender (OR=4.06, P<0.001), age (OR=1.08, P<0.001), and GR (OR=1.05, P=0.029). In summary, we found that in addition to age and gender, 5 indicators such as AFU, ApoA1, eGFR, CREA and GR in blood examination were expected to become risk or protective factors for EGC (Table 1).
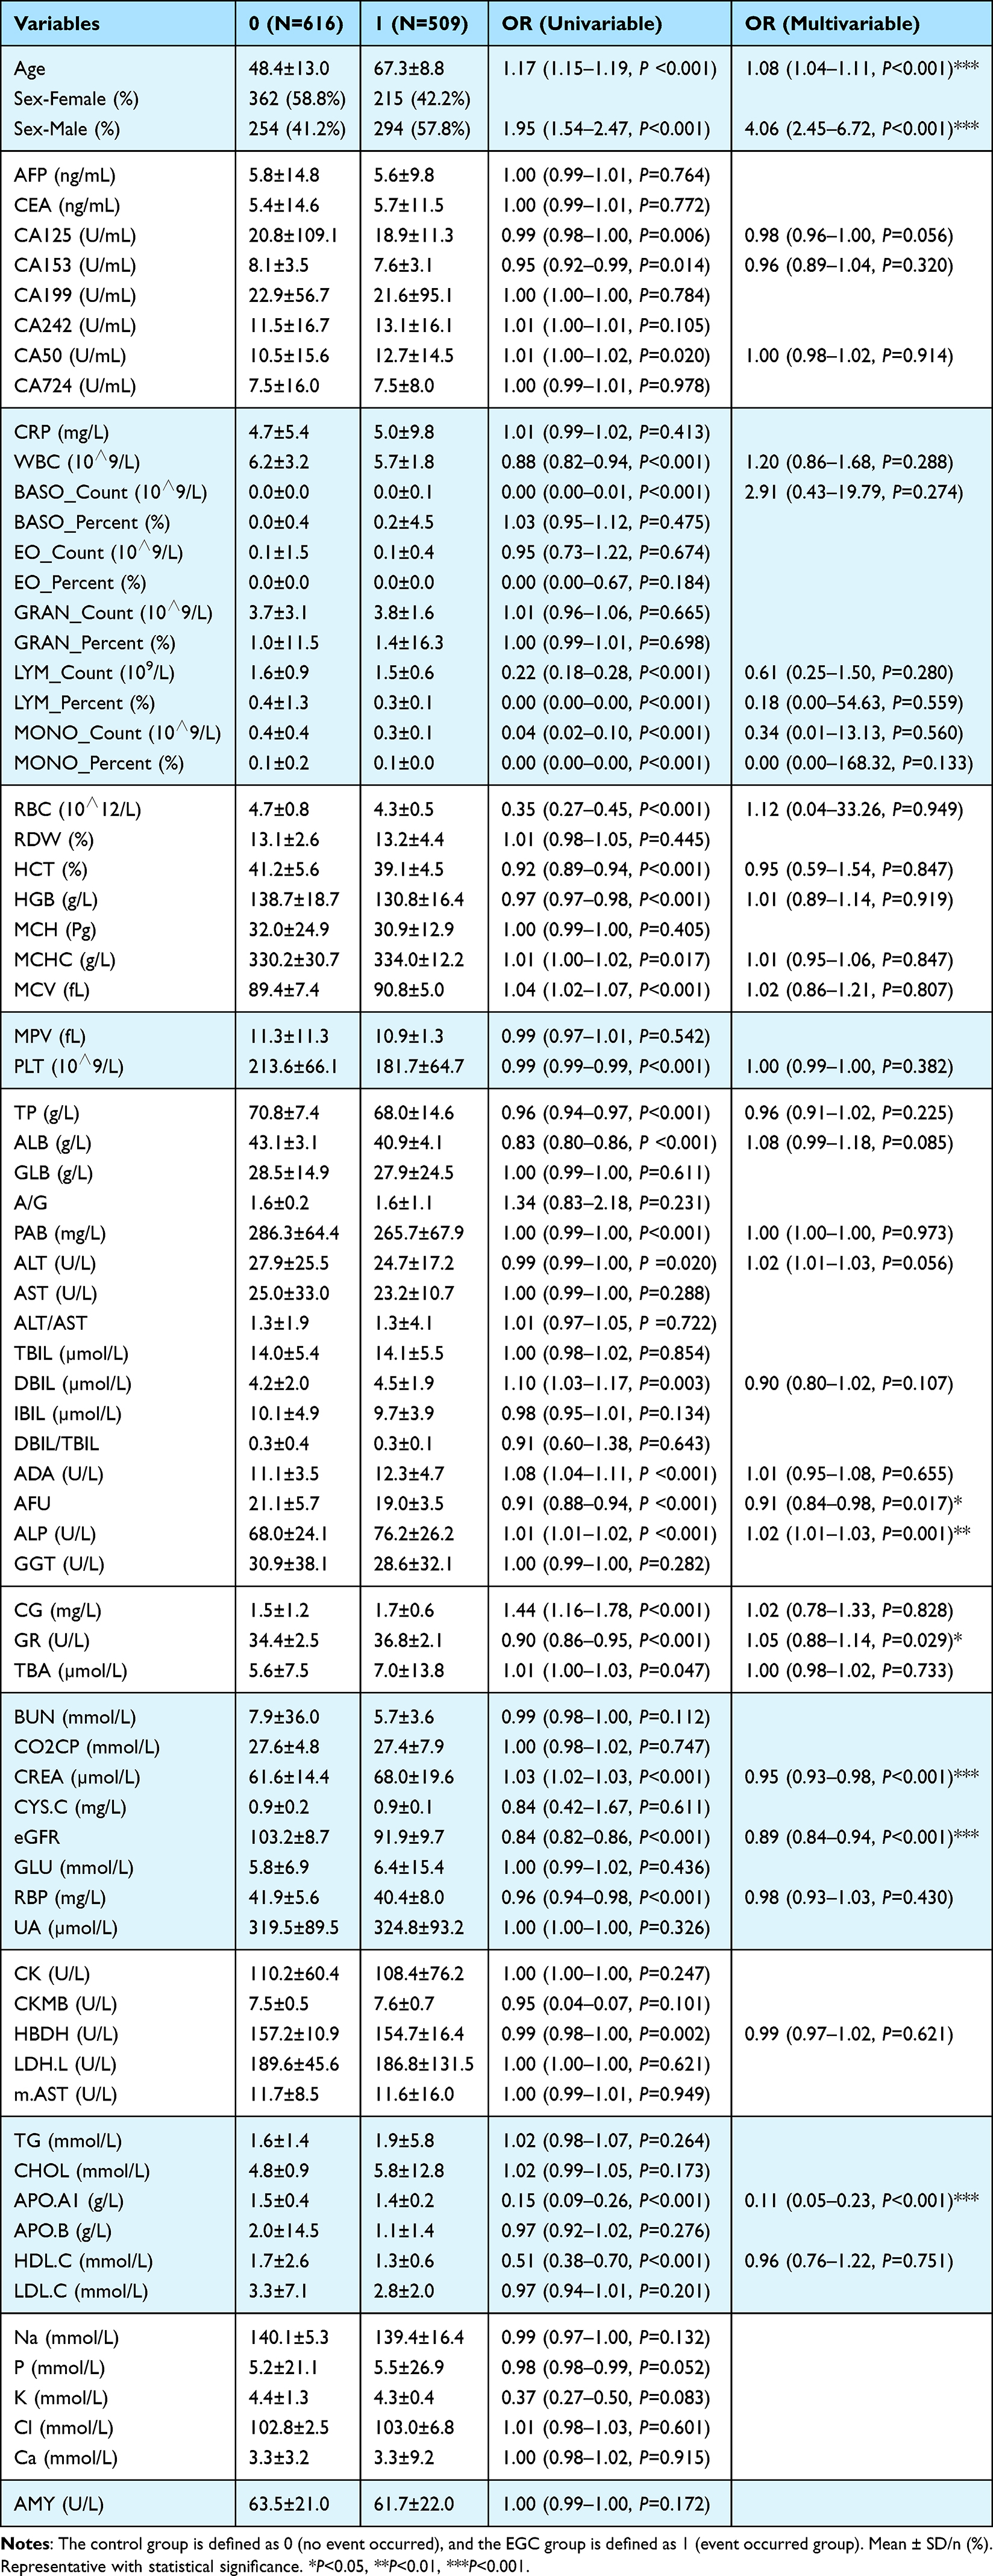 |
Table 1 The Logistic Regression Results of Multivariable |
Machine Learning Models for EGC Diagnosis
Due to the difficulty in explaining the relationship between some indicators obtained by traditional logistic regression statistical methods and GC, we consider using machine learning methods to further explore clinical data in order to obtain relatively accurate conclusions. We ranked the importance of 75 variables by using five machine learning methods (XGBoost, RF, SVM-RFE, LGBM, and rpart). To reduce the number of redundant features, we divided the 75 variables into A, B, C, D, and E levels based on their importance distribution. Those variables that were at A or B levels in at least among three methods were selected to construct diagnostic model in the training set, and were used to test the performance of the model in the validation set (Figure 3A). Finally, 26 variables were used as key variables for subsequent analysis. They were age, gender, CK-MB, CRP, Ca, Cl, LYM_Count, Na, eGFR, BASO_Count, LYM_Percent, P, RBP, ALP, AMY, CA724, GR, HDL-C, K, ApoA1, ALB, CA50, AFU, RBC, TP, and CA242. In addition, the importance ranking of the 26 variables was more consistent by using RF, XGBoost, and SVM-RFE training methods (Figure 3B). To balance the model and avoid overfitting, we further adjust the parameters of the training set by using 10-fold cross validation to determine the optimal model parameters. In the test set, XGBoost (AUC: 0.954, 95% CI: 0.915–0.994) and RF (AUC: 0.954, 95% CI: 0.926–0.996) had the highest area under curve (AUC) values compared to other methods, followed by SVM-RFE (AUC: 0.942, 95% CI: 0.912–0.965), rpart (AUC: 0.877, 95% CI: 0.813–0.885), and LGBM (AUC: 0.859, 95% CI: 0.825–0.884) (Figure 3C). A confusion matrix was used to compare the classification results and the actual measured values. The overall performance of the models was detailed in Table 2.
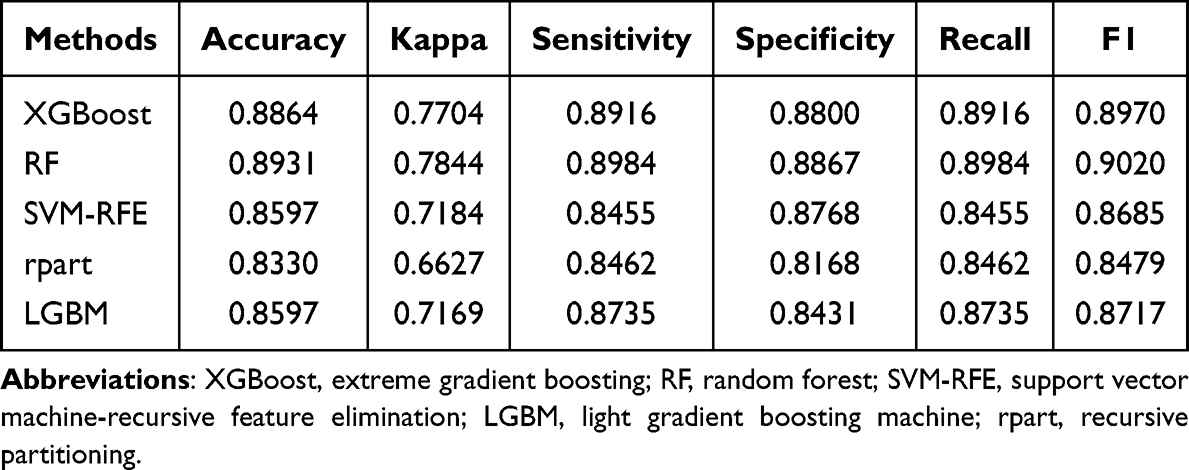 |
Table 2 The Overall Performance of the Machine Learning Models |
 |
Figure 3 Machine learning models for EGC diagnosis. (A) The importance ranking of 75 laboratory indicators by using five machine learning models. (B) The importance ranking of 26 key laboratory indicators by using five machine learning models. (C) ROC curves of five machine learning models in the test set. The data come from all gastric cancer patients. (D) ROC curves of machine learning models. The data come from EGC patients. |
To further identify EGC from AGC better, we operated XGBoost, RF, and SVM models by using the 26 variables. The XGBoost model showed the best diagnostic performance with the AUC was 0.8725 (Figure 3D). Similarly, confusion matrix was used to evaluate the overall performance of the model. XGBoost performed the best: (accuracy: 0.7754, kappa: 0.5501, sensitivity: 0.8057, specificity: 0.7438, recall: 0.8057, and F1: 0.7852) (Table 3). The SHAP analysis was also used to evaluate the importance and contribution of the 26 variables by XGBoost model (Figure 4A). The top 5 variables were GR, CA724 RBC, CA242, and ALB. DCA curve (Figure 4B) and calibration curve (Figure 4C) were used to assess model. The curve of model covered a wide range of threshold values and was located at the top of the clinically relevant threshold range, significantly higher than the Treat All and Treat Non groups. The net profit value shows a clinically significant increase at the critical threshold (Figure 4B). The calibration curve is smooth and closely follows the diagonal, and the confidence interval includes the diagonal (Figure 4C). Therefore, the performance of XGBoost model was good.
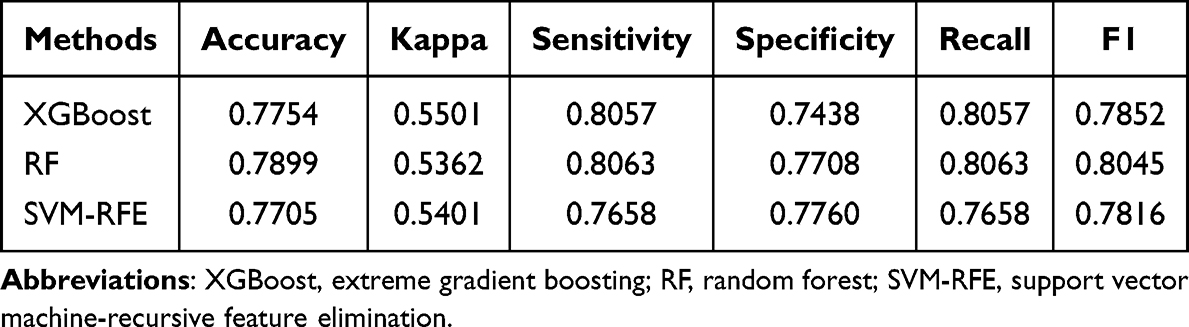 |
Table 3 The Overall Performance Evaluation of Three Machine Learning Models in Early Gastric Cancer Diagnosis Application |
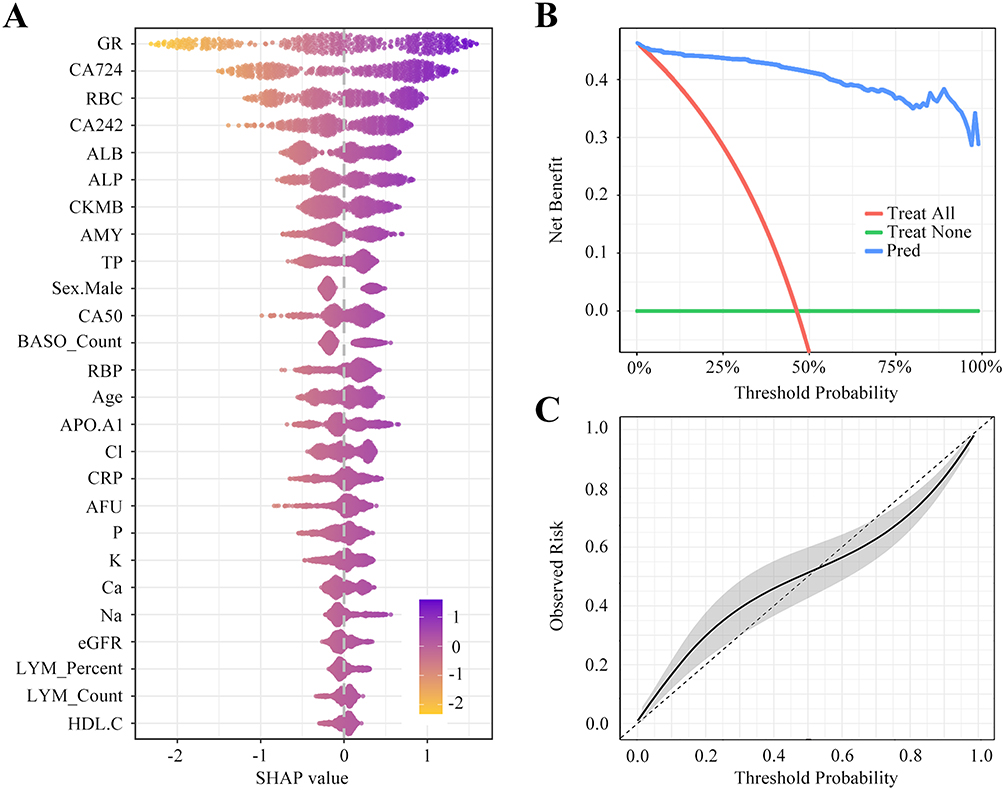 |
Figure 4 SHAP analysis and calibration assessed for XGBoost model. (A) SHAP analysis for XGBoost model. (B) DCA curve analysis. (C) Correction curve analysis. |
In summary, we confirmed that XGBoost, RF, and SVM-RFE models had high potential in the diagnosis of EGC through detailed multidimensional evaluation. These models not only operated effectively in disease screening scenarios with limited data, but also met the clinical demand for high accuracy and recall rate. In addition, the high AUC values of the ROC curve further validate the advantages of these models in ensuring diagnostic reliability, providing a solid scientific foundation for future clinical applications.
Construction of Model Combined with Blood Indicators and Pathological Parameters
We also collected pathological parameters in addition to blood indicators, including tumor size, tumor distribution area, degree of differentiation, histological type, lymph node metastasis status, depth of infiltration and TNM stage. The results of univariate, multivariate logistic regression analysis (Table 4) and multiple comparison corrections (Supplementary Table 3) showed that the diameter of tumor tissue less than 2 mm occurred more frequently in EGC patients, was a risk factor for the occurrence of the event (P<0.001). The diameter of tumor tissue in the AGC group was usually greater than 5 mm. In addition, EGC was usually in T2 phase (Table 4, and Supplementary Table 3). Combining blood indicators and pathological parameters, the AUC of XGBoost model was 0.9909 (Figure 5A). SHAP analysis showed that in XGBoost model, the top 5 variables were depth of invasion, tumor size, lymph node metastasis, GR and tumor stage (Figure 5B and C).
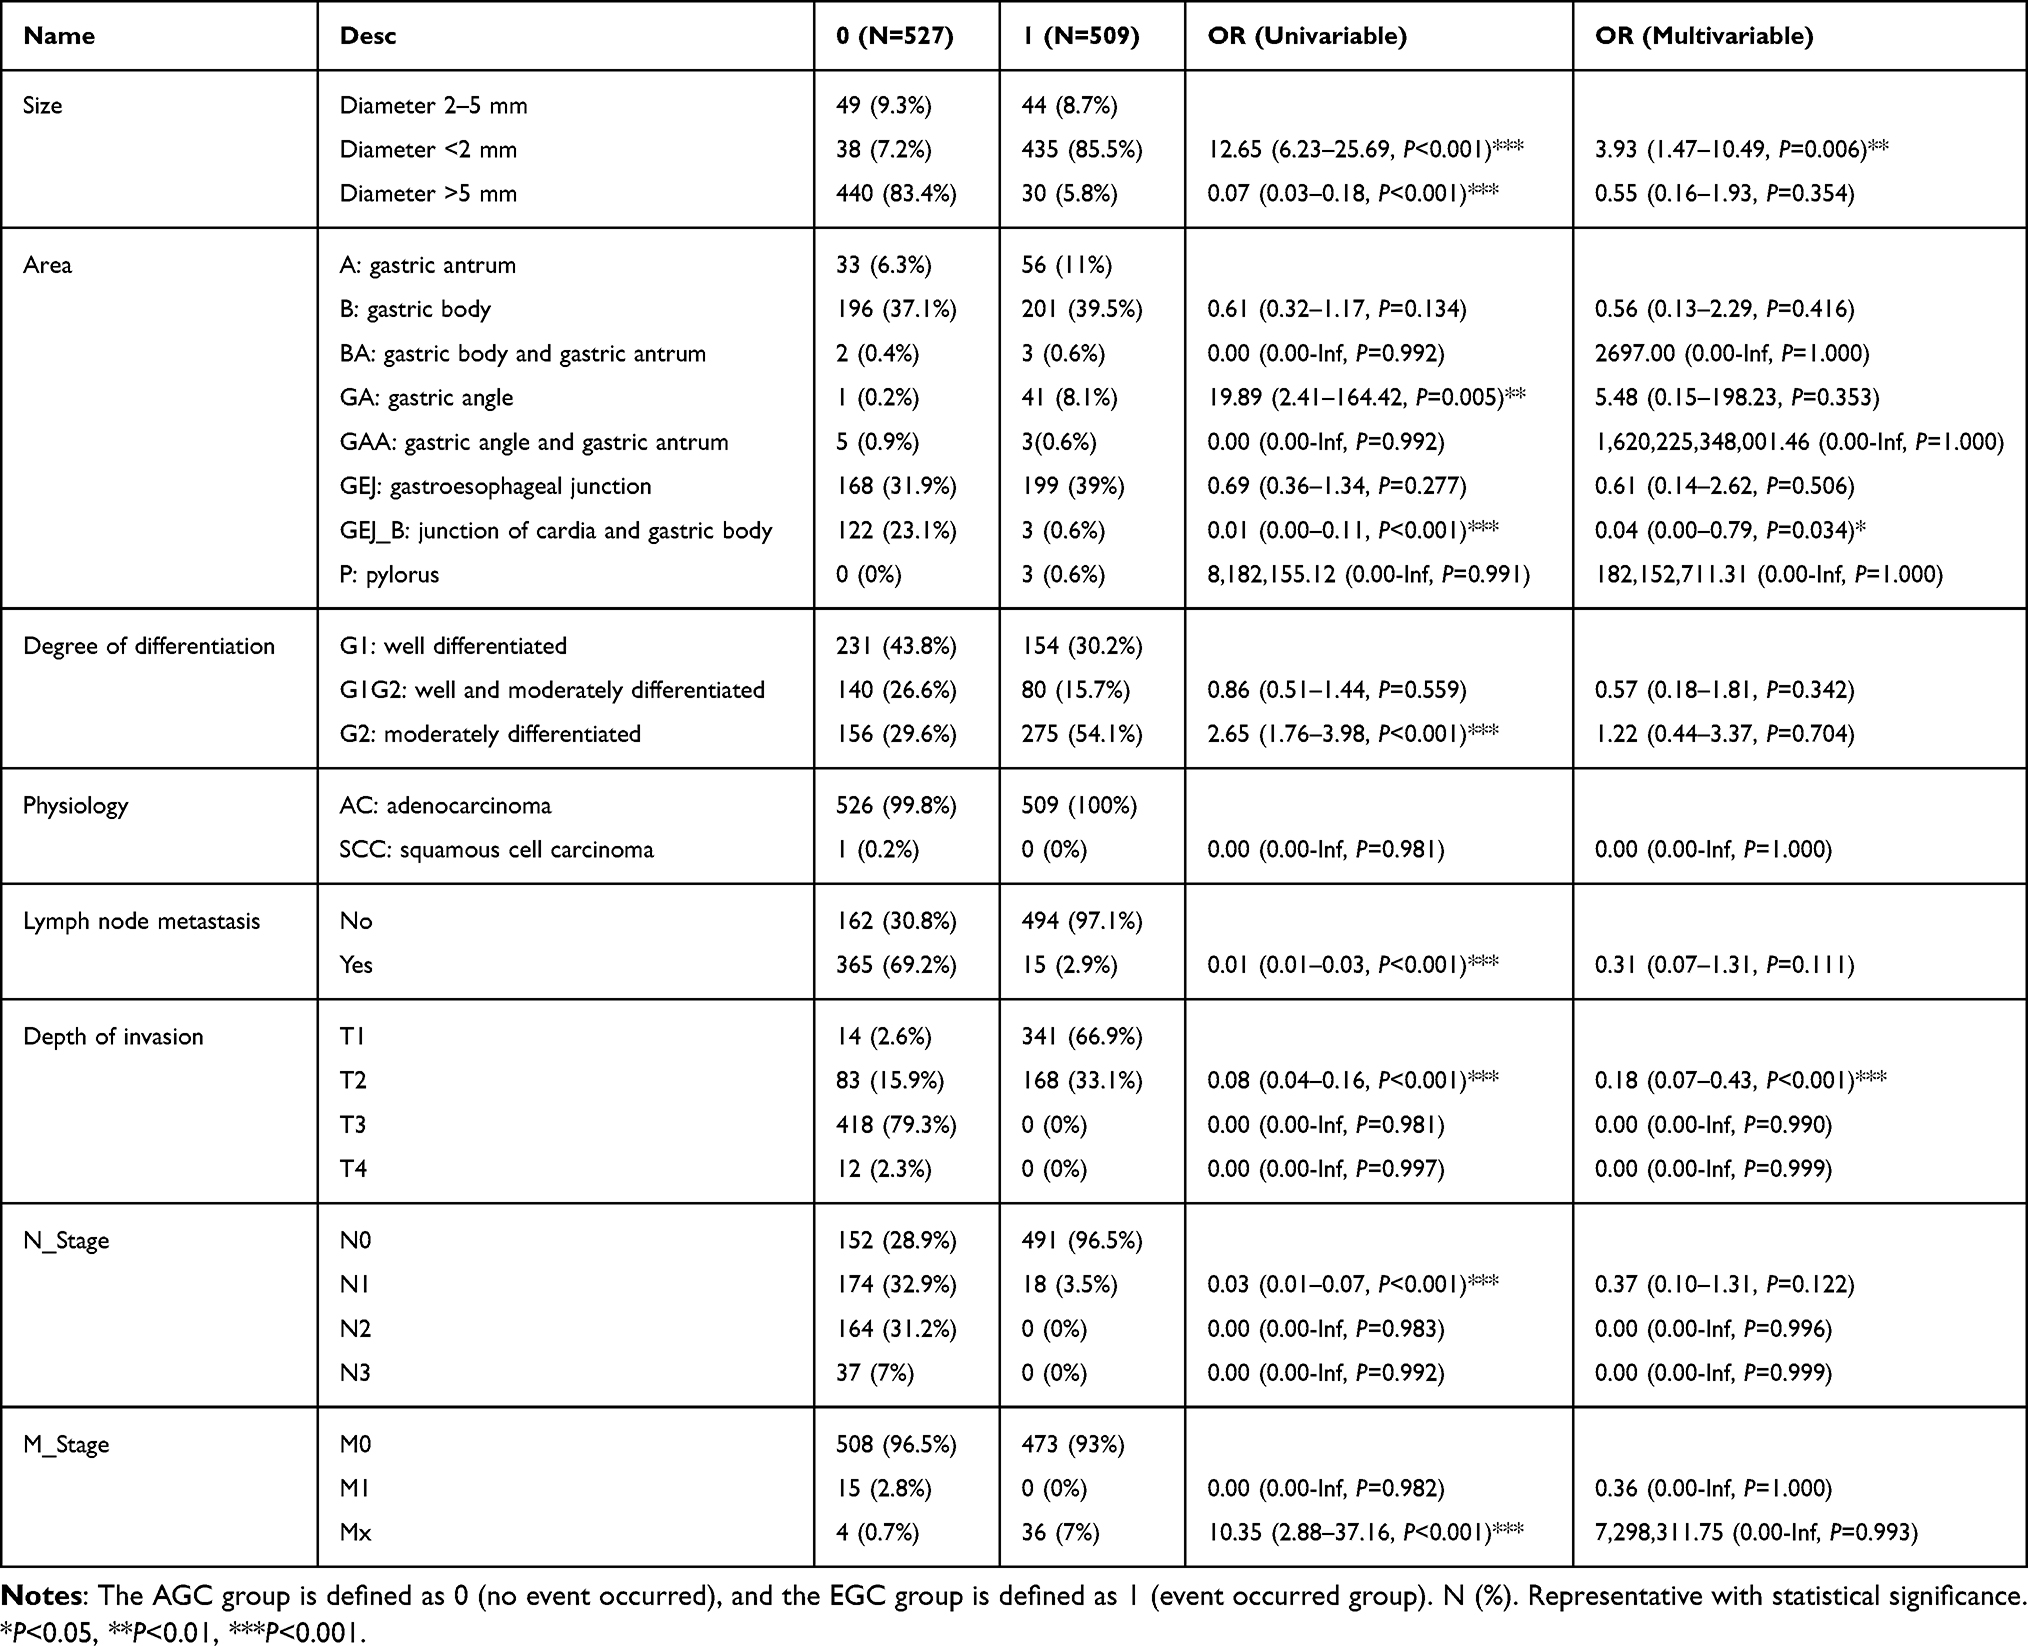 |
Table 4 Results of Single-Factor Logistic Regression and Multivariable Logistic Regression Analysis |
 |
Figure 5 Construction of model combined with blood indicators and pathological parameters. (A) ROC curves of XGBoost model combining blood indicators and clinical pathological parameters. (B) Scatter plot presenting SHAP analysis for XGBoost model combining blood indicators and pathological parameters. (C) Bar chart presenting SHAP analysis of XGBoost model combined with blood indicators and pathological parameters. |
Discussion
The majority of gastric cancer patients in China are diagnosed in the mid to late stages. This situation called over 400,000 deaths of gastric cancer cases annually, which underscores the importance of early diagnosis in improving patient prognoses.14 Limitations of standard diagnostic methods for gastric cancer, such as endoscopic examination, have spurred the development of more effective and precise early diagnostic technologies to enable timely therapeutic interventions. Machine learning uses algorithms to identify patterns in data and makes predictions on new data.15,16 This technology has become a powerful tool for solving complex medical problems in recent years. In this study, the data of 1036 patients with gastric cancer were analyzed by using machine learning algorithms to help identify EGC patients. This study integrated blood routine indicators, biochemical indicators, traditional tumor indicators, and pathological parameters, to analyze the risk factors of EGC, and establish a predictive diagnostic model for early diagnosis of gastric cancer. By deeply analyzing the biological significance of key variables, not only the clinical acceptance of the model could be improved, but clinical treatment strategies could also be optimized, thereby improving the treatment outcomes and quality of life of gastric cancer patients.
After screening out 26 key variables, our research used 5 different machine learning algorithms to classify. Compared with other models, the XGBoost algorithm had better performance and higher stability, and the AUC of the optimal model was 0.9909. In the evaluation of the importance of model variables, the top five indicators were GR, CA724, RBC, CA242, and ALB. GR is an important component of the human redox system. It uses nicotinamide adenine dinucleotide phosphate (NADPH) as a subunit to catalyze the formation of reduced glutathione (GSH) from oxidized glutathione (GSSG), which is beneficial for the body’s antioxidant function.17 At present, the clinical application of GR is mainly reported in hepatitis, cirrhosis, and metastatic liver cancer.18 Although there was study showed that the expression of GR was significantly higher in gastric cancer tissue than in tissue adjacent to cancer.19 But to our knowledge, it’s the first time to report the relationship between the expression of GR in serum and EGC. The increased activity of GR in tumor cells may be related to the increased metabolic demands of tumor cells. GR helps tumor cells to resist oxidative stress and chemotherapy drug toxicity by maintaining GSH levels.20 Further research is needed to understand the biological and clinical importance of GR in gastric cancer. CA724 and CA242 are laboratory markers for detecting gastric cancer and various digestive tract cancers, and they are also non-specific tumor markers. Their joint application with other indicators is particularly important. Additionally, RBC is an important indicator for diagnosing anemia. Anemia is a common complication of gastric cancer. A meta-analysis involving 13154 cases of gastric cancer found that approximately 36% of patients had anemia at the time of definitive diagnosis, and preoperative anemia levels were correlated with prognosis.21 The rapid growth of malignant tumor cells consumes a large amount of nutrients in the body, and the toxic substances produced by tumor necrosis causing metabolic disorders in the body, leading to a decrease in liver cell synthesis of ALB.22,23 The joint analysis of these testing can maximize diagnostic efficiency of gastric cancer.
As for clinical pathological parameters, the depth of invasion is a key factor in determining whether it is EGC. Although there were also cases of EGC that were limited to the mucosa and submucosa but had a larger area. Most EGC lesions had a tumor diameter of less than 2 mm. Taking into account serological indicators and pathological parameters, the serum expression level of GR also ranks among the top 5, indicating its importance in diagnosis.
This study demonstrates the feasibility of using machine learning models based on laboratory indicators for early diagnosis of gastric cancer. Through machine learning technology, exploring the implicit connections between laboratory indicators and diseases can undoubtedly provide more valuable diagnostic opinions for clinical practice. However, it was a single-center design, absence of external validation, and circularity of using post-surgical pathological parameters were downplayed. The next step of the study needs to conduct multi-center prospective research for external verification to further improve this machine learning model. We will further develop an automatic clinical scoring system based on nomograms or machine learning in order to provide clinicians with more practical and easy-to-understand tools.
Conclusion
In summary, we compared the performance of five machine learning algorithms, the XGBoost presented the best performance. The model included 26 characteristic variables, and the top five indicators were GR, CA724, RBC, CA242, and ALB. Although the clinical practicality needs to be proven, this study provides confirmatory data support for the preclinical implementation of the model.
Institutional Review Board Statement
This study was approved by the Ethics Committee of The Affiliated People’s Hospital of Jiangsu University (No. K-20220148-Y). All the study procedures were performed in accordance with the tenets of the Declaration of Helsinki.
Data Sharing Statement
Technical appendix, statistical code, and dataset available upon reasonable request to the corresponding author at [email protected].
Informed Consent Statement
Before formally entering the study, all participants signed written informed consent forms.
Acknowledgments
Special thanks to Canbiao Wang (RealThinking Biotechnologies, Getang Avenue 11, Nanjing, 210002, China) for making significant contributions to the data statistics in this article.
Author Contributions
All authors made a significant contribution to the work reported, whether that is in the conception, study design, execution, acquisition of data, analysis and interpretation, or in all these areas; took part in drafting, revising or critically reviewing the article; gave final approval of the version to be published; have agreed on the journal to which the article has been submitted; and agree to be accountable for all aspects of the work.
Funding
This work was supported by Zhenjiang Science & Technology Program (JC2024030), Clinical research project funded by The Affiliated People’s Hospital of Jiangsu University (Y2022007-Z).
Disclosure
The authors declare that they have no conflicts of interest in this work.
References
1. Yasuda T, Wang YA. Gastric cancer immunosuppressive microenvironment heterogeneity: implications for therapy development. Trends Cancer. 2024;10(7):627–13. doi:10.1016/j.trecan.2024.03.008
2. Smyth EC, Nilsson M, Grabsch HI, van Grieken NC, Lordick F. Gastric cancer. Lancet. 2020;396(10251):635–648. doi:10.1016/S0140-6736(20)31288-5
3. Tian H, Ning Z, Zong Z, et al. Application of machine learning algorithms to predict lymph node metastasis in early gastric cancer. Front Med Lausanne. 2022;8:759013. doi:10.3389/fmed.2021.759013
4. Conti CB, Agnesi S, Scaravaglio M, et al. Early Gastric Cancer: update on prevention, diagnosis and treatment. Int J Environ Res Public Health. 2023;20(3):2149. doi:10.3390/ijerph20032149
5. Yao K, Uedo N, Kamada T, et al. Guidelines for endoscopic diagnosis of early gastric cancer. Dig Endosc. 2020;32(5):663–698. doi:10.1111/den.13684
6. Wang Z, Wu Q. Advancements in non-invasive diagnosis of gastric cancer. World J Gastroenterol. 2025;31(6):101886. doi:10.3748/wjg.v31.i6.101886
7. Ma XZ, Zhou N, Luo X, Guo SQ, Mai P. Update understanding on diagnosis and histopathological examination of atrophic gastritis: a review. World J Gastrointest Oncol. 2024;16(10):4080–4091. doi:10.4251/wjgo.v16.i10.4080
8. Ma S, Zhou M, Xu Y, et al. Clinical application and detection techniques of liquid biopsy in gastric cancer. Mol Cancer. 2023;22(1):7. doi:10.1186/s12943-023-01715-z
9. Li Y, Wang JS, Guo Y, Zhang T, Li LP. Use of the alkaline phosphatase to prealbumin ratio as an independent predictive factor for the prognosis of gastric cancer. World J Gastroenterol. 2020;26(44):6963–6978. doi:10.3748/wjg.v26.i44.6963
10. Chen Y, Wang B, Zhao Y, et al. Metabolomic machine learning predictor for diagnosis and prognosis of gastric cancer. Nat Commun. 2024;15(1):1657. doi:10.1038/s41467-024-46043-y
11. Du H, Yang Q, Ge A, Zhao C, Ma Y, Wang S. Explainable machine learning models for early gastric cancer diagnosis. Sci Rep. 2024;14(1):17457. doi:10.1038/s41598-024-67892-z
12. Spanish EURECCA Esophagogastric Cancer Group, Pera M, Gibert J, Gimeno M, et al. Machine learning risk prediction model of 90-day mortality after gastrectomy for cancer. Ann Surg. 2022;276(5):776–783. doi:10.1097/SLA.0000000000005616
13. Wang Z, Gu Y, Huang L, et al. Construction of machine learning diagnostic models for cardiovascular pan- disease based on blood routine and biochemical detection data. Cardiovasc Diabetol. 2024;23(1):351. doi:10.1186/s12933-024-02439-0
14. Zhu H, Wang G, Zheng J, et al. Preoperative prediction for lymph node metastasis in early gastric cancer by interpretable machine learning models: a multicenter study. Surgery. 2022;171(6):1543–1551. doi:10.1016/j.surg.2021.12.015
15. Seo JW, Park KB, Lim ST, Jun KH, Chin HM. Machine learning models for prediction of lymph node metastasis in patients with T1b gastric cancer. Am J Cancer Res. 2024;14(8):3842–3851. doi:10.62347/KREL8138
16. Wang Z, Liu Y, Niu X. Application of artificial intelligence for improving early detection and prediction of therapeutic outcomes for gastric cancer in the era of precision oncology. Semin Cancer Biol. 2023;93:83–96. doi:10.1016/j.semcancer.2023.04.009
17. Xu FL, Wu XH, Chen C, et al. SLC27A5 promotes sorafenib-induced ferroptosis in hepatocellular carcinoma by downregulating glutathione reductase. Cell Death Dis. 2023;14(1):22.
18. Hong KS, Pagan K, Whalen W, et al. The role of glutathione reductase in influenza infection. Am J Respir Cell Mol Biol. 2022;67(4):438–445. doi:10.1165/rcmb.2021-0372OC
19. Rzymowska J. The effect of low temperature on the enzyme activities and the level of SH groups in benign gastric ulcer and gastric carcinoma. J Pharm Pharmacol. 1994;46(6):517–518. doi:10.1111/j.2042-7158.1994.tb03841.x
20. Brzozowa-Zasada M, Piecuch A, Bajdak-Rusinek K, et al. Glutathione reductase expression and its prognostic significance in colon cancer. Int J Mol Sci. 2024;25(2):1097. doi:10.3390/ijms25021097
21. Huang XZ, Yang YC, Chen Y, et al. Preoperative anemia or low hemoglobin predicts poor prognosis in gastric cancer patients: a Meta-Analysis. Dis Markers. 2019;2019:7606128. doi:10.1155/2019/7606128
22. Aday U, Tatlı F, Akpulat FV, et al. Prognostic significance of pretreatment serum lactate dehydrogenase-to-albumin ratio in gastric cancer. Contemp Oncol. 2020;24(3):145–149. doi:10.5114/wo.2020.100219
23. Gupta D, Lis CG. Pretreatment serum albumin as a predictor of cancer survival: a systematic review of the epidemiological literature. Nutr J. 2010;9(1):69. doi:10.1186/1475-2891-9-69
 © 2026 The Author(s). This work is published and licensed by Dove Medical Press Limited. The
full terms of this license are available at https://www.dovepress.com/terms
and incorporate the Creative Commons Attribution
- Non Commercial (unported, 4.0) License.
By accessing the work you hereby accept the Terms. Non-commercial uses of the work are permitted
without any further permission from Dove Medical Press Limited, provided the work is properly
attributed. For permission for commercial use of this work, please see paragraphs 4.2 and 5 of our Terms.
© 2026 The Author(s). This work is published and licensed by Dove Medical Press Limited. The
full terms of this license are available at https://www.dovepress.com/terms
and incorporate the Creative Commons Attribution
- Non Commercial (unported, 4.0) License.
By accessing the work you hereby accept the Terms. Non-commercial uses of the work are permitted
without any further permission from Dove Medical Press Limited, provided the work is properly
attributed. For permission for commercial use of this work, please see paragraphs 4.2 and 5 of our Terms.
Recommended articles
Cuproptosis-Related Biomarkers and Characterization of Immune Infiltration in Sepsis
Wang Y, Qiu X, Liu J, Liu X, Pan J, Cai J, Liu X, Qu S
Journal of Inflammation Research 2024, 17:2459-2478
Published Date: 22 April 2024
Identification of Mitophagy-Associated Genes for the Prediction of Metabolic Dysfunction-Associated Steatohepatitis Based on Interpretable Machine Learning Models
Deng B, Chen Y, He P, Liu Y, Li Y, Cai Y, Dong W
Journal of Inflammation Research 2024, 17:2711-2730
Published Date: 3 May 2024
Identification of Senescence-Related Genes for the Prediction of Ulcerative Colitis Based on Interpretable Machine Learning Models
Ma J, Chen C, Wang N, Fang T, Liu Y, He P, Dong W
Journal of Inflammation Research 2025, 18:3431-3447
Published Date: 10 March 2025
Identification of Disulfidptosis-Related Genes and Molecular Subgroups in Rheumatoid Arthritis for Diagnostic Model and Patient Stratification
Liu X, Wang S, Du X, Wang Y, Mo L, Li H, Qu Z, Wang X, Sun J, Li Y, Wang J
Journal of Inflammation Research 2025, 18:4157-4175
Published Date: 19 March 2025
Integrated Bioinformatics and Experimental Validation Reveal Macrophage Polarization-Related Biomarkers for Osteoarthritis Diagnosis
He Q, Liu L, Hu X, Lin L, Song Z, Xia Y, Lin Q, Wei J, Li S
Journal of Multidisciplinary Healthcare 2025, 18:4589-4612
Published Date: 1 August 2025