Back to Journals » Journal of Multidisciplinary Healthcare » Volume 18
Integrated Bioinformatics and Experimental Validation Reveal Macrophage Polarization-Related Biomarkers for Osteoarthritis Diagnosis
Authors He Q ![]() , Liu L, Hu X
, Liu L, Hu X ![]() , Lin L, Song Z
, Lin L, Song Z ![]() , Xia Y
, Xia Y ![]() , Lin Q, Wei J, Li S
, Lin Q, Wei J, Li S
Received 29 April 2025
Accepted for publication 17 July 2025
Published 1 August 2025 Volume 2025:18 Pages 4589—4612
DOI https://doi.org/10.2147/JMDH.S537507
Checked for plagiarism Yes
Review by Single anonymous peer review
Peer reviewer comments 3
Editor who approved publication: Dr Scott Fraser
Qiwang He,1,* Lingling Liu,2,* Xinyu Hu,1,* Lixia Lin,3 Zhenyu Song,4 Yuyang Xia,1 Qianming Lin,1 Jihua Wei,5 Shanlang Li5
1Hubei University of Chinese Medicine, Hubei Shizhen Laboratory, Wuhan, 430061, People’s Republic of China; 2Women and Children’s Hospital, Qingdao University, Qingdao, 266034, People’s Republic of China; 3The First Affiliated Hospital of Guangxi University of Chinese Medicine, Guangxi University of Chinese Medicine, Nanning, 530022, People’s Republic of China; 4The second Affiliated Hospital of Guilin Medical University, Guilin, 541000, People’s Republic of China; 5Key Laboratory of Clinical Cohort Research on Bone and Joint Degenerative Diseases of Guangxi, Department of Orthopedics, Affiliated Hospital of Youjiang Medical University for Nationalities, Baise, 533000, People’s Republic of China
*These authors contributed equally to this work
Correspondence: Shanlang Li; Jihua Wei, Email [email protected]; [email protected]
Purpose: Osteoarthritis (OA) is the most common type of arthritis and early detection is crucial to improving prognosis. In this study, we identified crucial genes associated with macrophage polarization in OA and constructed a diagnostic model to provide novel insights for diagnostic and therapeutic strategies.
Methods: The GSE55235 and GSE55457 datasets were merged through the GEO database to identify genes related to macrophage polarization by conducting weighted gene co-expression network analysis (WGCNA) and differential expression analysis. Least absolute shrinkage and selection operator (LASSO), random forest (RF), and support vector machine recursive feature elimination (SVM-RFE) algorithms were used to identify hub genes and construct a diagnostic model validated through internal datasets and multiple external bulk RNA-seq and single-cell RNA-seq data. Additionally, various analyses, including immune infiltration, gene set enrichment analysis, competing endogenous RNA (ceRNA) construction, and drug prediction, were conducted. Finally, clinical samples were clinically validated through RT-qPCR (OA: Control = 10: 5) and IHC (6: 5) experiments.
Results: Three hub genes (MYC, SIK1, and NFIL3) were identified, and the diagnostic model constructed using them demonstrated good diagnostic efficacy in both internal and external datasets (internal AUC = 0.965, external AUC = 0.847). In vitro experiments revealed that the hub genes in the synovial tissue of OA patients were significantly down-regulated (P < 0.01), confirming their potential as diagnostic biomarkers.
Conclusion: We constructed an OA diagnostic model related to macrophage polarization through comprehensive bioinformatics analysis, and the results indicated that these genes have high diagnostic value. However, further clinical studies and experimental assessments are needed to validate these findings.
Keywords: osteoarthritis, macrophage polarization, diagnostic model, machine learning
Introduction
Osteoarthritis (OA), which primarily manifests as the disruption of articular cartilage integrity and the subchondral bone plate at the joint margin, is the most prevalent type of arthritis.1 OA commonly manifests as joint pain, stiffness, edema, and limited mobility, serving as a leading cause of discomfort and incapacity in adults. Additionally, OA can lead to emotional disorders like depression and anxiety, alterations in sleep patterns, chronic widespread pain, and impaired coping abilities, resulting in a decrease in overall bodily functions.2,3 As of 2020, the proportion of individuals aged 30 years and above globally suffering from some form of OA has reached 14.8%, which is a threefold increase compared to the 4.8% of OA patients in the global population affected by OA in 1990.4 This percentage is projected to continue increasing over the next two decades, with the number of individuals affected by knee osteoarthritis (KOA) alone potentially reaching 642 million by 2050. Existing research has made significant progress in the identification of OA molecular biomarkers, such as IL-6, COMP, and PIIANP, but there are still problems such as low specificity, low sensitivity, and insufficient ease of operation.5–7 Therefore, further research is needed to achieve practical application or effective control of OA diagnosis.
The immune system plays a variety of roles in the pathological process of OA patients, such as changes in synovial lymphoid structure, circulating autoantibodies, and memory T cell and B cell populations.8,9 Macrophage polarization refers to the activation of macrophages at specific spatial and temporal points, which leads them to exhibit distinct functional phenotypes and characteristics. Macrophages have a number of roles in the resolution of inflammation, including assisting immune cells in removing foreign objects, facilitating tissue repair, and ultimately restoring tissue homeostasis.10 Macrophage polarization is typically categorized into two classic phenotypes: M1 and M2. Generally, M1 macrophages are pro-inflammatory, whereas M2 macrophages exhibit anti-inflammatory properties, tissue repair capabilities, and immunosuppressive characteristics. Zhang et al compared synovial tissues from OA patients with those from healthy individuals and found that enhanced synovial M1 macrophage polarization contributes to increased OA severity.11 Zheng et al found that D0 exosomes can effectively slow the course of OA by polarizing macrophage responses towards the M2 phenotype and causing mitochondrial dysfunction.12 Wu et al reported that inhibition of the potassium channel Kv1.3 in umbilical cord mesenchymal stem cells can effectively suppress the polarization of macrophages toward the M1 phenotype and attenuate OA development via modulation of the PI3K/Akt axis.13 Qian et al found that miR-26b-5p derived from mouse M2 macrophages can protect articular cartilage in mice with OA by inhibiting chondrocyte hypertrophy via the targeting of TLR3/COL10A1.14 These findings underscore the significant involvement of macrophage polarization in the pathological processes underlying OA. Therefore, whether it is possible to explore a new sensitive diagnostic model through macrophage polarization is of great significance for the diagnosis of OA.
In this study, we developed a comprehensive workflow diagram to depict the essential stages involved (Figure 1). Initially, we identified OA-related differentially expressed genes (DEGs), intersected them with the core modules from weighted gene co-expression network analysis (WGCNA), then intersected the results with macrophage polarization-related genes. Next, we selected hub genes via three machine learning methodologies: Least Absolute Shrinkage and Selection Operator (LASSO), Random Forest (RF), and Support Vector Machine Recursive Feature Elimination (SVM-RFE). Then, a diagnostic model was constructed grounded in the hub genes and the model was validated using internal and external datasets and by conducting experiments.
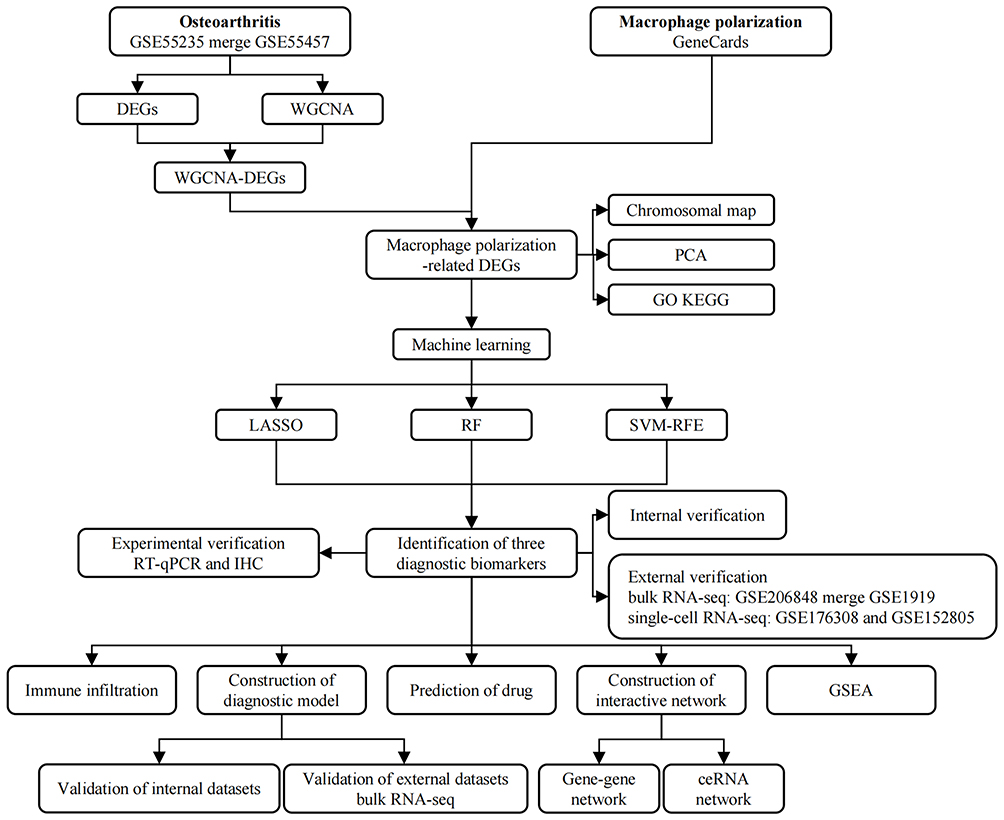 |
Figure 1 The flowchart of this study. |
Materials and Methods
This study conducted data analysis from December 2024 to January 2025, and experimental validation from February to March 2025.
Data Collection and Processing
We searched the GEO database (https://www.ncbi.nlm.nih.gov/geo/) utilizing the term “osteoarthritis” to obtain datasets related to OA (Table 1); we also searched the GeneCards database (https://www.genecards.org/) using the term “macrophage polarization” to obtain genes related to macrophage polarization. The datasets GSE55235 and GSE55457 were downloaded from GPL96 as internal datasets (bulk RNA-seq) and the datasets GSE206848 and GSE1919 were downloaded from GPL570 as external datasets (bulk RNA-seq). We also downloaded the datasets GSE176308 and GSE152805 from GPL18573 and GPL20301, respectively, as external datasets for validation at the single-cell dimension.
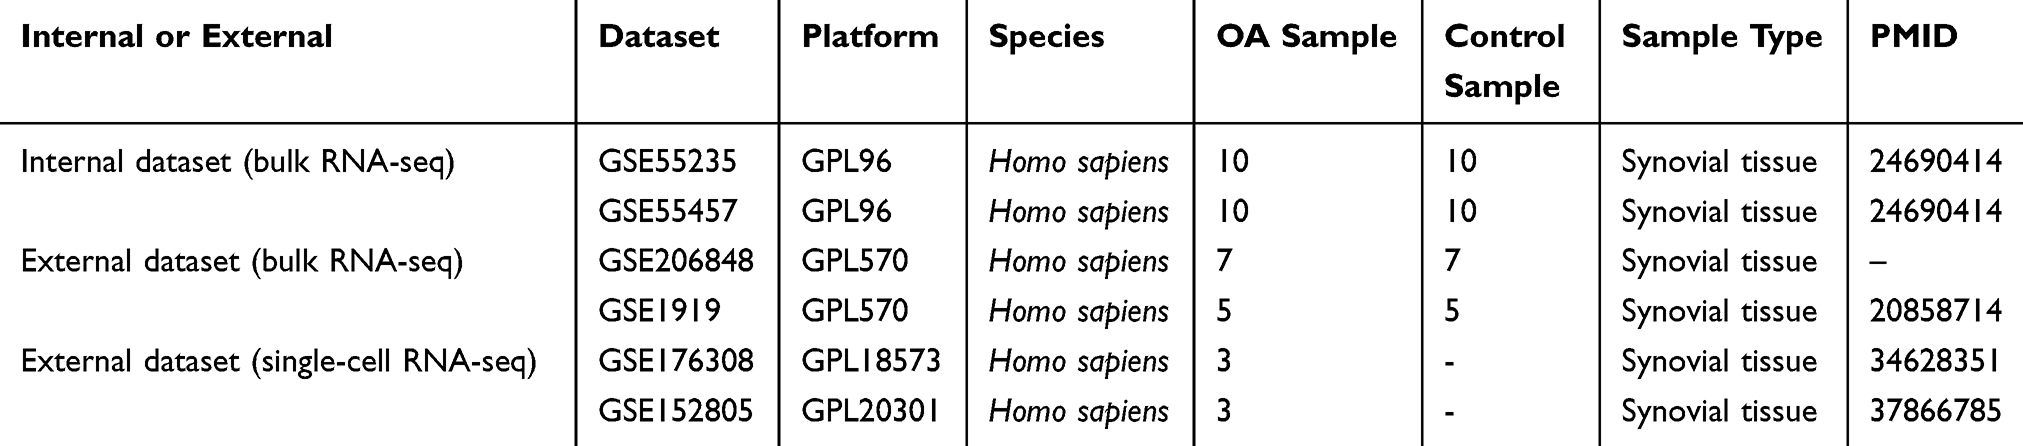 |
Table 1 Information on OA-Related Datasets |
The “sva” package in R was utilized to merge the internal dataset, resulting in a combined dataset containing 20 disease samples and 20 control samples. The “limma” package was utilized to analyze DEGs, with the differential screening criteria: | log2FC | > 2.0, adj. P < 0.05. Moreover, the externally validated bulk RNA-seq dataset was merged using the “sva” package, resulting in a combined dataset containing 12 disease samples and 12 control samples.
The “Seurat” package was utilized to perform data quality control on the single-cell datasets (nCount ≤ 20000, nFeature ≤ 4000, and mitoRatio ≤ 0.15). Then, the “CCAIntegration” method in the “IntegrateLayers” function was used for sample integration. After performing the principal component analysis (PCA) for dimensionality reduction, an unsupervised clustering analysis was conducted on the filtered cells utilizing the “FindNeighbors” and “FindClusters” functions. Cell annotation was performed utilizing the outcomes derived from the t-Distributed Stochastic Neighbor Embedding (t-SNE) clustering method and marker genes provided in published studies.15
WGCNA
The “WGCNA” package was used to develop modules associated with OA using gene expression profiles. Initially, the “Pearson correlation coefficient” was determined to establish a similarity matrix. A soft threshold of 15 was subsequently applied to transform the similarity matrix into an adjacency matrix. This adjacency matrix was further processed to create a topological overlap matrix (TOM). Gene modules were delineated through average linkage hierarchical clustering based on the TOM, ensuring that each module comprises at least 100 genes. After the analogous gene modules were consolidated, 11 distinct modules were identified, with the turquoise module identified as the principal module.
Identification of DEGs Related to Macrophage Polarization
The “VennDiagram” package was utilized to identify the intersection between DEGs and the turquoise module, and the intersection of the results with macrophage polarization-related genes was identified. The “circlize” package was used for chromosome localization analysis of the intersected genes. For the identified intersecting genes, PCA and group comparison analysis were performed based on the expression profiles.
Enrichment Analysis
The “clusterProfiler” package was utilized to conduct enrichment analyses for Gene Ontology (GO) and Kyoto Encyclopedia of Genes and Genomes (KEGG) concerning genes associated with macrophage polarization. The GO classifications encompassed biological process (BP), cellular component (CC), and molecular function (MF). The established screening threshold was as follows: adj. P < 0.05.
Machine Learning for Screening Diagnostic Biomarkers
Hub genes were discovered utilizing three separate machine-learning methodologies: LASSO, RF, and SVM-RFE. The LASSO analysis was conducted utilizing the “glmnet” package, with the penalty coefficient being established through a 10-fold cross-validation approach. For the RF analysis, the “randomForest” package was used to select the eight genes with the highest relative importance scores. The analysis utilizing SVM-RFE was performed employing the “e1071” package. To determine the commonality of the results derived from the LASSO, RF, and SVM-RFE algorithms, the “VennDiagram” package was used, thereby identifying the hub genes associated with macrophage polarization. Additionally, the analysis of the receiver operating characteristic (ROC) for the identified hub genes was conducted utilizing the “pROC” package.
Development of Nomograms Based on Hub Genes and Internal Validation
A logistic regression model for binary classification was established within the generalized linear model framework. Nomogram models were constructed utilizing the “rms” package to assess the diagnostic significance of the central genes. The model was validated on the internal dataset through calibration curves, decision curves, and ROC curves.
External Validation of the Diagnostic Model
For transcriptome data, group comparisons of the aforementioned hub genes were performed using expression profiles from external datasets. The model was validated on external datasets through calibration curves, decision curves, and ROC curves. For single-cell data, to understand the expression of hub genes and key cell situations, the expression levels were cross-validated in two datasets, and t-SNE plots were utilized to demonstrate the distribution of the expression levels of the hub genes.
Immune Infiltration Analysis
Utilizing the 22 immune cell markers available on the CIBERSORTx platform (https://cibersortx.stanford.edu/), an immune infiltration analysis was conducted through the application of the “CIBERSORT” package. Moreover, a comprehensive assessment of the relationship between the identified hub genes and the various immune cell types was carried out.
Gene Set Enrichment Analysis
The “clusterProfiler” package was used to perform GSEA to determine the biological roles associated with each hub gene, whereas the “ggplot2” package was used for visualizing the data.
Construction of the Gene-Gene Interaction Network and ceRNA Network
Genes that may be associated with the hub genes were sourced from the GeneMANIA database (https://genemania.org/), leading to the establishment of a gene-gene interaction network. Additionally, a competing endogenous RNA (ceRNA) regulatory network involving mRNAs, miRNAs, and lncRNAs was developed utilizing data from the starBase database (https://rnasysu.com/encori/) in conjunction with Cytoscape software (Cytoscape Consortium, USA).
Prediction of Drug
The Enrichr database (https://maayanlab.cloud/Enrichr/), which is a platform for accessing the DSigDB database, was utilized to predict therapeutic drugs for the hub genes. The candidate drugs were subsequently ranked based on the P-value and adj. P-values; lower P-values and adj. P-values indicated higher priority.
Clinical Sample Collection
This study collected synovial tissues of the knee joint from patients who underwent knee arthroscopy in the Department of Sports Medicine at Youjiang Nationalities Hospital Affiliated Hospital. Among them, 16 patients with KOA graded as Kellgren-Lawrence (K-L) grade 2 or 3 and presenting with significant pain were recruited. Synovial tissues were collected and randomly divided into two groups, with 10 samples allocated to RT-qPCR experiments and six samples allocated to immunohistochemistry (IHC) experiments. Additionally, 10 normal synovial tissues from patients with acute meniscus or anterior cruciate ligament injuries, graded as K-L grade 0 or 1, were also randomly split into two groups, with each group consisting of five samples, which were used for RT-qPCR and IHC experiments, respectively. The research complies with the Declaration of Helsinki, received approval from the Ethics Committee of Youjiang Nationalities Hospital Affiliated Hospital, and all participants provided informed consent (Ethics Number: 2025011301).
RT-qPCR Analysis
In total, 10 synovial tissue samples were collected from patients diagnosed with KOA, along with five synovial tissue samples from healthy controls. The synovial tissues were added with an appropriate amount of lysis buffer, followed by the addition of magnetic beads and placed into a homogenizer for thorough grinding. After incubating at room temperature for 5 min, chloroform was added, and the mixture was vigorously shaken for 15s and then incubated for another 5 min. The mixture was then centrifuged at 12,000 rpm at 8°C for 10 min, and the supernatant was collected. To the supernatant, 200 µL of anhydrous ethanol was added and mixed thoroughly, and the mixture was transferred to a spin column and incubated for 2 min. After centrifugation at 12,000 rpm at 8°C for 2 min, the flow-through was discarded. The column was washed with 600 µL of wash buffer and centrifuged at 12,000 rpm at 8°C for 2 min, repeating this step twice. After the final centrifugation, the spin column was placed into a new tube, and 50 µL of RNase-free H2O was added to elute the RNA. After incubating for 5 minutes, the mixture was centrifuged at 12,000 rpm for 2 min. The purity of the RNA was determined using a spectrophotometer. Subsequently, the RNA was reverse-transcribed into cDNA using a First-Strand cDNA Synthesis Kit (D7168M, Beyotime). The subsequent thermal cycling parameters were as follows: melting at 95 °C for 30s, annealing at 95 °C for 3s, and extension at 60 °C for 30s. GAPDH served as the internal control, and the results were calculated using the 2–ΔΔCt methodology. The primers used in this study are shown in Table 2.
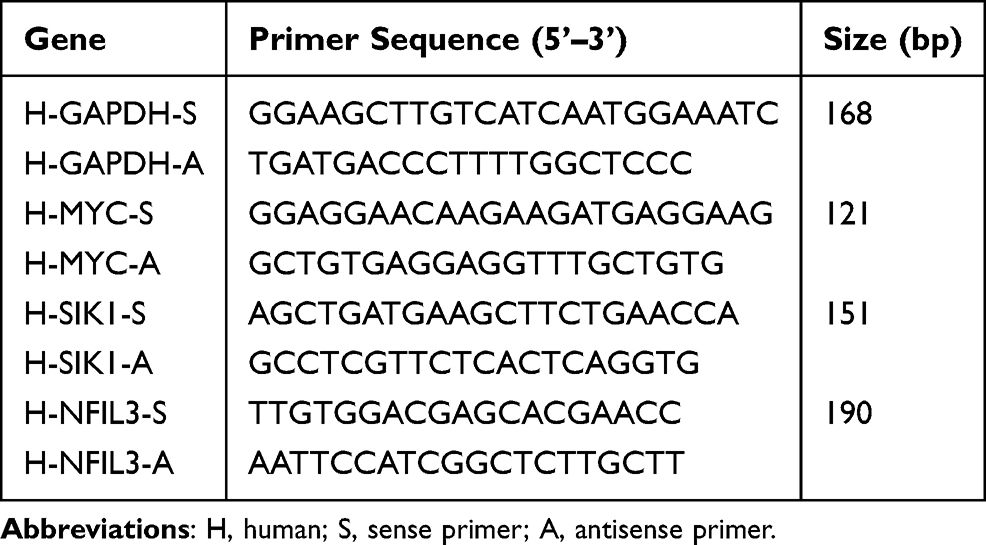 |
Table 2 Primer Sequences for RT-qPCR |
IHC Analysis
Six synovial tissue samples obtained from individuals diagnosed with KOA and five normal synovial tissue samples obtained during surgery were immediately preserved in formalin fixative to ensure proper fixation, followed by embedding in paraffin wax. From the paraffin blocks, tissue sections (3 mm thick) were prepared. These tissue sections were initially subjected to baking in an oven at 68 °C for 2 h. The slides were subsequently deparaffinized in xylene for 20 min, which consisted of four sequential xylene treatments (each lasting 5 min). The slides were rehydrated using a graded ethanol series: 100% ethanol I (5 min), 100% ethanol II (5 min), 95% ethanol I (5 min), 85% ethanol II (5 min), and 75% ethanol (5 min). Following three washes with distilled water, antigen retrieval was performed in a pressure cooker using an EDTA buffer, after which the slides were allowed to cool to room temperature. To block endogenous peroxidase activity, the sections were incubated with 3% hydrogen peroxide for 10 minutes in a moist chamber, followed by a water rinse. Primary antibodies specific for Myelocytomatosis viral oncogene (MYC) (1:100, CSB-PA02589A0Rb, Cusabio), Salt-inducible kinase 1 (SIK1) (1:200, CSB-PA021321LA01HU, Cusabio), and Nuclear factor interleukin 3 (NFIL3) (1:200, CSB-PA621967ESR2HU, Cusabio) were applied to the tissue sections and incubated overnight at 4 °C. The subsequent day, the slides were rinsed with PBS and were then incubated with the corresponding secondary antibodies. Immunoreactivity was visualized using 3,3’-diaminobenzidine (DAB) and counterstained with hematoxylin. Finally, the slides were dehydrated through a standard ethanol and xylene gradient and mounted using neutral resin. Finally, images were captured via microscopy, and the stained regions were analyzed utilizing the Image-Pro Plus 6.0 software (Media Cybernetics, USA). The staining was quantified by the immunohistochemical staining score, which was calculated as the product of the intensity score and positive rate score. The intensity scores were categorized as negative (-), positive (+), positive (++), and positive (+++), corresponding to values of 0, 1, 2, and 3, respectively. The positive rate scores, ranging from 0 to 4, included classifications of 0, 1–25%, 26–50%, 51–75%, and 76–100%, representing scores of 0, 1, 2, 3, and 4, respectively. The overall IHC staining scores were interpreted as negative (0), slightly positive (1–4), moderately positive (5–8), or strongly positive (9–12).
Statistical Analysis
Statistical evaluations were performed utilizing the R software. The differences in gene expression between the two groups were determined by conducting independent samples t-tests, and the findings are reported as the mean ± standard deviation. All differences were considered to be statistically significant at P < 0.05.
Results
Identification of DEGs
In total, 54 DEGs were filtered from the internal dataset, with 23 up-regulated and 31 down-regulated DEGs. Figures 2A and B show the sample normalization before and after the datasets were merged. The DEGs were visualized by constructing a volcano plot (Figure 2C), and a heatmap was created for the top 50 genes that were significantly differentially expressed (Figure 2D). Additionally, PCA was conducted on the internal dataset to enhance the differentiation of disease samples (Figure 2E), and the results revealed a scattered distribution of DEGs across normal and diseased tissues.
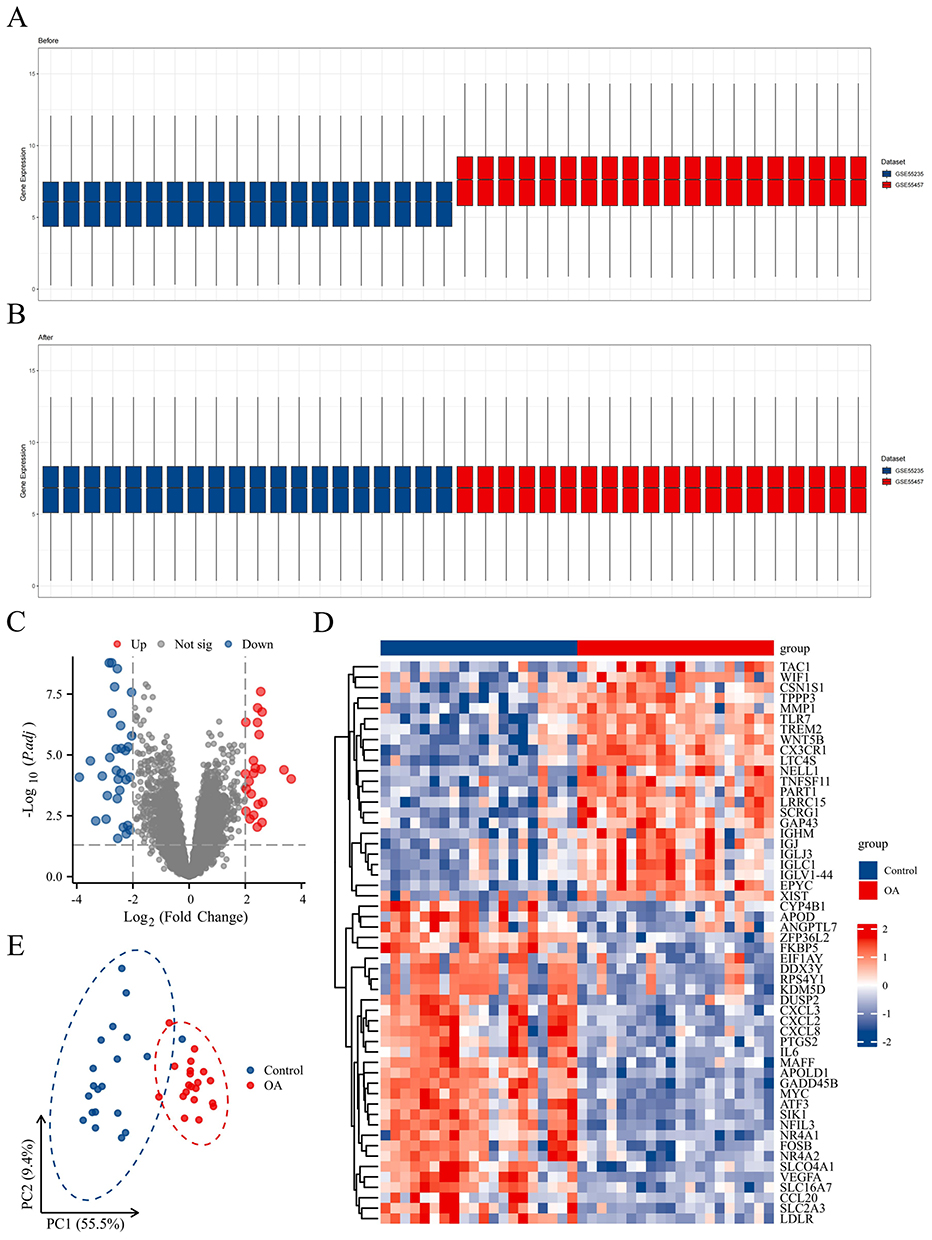 |
Figure 2 Identification of DEGs. (A and B) Sample normalization before and after the datasets were merged. (C–E) Volcano plot, heatmap, and PCA for OA. |
Identification of Co-Expressed Gene Modules in OA
The WGCNA was initially conducted to establish a gene co-expression network, which subsequently facilitated the identification of gene modules that exhibit a significant association with OA within that framework. To categorize co-expressed genes, the “average correlation degree” was calculated along with “Pearson correlation values”, followed by the clustering of samples in the dataset and the exclusion of outliers. Using a scale independence threshold above 0.85, we designated 15 as the “soft threshold power β” to ensure the formation of biologically relevant scale-free networks (Figure 3A). By conducting hierarchical clustering analysis along with dynamic Tree Cut, we delineated 11 distinct modules (Figure 3B). The findings from the module trait correlation analysis revealed a substantial positive correlation between the turquoise module and OA, which justified its selection for further investigation (Figure 3C). Within the turquoise module, 1073 genes were identified, and the scatter plot illustrated a robust positive correlation between these genes and OA (Figure 3D).
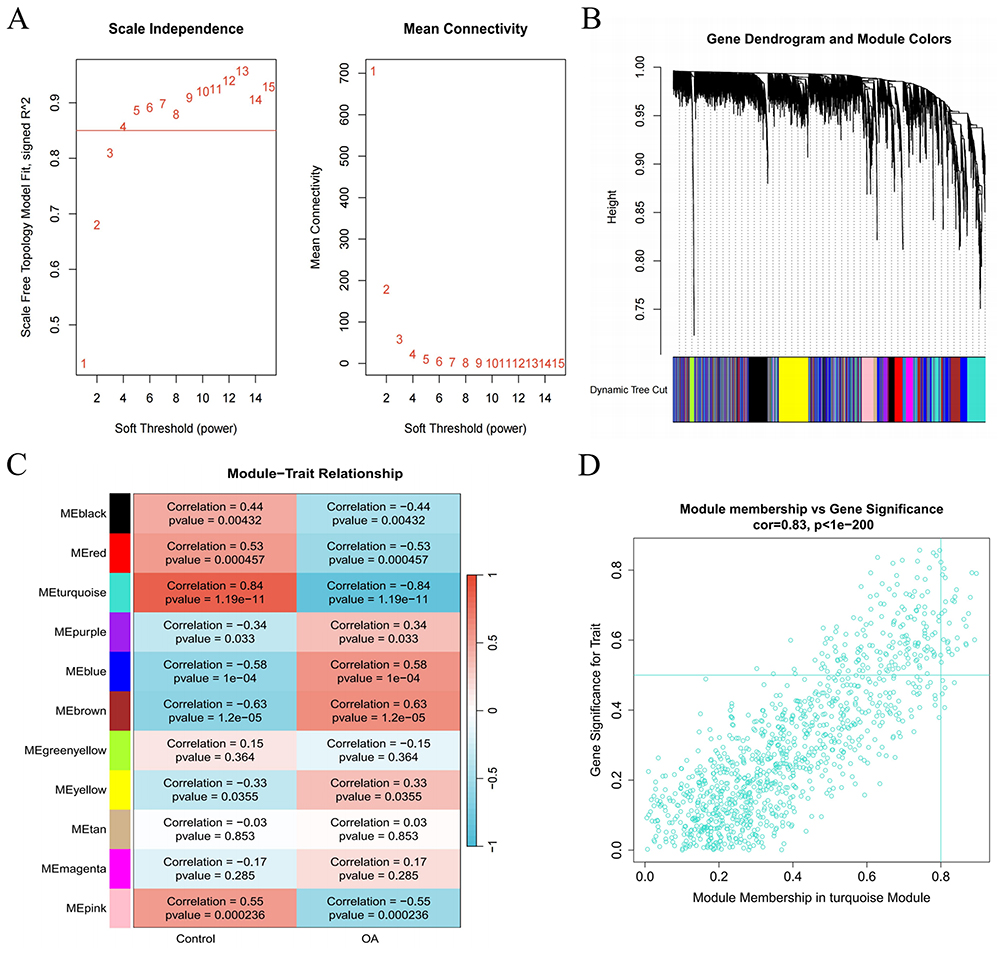 |
Figure 3 Development of datasets associated with a weighted co-expression network in OA. (A) The network topology was examined across different soft threshold values (β). (B) Gene dendrograms were generated through average linkage hierarchical clustering. (C) Relationships between modules and traits were determined. (D) The scatterplot illustrates the significance of genes related to recurrence versus their membership within the turquoise module. |
Identification of Macrophage Polarization-Related DEGs
The overlap between DEGs and the turquoise module identified a total of 27 genes (Figure 4A), and then intersection with macrophage polarization genes resulted in the identification of 12 genes: MYC, CCL20, PTGS2, ATF3, NR4A2, IL6, SLC2A3, NR4A1, NFIL3, VEGFA, SIK1, and CXCL8 (Figure 4B). The chromosomal distribution of the 12 genes is shown in Figure 4C. PCA was performed using the selected genes to enhance the differentiation of disease samples, demonstrating a dispersed distribution of DEGs between normal and diseased tissues (Figure 4D). Moreover, significant differences were found in the expression of these 12 genes between the disease and control groups (Figure 4E).
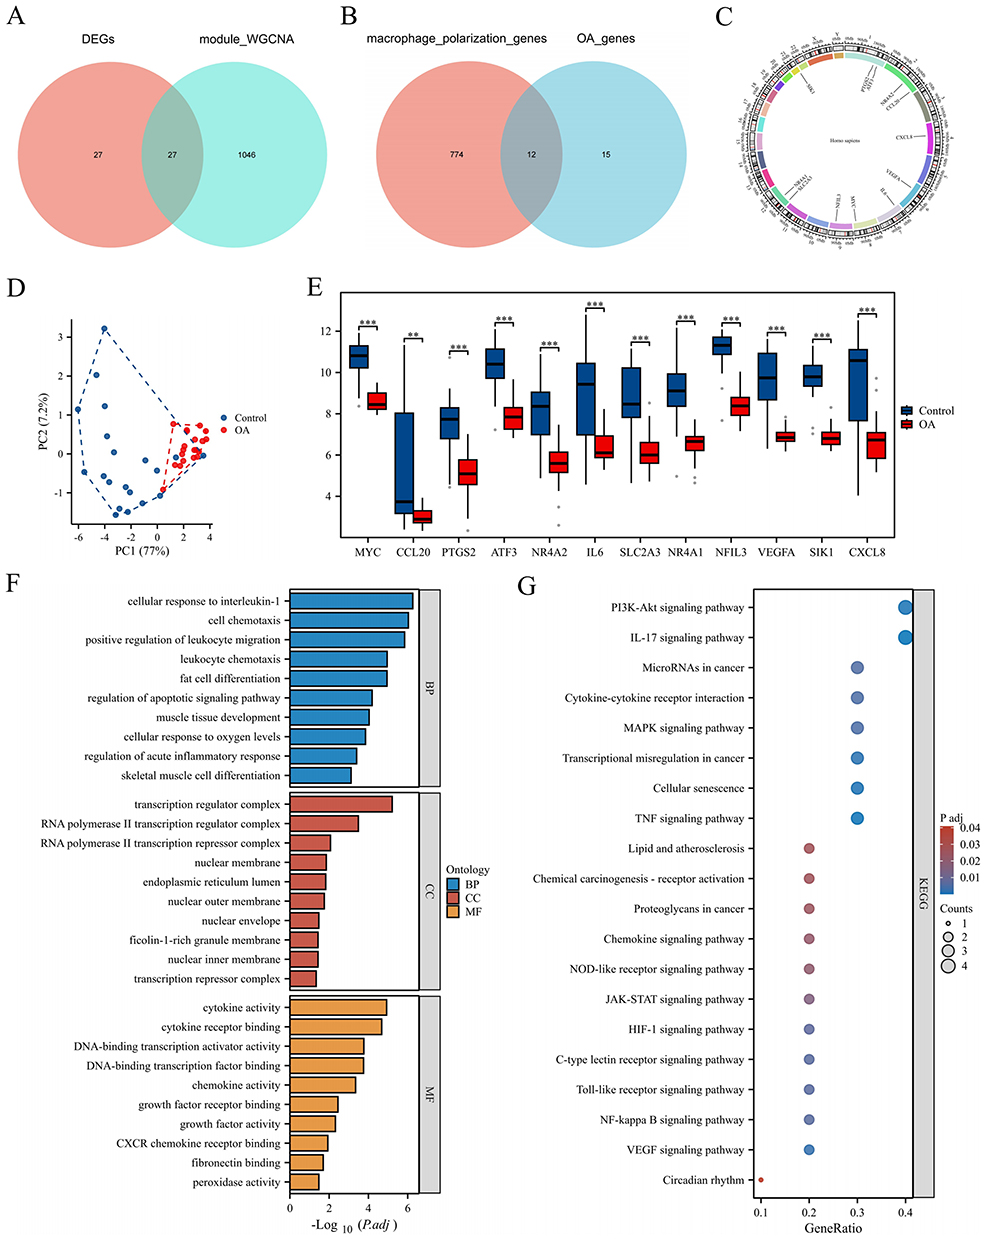 |
Figure 4 Identification of macrophage polarization-related DEGs. (A) Venn diagram of DEGs and the turquoise module. (B) Venn diagram of the data in A and macrophage polarization data. (C–E) Chromosomal localization map, PCA plot, and group comparison chart of the intersection results of the results in B. (F and G) The results of the GO and KEGG enrichment analysis. **P < 0.01, and ***P < 0.001. |
GO and KEGG Enrichment Analysis
The enrichment analysis of the 12 intersecting genes revealed 840 GO terms and 47 KEGG terms. The GO terms included 779 BP terms, 13 CC terms, and 48 MF terms. In the BP category, the results were enriched mainly in the regulation of cell chemotaxis, regulation of the apoptotic signaling pathway, and regulation of acute inflammatory responses. In the CC category, the results were enriched mainly in the transcription regulation complex, nuclear membrane, and endoplasmic reticulum lumen. In the MF category, the results were enriched mainly in cytokine activity, chemokine activity, and fibronectin binding (Figure 4F). The enriched KEGG pathways included the IL-17 signaling pathway, the NF-κB signaling pathway, the MAPK signaling pathway, and cellular senescence (Figure 4G).
Screening of Diagnostic Biomarkers
Using the LASSO algorithm, five genes were selected (Figure 5A), using the SVM-RFE algorithm, four genes were selected (Figure 5B), and using the RF algorithm, the top eight important genes were identified (Figure 5C), resulting in the intersection of three genes: MYC, SIK1, and NFIL3 (Figure 5D). Figure 5E illustrates that these three hub genes exhibited strong diagnostic performance, demonstrating area under the curve (AUC) values of 0.953 for MYC, 0.970 for SIK1, and 0.948 for NFIL3.
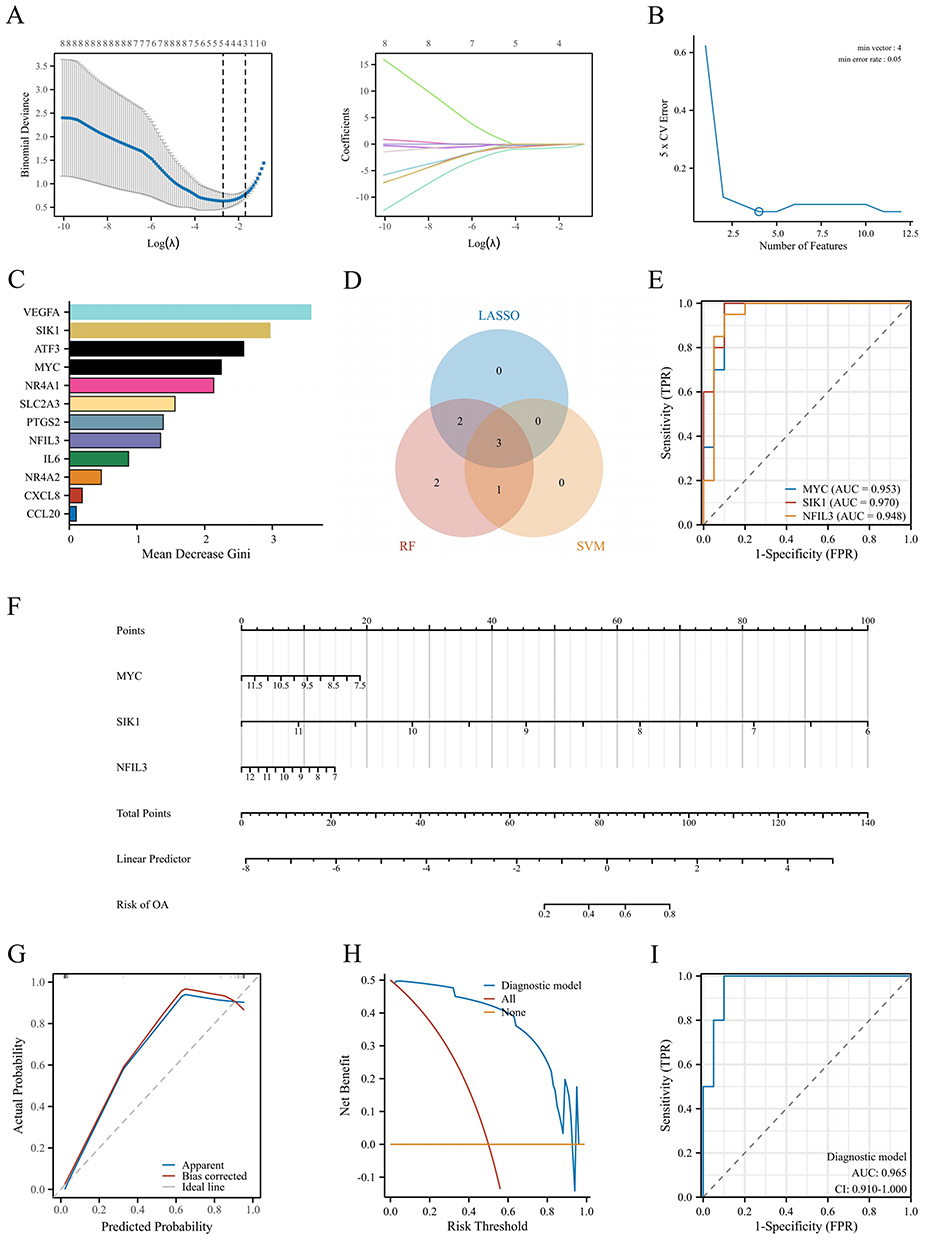 |
Figure 5 Screening and model construction of diagnostic biomarkers. (A–C) LASSO, SVM-RFE, and RF were used to select hub genes using machine learning algorithms. (D) A Venn diagram of the three algorithms is shown. (E) ROC curve of the hub genes was made. (F) A nomogram was developed to predict the probability of OA. (G–I) Calibration curve, DCA curve, and ROC curve were used for internal validation of the model. |
Nomogram Development Based on Diagnostic Biomarkers
We constructed a nomogram model that included scores obtained from three hub genes (Figure 5F). The bias-corrected curve closely aligned with the optimal calibration curve (Figure 5G), suggesting that the model exhibited excellent calibration. The decision curve revealed that the diagnostic model had a net benefit (Figure 5H). The AUC of the diagnostic model was 0.965 (Figure 5I), which indicated that the model was reliable.
External Validation
We also conducted external validation of the proposed model. The normalization of samples before and after dataset merging is shown in Figures 6A and B. The results revealed that within the external dataset, the expression levels of the SIK1 and NFIL3 genes differed between the disease and control groups, whereas the expression of MYC, although not significantly different, was down-regulated. The variations in the expression of the three molecules were consistent with those in the internal dataset (Figures 6C–E). The bias-corrected curve closely resembled the ideal calibration curve (Figure 6F), the model had a net benefit (Figure 6G), and the model demonstrated good diagnostic performance (Figure 6H), with an AUC of 0.847, indicating that the model was robust.
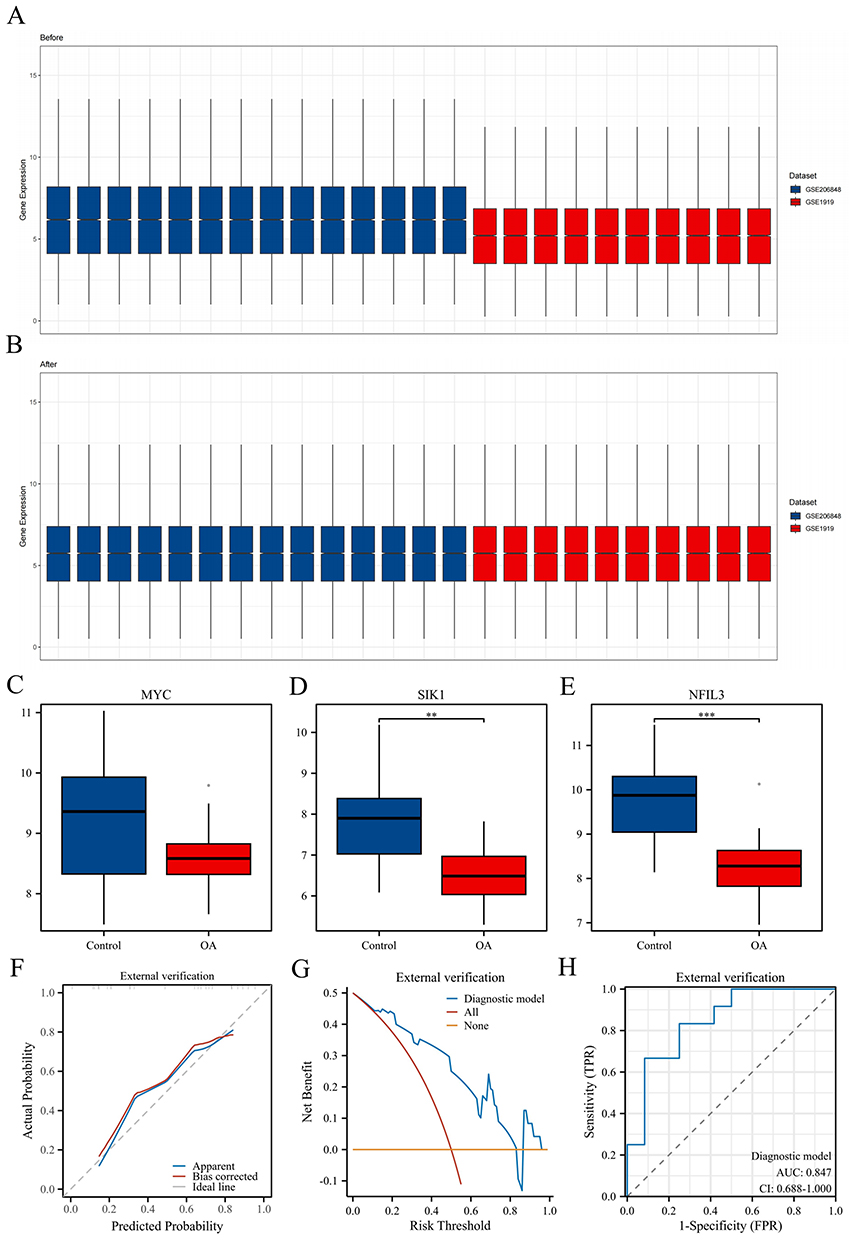 |
Figure 6 External validation was performed based on transcriptome data. (A and B) Sample normalization was performed before and after dataset merging. (C–E) The comparison chart illustrates the groups of MYC, SIK1, and NFIL3 hub genes. (F–H) Calibration curve, DCA curve, and ROC curve were used for external validation of the model. **P < 0.01, and ***P < 0.001. |
After quality control, the dataset GSE176308 included 3602 cells annotated into five types of cells: synovial subintimal fibroblasts (SSF), synovial intimal fibroblasts (SIF), endothelial cells (EC), HLA-DRA+ (including immune regulatory [IR-MΦ], inflammatory macrophages [I-MΦ], dendritic cells [DC], activated pro-inflammatory (HLA-DRA+) fibroblasts [iFIB] and B cells), and proliferating immune cells (ProIC)) (Figure 7A and B). After quality control, the dataset GSE152805 included 9562 cells annotated into eight types of cells: SSF, SIF, EC, HLA-DRA+, ProIC, smooth muscle cells (SMCs), T cells, and mast cells (MCs) (Figure 7F and G). The expression of the target genes MYC, SIK1, and NFIL3 was analyzed in the two datasets, and the results revealed that the MYC gene is expressed mainly in SIF and SSF cells (Figure 7C and H), the SIK1 gene is expressed mainly in SMC and HLA-DRA+ cells Figure 7D and I, and the NFIL3 gene is expressed mainly in SIF and SSF cells Figure 7E and J.
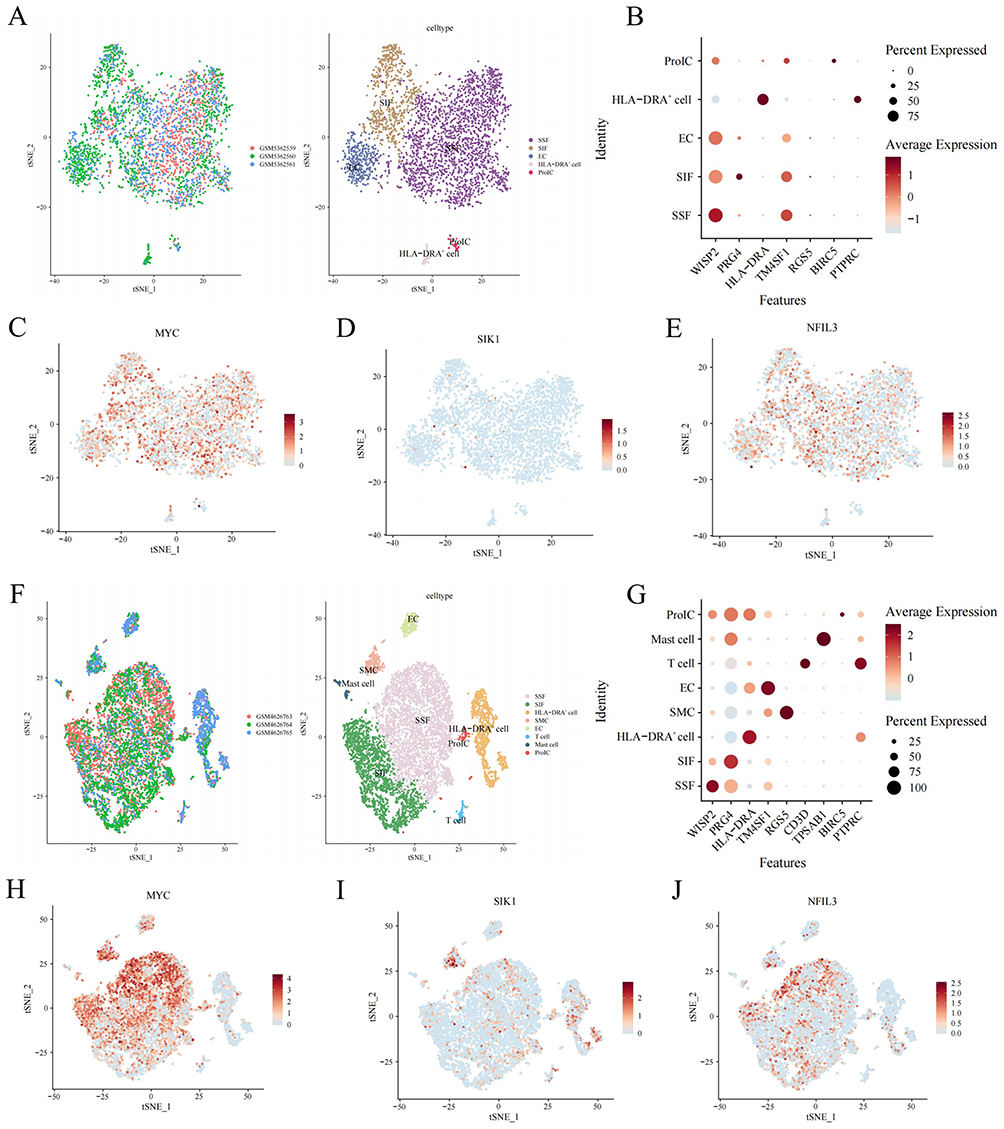 |
Figure 7 External validation was performed based on single-cell data. (A) The t-SNE distribution map shows cell annotation for GSE176308: the left image represents different samples with different colors, and the right image represents different cells with different colors. (B) cell annotation marker gene dot plot. (C–E) The t-SNE plots illustrate MYC, SIK1, and NFIL3 gene expression. (F) The t-SNE distribution map of cell annotations for GSE152805. (G) Cell annotation marker gene dot plot. (H–J) t-SNE plots of MYC, SIK1, and NFIL3 gene expression. |
Immune Infiltration Analysis
We employed the CIBERSORT algorithm to assess the infiltration of immune cells in both the disease cohort and the control cohort in OA patients. The findings revealed an increase in plasma cells (PCs) and resting MCs in OA patients, whereas there was a decrease in resting memory CD4 T cells, activated NK cells, activated MCs, and eosinophils in the OA group (Figure 8A and B). Furthermore, a significant correlation was observed between the three hub genes and various immune cell types (Figure 8C–E).
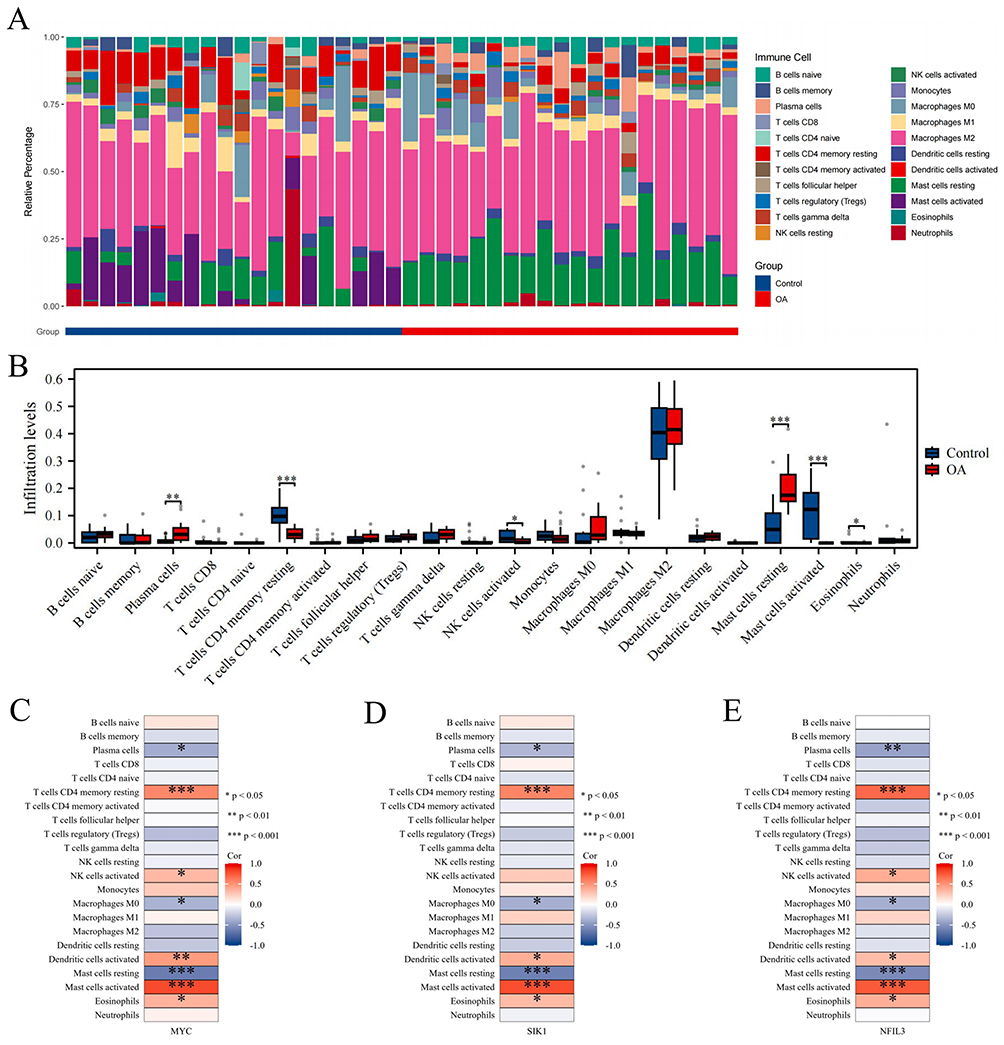 |
Figure 8 Immune infiltration analysis. (A and B) Stacked bar chart and box plot showing the comparison of immune cell infiltration levels between the OA and control groups. (C–E) The heatmap shows the associations of the hub genes MYC, SIK1, and NFIL3 with different immune cells. *P < 0.05, **P < 0.01, and ***P < 0.001. |
GSEA
We conducted GSEA on the hub genes to assess the possible influence of MYC, SIK1, and NFIL3 on the occurrence and progression of OA. The results revealed that the MYC molecule is enriched mainly in the striated muscle contraction pathway and muscle contraction; the SIK1 molecule is enriched primarily in neutrophil degranulation and signaling by interleukins; the NFIL3 molecule is enriched mainly in respiratory electron transport and eukaryotic translation elongation (Figures 9A–C).
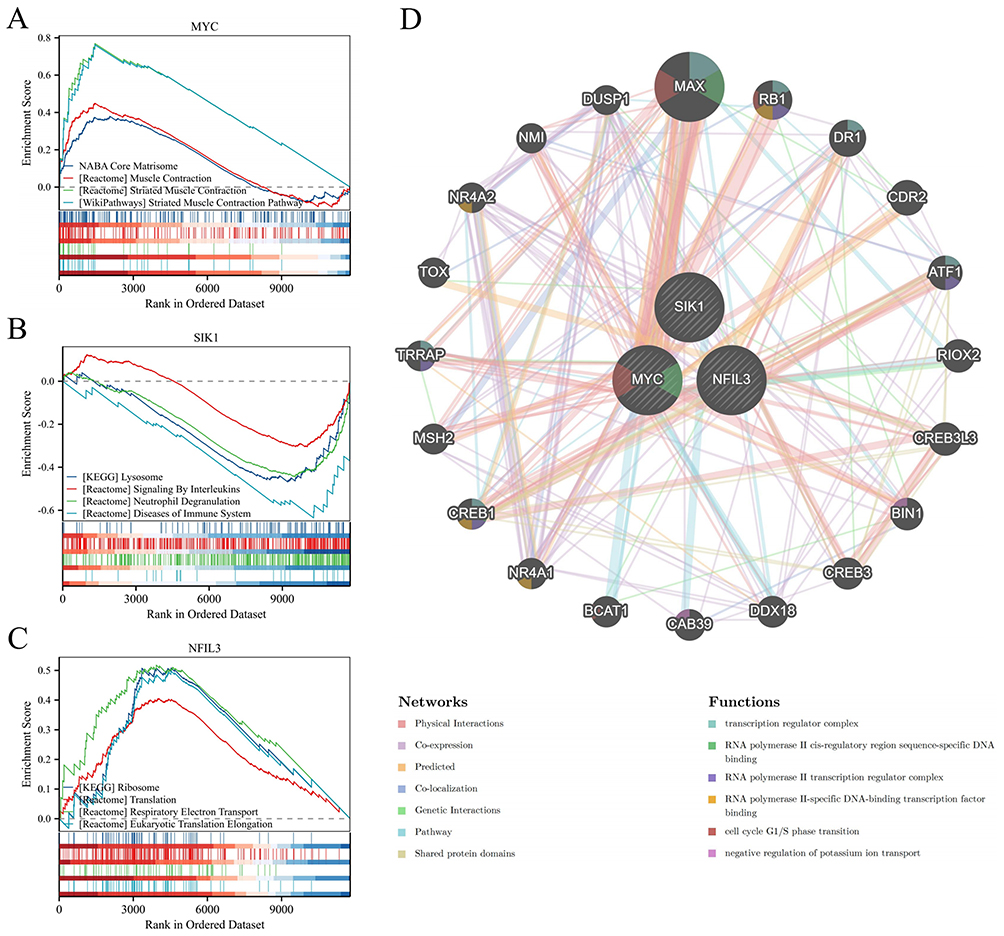 |
Figure 9 GSEA of the hub genes and construction of gene interaction networks. (A–C) GSEA results for MYC, SIK1, and NFIL3. (D) Gene-gene interaction network. |
Gene-Gene Interaction Network
To investigate the roles of the three hub genes, a gene-gene interaction network was constructed using the GeneMANIA database. The central hub nodes represented these genes, surrounded by 20 nodes that represented genes significantly associated with them. The network underscored the seven primary functions linked to these genes, such as the transcription regulator complex and the cell cycle G1/S phase transition (Figure 9D).
ceRNA Network
Using public databases, we first performed miRNA prediction for the hub genes and found that the hub genes may be associated with 102 miRNAs. Next, we conducted lncRNA prediction for the identified miRNAs and found that 102 miRNAs may be associated with 65 lncRNAs. The data were transferred to the Cytoscape software to construct a ceRNA regulatory network (Figure 10) and in turn, elucidate the regulatory mechanisms of genes related to macrophage polarization in OA.
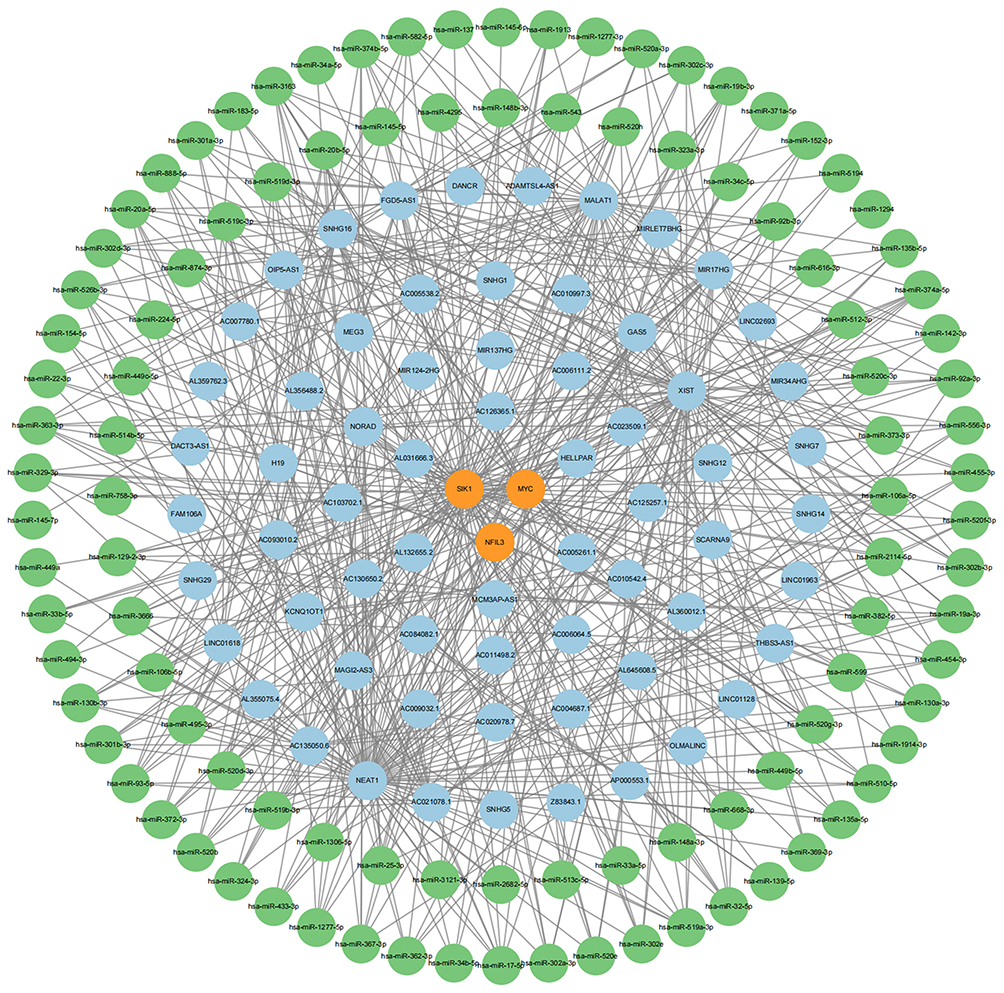 |
Figure 10 A ceRNA network of mRNAs-miRNAs-lncRNAs; the Orange circles represent mRNAs, the green circles represent miRNAs, and the blue circles represent lncRNAs. |
Prediction of Drug
The prioritized candidate drugs selected based on P-value and adj. P-value are presented in Table 3. Among the top 10 candidate drugs, each drug is associated with 2–3 hub genes, with MYC being associated with 10 drugs, SIK1 with nine drugs, and NFIL3 with six drugs.
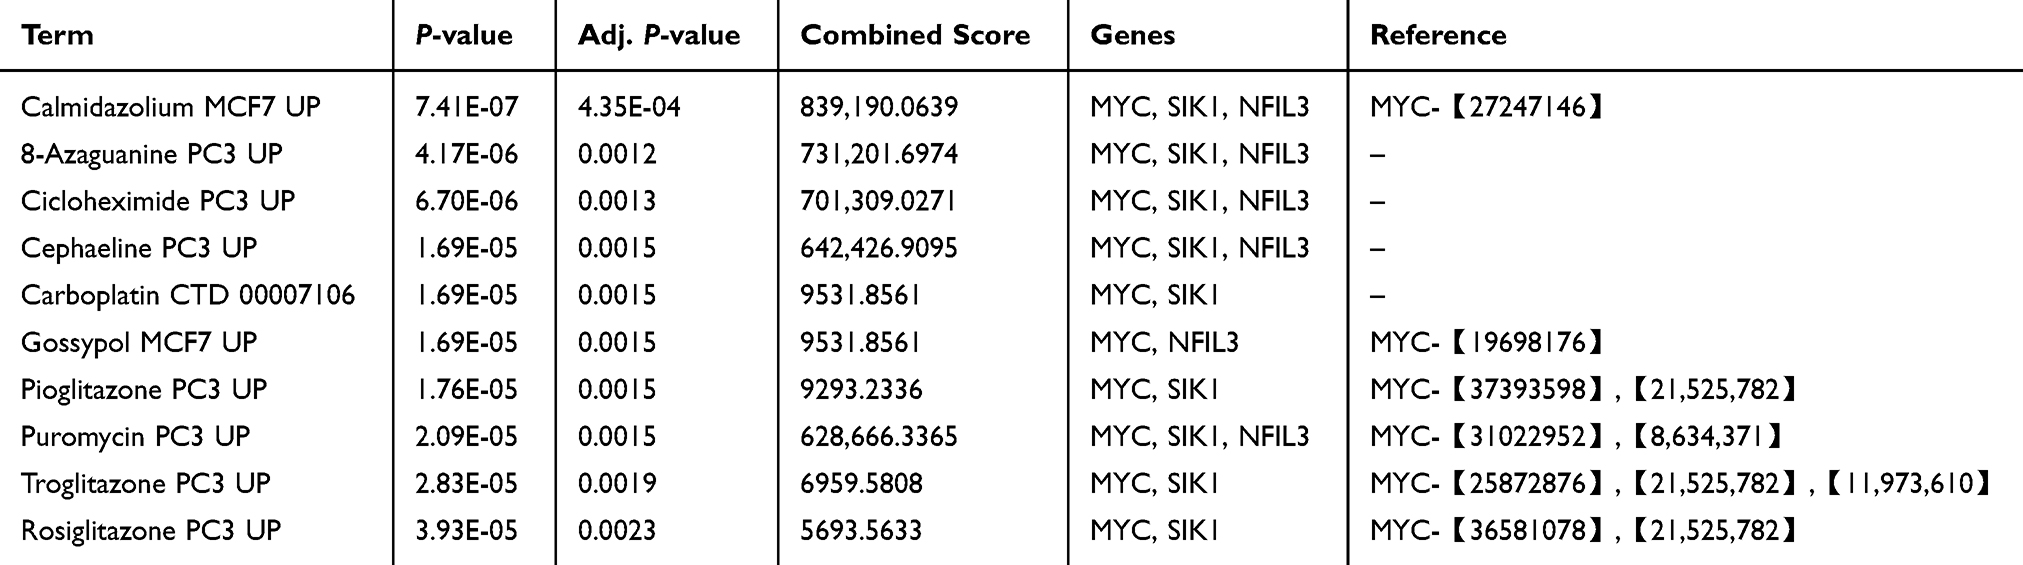 |
Table 3 Suggested Top Drug Compounds |
RT-qPCR Analysis
To validate the analysis results, we conducted RT-qPCR experiments on three genes. Compared to those in the normal control group, the relative expression levels of MYC, SIK1, and NFIL3 in the synovial tissue samples from the KOA patient group were significantly lower (Figures 11A, C and E). These findings align with the outcomes of our analysis.
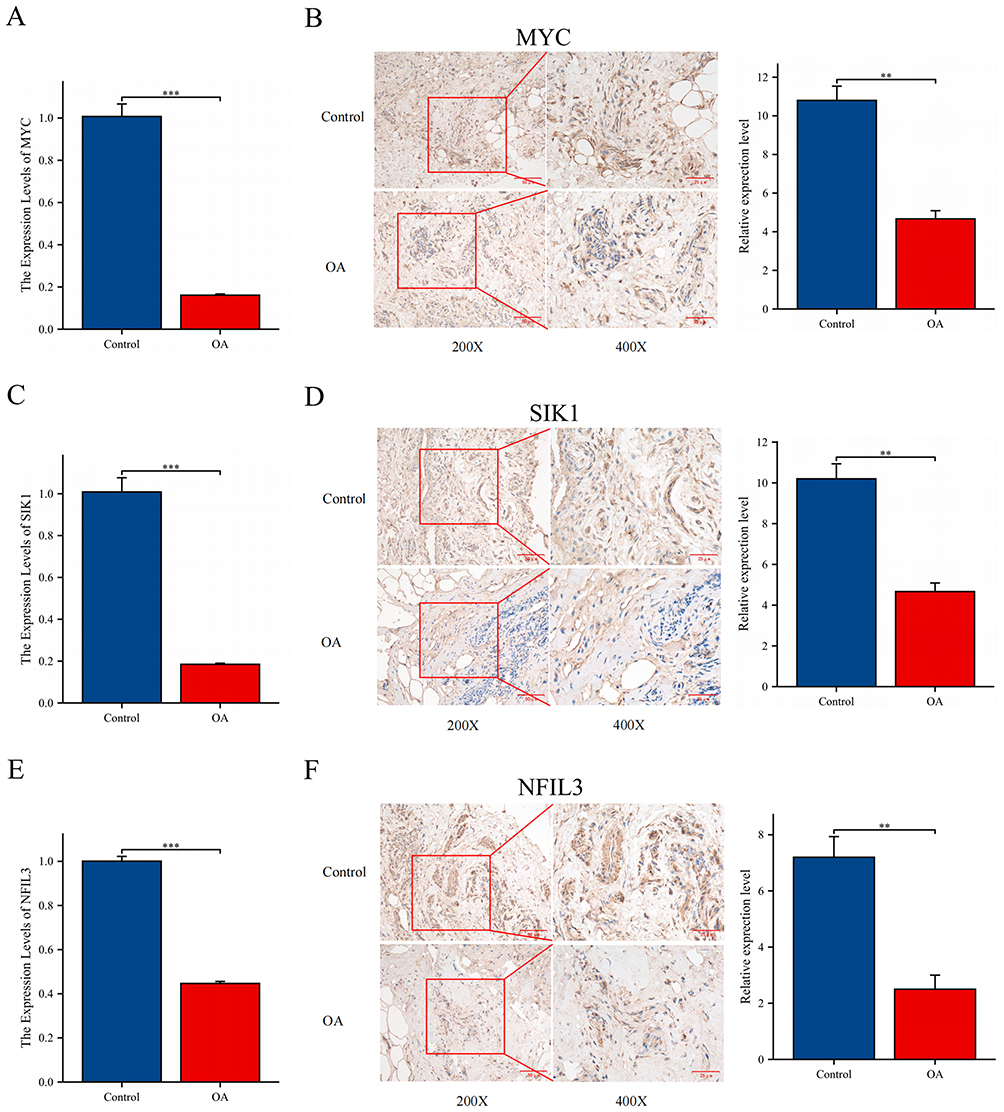 |
Figure 11 Experimental verification. (A, C and E) Relative expression levels of MYC, SIK1, and NFIL3 were analyzed by RT-qPCR. (B, D and F) Relative expression levels of MYC, SIK1, and NFIL3 were analyzed by IHC; 200X - Scale bar 50 μm, 400X - Scale bar 25 μm. **P < 0.01, and ***P < 0.001. |
IHC Analysis
Under high magnification, MYC, SIK1, and NFIL3 were strongly positive in the normal samples, whereas they were weakly positive in the OA samples. Compared to those in the normal control group, the relative expression levels of MYC, SIK1, and NFIL3 in the synovial tissue samples from the KOA patient group were significantly lower (Figures 11B, D and F). This is consistent with our analysis results.
Discussion
With a steady increase in the global population and prevalence of obesity, OA, an age-related degenerative joint disease that impacts physical function, pain, mental health, and even mortality, is imposing a severe health and economic burden.16 A key factor in the onset and progression of chronic inflammation is macrophage polarization. Alterations in the M1/M2 macrophage ratio suggest that macrophages may serve as key immunomodulators in the early inflammatory reaction to joint damage.17 Therefore, having a thorough understanding of the behaviors and roles of macrophage polarization in OA is of significant importance for early and sensitive diagnosis of this disease. c-MYC is induced in human macrophages during alternative activation in vitro and controls the expression of approximately 50% alternative-specific markers, indicating that it plays a role in macrophage polarization.18 Zeng et al found that NFIL3 plays an important role in the progression of atherosclerosis (AS) by regulating macrophage polarization.19 Darling et al found that SIK can prevent macrophages from differentiating into a potent and stable anti-inflammatory phenotype, thus playing an important role in innate immunity.20
MYC, which encodes the c-Myc protein, is an essential transcription factor participating in the control of several biological processes, such as cell division, proliferation, metabolism, and apoptosis. Through a more comprehensive integrative analysis, MYC was identified as a pivotal gene involved in OA pathogenesis.21 However, the impact of MYC on OA remains controversial. Evidence from some studies points to a promotive effect of MYC in OA development. For instance, Rong et al and Zhang et al found that MYC was markedly upregulated in the synovial regions of patients suffering from OA.22,23 Conversely, alternative evidence suggests that MYC may exert a protective function in the context of OA. Fisch et al, by conducting RNA sequencing analysis of knee cartilage from both OA and non-OA individuals, observed a marked downregulation of MYC expression as observed in the cartilage tissues affected by OA.24 Wang et al discovered that borojoa iridoid glycoside may inhibit chondrocyte apoptosis and autophagy, partly by enhancing c-MYC-mediated cholesterol metabolism.25 Li et al reported that extracellular vesicle–chito-oligosaccharide complexes originating from adipose-derived mesenchymal stem cells markedly enhance c-Myc expression, thereby facilitating cartilage regeneration and mitigating osteoarthritic symptoms.26 In vitro experiments by Li et al revealed that MYC transcriptionally repressed ADORA2B, which promoted chondrocyte ferroptosis by inhibiting the PI3K/Akt pathway.27 Thus, it is evident that MYC exhibits bidirectional regulation in OA, which we speculate may be related to MYC acting on different sites and thus regulating different pathways.
SIK1 is a subtype of serine/threonine kinase that belongs to the AMPK family. It is essential for many physiological and pathological processes, such as controlling important signaling pathways that encourage cell division, metabolic dysregulation, metastasis, and resistance to chemotherapy.28 Some studies have suggested that SIK1 is an emerging diagnostic biomarker for OA.29 A proteomic analysis of clinical samples from 30 OA patients revealed that decreased SIK1 expression is associated with the severity of OA.30 Moreover, in vitro experiments, experiments revealed that SIK1 can regulate damage to and sclerosis of bone and subchondral bone, probably by regulating Runx2 activity. Kim et al further demonstrated that SIK1 functions as an important suppressor of both osteoblast precursor proliferation and differentiation, as determined by SIK1-knockout mice showing elevated bone mass, increased numbers of osteoblasts, and an enhanced rate of bone formation.31
NFIL3, is involved in immunological regulation, inflammatory responses in humans, and other processes that are fundamentally involved in the emergence of various types of diseases. Cao et al, using the GSE51588 and GSE55235 datasets and WGCNA, identified NFIL3 as a central gene related to the development and progression of OA.32 Schlenner et al found homozygous mutations in NFIL3 in monozygotic twins with juvenile idiopathic arthritis and inflammatory complications.33 Similar experiments in mice demonstrated that NFIL3 deficiency increases susceptibility to arthritis, potentially due to an elevated release of IL-1β and TNF-α from myeloid cells. Moreover, NFIL3 is essential for preserving Treg cell function and stability, which may markedly influence the progression of OA.34,35 Emerging evidence suggests that Wnt/β-catenin signaling facilitates OA progression, potentially through the direct transcriptional regulation of NFIL3 by the β-catenin/TCF4 complex.36–38 Thus, NFIL3 can significantly reduce OA-related inflammation while preserving the functionality and stability of immune cells.
The results of the KEGG enrichment analysis indicated that macrophage polarization may affect OA by regulating pathways such as the IL-17 pathway, the NF-κB pathway, the MAPK pathway, the JAK/STAT pathway, and cellular senescence. IL-17 is a critical pro-inflammatory cytokine secreted by Th17 cells, and its signaling cascade modulates the onset and progression of OA through the activation of pathways, including the NF-κB and MAPK pathways. Research has revealed that individuals with OA have elevated IL-17A levels in both their serum and synovial fluid relative to healthy controls, and these heightened levels are positively associated with pain intensity, functional decline, and overall disease severity.39 Zheng et al demonstrated that SPHK2 knockout impairs IL-17 signaling, thereby reducing the growth and migration of fibroblast-like synoviocytes involved in OA.40 Huang et al conducted experiments on rats and reported that PAH indirectly inhibits the activation of the IL-17 pathway through the regulation of EPYC expression, inhibits chondrocyte hypertrophy, promotes chondrocyte proliferation, and thus exerts a therapeutic effect on OA.41 Huang et al also reported that the IL-17 signaling pathway can reduce inflammatory responses and oxidative stress through pathways such as the NF-κB and MAPK pathways.42 Zou et al found that AM1241 can inhibit chondrocyte inflammation and extracellular matrix degradation through the NF-κB pathway, thereby alleviating OA in mice.43 In addition, Qiao et al discovered that acteoside can attenuate inflammatory responses by inhibiting the JAK/STAT signaling pathway, indicating its possible value as a viable intervention for OA.44
GSEA analysis gained us a deeper insights into how MYC, SIK1, and NFIL3 influence OA. Skeletal muscle, a key component of striated tissue, is vital for joint stability and movement, and MYC is closely associated with muscle contraction. Reid et al reported that muscle strength has an independent effect on both pain levels and quality of life in individuals with KOA.45 Schaefer et al observed that patients with knee OA often exhibit reduced hamstring strength, pointing to distinct deficits in neuromuscular function.46 Cross et al demonstrated that their newly developed compound, APPA, suppresses neutrophil degranulation and reactive oxygen species generation, inhibits neutrophil extracellular trap formation, and reduces inflammation, thereby presenting a promising therapeutic option for OA management.47 Na et al found that metformin can trigger autophagosome-lysosome fusion, which contributes to delaying the onset of experimental OA while also exerting analgesic and cartilage-protective effects.48 Research by Cillero-Pastor et al showed that dysfunction in the mitochondrial respiratory chain within human chondrocytes can induce localized inflammation, subsequently accelerating OA progression.49 Van den Akker et al proposed that OA might be understood as an acquired ribosomopathy, given the observed disruptions in ribosomal processes—including biosynthesis, accumulation, maturation, and translation—throughout the disease course.50
Immune cell dysregulation strongly contributes to impaired immune responses. Studies have highlighted the contribution of immune cells to both the initiation and progression of OA.51 In this study, we found that the three hub genes—MYC, SIK1, and NFIL3—may influence OA by enhancing the presence of resting memory CD4+ T cells, activated natural killer (NK) cells, MCs in their active state, and eosinophils, while reducing the number of PCs and MCs in the resting state. Xie et al extracted B cells from OA patients and age-matched healthy controls and reported that B cells from OA patients exhibited an overall more mature phenotype.52 Compared to bone marrow, stromal cells from OA synovitis patients are more conducive to the survival of PCs, accompanied by additional cell populations and higher immunoglobulin (Ig) secretion. Another study examined synovial fluid from individuals with arthritis and detected autoantibodies targeting post-translationally modified proteins, indicating that B cells may locally differentiate into antibody-secreting PCs within the joint.53 Using machine learning and immunohistochemical methods, Lv et al confirmed high levels of KDELR3 in the synovial tissues of OA patients and speculated that its possible pathway of action involves the activation and infiltration of effector memory CD4+ T cells and NK T cells.54 In a study of 76 individuals with KOA, Klein-Wieringa identified macrophages and T lymphocytes as the principal immune cell subsets within the synovium and infrapatellar fat pads, with CD4+ T cells predominantly presenting memory-like features.55 MCs, characterized by mediating allergic reactions, often facilitate the inflammatory cascade associated with OA progression, which contradicts the conclusions of our study.56 In fact, MCs exert both pro- and anti-inflammatory effects during the course of inflammation. They release histamine, TNF-α, and IL-6, which amplify inflammatory signaling, while IL-10 secretion contributes to its attenuation. Furthermore, the interplay between MCs and other immune cell types plays a regulatory role in modulating inflammatory responses.57 Further experimental investigations are necessary to fully elucidate the precise role of MCs in OA. Currently, only a few studies have proposed that eosinophils may have a protective function in OA. Further detailed investigations are needed to better understand how this innate immune cell type responds to changes in the joint microenvironment.58
The role of ncRNAs, particularly miRNAs and lncRNAs, in OA is under investigation. Extensive research has revealed their involvement in OA pathophysiology, suggesting their promise as alternative intervention points. According to Endisha et al, miR-34a-5p levels were elevated in the synovial fluid, cartilage, and plasma of individuals at the advanced stage of KOA.59 In vitro experiments revealed that injecting miR-34a-5p mimics can induce human chondrocytes to exhibit a phenotype similar to that of OA, whereas the inhibition of miR-34a-5p can improve cellular gene expression, highlighting its potential function in maintaining cartilage health. Jiang et al reported that inhibiting the target of circ_DHRS3, miR-183-5p, can reverse IL-1β-induced chondrocyte proliferation.60 Liao et al revealed that circNFIX influences cartilage formation and chondrocyte degeneration by modulating the miR-758-3p/KDM6A signaling pathway.61 Baek et al reported that blocking miR-449a enhances cartilage restoration and hinders the progression of OA in rats.62 Similar to miRNAs, lncRNAs have been recognized as key contributors to the development of OA, with MALAT1 showing a marked increase in expression in OA.63 Fu et al demonstrated that Prim-O-glucosylcimifugin mitigates cartilage degradation by modulating Nav1.7 through the regulation of the lncRNA XIST.64 Moreover, there is a close interaction between lncRNAs and miRNAs. Tian et al reported that SNHG7 influences cell proliferation, programmed cell death, and autophagy processes by interacting with SYVN1 through miR-34a-5p binding.65 The overexpression of miR-34a may counteract the inhibitory effects of SNHG7 on apoptosis and autophagy, while promoting proliferation. Conversely, silencing miR-34a can lead to the suppression of apoptosis and autophagy and an increase in cell proliferation. Fu et al reported that Achyranthes bidentata polysaccharide mitigated ER stress associated with OA via modulation of the lncRNA NEAT1–miR-377-3p axis.66 In this study, 102 miRNAs and 65 lncRNAs were identified in association with three core mRNAs, leading to the development of a regulatory network that integrates mRNA, miRNA, and lncRNA interactions, thereby revealing their complex interrelationships. This regulatory network may elucidate a potential mechanistic pathway in the pathogenesis of OA, warranting further comprehensive investigation.
Li et al demonstrated that gossypol downregulates CX43, thereby inhibiting the TLR4/MyD88/NF-κB pathway and reducing IL-1β-induced chondrocyte apoptosis and inflammation.67 Moreover, gossypol acetic acid, a bioactive derivative of gossypol, was shown to reduce ferroptosis in OA chondrocytes by inhibiting GPX4 methylation.68 Pioglitazone, a commonly prescribed antidiabetic agent, has shown therapeutic potential in OA by specifically activating peroxisome proliferator-activated receptor γ (PPAR-γ). This activation leads to reduced secretion of inflammatory cytokines induced by advanced glycation end products and restores the activity of the AMPK and SIRT-1 pathways, thereby alleviating OA-related pathological changes.69 Furthermore, Xue et al also reported that in a surgically induced rat knee OA model, PPAR-γ activation reduced chondrocyte ferroptosis by modulating mitochondrial autophagy via the Pink1/Parkin pathway.70
Limitations
Although the findings of this study are innovative and promising, this study has certain limitations. First, since the data analyzed were obtained from public databases, using data processed in different batches may introduce potential bias in the research results, a larger sample sizes and multi-center evaluations in the population are needed and prospective studies need to be conducted to validate the practical value of this risk model in clinical practice. Second, although RT-qPCR and IHC confirmed the low expression of diagnostic biomarkers in patients, there is a lack of basic experimental research at the cellular or animal level, as well as a lack of comprehensive assessment of mechanisms. Third, owing to experimental conditions, the drugs identified in this study have not undergone corresponding pharmacological experiments to verify their efficacy. Fourth, although the three biomarkers we explored have high diagnostic value, they are still far from being applied. We also call on more researchers to work with us to study how to obtain patient samples more efficiently and detect the expression of related genes more easily.
Conclusion
We constructed an OA diagnostic model related to macrophage polarization through comprehensive bioinformatics analysis. Our findings indicated that these genes have high diagnostic value and provided new insights for clinical diagnosis and treatment. However, further comprehensive clinical research and experiments are needed to validate these genes and elucidate their mechanisms of action.
Abbreviations
OA, Osteoarthritis; KOA, knee osteoarthritis; DEGs, differentially expressed genes; WGCNA, Weighted Gene Co-expression Network Analysis; LASSO, Least Absolute Shrinkage and Selection Operator; RF, Random Forest; SVM-RFE, Support Vector Machine Recursive Feature Elimination; PCA, principal component analysis; t-SNE, t-Distributed Stochastic Neighbor Embedding; TOM, topological overlap matrix; GO, Gene Ontology; KEGG, Kyoto Encyclopedia of Genes and Genomes; BP, biological process; CC, cellular component; MF, molecular function; ROC, Receiver operating characteristic; ceRNA, competing endogenous RNA; K-L, Kellgren-Lawrence; IHC, immunohistochemistry; MYC, Myelocytomatosis viral oncogene; SIK1, Salt-inducible kinase 1; NFIL3, Nuclear factor interleukin 3; AUC, area under the curve; SSF, synovial subintimal fibroblasts; SIF, synovial intimal fibroblasts; EC, endothelial cells; IR-MΦ, immune regulatory macrophages; I-MΦ, inflammatory macrophages; DC, dendritic cells; ProIC, proliferating immune cells; SMC, smooth muscle cells; NK, natural killer; PCs, plasma cells; MCs, Mast cells; PPAR-γ, peroxisome proliferator-activated receptor γ.
Data Sharing Statement
This study analyzed publicly available datasets. These data can be found here: National Center for Biotechnology Information (NCBI), Gene Expression Omnibus (GEO), https://www.ncbi.nlm.nih.gov/geo/.
Ethics Approval and Informed Consent
The study was approved by the Ethics Committee of Youjiang Nationalities Hospital Affiliated Hospital and informed consent was obtained from all participants (Ethics Number: 2025011301).
Acknowledgments
The authors thank all the participants and staff of the Gene Expression Omnibus.
Author Contributions
All authors made a significant contribution to the work reported, whether that is in the conception, study design, execution, acquisition of data, analysis and interpretation, or in all these areas; took part in drafting, revising or critically reviewing the article; gave final approval of the version to be published; have agreed on the journal to which the article has been submitted; and agree to be accountable for all aspects of the work.
Funding
This work was supported by the National Natural Science Foundation of China (82260887, 32160209) and the Young and Middle-aged Backbone Talents Project of Youjiang Medical University for Nationalities Affiliated Hospital (Y202210310).
Disclosure
The authors declare that the research was conducted in the absence of any commercial or financial relationships that could be construed as a potential conflict of interest.
References
1. Kloppenburg M, Namane M, Cicuttini F. Osteoarthritis. Lancet. 2025;405(10472):71–85. doi:10.1016/S0140-6736(24)02322-5
2. Kolasinski SL, Neogi T, Hochberg MC, et al. 2019 American College of Rheumatology/Arthritis Foundation guideline for the management of osteoarthritis of the hand, hip, and knee. Arthritis Rheumatol. 2020;72(2):220–233. doi:10.1002/art.41142
3. Hunter DJ, Bierma-Zeinstra S. Osteoarthritis. Lancet. 2019;393(10182):1745–1759. doi:10.1016/S0140-6736(19)30417-9
4. Steinmetz JD, Culbreth GT, Haile LM, et al. Global, regional, and national burden of osteoarthritis, 1990–2020 and projections to 2050: a systematic analysis for the global burden of disease study 2021. Lancet Rheumatol. 2023;5(9):e508–e522. doi:10.1016/S2665-9913(23)00163-7
5. Welhaven HD, Welfley AH, June RK. Osteoarthritis year in review 2024: molecular biomarkers of osteoarthritis. Osteoarthritis Cartilage. 2025;33(1):67–87. doi:10.1016/j.joca.2024.10.003
6. Lawrence A, Boesel J, Martinez Aguilar R, Gryczewski D, Moni ASB. A review and meta-analysis of biomarkers in early-stage osteoarthritis. Orthopaedic Surg. 2025;17(7):1913–1923. doi:10.1111/os.70064
7. Moldovan F. Role of serum biomarkers in differentiating periprosthetic joint infections from aseptic failures after total hip arthroplasties. J Clin Med. 2024;13(19):5716. doi:10.3390/jcm13195716
8. Moulin D, Sellam J, Berenbaum F, Guicheux J, Boutet MA. The role of the immune system in osteoarthritis: mechanisms, challenges and future directions. Nat Rev Rheumatol. 2025;21(4):221–236. doi:10.1038/s41584-025-01223-y
9. Hu K, Song M, Song T, Jia X, Song Y. Osteoimmunology in osteoarthritis: unraveling the interplay of immunity, inflammation, and joint degeneration. J Inflamm Res. 2025;18:4121–4142. doi:10.2147/jir.S514002
10. Murray PJ. Macrophage polarization. Annual Rev Physiol. 2017;79(1):541–566. doi:10.1146/annurev-physiol-022516-034339
11. Zhang H, Lin C, Zeng C, et al. Synovial macrophage M1 polarisation exacerbates experimental osteoarthritis partially through R-spondin-2. Ann Rheumatic Dis. 2018;77(10):1524–1534. doi:10.1136/annrheumdis-2018-213450
12. Zheng L, Wang Y, Qiu P, et al. Primary chondrocyte exosomes mediate osteoarthritis progression by regulating mitochondrion and immune reactivity. Nanomedicine. 2019;14(24):3193–3212. doi:10.2217/nnm-2018-0498
13. Wu W, An X, Gong W, et al. ShK‐modified UCMSCs Inhibit M1‐like macrophage polarization and alleviate osteoarthritis progression via PI3K/Akt axis. Adv Sci. 2025;12(9):2406822. doi:10.1002/advs.202406822
14. Qian Y, Chu G, Zhang L, et al. M2 macrophage-derived exosomal miR-26b-5p regulates macrophage polarization and chondrocyte hypertrophy by targeting TLR3 and COL10A1 to alleviate osteoarthritis. J Nanobiotechnol. 2024;22(1):72. doi:10.1186/s12951-024-02336-4
15. Chou C-H, Jain V, Gibson J, et al. Synovial cell cross-talk with cartilage plays a major role in the pathogenesis of osteoarthritis. Sci Rep. 2020;10(1):10868. doi:10.1038/s41598-020-67730-y
16. He Q, Chen B, Liang F, Zhang Z. Association between the atherogenic index of plasma and bone mineral density among adult women: NHANES (2011–2018). Front Endocrinol. 2024;15:1363889. doi:10.3389/fendo.2024.1363889
17. Zhang Y, Ji Q. Macrophage polarization in osteoarthritis progression: a promising therapeutic target. Front Cell Develop Biol. 2023;11:1269724. doi:10.3389/fcell.2023.1269724
18. Pello OM, De Pizzol M, Mirolo M, et al. Role of c-MYC in alternative activation of human macrophages and tumor-associated macrophage biology. Blood. 2012;119(2):411–421. doi:10.1182/blood-2011-02-339911
19. Zeng GG, Zhou J, Jiang WL, et al. A Potential role of NFIL3 in atherosclerosis. Curr Prob Cardiol. 2024;49(1Pt B):102096. doi:10.1016/j.cpcardiol.2023.102096
20. Darling NJ, Toth R, Arthur JS, Clark K. Inhibition of SIK2 and SIK3 during differentiation enhances the anti-inflammatory phenotype of macrophages. Biochem J. 2017;474(4):521–537. doi:10.1042/bcj20160646
21. Chen H, Ni Q, Li B, Chen L. Identification of differentially expressed genes in synovial tissue of osteoarthritis based on a more robust integrative analysis method. Clin Rheumatol. 2021;40:3745–3754. doi:10.1007/s10067-021-05649-z
22. Rong G, Zhang Z, Zhan W, Chen M, Ruan J, Shen C. VEGFA, MYC, and JUN are abnormally elevated in the synovial tissue of patients with advanced osteoarthritis. Sci Rep. 2025;15(1):2066. doi:10.1038/s41598-024-80551-7
23. Zhang Q, Sun C, Liu X, Zhu C, Ma C, Feng R. Mechanism of immune infiltration in synovial tissue of osteoarthritis: a gene expression-based study. J Orthopaedic Surg Res. 2023;18(1):58. doi:10.1186/s13018-023-03541-x
24. Fisch KM, Gamini R, Alvarez-Garcia O, et al. Identification of transcription factors responsible for dysregulated networks in human osteoarthritis cartilage by global gene expression analysis. Osteoarthritis Cartilage. 2018;26(11):1531–1538. doi:10.1016/j.joca.2018.07.012
25. Wang W, Mai H, Xu H, et al. 4, 8-Dicarboxyl-8, 9-iridoid-1-glycoside inhibits apoptosis in human osteoarthritis chondrocytes via enhanced c-MYC-mediated cholesterol metabolism in vitro. Arthritis Res Therapy. 2023;25(1):240. doi:10.1186/s13075-023-03217-1
26. Li S, Liu J, Liu S, Jiao W, Wang X. Chitosan oligosaccharides packaged into rat adipose mesenchymal stem cells-derived extracellular vesicles facilitating cartilage injury repair and alleviating osteoarthritis. J Nanobiotechnol. 2021;19:1–19. doi:10.1186/s12951-021-01086-x
27. Li S, Han J, Cao J, et al. ADORA2B, transcriptionally suppressing by MYC, promotes ferroptosis of chondrocytes via inhibition of the PI3K/Akt pathway in mice with osteoarthritis. Environ Toxicol. 2024;39(5):2487–2501. doi:10.1002/tox.24131
28. Manoharan R. Salt-inducible kinases (SIKs) in cancer: mechanisms of action and therapeutic prospects. Drug Discovery Today. 2025;30(1):104279. doi:10.1016/j.drudis.2024.104279
29. Zhu YS, Yan H, Mo TT, Zhang JN, Jiang C. Identification of diagnostic markers in synovial tissue of osteoarthritis by weighted gene coexpression network. Biochem Genet. 2023;61(5):2056–2075. doi:10.1007/s10528-023-10359-z
30. Tian K, He X, Lin X, et al. Unveiling the role of Sik1 in osteoblast differentiation: implications for osteoarthritis. Mol Cell Biol. 2024;44(10):411–428. doi:10.1080/10985549.2024.2385633
31. Kim MK, Kwon JO, Song MK, et al. Salt-inducible kinase 1 regulates bone anabolism via the CRTC1-CREB-Id1 axis. Cell Death Dis. 2019;10(11):826. doi:10.1038/s41419-019-1915-4
32. Cao J, Ding H, Shang J, Ma L, Wang Q, Feng S. Weighted gene co-expression network analysis reveals specific modules and hub genes related to immune infiltration of osteoarthritis. Ann translat Med. 2021;9(20):1525. doi:10.21037/atm-21-4566
33. Schlenner S, Pasciuto E, Lagou V, et al. NFIL3 mutations alter immune homeostasis and sensitise for arthritis pathology. Ann Rheum Dis. 2019;78(3):342–349. doi:10.1136/annrheumdis-2018-213764
34. Kim HS, Sohn H, Jang SW, Lee GR. The transcription factor NFIL3 controls regulatory T-cell function and stability. Exp Mol Med. 2019;51(7):1–15. doi:10.1038/s12276-019-0280-9
35. Wen Z, Qiu L, Ye Z, et al. The role of Th/Treg immune cells in osteoarthritis. Front Immunol. 2024;15:1393418. doi:10.3389/fimmu.2024.1393418
36. Zhang H, Zheng C, Chen W, et al. PP2 alleviates the progression of osteoarthritis by inhibiting Wnt/β-catenin and activating TGF-β/Smad signaling. Int Immunopharmacol. 2023;124(Pt B):110948. doi:10.1016/j.intimp.2023.110948
37. Liu J, Chen J, Chen S, et al. Salinomycin alleviates osteoarthritis progression via inhibiting Wnt/β-catenin signaling. Int Immunopharmacol. 2022;112:109225. doi:10.1016/j.intimp.2022.109225
38. Qi J, Yu Y, Akilli Öztürk Ö, et al. New Wnt/β-catenin target genes promote experimental metastasis and migration of colorectal cancer cells through different signals. Gut. 2016;65(10):1690–1701. doi:10.1136/gutjnl-2014-307900
39. Askari A, Naghizadeh MM, Homayounfar R, et al. Increased serum levels of IL-17A and IL-23 are associated with decreased vitamin D3 and increased pain in osteoarthritis. PLoS One. 2016;11(11):e0164757. doi:10.1371/journal.pone.0164757
40. Zheng J, Xiong X, Li K, Wang G, Cao H, Huang H. SPHK2 knockdown inhibits the proliferation and migration of fibroblast-like synoviocytes through the IL-17 signaling pathway in osteoarthritis. J Inflamm Res. 2024;17:7221–7234. doi:10.2147/jir.S476077
41. Huang J, Bu Z, Liu W, et al. Cartilage decellularized matrix hydrogel loaded with protocatechualdehyde for targeted epiphycan treatment of osteoarthritis. Mater Today Bio. 2024;27:101124. doi:10.1016/j.mtbio.2024.101124
42. Huang Z, Xie L, Xu Y, et al. Essential oils from Zingiber striolatum diels attenuate inflammatory response and oxidative stress through regulation of MAPK and NF-κB signaling pathways. Antioxidants. 2021;10(12):2019. doi:10.3390/antiox10122019
43. Zou Z, Pan S, Sun C, et al. AM1241 inhibits chondrocyte inflammation and ECM degradation through the Nrf2/HO-1 and NF-κB pathways and alleviates osteoarthritis in mice. Mol med. 2025;31(1):9. doi:10.1186/s10020-024-01012-5
44. Qiao Z, Tang J, Wu W, Tang J, Liu M. Acteoside inhibits inflammatory response via JAK/STAT signaling pathway in osteoarthritic rats. BMC Complementary Alternative Med. 2019;19(1):264. doi:10.1186/s12906-019-2673-7
45. Reid KF, Price LL, Harvey WF, et al. Muscle power is an independent determinant of pain and quality of life in knee osteoarthritis. Arthritis Rheumatol. 2015;67(12):3166–3173. doi:10.1002/art.39336
46. Schaefer LV, Dech S, Carnarius F, Rönnert F, Bittmann FN, Becker R. Adaptive force of hamstring muscles is reduced in patients with knee osteoarthritis compared to asymptomatic controls. BMC Musculoskeletal Disorders. 2024;25(1):34. doi:10.1186/s12891-023-07133-y
47. Cross AL, Hawkes J, Wright HL, Moots RJ, Edwards SW. APPA (apocynin and paeonol) modulates pathological aspects of human neutrophil function, without supressing antimicrobial ability, and inhibits TNFα expression and signalling. Inflammopharmacology. 2020;28(5):1223–1235. doi:10.1007/s10787-020-00715-5
48. Na HS, Kwon JY, Lee S-Y, et al. Metformin attenuates monosodium-iodoacetate-induced osteoarthritis via regulation of pain mediators and the autophagy–lysosomal pathway. Cells. 2021;10(3):681. doi:10.3390/cells10030681
49. Cillero‐Pastor B, Caramés B, Lires‐Deán M, Vaamonde‐García C, Blanco FJ, López‐Armada MJ. Mitochondrial dysfunction activates cyclooxygenase 2 expression in cultured normal human chondrocytes. Arthritis Rheum. 2008;58(8):2409–2419. doi:10.1002/art.23644
50. van den Akker GG, Caron MM, Peffers MJ, Welting TJ. Ribosome dysfunction in osteoarthritis. Current Opinion Rheumatol. 2022;34(1):61–67. doi:10.1097/BOR.0000000000000858
51. Du J, Zhou T, Zhang W, Peng W. Developing the new diagnostic model by integrating bioinformatics and machine learning for osteoarthritis. J Orthopaedic Surg Res. 2024;19(1):832. doi:10.1186/s13018-024-05340-4
52. Xie X, Doody GM, Shuweihdi F, Conaghan PG, Ponchel F. B-cell capacity for expansion and differentiation into plasma cells are altered in osteoarthritis. Osteoarthritis Cartilage. 2023;31(9):1176–1188. doi:10.1016/j.joca.2023.03.017
53. Xie X, van Delft MAM, Shuweihdi F, et al. Auto-antibodies to post-translationally modified proteins in osteoarthritis. Osteoarthritis Cartilage. 2021;29(6):924–933. doi:10.1016/j.joca.2021.03.008
54. Lv H, Wang J, Wan Y, Zhou Y. Exploration of the key pathways and genes involved in osteoarthritis genesis: evidence from multiple platforms and real-world validation. J Inflamm Res. 2024;17:10223–10237. doi:10.2147/jir.S488935
55. Klein-Wieringa IR, de Lange-Brokaar BJ, Yusuf E, et al. Inflammatory cells in patients with endstage knee osteoarthritis: a comparison between the synovium and the infrapatellar fat pad. J Rheumatol. 2016;43(4):771–778. doi:10.3899/jrheum.151068
56. Hao G, Han S, Xiao Z, Shen J, Zhao Y, Hao Q. Synovial mast cells and osteoarthritis: current understandings and future perspectives. Heliyon. 2024;10(24):e41003. doi:10.1016/j.heliyon.2024.e41003
57. Wang X, Zhang P, Tang Y, Chen Y, Zhou E, Gao K. Mast cells: a double-edged sword in inflammation and fibrosis. Front Cell Dev Biol. 2024;12:1466491. doi:10.3389/fcell.2024.1466491
58. Qin Y, Jin HZ, Li YJ, Chen Z. Emerging role of eosinophils in resolution of arthritis. Front Immunol. 2021;12:764825. doi:10.3389/fimmu.2021.764825
59. Endisha H, Datta P, Sharma A, et al. MicroRNA-34a-5p promotes joint destruction during osteoarthritis. Arthritis Rheumatol. 2021;73(3):426–439. doi:10.1002/art.41552
60. Jiang R, Gao H, Cong F, Zhang W, Song T, Yu Z. Circ_DHRS3 positively regulates GREM1 expression by competitively targeting miR-183-5p to modulate IL-1β-administered chondrocyte proliferation, apoptosis and ECM degradation. Int Immunopharmacol. 2021;91:107293. doi:10.1016/j.intimp.2020.107293
61. Liao H, Tu Q, Kang Y, et al. CircNFIX regulates chondrogenesis and cartilage homeostasis by targeting the miR758-3p/KDM6A axis. Cell Proliferation. 2022;55(11):e13302. doi:10.1111/cpr.13302
62. Baek D, Lee KM, Park KW, et al. Inhibition of miR-449a promotes cartilage regeneration and prevents progression of osteoarthritis in in vivo rat models. Mol Ther Nucleic Acids. 2018;13:322–333. doi:10.1016/j.omtn.2018.09.015
63. Hu K, Wen H, Song T, Che Z, Song Y, Song M. Deciphering the role of LncRNAs in osteoarthritis: inflammatory pathways unveiled. J Inflamm Res. 2024;17:6563–6581. doi:10.2147/jir.S489682
64. Fu C, Lin Y, Lin Q, et al. Protective mechanism of Prim-O-glucosylcimifugin in the treatment of osteoarthritis: based on lncRNA XIST regulation of Nav1.7. Biomed Pharmacothe. 2024;181:117597. doi:10.1016/j.biopha.2024.117597
65. Tian F, Wang J, Zhang Z, Yang J. LncRNA SNHG7/miR-34a-5p/SYVN1 axis plays a vital role in proliferation, apoptosis and autophagy in osteoarthritis. Biol Res. 2020;53(1):9. doi:10.1186/s40659-020-00275-6
66. Fu C, Qiu Z, Huang Y, et al. Achyranthes bidentata polysaccharides alleviate endoplasmic reticulum stress in osteoarthritis via lncRNA NEAT1/miR-377-3p pathway. Biomed Pharmacothe. 2022;154:113551. doi:10.1016/j.biopha.2022.113551
67. Li S, Xie F, Shi K, Wang J, Cao Y, Li Y. Gossypol ameliorates the IL-1β-induced apoptosis and inflammation in chondrocytes by suppressing the activation of TLR4/MyD88/NF-κB pathway via downregulating CX43. Tissue Cell. 2021;73:101621. doi:10.1016/j.tice.2021.101621
68. Jingjing S, Chenwei X, Wei J, et al. Gossypol acetic acid alleviates the ferroptosis of chondrocytes in osteoarthritis by inhibiting GPX4 methylation. Curr Med Chem. 2025;32(12):2422–2439. doi:10.2174/0109298673280730231211092905
69. Chen J, Xu W, Dai T, et al. Pioglitazone-loaded cartilage-targeted nanomicelles (Pio@C-HA-DOs) for osteoarthritis treatment. Int J Nanomed. 2023;18:5871–5890. doi:10.2147/ijn.S428938
70. Xue X, Dai T, Chen J, et al. PPARγ activation suppresses chondrocyte ferroptosis through mitophagy in osteoarthritis. J Orthop Surg Res. 2023;18(1):620. doi:10.1186/s13018-023-04092-x
 © 2025 The Author(s). This work is published and licensed by Dove Medical Press Limited. The
full terms of this license are available at https://www.dovepress.com/terms
and incorporate the Creative Commons Attribution
- Non Commercial (unported, 4.0) License.
By accessing the work you hereby accept the Terms. Non-commercial uses of the work are permitted
without any further permission from Dove Medical Press Limited, provided the work is properly
attributed. For permission for commercial use of this work, please see paragraphs 4.2 and 5 of our Terms.
© 2025 The Author(s). This work is published and licensed by Dove Medical Press Limited. The
full terms of this license are available at https://www.dovepress.com/terms
and incorporate the Creative Commons Attribution
- Non Commercial (unported, 4.0) License.
By accessing the work you hereby accept the Terms. Non-commercial uses of the work are permitted
without any further permission from Dove Medical Press Limited, provided the work is properly
attributed. For permission for commercial use of this work, please see paragraphs 4.2 and 5 of our Terms.
Recommended articles
Cuproptosis-Related Biomarkers and Characterization of Immune Infiltration in Sepsis
Wang Y, Qiu X, Liu J, Liu X, Pan J, Cai J, Liu X, Qu S
Journal of Inflammation Research 2024, 17:2459-2478
Published Date: 22 April 2024
Identification of Mitophagy-Associated Genes for the Prediction of Metabolic Dysfunction-Associated Steatohepatitis Based on Interpretable Machine Learning Models
Deng B, Chen Y, He P, Liu Y, Li Y, Cai Y, Dong W
Journal of Inflammation Research 2024, 17:2711-2730
Published Date: 3 May 2024
Network Analysis of Osteoarthritis Progression Using a Steiner Minimal Tree Algorithm
Xie Y, Shao F, Ji Y, Feng D, Wang L, Huang Z, Wu S, Sun F, Jiang H, Miyamoto A, Wang H, Zhang C
Journal of Inflammation Research 2024, 17:3201-3209
Published Date: 18 May 2024
Comprehensive Analysis of Programmed Cell Death-Related Genes in Diagnosis and Synovitis During Osteoarthritis Development: Based on Bulk and Single-Cell RNA Sequencing Data
Zhou J, Jiao S, Huang J, Dai T, Xu Y, Xia D, Feng Z, Chen J, Li Z, Hu L, Meng Q
Journal of Inflammation Research 2025, 18:751-778
Published Date: 17 January 2025
Identification of Senescence-Related Genes for the Prediction of Ulcerative Colitis Based on Interpretable Machine Learning Models
Ma J, Chen C, Wang N, Fang T, Liu Y, He P, Dong W
Journal of Inflammation Research 2025, 18:3431-3447
Published Date: 10 March 2025