Back to Journals » Journal of Pain Research » Volume 19
Machine Learning Approach to Predict Postoperative Pain and Opioid Usage in Elective Primary Spine Surgery: A Retrospective Study
Authors Saksenberg DL ![]() , Lee RY, Vaidya S, Yuan A, Jeong SJ, Lockwood N, Li J
, Lee RY, Vaidya S, Yuan A, Jeong SJ, Lockwood N, Li J ![]() , Russo GS
, Russo GS
Received 15 January 2026
Accepted for publication 24 March 2026
Published 27 March 2026 Volume 2026:19 596384
DOI https://doi.org/10.2147/JPR.S596384
Checked for plagiarism Yes
Review by Single anonymous peer review
Peer reviewer comments 4
Editor who approved publication: Dr Andrea Tinnirello
Danny L Saksenberg,1,2,* Ryan Y Lee,1,* Swaroopa Vaidya,3 Alex Yuan,1 Seongho J Jeong,1 Nishita Lockwood,1 Jinlei Li,1 Glenn S Russo3,4
1Department of Anesthesiology, Yale University School of Medicine, New Haven, CT, USA; 2Emerge, Johannesberg, SA, USA; 3Connecticut Orthopedic Institute, Hartford Healthcare, Hartford, CT, USA; 4Frank H Netter School of Medicine at Quinnipiac University, Hamden, CT, USA
*These authors contributed equally to this work
Correspondence: Jinlei Li, Department of Anesthesiology, Yale University School of Medicine, New Haven, CT, USA, Email [email protected]
Background: Machine learning (ML) was used to predict pain scores and opioid consumption after elective spine surgery in the presence and absence of erector spinae plane block (ESP).
Methods: A single-center retrospective chart review of 2796 cases was conducted. These cases were divided into the control group (N=1255) consisting of patients who did not receive the ESP blocks and the treatment group consisting of patients who received the blocks (N=1541). The gradient boosting ensemble tree methodology was employed to develop the AI predictive models. Feature importance for each optimized gradient boosting model was quantified using impurity-based importance scores, as implemented in the scikit-learn library. Partial dependence analysis was conducted to characterize the direction, magnitude, and non-linear nature of predictor-outcome relationships across clinically relevant ranges.
Results: On unadjusted univariate analysis, the ESP block was associated with a statistically significant (p=0.01) yet clinically irrelevant 1% increase in average postsurgical pain scores. Conversely, ESP block was associated with a statistically non-significant (p=0.13) but clinically relevant 6.7% reduction in opioid consumption (MME/kg/day). These associations are exploratory and should not be interpreted as causal. Three AI models were developed to predict postsurgical pain and opioid consumption. The best-performing model, which predicts average postsurgical pain, achieved a mean absolute error of 1.24 on a 10-point scale (approximately 12.4%). High-importance predictors across the models included preoperative pain scores, serum glucose, and white blood cell count, as well as age.
Conclusion: It is feasible to use machine-learning approaches to identify risk factors for postoperative pain and predict population-level pain scores and opioid consumption in spine surgery using large datasets; these models are not intended for individual-level prediction. The role of ESP in spine surgery, however, remains uncertain, and ESP block findings should be interpreted as exploratory associations only.
Keywords: machine learning, spine, pain, opioid
Introduction
Machine Learning (ML) techniques are increasingly applied across medical specialties.1,2 In particular, ML is impacting the way healthcare is practiced in the perioperative arena for spine surgery, with one study using ML models to predict the total cost of care associated with ambulatory single-level lumbar decompression and to identify the associated major cost drivers which included anesthesia type, operating room time and race.3 Effective postoperative pain control with judicious opioid use is integral to enhanced recovery after spine surgeries. Though ML have recently been explored to predict postoperative pain and opioid consumption,4 little was done with for spine surgery.5 In particular, Erector Spinae Plane (ESP) blocks6 represent an emerging interfascial block technique7 that has been shown to potentially have opioid-reducing analgesic benefits for the past decade,8 yet most studies are small, either randomized trials with restrictive clinical features or single center retrospective studies,9–11 hence the effects of ESP in spine surgery remain controversial.12
In this study, we aim to assess the potential benefit of an ML algorithm in developing AI models to predict postoperative pain scores and opioid consumption with and without ESP blocks, using the substantial clinical and demographic data gathered from 2796 elective cervical, thoracic, and lumbar spinal surgery cases in a single tertiary academic institution. We hypothesized that the ML models developed in this study would be able to produce clinically meaningful and statistically robust predictions of postoperative reported pain scores and opioid consumption, and that the models’ predictions would be sufficiently accurate to guide clinical decision making. In addition, we aim to assess the clinical benefit of ESP blocks on elective cervical, thoracic, and lumbar spine surgery. We hypothesized that ESP blocks would be associated with clinically meaningful reductions in postoperative pain (defined as a Minimal Clinically Important Difference, MCID of a 5% reduction) and/or opioid consumption (MCID of a 5% decrease). It should be noted that the ESP-related analyses are exploratory and descriptive in nature; as univariate observational analyses, they are not intended to establish causality or adjust for confounding.
Methods
Machine Learning (ML) Data Transformation
This study was determined to be exempt from full review by the Yale University Institutional Review Board (IRB exemption category: retrospective review of de-identified electronic medical record data involving no more than minimal risk to participants), and informed patient consent was waived accordingly. All patient data were handled in a de-identified manner to protect confidentiality, and the study was conducted in accordance with the principles of the Declaration of Helsinki. A retrospective chart review was conducted between January 2022 to December 2023 in a total of 2796 cases undergoing elective, primary surgery performed at cervical, thoracic, or lumbar spine at an academic center. Exclusion criteria included revision, and patients who received blocks other than ESP. Relevant clinical data on demographics, postoperative pain scores, opioid consumption and postoperative recovery outcome collected via electronic medical record (EMR), and subsequently used in ML model generation.
Prior to model training, categorical variables (eg, sex, race, procedure type, spine level, and psychiatric comorbidities) were transformed using one-hot encoding to create machine-readable binary indicators.13 To retain all encounters for analysis, missing numerical predictor values were imputed using a large constant sentinel value, while missing categorical values were represented through explcit “Unknown” indicator levels.14 This approach preserved dataset completeness while accommodating tree-based modeling. In tree-based ensemble methods such as gradient boosting, sentinel values allow the model to isolate missing observations into distinct regions of the feature space through split thresholds without requiring removal of incomplete encounters. Sensitivity analyses using alternative imputation strategies (eg, median imputation for continuous variables) produced similar (though slightly worse) model performance and feature-importance patterns, suggesting that the primary findings were not materially sensitive to the choice of imputation strategy.
Average postoperative pain was calculated using a time-weighted area-under-the-curve (AUC) approach applied to all recorded postoperative pain scores during the inpatient hospitalization period following surgery. This method accounts for irregular pain score sampling and represents the cumulative pain burden experienced during the postoperative hospital stay. Similarly, total postoperative opioid consumption during the inpatient hospitalization period was calculated as morphine milligram equivalents (MME) and then normalized as MME per kilogram of body weight per day (MME/kg/day). This normalization accounts for differences in patient body mass and length of hospital stay, allowing more comparable assessment of analgesic requirements across individuals. This standardized metric was chosen because raw total MME can be strongly influenced by patient size and hospital duration, which may vary substantially in spine surgery populations.
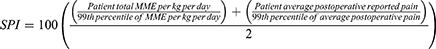
In addition, we developed a novel Standardized Pain Index (SPI) as a composite metric that integrates subjective pain reports with objective opioid consumption. This index was developed independently for this study; for reference, validated pain scales such as the PEG scale assess pain intensity and interference simultaneously.15 The First, we calculated the 99th percentile for both the average postoperative pain score and the MME/kg/day across the entire dataset. Each patient’s individual values were then expressed as a percentage of these 99th percentile benchmarks. The final SPI was derived using the following formula:
We also created a binary variable to capture whether the patient received the ESP block and categorized surgical level as cervical, thoracic, lumbar, sacral, or multiple. Surgical level was included as a predictor variable in the machine-learning models to account for potential differences in operative characteristics across spine regions. Analysis was subsequently performed in patients who received preoperative ultrasound guided ESP blocks with plain bupivacaine and liposomal bupivacaine and those who did not.
Across the dataset, missingness for most key predictors was low (generally <5%), reflecting the structured nature of the electronic medical record–derived dataset.
Statistical Hypotheses and Univariate Analysis
Univariate statistical analyses using Pearson correlation, as implemented in the SciPy statistical library,16 were used to assess the association between ESP block and postoperative outcomes. Two primary clinical hypotheses were specified a priori:
- Analgesic efficacy hypothesis - use of an ESP block is associated with lower average postsurgical pain scores, with a clinically meaningful difference contextualized by a MCID of 5% reduction, or 0.5 on a 10-point numerical rating scale.17
- Opioid-sparing hypothesis - Use of an ESP block is associated with reduced postoperative opioid requirements, with clinical relevance contextualized by an MCID corresponding to a 5% reduction in MME/kg/day.
Correlation coefficients (r) and corresponding two-sided p-values were calculated for the following outcomes: time-weighted average postsurgical pain score, MME/kg/day, and the standardized pain index (SPI). Prior to analysis, outcome variables were screened for non-finite values, and observations containing missing or infinite values were excluded on a per-analysis basis to ensure numerical stability. Statistical significance was assessed at a two-sided alpha level of 0.05. Because ESP block allocation was not randomized, these analyses were intentionally limited to exploratory unadjusted associations and were not intended to control for potential confounding variables such as surgical level or procedure type.
Machine Learning Algorithm: Gradient Boosting
All encounters meeting inclusion criteria were retained for model development to minimize selection bias and preserve the full heterogeneity of the perioperative population. Following data cleaning, merging across clinical domains, and deduplication at the encounter level, the final analytic cohort consisted of 2796 unique surgical encounters, of which 1541 received ESP block and 1255 received did not.
Predictive models were developed using a gradient boosting regression framework implemented in the scikit-learn library (Python) to capture complex, non-linear relationships between demographic, laboratory, procedural, and perioperative clinical variables and postoperative pain- and opioid-related outcomes.18 The analytic cohort was randomly partitioned at the encounter level into a training set comprising 70% of cases (approximately 1960 encounters) and an independent test set comprising 30% of cases (approximately 840 encounters).
Model hyperparameters were optimized within the training set using Optuna, a Bayesian optimization framework. Candidate hyperparameter configurations were evaluated using internal cross-validation within the training set to minimize mean absolute error, while the independent held-out test set remained completely unused during tuning and was reserved solely for final model evaluation. Optimization targeted minimization of mean absolute error (MAE), a metric that is less sensitive to extreme values than squared-error–based measures and therefore well suited to outcomes such as postoperative opioid consumption and pain scores.
Feature Importance and Variable-Impact Analysis
To characterize the clinical variables most strongly associated with model predictions, feature importance for each optimized gradient boosting model was quantified using impurity-based importance scores as implemented in the scikit-learn library.19 In this approach, importance reflects the cumulative reduction in the model’s loss function attributable to splits on a given variable across all trees in the ensemble.20
Feature-importance analyses were derived from the training dataset, while predictive performance was evaluated independently on the held-out test cohort.21 Given the potential impact of collinearity, importance rankings were interpreted descriptively rather than as independent or causal effect estimates. To enhance interpretability, importance values were ranked and summarized for each outcome, and the most influential predictors were reported. Importance scores are presented as relative proportions rather than absolute effects and should be interpreted as indicators of predictive contribution rather than causal influence.22
Partial Dependence Analysis and Interpretation of Variable Directionality
To better characterize the direction, magnitude, and non-linear nature of predictor-outcome relationships across clinically relevant ranges, we performed partial dependence analysis. Partial dependence plots (PDPs) were generated for selected high-importance predictors across the three primary outcomes - average postoperative pain score, postoperative opioid consumption (MME/kg/day), and the standardized pain index (SPI) - using the trained models (Figure 1). To enhance interpretability and reduce distortion from extreme values, plots were restricted to the 5th–95th percentile range of each predictor. All PDPs were derived from models trained exclusively on the training dataset to preserve separation from test-set evaluation.
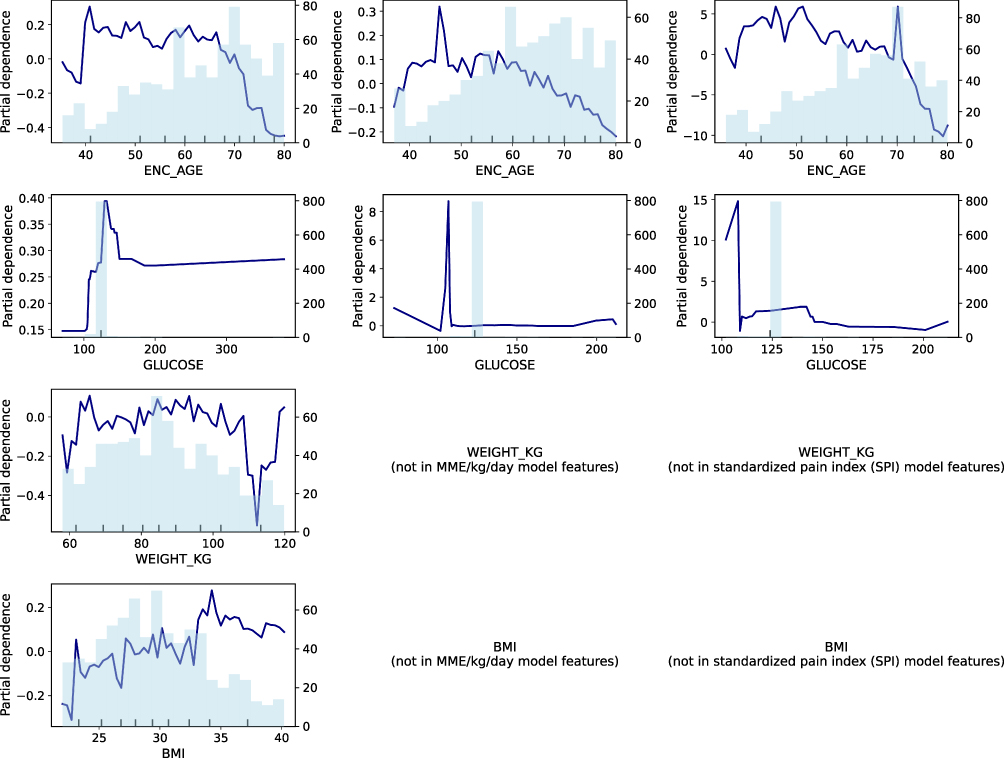 |
Figure 1 Partial dependence plots illustrating directionality of key predictors across postoperative pain and opioid-related outcomes. Partial dependence plots (PDPs) depict the average effect of selected high-importance predictors on model-predicted outcomes derived from the gradient boosting models. Columns correspond to the three modeled outcomes: average postoperative pain score, opioid consumption expressed as morphine milligram equivalents per kilogram per day (MME/kg/day), and the standardized pain index (SPI). Rows correspond to selected predictors identified in feature-importance analyses. The x-axis represents the value of each predictor, restricted to the 5th-95th percentile range to limit the influence of extreme values. The y-axis represents the model-predicted outcome, averaged over the distribution of all other variables. Navy curves depict the partial dependence of the outcome on the predictor, while the light blue histograms indicate the distribution and density of observations across the predictor range. These plots demonstrate that the predictor-outcome relationships are frequently non-linear and range-dependent, illustrating why feature-importance rankings alone do not convey effect direction or functional form. PDPs provide population-level interpretability and do not imply causality. |
Results
Demographics, Clinical Characteristics, Pain Scores and Opioid Consumption with versus without Erector Spinae Plane (ESP) Block
Baseline demographic and clinical characteristics of patients who received ESP blocks and those who did not are summarized in Table 1. The two groups were comparable with respect to most demographics including age, body mass index (BMI), and sex distribution. However, differences were observed in selected clinical characteristics, including tobacco use and discharge disposition.
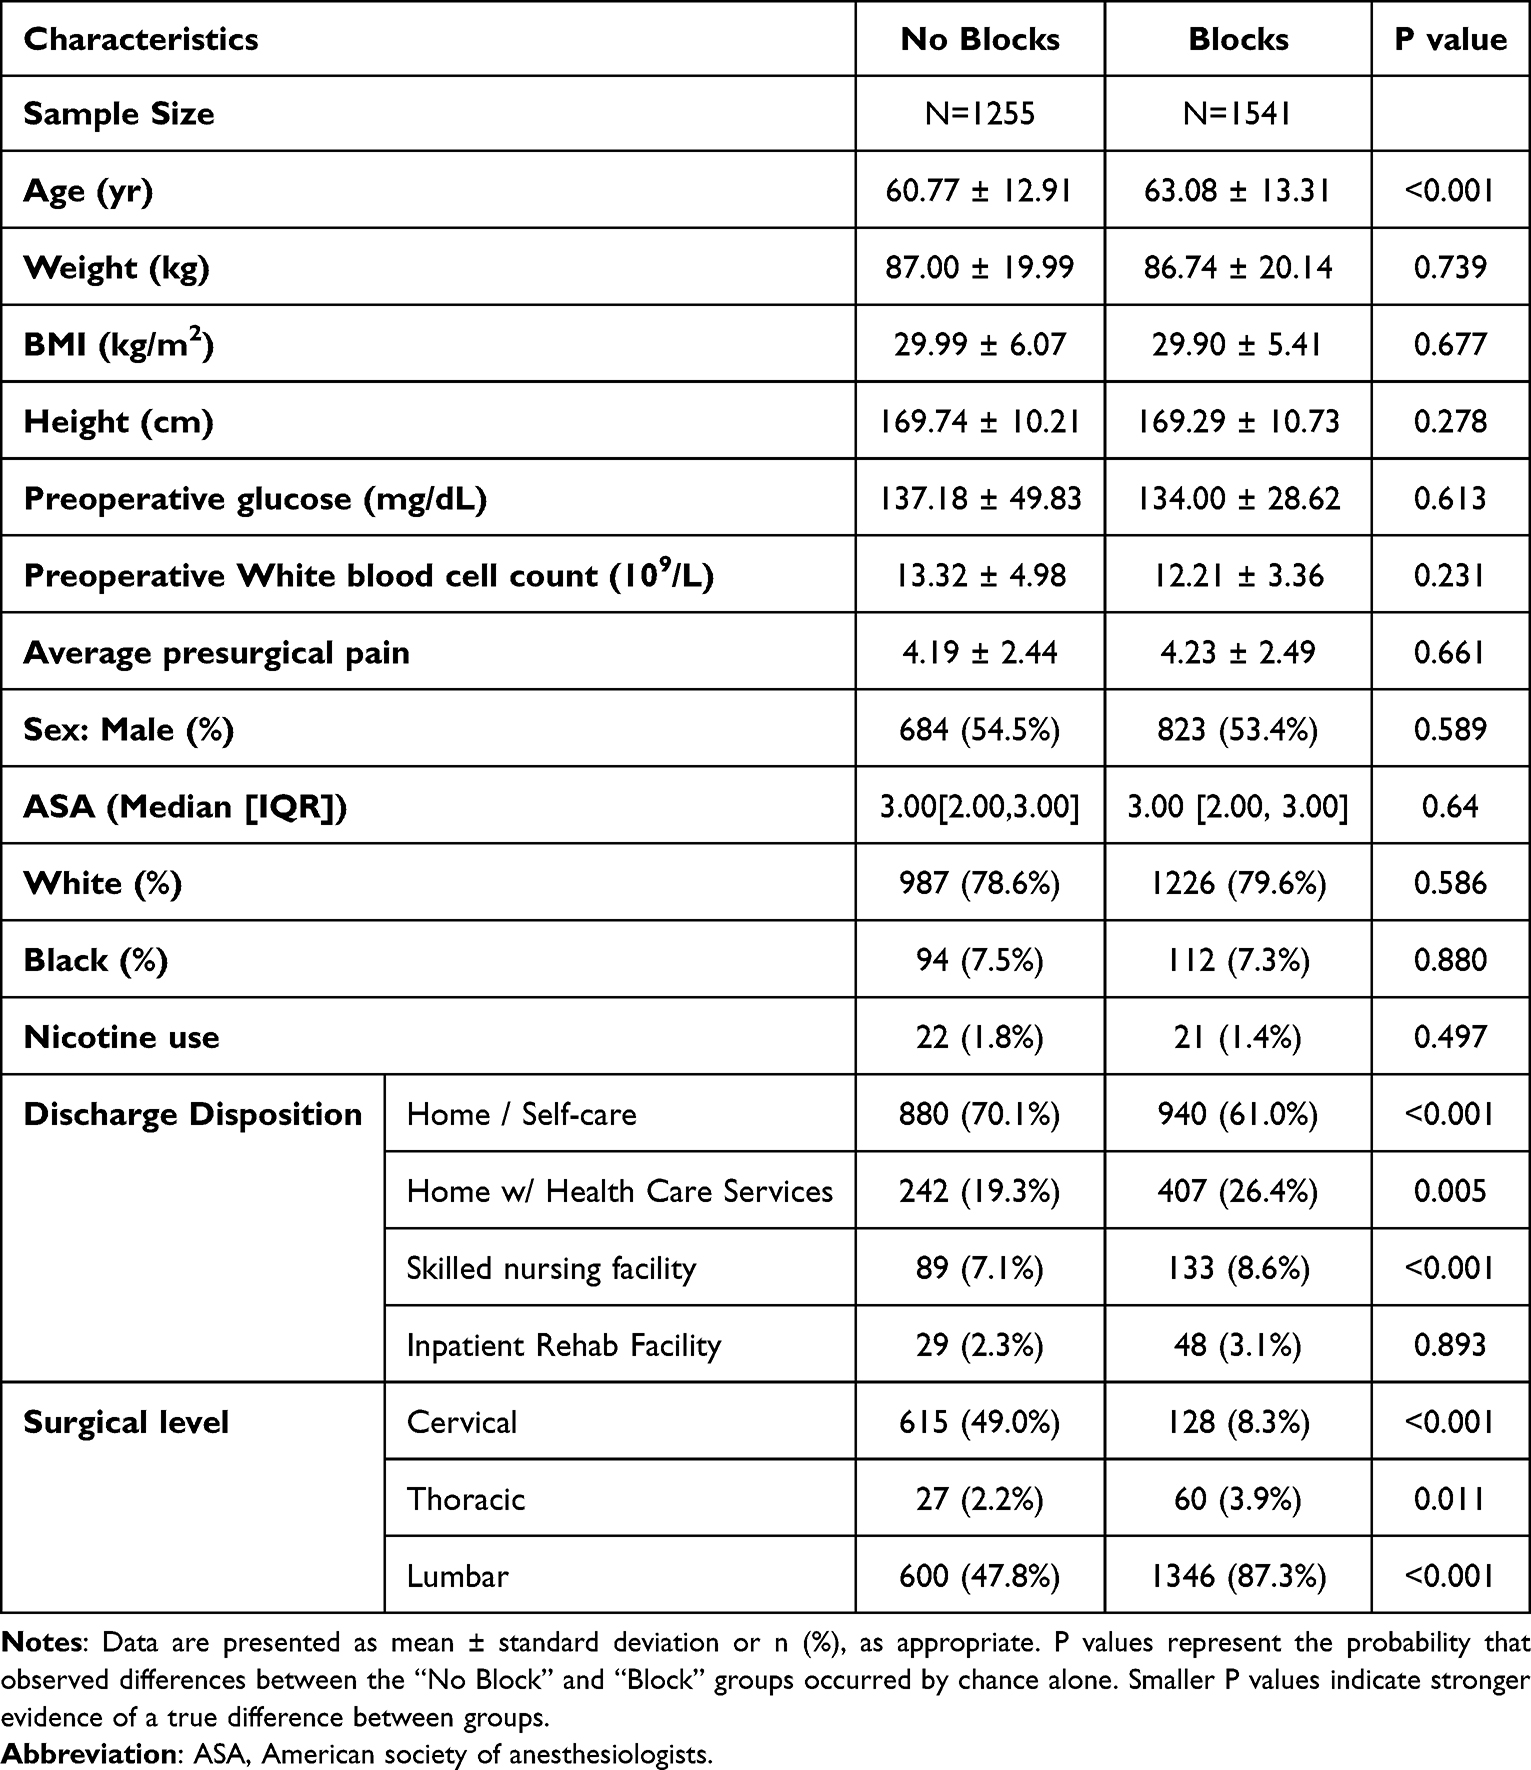 |
Table 1 Patient Demographics and Perioperative Characteristics |
ESP block status demonstrated a weak negative, statistically nonsignificant correlation with postoperative opioid use (p=0.13), yet a 6.7% reduction which was above the predefined MICD of 5%. ESP group and no block group consumed 0.496 ± 1.100 and 0.531 ± 1.423 MME/kg/day respectively. In contrast, ESP block use was associated with a statistically significant positive correlation with average postoperative pain scores (p=0.01); However, this corresponded to a clinically irrelevant mean increase of 0.04 points, approximately a 1% increase, which is well below the predefined MICD of 5%. The standardized pain index (SPI) showed a near-zero positive correlation with ESP use and did not reach statistical significance at the predefined alpha level of 0.05 (p=0.71; Table 2).
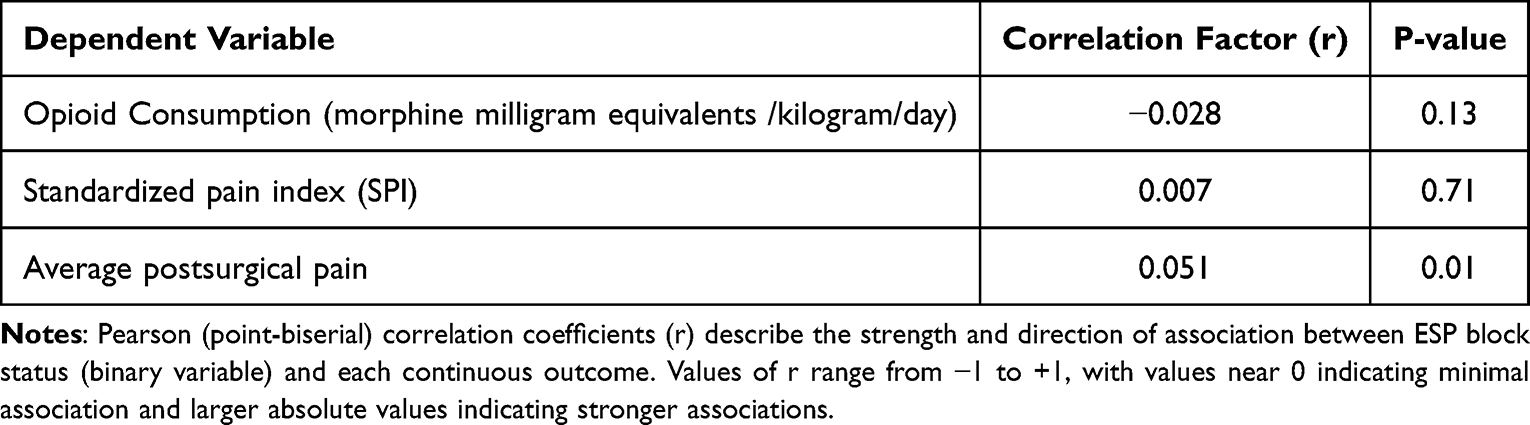 |
Table 2 Association Between ESP Block and Postsurgical Pain and Opioid Consumption |
Assessment of Model Performance
Model performance was evaluated using a combination of quantitative error metrics and graphical analyses applied to a held-out testing cohort using Mean Absolute Error (MAE), comprising approximately 30% of the available encounters. This testing set was not used during model training or hyperparameter optimization and therefore provides an unbiased assessment of model generalizability.
Feature importance was derived from the trained gradient boosting models using impurity-based importance scores, and the most influential predictors for each outcome were summarized to aid interpretability and clinical relevance.
To assess model behavior across the full spectrum of predicted values rather than relying solely on a single summary statistic, we performed a series of visualization-based evaluations. First, we examined prediction–outcome agreement plots in which test-set predictions were divided into ten equally sized groups based on predicted values. For each group, the mean predicted value was plotted against the corresponding mean observed outcome and compared to a reference line representing perfect agreement when y and x are the same.
These plots provide insight into how well the models preserve accuracy across low, intermediate, and high ranges of the target variables, pain scores, opioid consumption and SPI. Close adherence to the reference line indicates strong agreement between predicted and observed values, whereas systematic deviations reflect tendencies toward overprediction or underprediction in specific value ranges. In the present models, modest deviations from perfect calibration were observed at the extremes of the outcome distributions (likely reflecting increased clinical variability and lower observation density in these regions), whereas agreement was strongest within the mid-range where the majority of observations were concentrated (Figure 2). This approach allows identification of regions in which model performance is robust as well as ranges where clinical variability or data sparsity may limit predictive precision.
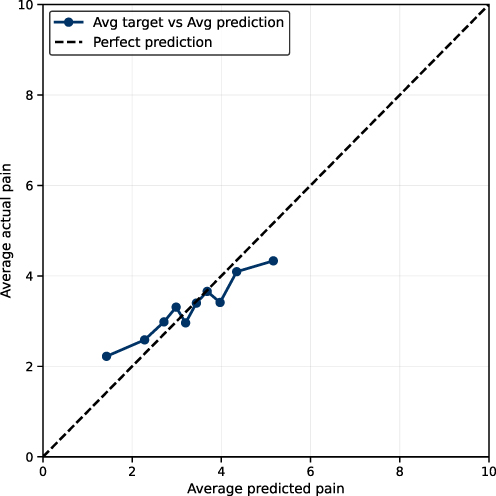 |
Figure 2 Calibration plot of postsurgical pain prediction. This figure assesses how closely the model’s predicted postsurgical pain scores match the observed (actual) postsurgical pain scores in the held-out test cohort. X-axis (Average predicted pain): The model’s predicted postsurgical pain score on a 0–10 numerical rating scale, averaged within groups of patients with similar predicted values (deciles of predicted pain). Y-axis (Average actual pain): The observed postsurgical pain score on the same 0–10 scale, averaged within the same patient groups. Points/solid line: Each point represents one group (approximately one-tenth of the test set, grouped by predicted pain). The plotted line connects these group averages. Dashed diagonal line (y = x): “Perfect agreement”. If the points lie on this line, it means the predicted pain score matches the actual pain score on average for that group. |
In addition, we visualized individual-level prediction dispersion using sorted prediction scatter plots (Figure 3). Together, the combination of MAE-based quantitative evaluation and complementary graphical analyses provides a comprehensive assessment of model accuracy, stability, and behavior across the full range of postoperative pain and opioid consumption outcomes.
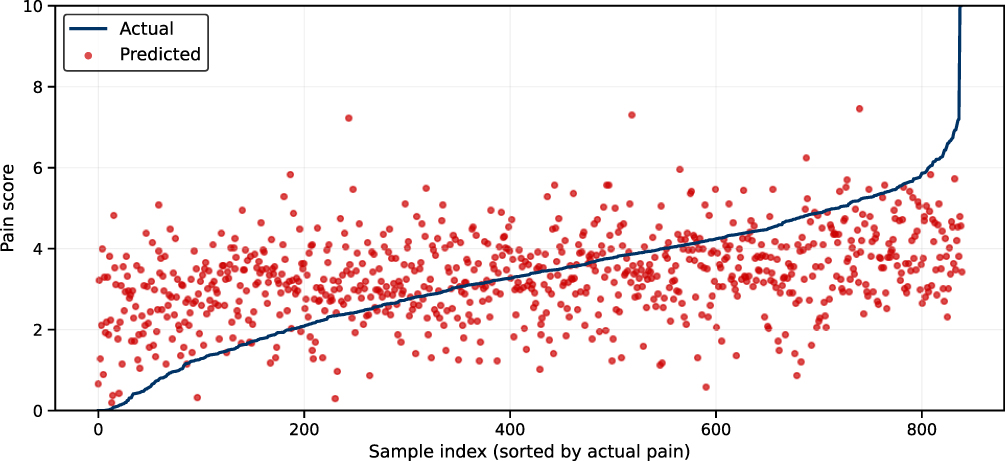 |
Figure 3 Individual-level comparison of observed and predicted postsurgical pain scores. This figure compares actual and model-predicted postsurgical pain scores for individual patients in the held-out test cohort. X-axis (Sample index): Each point represents a single patient encounter. Patients are ordered from left to right by increasing observed (actual) pain score. The x-axis does not represent time. Y-axis (Pain score): Postsurgical pain score measured on a 0–10 numerical rating scale, where higher values indicate greater pain. Blue line (Actual pain): The blue line shows the observed average postsurgical pain score for each patient, sorted from lowest to highest pain. Red dots (Predicted pain): Each red dot represents the pain score predicted by the machine-learning model for the corresponding patient based on preoperative and perioperative clinical features. The proximity of the red dots to the blue line indicates how closely the model’s predictions match the observed pain scores. While predictions generally follow the overall trend of increasing pain, noticeable dispersion around the blue line highlights substantial individual-level variability, reflecting the inherent difficulty of precisely predicting postoperative pain for individual patients. This supports the interpretation that the model performs best at capturing population-level trends rather than providing precise individualized predictions. |
Predictive Models
Three separate machine-learning models were developed to predict postoperative pain- and opioid-related outcomes. Model performance metrics are summarized in Table 3. Predictions with substantially larger errors (approaching the full scale of the outcome) would indicate poor model utility, whereas errors approaching zero would be ideal for real-time clinical decision support. Among the three models, prediction of average postsurgical pain score (PPS) demonstrated the strongest overall performance, with a MAE of 1.24 on a 10-point numerical rating scale. This indicates that, on average, predicted pain scores differed from observed values by just over one pain unit in the held-out test cohort. The model predicting postoperative opioid consumption (MME/kg/day) achieved an MAE of 0.46 across the full cohort (0.53 for patients receiving no ESP block; 0.50 for patients receiving an ESP block). For contextual reference, opioid use in chronic pain populations has been reported in a range of 0–2.4 MME/kg/day. Prediction of the pain index prior to percentile normalization yielded a mean absolute error of 17.44 on a 0–100 scale.
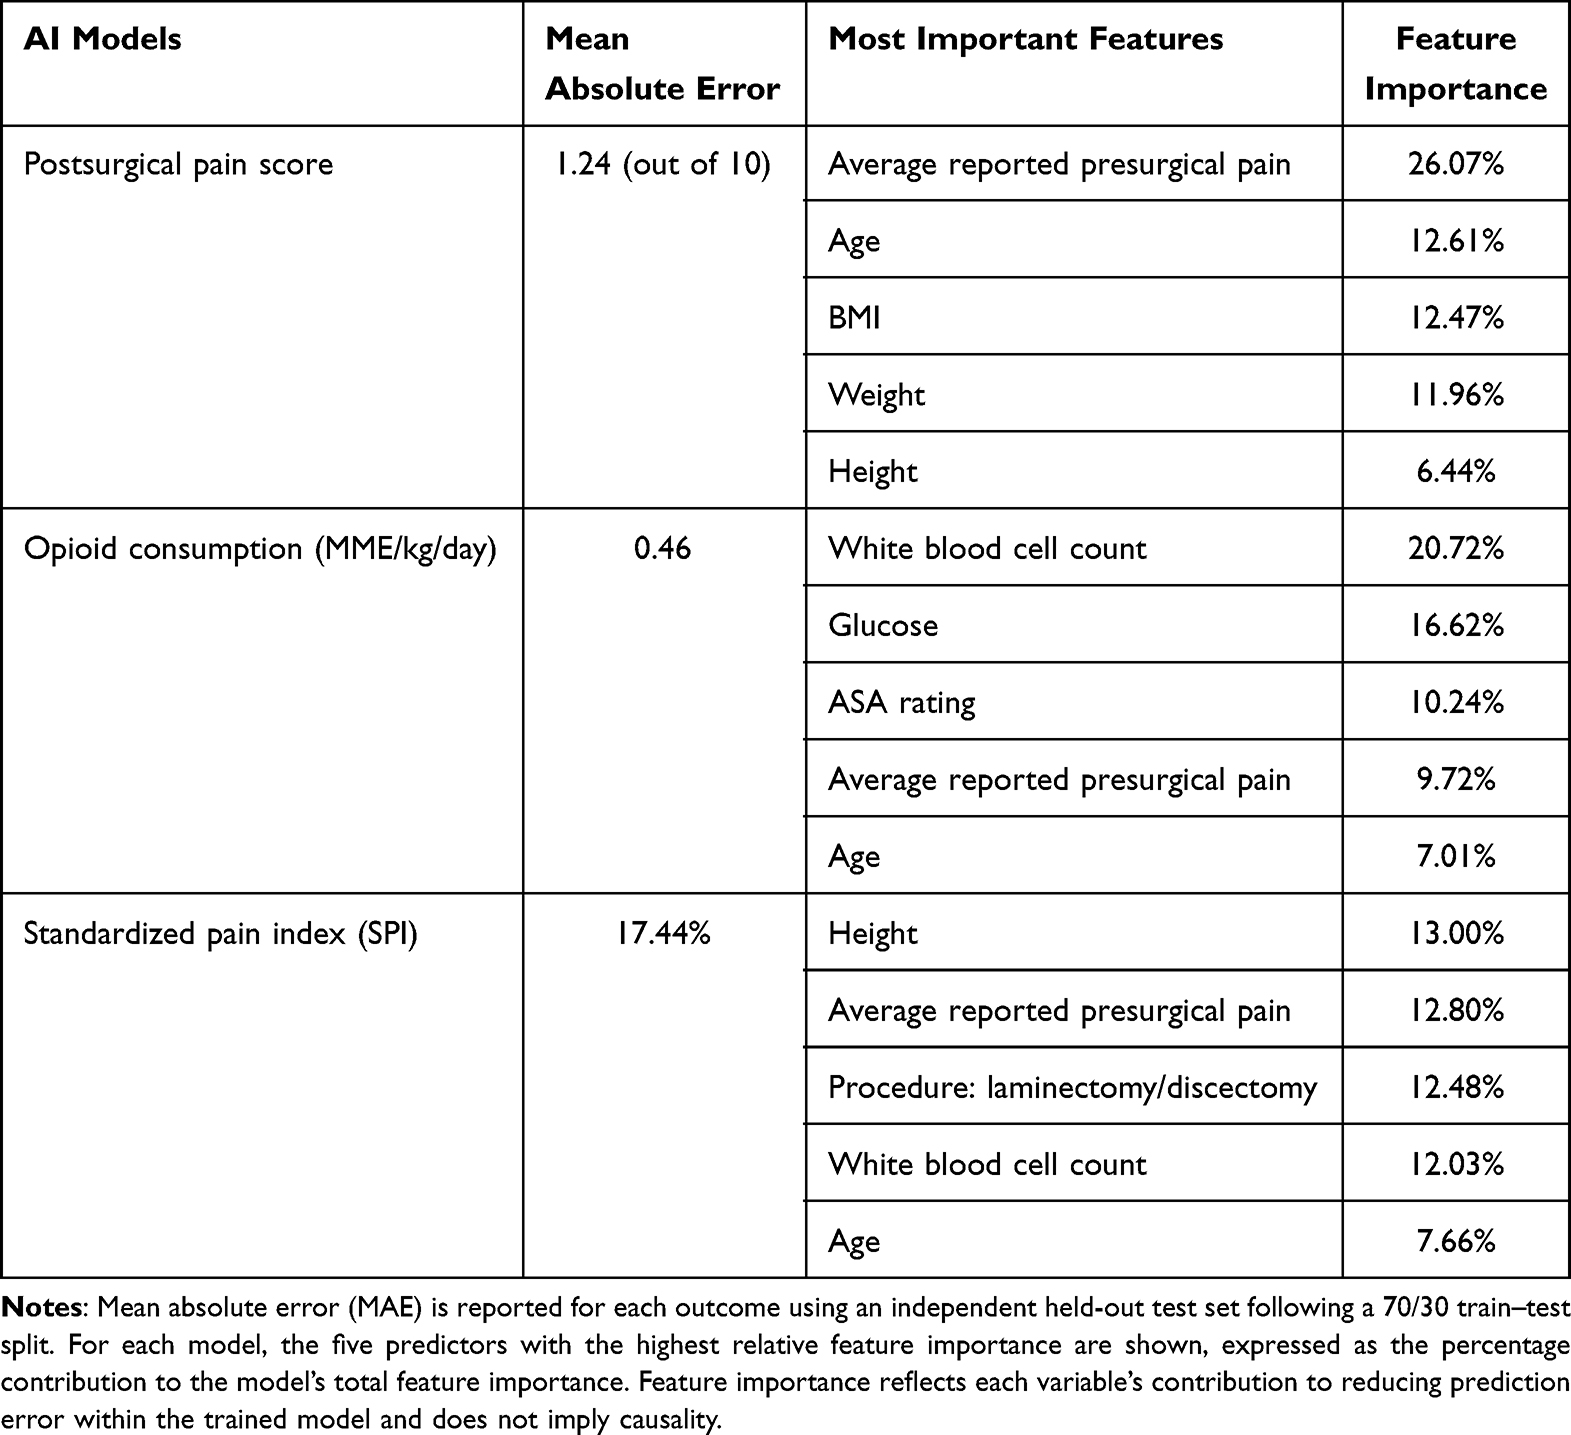 |
Table 3 Performance of Gradient Boosting Models Predicting Postoperative Pain and Opioid Consumption and Five Most Important Features for Each Model |
Feature-importance analysis revealed clinically coherent predictors across all three models (Table 3). For prediction of average postsurgical pain score, the most influential variables were average reported presurgical pain, age, body mass index, and selected anthropometric and laboratory measures. Prediction of MME/kg/day was most strongly influenced by white blood cell count, serum glucose, ASA physical status, average presurgical pain, and age. For the standardized SPI model, the most important predictors were average reported presurgical pain, procedure type (laminectomy or discectomy), white blood cell count, and age.
Across all outcomes, predicted values demonstrated generally consistent directionality with observed values. We illustrated the agreement between average predicted and observed postsurgical pain scores across the test cohort using grouped prediction–outcome plots. The proximity of the plotted points to the reference line representing reliable agreement indicates stable model performance across much of the clinical range, particularly for pain scores between approximately 2.5 and 4.5. Mild underprediction was observed at the extremes of the distribution (Figure 2).
To assess individual-level performance, Figure 3 presents a scatter plot comparing predicted and observed postsurgical pain scores for individual test cases, ordered by increasing observed pain. While model predictions generally track the upward trend of observed values, notable dispersion is evident, underscoring the intrinsic difficulty of predicting pain at the individual patient level as opposed to population averages (Figure 3). As in Figure 2, modest underprediction is most apparent at higher pain scores, while mid-range predictions demonstrate closer agreement with observed values.
Performance of the standardized pain index (SPI) model is shown in Figure 4, with an MAE of 17.44 on a 0–100 scale. Similar to the pain score model, predictive stability was greatest in the middle range of the index (approximately 30–50). In contrast to the pain score model, the SPI model demonstrated a slight tendency toward overprediction in this range, consistent with residual heterogeneity in opioid utilization patterns and pain reporting (Figure 4).
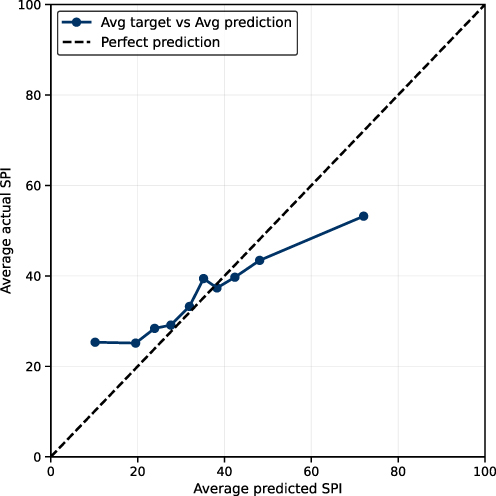 |
Figure 4 Prediction–outcome agreement plot for the Standardized Pain Index (SPI). This figure evaluates how accurately the machine-learning model predicts the Standardized Pain Index (SPI) in the held-out test cohort. X-axis (Average predicted SPI): The model’s predicted SPI value, averaged within groups of patients with similar predicted scores (deciles of predicted SPI). SPI is expressed on a 0–100 scale, where higher values represent greater overall pain burden. Y-axis (Average actual SPI): The observed SPI value, averaged within the same patient groups. Points/solid line: Each point represents one group (approximately one-tenth of the test population). The solid line connects the average predicted and average observed SPI values for these groups. Dashed diagonal line (y = x): Line of perfect agreement. Points lying on this line indicate that the model’s predictions match the observed SPI values on average. |
Discussion
This exploratory large dataset study using AI ML models demonstrated the feasibility to predict pain and opioid consumption after spine surgery.23 For postoperative pain prediction, the best-performing model achieved a mean absolute error (MAE) of approximately 1.24 points on a 10-point numerical rating scale, indicating that, on average, predicted pain scores differed from observed values by just over one pain unit. At a population level, this degree of error is generally considered acceptable, as it is comparable to the inter-observer and intra-patient variability commonly observed in clinical pain reporting. After including opioid consumption, the MAE values for composite index, SPI, ranged up to approximately 17 units on a 0–100 standardized scale, reflecting the greater inherent variability of opioid utilization. Accordingly, the present models are best interpreted as tools for population-level insight and hypothesis generation rather than individualized clinical guidance.
Very few studies looked at the utility of ML in the field of pain management from different perspectives. One study utilized ML and electroencephalography data to predict response to opioid treatment in acute pain management for 81patients who underwent total hip replacement surgery.24 This ML model was able to predict responders with an accuracy of 65% for postoperative pain. One of the earliest utilizations of ML in spine study was built in 2016, featuring a predictive AI model using ensemble decision tree technique to predict clinically significant proximal junctional kyphosis and proximal junctional failure.25 The model showed promising accuracy of 86.3% with AUC of 0.89. Our study expanded existing literature and provided a predictive modal on postoperative pain scores and opioid consumption on a population level. Direct comparisons with prior machine-learning studies are limited by differences in outcome definitions, cohort characteristics, and performance metrics.26
Regarding the statistically significant but below MICD increase in pain score and simultaneous statistically nonsignificant but above MICD reduction in opioid consumption, this univariate analyses of ESP in spine surgery were not intended to establish causality or to adjust for confounding factors. Rather they aimed to characterize the direction and magnitude of crude associations between ESP block use and postoperative outcomes, which provided an interpretable statistical reference point that complements the multivariable, non-linear relationships achieved by the machine-learning models.27
We acknowledge several limitations. Even though our study had substantial case number and the predictive models showed promising results, the models developed in this project cannot be directly deployed in other institutions without site-specific retraining and data harmonization.28 This limitation primarily reflects differences in data structure, patient populations, and clinical workflows across institutions rather than the modeling approach itself. Because ESP block allocation was not randomized and group characteristics such as surgical level differed between groups, future analyses incorporating multivariable adjustment or prospective randomized designs would be necessary to better address potential confounding. At this stage, it requires the exact same format for each parameter to be inputted in the predictive models for it to function as intended. Therefore, it was still limited to a single institution and one type of surgery, thus limits the generalizability of our promising results in the predictive models. Furthermore, even for the best model predicting average postsurgical pain—which demonstrated the strongest predictive performance with a mean absolute error of 1.24 points on a 10-point pain scale—the scatter plot of this model, the predicted values are still widely dispersed from the ideal values. This suggests that this model is not yet usable at the individual level and remains insufficient for direct clinical deployment as a clinical assistant tool at this preliminary stage.29
It should be noted that in tree-based ensemble machine-learning models such as gradient boosting, relationships between predictors and outcomes are inherently non-linear, non-monotonic, and frequently context-dependent. As a result, a given variable may exert different effects at different value ranges or under different clinical contexts. In addition, unlike traditional linear regression models, where coefficients indicate a constant directional effect (positive or negative) across the full range of a variable, machine-learning models do not assume a single linear slope.
This study has several strengths. First, it demonstrated the feasibility of using ML to predict acute pain and opioid consumption. Methodologically, a major strength is the use of gradient boosting ensemble learning as the primary modeling technique to tackle heterogeneous clinical data and model non-linear interactions.30 To control model complexity and limit overfitting, cross-validated tuning and held-out testing were employed, which also enabled feature-importance analysis to identify the variables that most strongly contributed to model predictions. Additionally, we are the first to define a Standardized Pain Index (SPI) by integrating subjective pain scores and objective opioid use per kilogram per day into a composite outcome value.
This study suggests that incorporating additional cases across multiple institutions and surgical types would enable continued refinement of gradient boosting–based models and facilitate systematic comparison with alternative machine-learning approaches, including random forests, support vector machines, and neural networks, using standardized regression-based performance metrics evaluated on held-out data,31 particularly in the setting of paradoxical increase in pain scores in the setting of decrease in opioid consumption in association with ESP blocks. If key sources of bias inherent to the retrospective design (most notably confounding by indication, residual unmeasured analgesic co-interventions, and selection bias) are addressed in a prospective, double-blinded RCT design, it would allow controlling for such biases and help clarify the potential clinical benefit of ESP blocks in spine surgery.
Conclusions
The use of ESP block was associated with a statistically significant yet clinically irrelevant 1% increase in pain scores, alongside a statistically non-significant but clinically relevant 6.7% reduction in opioid consumption (MME/kg/day). The best-performing AI ML model, which predicts average post-surgical pain, achieved a mean absolute error of 1.24 on a 10-point scale. High-importance predictors for postoperative pain across the models included preoperative pain score, serum glucose, white blood cell count, and age.
Clinical Relevance
It is feasible to use machine-learning approaches to identify risk factors for postoperative pain, as well as predict pain scores and opioid consumption in spine surgery at a population level using large dataset. The role of ESP in spine surgery, however, remains uncertain, and ESP block findings should be interpreted as exploratory associations only.
Funding
There is no funding to report.
Disclosure
The authors report no conflicts of interest in this work.
References
1. Haug CJ, Drazen JM. Artificial intelligence and machine learning in clinical medicine. N Engl J Med. 2023;388(13):2398–12. doi:10.1056/NEJMra2302038
2. Bellini V, Valente M, Bertorelli G, et al. Machine learning in perioperative medicine: a systematic review. J Anesth Analg Crit Care. 2022;2(1):2. doi:10.1186/s44158-022-00033-y
3. Salmons HI, Lu Y, Reed RR, Forsythe B, Sebastian AS. Implementation of machine learning to predict cost of care associated with ambulatory single-level lumbar decompression. World Neurosurg. 2022;167:e1072–e1079. doi:10.1016/j.wneu.2022.08.149
4. Langford DJ, Reichel JF, Zhong H, et al. Machine learning research methods to predict postoperative pain and opioid use: a narrative review. Reg Anesth Pain Med. 2025;50(2):102–109. doi:10.1136/rapm-2024-105603
5. Nair AA, Velagapudi MA, Lang JA, et al. Machine learning approach to predict postoperative opioid requirements in ambulatory surgery patients. PLoS One. 2020;15(7):e0236833. doi:10.1371/journal.pone.0236833
6. Pawa A, King C, Thang C, White L. Erector spinae plane block: the ultimate ‘plan A’ block? Br J Anaesth. 2023;130(5):497–502. doi:10.1016/j.bja.2023.01.012
7. Forero M, Adhikary SD, Lopez H, Tsui C, Chin KJ. The erector spinae plane block: a novel analgesic technique in thoracic neuropathic pain. Reg Anesth Pain Med. 2016;41(5):621–627. doi:10.1097/AAP.0000000000000451
8. Melvin JP, Schrot RJ, Chu GM, Chin KJ. Low thoracic erector spinae plane block for perioperative analgesia in lumbosacral spine surgery: a case series. Can J Anaesth. 2018;65(9):1057–1065. doi:10.1007/s12630-018-1145-8
9. Yayik AM, Cesur S, Ozturk F, et al. Postoperative analgesic efficacy of the ultrasound-guided erector spinae plane block in patients undergoing lumbar spinal decompression surgery: a randomized controlled study. World Neurosurg. 2019;126:e779–e785. doi:10.1016/j.wneu.2019.02.149
10. Ueshima H, Inagaki M, Toyone T, Otake H. Efficacy of the erector spinae plane block for lumbar spinal surgery: a retrospective study. Asian Spine J. 2019;13(2):254–257. doi:10.31616/asj.2018.0114
11. Almeida CR, Oliveira AR, Cunha P. Continuous bilateral erector of spine plane block at T8 for extensive lumbar spine fusion surgery: case report. Pain Pract. 2019;19(5):536–540. doi:10.1111/papr.12774
12. Sachdev D, Mamikunian G, Kia C, Zhou H. Narrative review: erector spinae block in spine surgery. J Spine Surg. 2023;9(4):454–462. doi:10.21037/jss-23-14
13. Jensen PB, Jensen LJ, Brunak S. Mining electronic health records: towards better research applications and clinical care. Nat Rev Genet. 2012;13(6):395–405. doi:10.1038/nrg3208
14. Grund S, Ludtke O, Robitzsch A. Multiple imputation of missing data in multilevel models with the R package mdmb: a flexible sequential modeling approach. Behav Res Methods. 2021;53(6):2631–2649. doi:10.3758/s13428-020-01530-0
15. Krebs EE, Lorenz KA, Bair MJ, et al. Development and initial validation of the PEG, a three-item scale assessing pain intensity and interference. J Gen Intern Med. 2009;24(6):733–738. doi:10.1007/s11606-009-0981-1
16. Virtanen P, Gommers R, Oliphant TE, et al; Contributors S. SciPy 1.0: fundamental algorithms for scientific computing in python (vol 33, 219, 2020). Nat Methods. 2020;17(3):352. doi:10.1038/s41592-020-0772-5
17. Farrar JT, Young JP Jr, LaMoreaux L, Werth JL, Poole MR. Clinical importance of changes in chronic pain intensity measured on an 11-point numerical pain rating scale. Pain. 2001;94(2):149–158. doi:10.1016/S0304-3959(01)00349-9
18. Steyerberg EW, Harrell FE. Prediction models need appropriate internal, internal-external, and external validation. J Clin Epidemiol. 2016;69:245–247. doi:10.1016/j.jclinepi.2015.04.005
19. Tanaka T. [Fundamentals] 5. Python+scikit-learn for machine learning in medical imaging. Nihon Hoshasen Gijutsu Gakkai Zasshi. 2023;79(10):1189–1193. doi:10.6009/jjrt.2023-2266
20. Strobl C, Boulesteix AL, Zeileis A, Hothorn T. Bias in random forest variable importance measures: illustrations, sources and a solution. BMC Bioinf. 2007;8(1):25. doi:10.1186/1471-2105-8-25
21. Hyndman RJ, Koehler AB. Another look at measures of forecast accuracy. Int J Forecast. 2006;22(4):679–688. doi:10.1016/j.ijforecast.2006.03.001
22. Lundberg SM, Lee SI. A unified approach to interpreting model predictions. Adv Neural Inf Process Syst. 2017;30.
23. Hingorani AD, Windt DA, Riley RD, et al. Prognosis research strategy (PROGRESS) 4: stratified medicine research. BMJ. 2013;346(feb05 1):e5793. doi:10.1136/bmj.e5793
24. Gram M, Erlenwein J, Petzke F, et al. Prediction of postoperative opioid analgesia using clinical-experimental parameters and electroencephalography. Eur J Pain. 2017;21(2):264–277. doi:10.1002/ejp.921
25. Scheer JK, Osorio JA, Smith JS, et al. Development of validated computer-based preoperative predictive model for Proximal Junction Failure (PJF) or clinically significant PJK with 86% accuracy based on 510 ASD patients with 2-year follow-up. Spine. 2016;41(22):E1328–E1335. doi:10.1097/BRS.0000000000001598
26. Collins GS, Moons KGM. Reporting of artificial intelligence prediction models. Lancet. 2019;393(10181):1577–1579. doi:10.1016/S0140-6736(19)30037-6
27. Hernan MA, Robins JM. Using big data to emulate a target trial when a randomized trial is not available. Am J Epidemiol. 2016;183(8):758–764. doi:10.1093/aje/kwv254
28. Wiens J, Saria S, Sendak M, et al. Do no harm: a roadmap for responsible machine learning for health care. Nat Med. 2019;25(9):1337–1340. doi:10.1038/s41591-019-0548-6
29. Shah NH, Milstein A, Bagley Ph DS. Making machine learning models clinically useful. JAMA. 2019;322(14):1351–1352. doi:10.1001/jama.2019.10306
30. Goldstein BA, Navar AM, Pencina MJ, Ioannidis JP. Opportunities and challenges in developing risk prediction models with electronic health records data: a systematic review. J Am Med Inform Assoc. 2017;24(1):198–208. doi:10.1093/jamia/ocw042
31. Kendale S, Kulkarni P, Rosenberg AD, Wang J. Supervised machine-learning predictive analytics for prediction of postinduction hypotension. Anesthesiology. 2018;129(4):675–688. doi:10.1097/ALN.0000000000002374
 © 2026 The Author(s). This work is published and licensed by Dove Medical Press Limited. The
full terms of this license are available at https://www.dovepress.com/terms
and incorporate the Creative Commons Attribution
- Non Commercial (unported, 4.0) License.
By accessing the work you hereby accept the Terms. Non-commercial uses of the work are permitted
without any further permission from Dove Medical Press Limited, provided the work is properly
attributed. For permission for commercial use of this work, please see paragraphs 4.2 and 5 of our Terms.
© 2026 The Author(s). This work is published and licensed by Dove Medical Press Limited. The
full terms of this license are available at https://www.dovepress.com/terms
and incorporate the Creative Commons Attribution
- Non Commercial (unported, 4.0) License.
By accessing the work you hereby accept the Terms. Non-commercial uses of the work are permitted
without any further permission from Dove Medical Press Limited, provided the work is properly
attributed. For permission for commercial use of this work, please see paragraphs 4.2 and 5 of our Terms.
Recommended articles
The Impact of Opioid Receptor Gene Polymorphism on Fentanyl and Alfentanil’s Analgesic Effects in the Pediatric Perioperative Period
Lilic J, Marjanovic VG, Budic I, Stefanovic N, Stokanovic D, Marjanovic GT, Jevtovic-Stoimenov T, Golubovic M, Zecevic M, Velickovic-Radovanovic R
Pharmacogenomics and Personalized Medicine 2024, 17:41-49
Published Date: 30 January 2024
Research Trends and Knowledge Mapping of Opioid-Free Anesthesia: A Global Bibliometric Analysis
Guo Z, Shan Z, Wang F
Journal of Multidisciplinary Healthcare 2025, 18:4145-4157
Published Date: 21 July 2025
Guidelines From the American Society of Pain and Neuroscience for Using Artificial Intelligence in Interventional Spine and Nerve Treatment
Massey C, Latif U, Deer TR, Kalia H, Guirguis M, Bicket MC, Khatri N, Tolba R, Chakravarthy K, Budwany R, Lee DW, Patel AA, Moreira AM, Jimenez DA, Patel RG, Cowan I, Christiansen S, Wilson D, Chapman KB, Vu C, Manzi S, Nashi S, Waheed M, Shah A, Nasseri M, Buchanan P, Azeem N, Petersen EA, Schatman ME, Abd-Elsayed A, Sayed D, Diwan S
Journal of Pain Research 2025, 18:4211-4235
Published Date: 20 August 2025
Factors in Surgical Placement and System Design to Reduce Pocket Awareness and Optimize the User Experience of Spinal Cord Stimulators – A Comprehensive Review
Gish B, Al-Asadi Z, Tisler AT, Mata R, Chopra H, Garcia RA, Schatman ME, Tieppo Francio V, AlFarra T, Bracero L, Karcz M, Robinson CL, Shah A, Moreira A, Sciascia AD, Deer T
Journal of Pain Research 2025, 18:6749-6768
Published Date: 14 December 2025
Comparison of Pecto-Intercostal Fascial Block Vs Transversus Thoracic Plane Block and Their Pharmacogenomics for Pain Management After Sternotomy in Cardiac Surgery: A Narrative Review
Breaux AM, Von-Koeller-Jones BM, Dufour SI, Drinkard J, Moore P, Griffin P, Shekoohi S, Ahmadzadeh S
Journal of Pain Research 2026, 19:599378
Published Date: 25 May 2026