Back to Journals » Clinical Interventions in Aging » Volume 20
Interpretable Machine Learning Model for Predicting 1-Year Unplanned Readmissions in Ischemic Stroke Patients with Diabetes: A Synergistic View of Inflammation and Metabolism
Authors Hu Y, Zhang Y, Lin P, Hu X, Zhu Y, Yan P, Fei F, Wang Q, Yao X, Ren J
Received 5 June 2025
Accepted for publication 14 November 2025
Published 27 November 2025 Volume 2025:20 Pages 2163—2175
DOI https://doi.org/10.2147/CIA.S544949
Checked for plagiarism Yes
Review by Single anonymous peer review
Peer reviewer comments 2
Editor who approved publication: Dr Maddalena Illario
Yue Hu,1,* Yunhong Zhang,2,* Peichong Lin,3,4,* Xinye Hu,5 Yiping Zhu,6 Peiling Yan,7 Fan Fei,8 Qiuyan Wang,9 Xuelin Yao,10 Jingjing Ren1
1Department of General Practice, the First Affiliated Hospital, Zhejiang University School of Medicine, Hangzhou, People’s Republic of China; 2Department of General Practice, Dali Bai Autonomous Prefecture People’s Hospital, Dali, People’s Republic of China; 3Department of General Practice, Jianqiao Street Community Health Service Center, Hangzhou, People’s Republic of China; 4Department of General Practice, Xiasi Town Central Health Center, Jiange County, Guangyuan, People’s Republic of China; 5Department of General Practice, Quxi Street Community Health Service Center, Wenzhou, People’s Republic of China; 6Department of General Practice, Zhuangqiao Sub-District Community Health Service Center, Ningbo, People’s Republic of China; 7Department of General Practice, Zhuangshi Street Community Health Service Center, Ningbo, People’s Republic of China; 8Department of General Practice, Sanshipu Town Central Health Center, Luan, People’s Republic of China; 9Department of General Practice, Kangqiao Street Community Health Service Center, Hangzhou, People’s Republic of China; 10Department of General Practice, Qixing Street Community Health Service Center, Jiaxing, People’s Republic of China
*These authors contributed equally to this work
Correspondence: Jingjing Ren, Email [email protected]
Background: To develop and validate an interpretable machine learning (ML) model integrating inflammatory and metabolic biomarkers for predicting the risk of 1-year unplanned readmission in patients with ischemic stroke (IS) and type 2 diabetes mellitus (T2DM).
Methods: This retrospective study included IS patients with comorbid T2DM who were hospitalized between June 2022 and December 2023. A total of 49 clinical variables were extracted. Least absolute shrinkage and selection operator (LASSO) regression was used for feature selection. The dataset was randomly divided into a training set (70%) and a validation set (30%). Seven widely used ML algorithms were applied to construct predictive models, and model performance was evaluated using a validation set. No external validation was performed in this study. The best-performing model was further interpreted using Shapley Additive Explanations (SHAP), and a dynamic nomogram was developed for individualized risk assessment.
Results: A total of 833 patients were included, with a 1-year unplanned readmission rate of 34.3%. LASSO regression identified nine key variables: age, neutrophil-to-lymphocyte ratio (NLR), homocysteine (HCY), glycated hemoglobin A1c (HbA1c), triglyceride-glucose (TyG) index, metformin use, and the presence of hyperlipidemia, pulmonary infection, and renal insufficiency. The random forest model demonstrated the best overall performance (area under the curve [AUC] = 0.78, F1 score = 0.70). SHAP analysis indicated that NLR, HCY, HbA1c, and TyG index were the most influential predictors, suggesting that chronic inflammation and metabolic dysregulation play pivotal roles in readmission risk.
Conclusion: The ML model based on inflammatory and metabolic biomarkers effectively predicts 1-year unplanned readmission risk in IS patients with T2DM, with good interpretability and clinical potential. The dynamic nomogram enables real-time, individualized risk prediction to support early identification of high-risk patients, tailored follow-up, and targeted allocation of healthcare resources.
Keywords: ischemic stroke, type 2 diabetes mellitus, unplanned readmission, machine learning, inflammatory biomarkers, metabolic biomarkers
Introduction
Stroke is a leading cause of death and long-term disability worldwide. In China, ischemic stroke (IS) accounts for 69.6% of incident stroke cases and 77.8% of prevalent cases.1 Among patients with IS, approximately 21.3% to 28.9% have comorbid diabetes mellitus (DM).2,3 DM is not only an independent risk factor for IS but also exacerbates post-stroke neurological impairment and significantly increases the risk of stroke recurrence and unplanned hospital readmission.4–6 A meta-analysis has shown that DM is associated with a higher risk of stroke recurrence, with a pooled hazard ratio of 1.53, independent of other cardiovascular risk factors.4 Moreover, IS patients with comorbid DM have a markedly higher risk of hospital readmission compared to those without DM, suggesting a more complex disease course and greater challenges in clinical management.6 As a critical indicator of healthcare quality, unplanned hospital readmission is often associated with poor control of chronic conditions, acute complications, or multimorbidity. Therefore, early identification of high-risk individuals among IS patients with DM, along with the development of accurate predictive models, is essential for optimizing personalized interventions, reducing healthcare costs, and improving the quality of stroke care.
Inflammation and metabolic dysregulation are key pathological foundations underlying the onset and poor prognosis of stroke, particularly in the context of diabetes mellitus.7,8 In recent years, blood-derived biomarkers have emerged as valuable tools for assessing inflammatory and metabolic states, such as the neutrophil-to-lymphocyte ratio (NLR), systemic immune-inflammation index (SII), triglyceride-glucose index (TYG), and TYG-body mass index (TYG-BMI). However, most existing studies focus primarily on conventional clinical variables or short-term outcomes, such as mortality or 30-day readmission. Although several reports have examined the individual effects of inflammation and metabolic dysregulation on post-stroke outcomes, few have integrated these biomarkers into interpretable machine learning (ML) models. In particular, evidence remains limited regarding the use of such integrative approaches for predicting 1-year unplanned readmissions among patients with IS and DM. Increasing evidence suggests that inflammatory activation and metabolic imbalance interact through shared pathways, such as oxidative stress, endothelial dysfunction, and insulin resistance, jointly accelerating vascular injury and disease progression.7,9,10 Therefore, incorporating inflammatory and metabolic biomarkers into predictive models may enable earlier and more sensitive identification of patients at high risk for readmission.
In recent years, ML has demonstrated substantial potential in medical predictive modeling. However, the widespread clinical adoption of ML has been hindered by the “black box” nature of most models, which limits interpretability and acceptance among clinicians. Interpretable ML enhances the transparency and credibility of model predictions by visualizing decision-making processes and analyzing feature importance, thereby improving clinical applicability. Existing ML research in the field of stroke has largely focused on predicting short-term outcomes such as mortality or functional recovery, with limited attention to the synergistic role of inflammatory and metabolic states, and even less emphasis on long-term outcomes such as unplanned readmission.11,12 Our previous study developed an interpretable ML model to predict readmission risk in heart failure (HF) patients with DM by integrating inflammatory and metabolic biomarkers, highlighting the synergistic impact of these biological pathways.13 Building upon this methodological framework, the present study extends this approach to IS patients with DM to predict 1-year unplanned readmission risk and support individualized risk stratification.
Materials and Methods
Study Subjects
This study retrospectively collected clinical data of patients with IS and type 2 diabetes mellitus (T2DM) who were admitted to the Department of Neurology at the First Affiliated Hospital, Zhejiang University School of Medicine, between June 2022 and December 2023.
The inclusion criteria were as follows: (1) age ≥ 18 years; (2) diagnosis of IS;14 (3) confirmed comorbidity of T2DM.15 Exclusion criteria included: (1) loss to follow-up within 1 years; (2)>30% missing values for key variables; (3) in-hospital death or transfer to another facility during hospitalization; (4) comorbidity with malignant tumors and an estimated life expectancy of less than one year; and (5) presence of immune system diseases or other severe organ dysfunction.
Data Collection and Outcomes
A total of 49 clinical variables were included in this study, encompassing demographic characteristics (such as age and sex), vital signs (including heart rate and systolic blood pressure), inflammatory markers (notably the NLR and SII), metabolic indicators (such as the TYG and TYG-BMI), biochemical parameters (eg, alanine aminotransferase, serum creatinine), and coagulation markers (eg, D-dimer, fibrinogen). Data on prescribed medications (including aspirin, statins, and metformin) and relevant comorbidities (such as hypertension, atrial fibrillation, and pulmonary infection) were also collected. Hematological parameters were collected within the first 24 hours of hospital admission. All enrolled patients were followed for a period of one year after discharge. Follow-up data were obtained through electronic medical record review and telephone interviews. The primary outcome was defined as unplanned hospital readmission occurring within one year following discharge.
The calculation formulas for these indices are as follows:
- NLR = neutrophils/lymphocytes
- MLR = monocytes/lymphocytes
- PLR = platelets/lymphocytes
- CLR = high-sensitivity C-reactive protein (hsCRP)/lymphocytes
- SII = (platelet*neutrophil)/lymphocyte
- SIRI = (neutrophil*monocyte)/lymphocyte
- TYG index = ln[(Triglyceride (TG) level (mg/dL) × Fasting blood glucose (FBG) level (mg/dL))]/2
- TYG-BMI = TYG index × Weight (kg)/Height (m)2
Development and Evaluation of Predictive Models
Data were analyzed using SPSS 23.0, Python 3.6.5, and R 3.6.4. For between-group comparisons, independent samples t-tests were applied for normally distributed data, Mann–Whitney U-tests for non-normal distributions, and chi-square tests were used for categorical variables. P-value < 0.05 was considered statistically significant.
Missing data were handled using the multivariate imputation by chained equations (MICE) method to enhance data completeness. Subsequently, feature selection was performed using least absolute shrinkage and selection operator with five-fold cross-validation (LASSO-CV), and the results were visualized. The dataset was randomly split into a training set and a validation set in a 7:3 ratio, with stratification by the outcome variable to ensure balanced class distribution. The random seed was fixed at 42. To address class imbalance, the Synthetic Minority Oversampling Technique (SMOTE) was applied to the training set.
During the model development phase, seven mainstream ML algorithms were employed, including random forest (RF), decision tree (DT), extreme gradient boosting (XGBoost), support vector machine (SVM), logistic regression (LR), light gradient boosting machine (LightGBM), and multilayer perceptron (MLP). To improve model reproducibility and predictive performance, hyperparameters were tuned for all ML algorithms. For the RF model, the number of estimators was set to 100, and a fixed random seed (random_state = 42) was applied. The XGBoost classifier was configured with objective=“binary:logistic” and use_label_encoder=False. The LightGBM model also used random_state=42 to ensure reproducibility. Probability outputs were enabled for SVM and MLP under their default settings. The LR model adopted the “lbfgs” solver with a maximum of 3000 iterations. The DT model was trained using default parameters, with a fixed random_state to maintain consistent results.
Each model was trained on the training set and evaluated on the validation set. Model performance was assessed using a comprehensive set of metrics, including the area under the receiver operating characteristic curve (AUC), calibration curves, accuracy, sensitivity, specificity, positive predictive value (PPV), negative predictive value (NPV), F1 score, and Brier score, to comprehensively evaluate the models’ discriminative ability, calibration performance, and clinical applicability.
SHAP Interpretability and Dynamic Nomogram Creation
To enhance the interpretability of the model, this study employed the Shapley Additive Explanations (SHAP) method to explain the final predictive model. By calculating the contribution of each feature to the model output, SHAP summary bar plot and summary dot plot were generated to visually demonstrate the direction and magnitude of each feature’s impact on the prediction, revealing potential nonlinear relationships and feature interactions.
Based on these insights, a dynamic nomogram was further developed to visualize the key predictive factors of the model, facilitating individualized risk assessment in clinical practice. This dynamic nomogram allows flexible adjustment of patient feature values through sliders or input boxes, providing real-time estimation of the 1-year unplanned readmission risk under various patient characteristic combinations, thereby enhancing the model’s practical utility in healthcare settings.
Results
Baseline Characteristics
A total of 1,026 IS patients with T2DM were initially enrolled between June 2022 and December 2023. After applying exclusion criteria, 833 patients were included in the final analysis and followed for one year post-discharge (Figure 1).
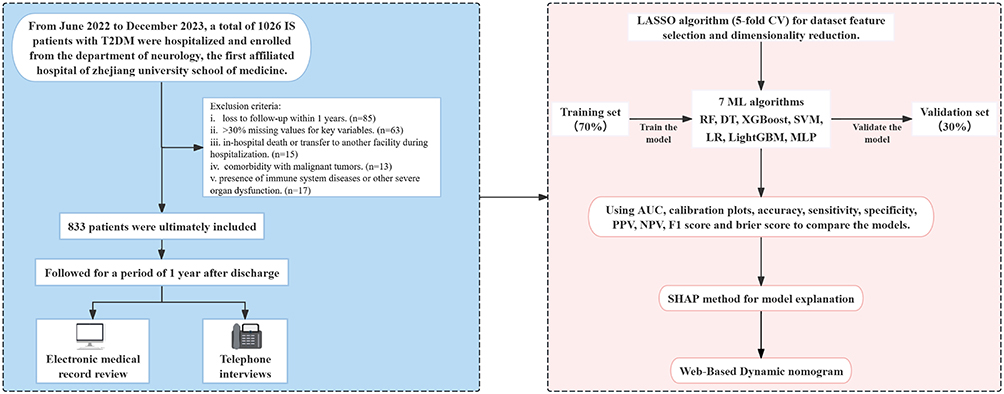 |
Figure 1 Flow chart of the study design. Abbreviations: IS, ischemic stroke; T2DM, type 2 diabetes mellitus; LASSO, least absolute shrinkage and selection operator; CV, cross-validation; RF, Random Forest; DT, Decision Tree; XGBoost, Extreme Gradient Boosting, SVM, Support Vector Machine; LR, Logistic Regression; LightGBM, Light Gradient Boosting Machine; MLP, Multilayer Perceptron; AUC, the area under the receiver-operating characteristic; PPV, positive predictive value; NPV, negative predictive value; SHAP, SHapley Additive exPlanations. |
Among the 833 patients analyzed, 286 patients (34.3%) experienced unplanned readmission within one year. As shown in Table 1, patients in the readmission group were significantly older than those in the non-readmission group (67.64±11.96 vs 64.95±11.22 years, P=0.001). Several laboratory and clinical indicators differed significantly between groups. The readmission group had significantly higher levels of NLR, c-reactive protein to lymphocyte ratio (CLR), SII, systemic inflammation response index (SIRI), TyG index, TYG-BMI, TG, FBG and hsCRP (all P < 0.05), highlighting the critical role of systemic inflammation and metabolic burden in predicting unplanned readmission. Notably, urea (P = 0.003) and D-dimer (P = 0.024) were also significantly elevated among readmitted patients, suggesting possible associations with renal dysfunction and coagulation activation. In terms of medication use, metformin was less frequently used in the readmission group (P=0.010). Regarding comorbidities, the prevalence of hyperlipidemia, pulmonary infection, and renal insufficiency was significantly higher in the readmitted group. In addition, glycated hemoglobin A1c (HbA1c) (P = 0.055), homocysteine (HCY) (P = 0.050), and sodium-glucose co-transporter 2 (SGLT2) inhibitor use (P = 0.056) showed borderline associations with readmission, with higher HbA1c and HCY levels and lower SGLT2 inhibitor use in the readmission group, suggesting potential clinical relevance that warrants further investigation.
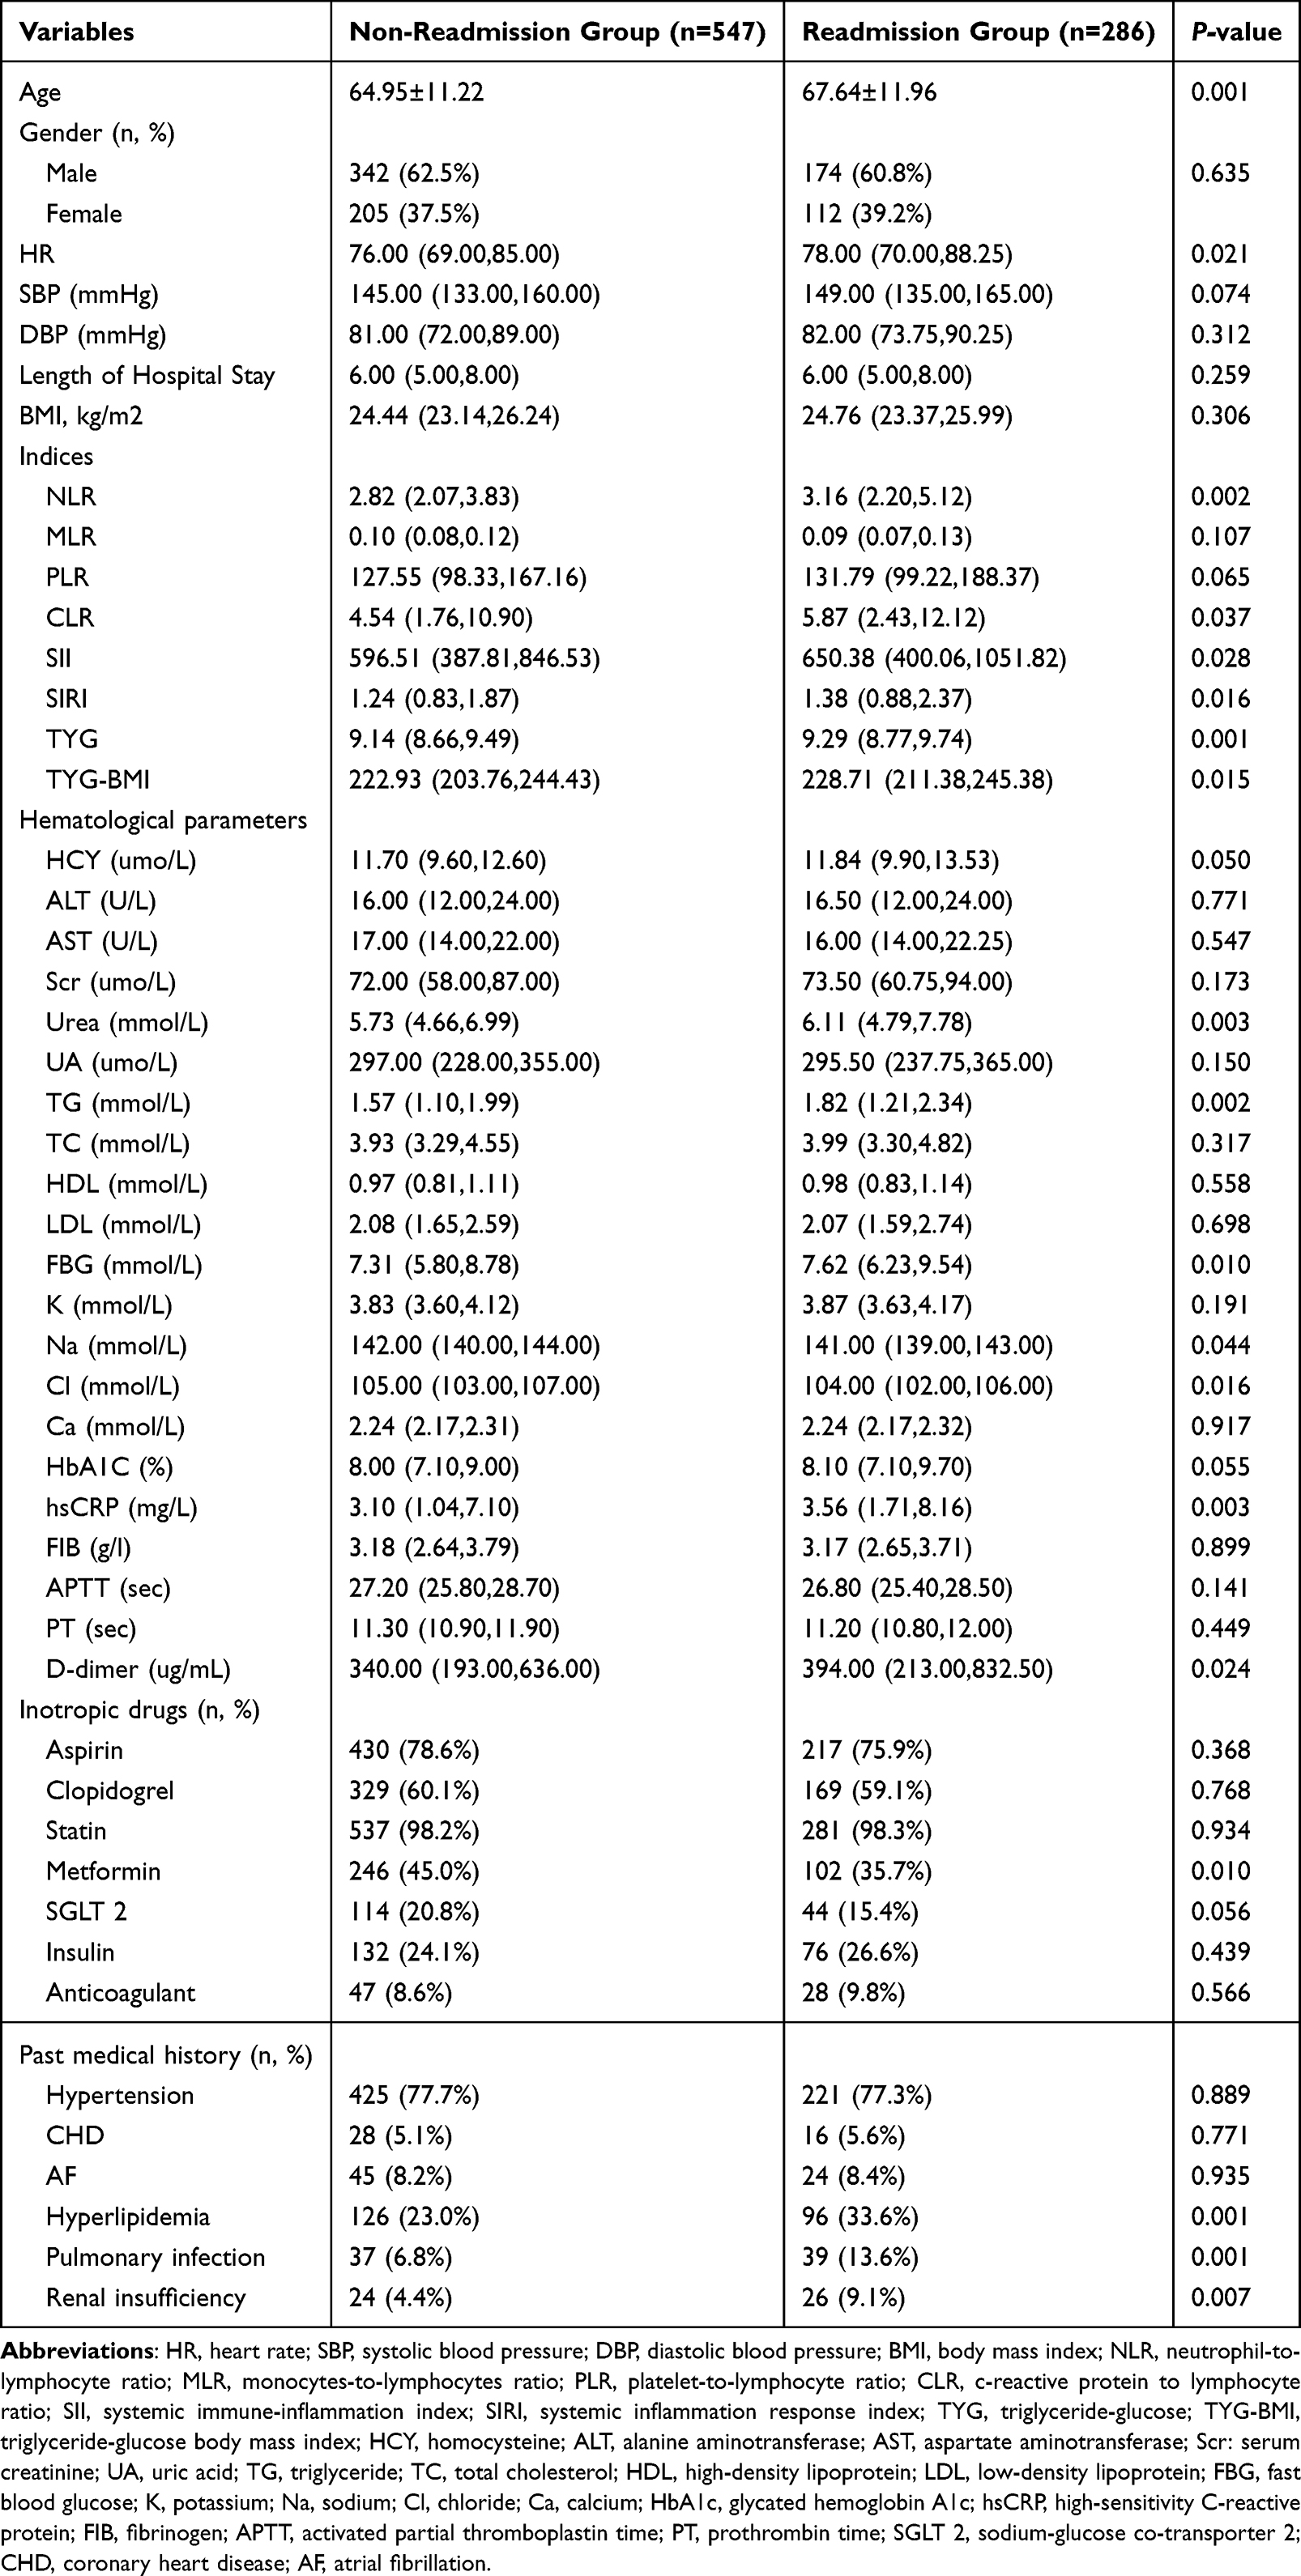 |
Table 1 Baseline Characteristics of Non-Readmission and Readmission Groups |
Feature Selection via LASSO Regression
LASSO regression with five-fold cross-validation was applied for dimensionality reduction and feature selection, aiming to improve model generalizability and identify key predictors. At the optimal regularization parameter (alpha=0.0316), a total of nine variables with significant predictive value were selected: age, NLR, HCY, HbA1c, TyG index, metformin use, hyperlipidemia, pulmonary infection, and renal insufficiency (Figure 2). Among them, NLR and HCY had the largest absolute coefficients, indicating their primary importance in predicting readmission risk. In contrast, the coefficient for metformin was negative, suggesting a potential protective effect.
 |
Figure 2 LASSO for feature selection and dimensionality reduction. Abbreviations: LASSO, least absolute shrinkage and selection operator; HbA1c, glycated hemoglobin A1c; HCY, homocysteine; TYG, triglyceride-glucose; NLR, neutrophil-to-lymphocyte ratio. |
Model Selection and Performance Evaluation
To identify the optimal predictive model, seven ML algorithms were developed and evaluated on the validation set, including RF, DT, XGBoost, SVM, LR, LightGBM, and MLP (Table 2). Among them, the RF model demonstrated superior performance across multiple metrics, with the highest AUC (0.78), accuracy (0.71), sensitivity (0.71), specificity (0.72), and F1 score (0.70), as well as the lowest Brier score (0.195), indicating strong discriminative ability and favorable calibration. The ROC curves for all models are shown in Figure 3A. Although XGBoost and LightGBM also achieved an AUC of 0.74, their overall performance was slightly inferior to that of RF. In contrast, SVM, LR, and MLP models yielded AUCs below 0.70, and their calibration curves deviated more notably from the ideal line, reflecting limited predictive accuracy. Calibration curves for all models are presented in Figure 3B. Considering predictive accuracy, robustness, and clinical interpretability, the RF model was ultimately selected as the primary predictive tool for this study.
 |
Table 2 Comparative Analysis of Performance Results for Different Machine Learning Models |
 |
Figure 3 ROC curves and calibration plots of seven machine learning models. (A) ROC curves. (B) Calibration plots. Abbreviations: AUC, the area under the receiver-operating characteristic; CI, confidence interval; RF, Random Forest; DT, Decision Tree; XGBoost, Extreme Gradient Boosting, SVM, Support Vector Machine; LR, Logistic Regression; LightGBM, Light Gradient Boosting Machine; MLP, Multilayer Perceptron. |
SHAP Interpretability Analysis
To further enhance the clinical interpretability of the model and elucidate the contribution of individual features to the prediction, SHAP was applied to the constructed RF model. As shown in Figure 4A, NLR and HCY were identified as the most influential variables for predicting 1-year unplanned readmission, showing higher mean SHAP values compared with other features. Although age and HbA1c also exhibited relatively high SHAP values, NLR and HCY were emphasized because they represent modifiable biological markers reflecting systemic inflammation and metabolic dysregulation, which are central to the study’s mechanistic focus.
 |
Figure 4 Global model explanation by the SHAP method. (A) SHAP summary bar plot. (B) SHAP summary dot plot. Abbreviations: SHAP, SHapley Additive exPlanations; NLR, neutrophil-to-lymphocyte ratio; HCY, homocysteine; HbA1c, glycated hemoglobin A1c; TYG, triglyceride-glucose. |
Analysis of SHAP value distributions (Figure 4B) revealed that NLR, HCY, HbA1c, and TyG index exhibited predominantly positive effects, indicating that increases in these variables were associated with higher readmission risk. This trend suggests a synergistic contribution of chronic inflammation and glucose-lipid metabolic dysfunction to readmission. Age, as an uncontrollable factor, was also strongly and positively associated with readmission, reflecting the poorer prognosis observed in older patients.
Regarding medication use, metformin was associated with mostly negative SHAP values, indicating a potential protective effect against readmission. Analysis of comorbidities showed that hyperlipidemia, pulmonary infection, and renal insufficiency were all positively associated with increased readmission risk, with the first two demonstrating stronger impacts. Overall, SHAP analysis emphasized the importance of inflammation- and metabolism-related biomarkers in predicting readmission among IS patients with T2DM and suggested potential targets for clinical intervention.
Dynamic Nomogram Construction
To improve the clinical applicability of the model, a dynamic, web-based nomogram was developed based on key predictive features identified through SHAP analysis. As illustrated in Figure 5, the nomogram integrates variables including age, NLR, HCY, HbA1c, TyG index, comorbidities, and medication use, allowing real-time prediction of 1-year unplanned readmission risk in patients with IS and T2DM through an interactive interface.This tool has been deployed as an online application and can be accessed at: https://scinomogram.shinyapps.io/NHAHTHMPR/
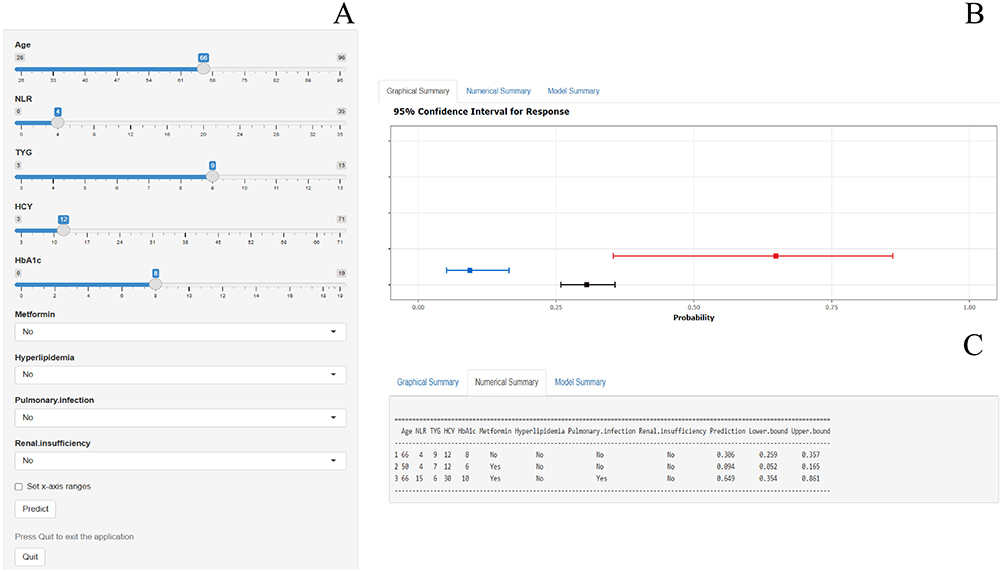 |
Figure 5 Dynamic nomogram for predicting one-Year unplanned readmissions in IS Patients with T2DM. (A) Input page: Enter the patient’s information according to the relevant variables on this page. (B) Graphical summary: This page shows the probability of a patient being readmitted to hospital with heart failure and the 95% confidence interval. (C) Numerical summary: Display the specific values of the patient’s indicators and predicted outcomes. Abbreviations: NLR, neutrophil-to-lymphocyte ratio; TYG, triglyceride-glucose; HCY, homocysteine; HbA1c, glycated hemoglobin A1c. |
With its user-friendly design, clinicians can enter patient-specific clinical information to obtain individualized risk estimates, facilitating early identification of high-risk individuals and targeted intervention. By translating complex ML outputs into an intuitive clinical decision support tool, the dynamic nomogram enhances the model’s usability and interpretability in real-world healthcare settings.
Discussion
This study developed and validated an interpretable ML model based on multidimensional clinical variables and inflammation- and metabolism-related biomarkers to predict the risk of 1-year unplanned readmission in patients with IS and T2DM. The observed readmission rate in this cohort was 34.3%, slightly higher than the 30.5% documented in the US Nationwide Readmissions Database for IS patients, indicating a substantial readmission burden and a heightened need for targeted interventions in this population.16 Currently, the LACE index is a commonly used tool for predicting hospital readmission risk in clinical practice. However, it mainly relies on administrative data, such as length of stay and acuity of admission, without incorporating disease-specific biological characteristics. In the present study, data on pre-admission emergency department visits were incomplete; therefore, a direct comparison with the LACE index could not be performed. Our model integrates inflammatory biomarkers (eg, NLR and HCY) and metabolic biomarkers (eg, HbA1c and TyG index), providing an individualized approach to risk prediction. This design underscores the innovation and clinical specificity of our model for patients with IS and DM.
One of the key findings of this study is the pivotal role of inflammation- and metabolism-related biomarkers in predicting the risk of readmission. In both LASSO-based feature selection and SHAP interpretability analysis, variables such as NLR, HCY, HbA1c, and TyG index demonstrated substantial predictive contributions, suggesting that inflammatory activation and metabolic dysregulation may constitute central biological mechanisms underlying readmission risk.
NLR, a marker of systemic inflammatory response, reflects the balance between innate (neutrophil-mediated) and adaptive (lymphocyte-mediated) immunity.17 Elevated NLR has been consistently associated with greater stroke severity and poorer 90-day functional outcomes in patients with acute ischemic stroke (AIS),18,19 and may contribute to increased readmission risk by exacerbating vascular injury and thereby promoting recurrent ischemic events. Previous studies have demonstrated that elevated HCY levels are significantly associated with poor outcomes in patients with IS, which is consistent with the findings of the present study.20,21 HCY is closely linked to endothelial dysfunction and oxidative stress, and elevated levels may contribute to adverse outcomes through multiple mechanisms, including vascular endothelial injury, promotion of platelet aggregation, and activation of the coagulation cascade.22,23 These processes may collectively increase the risk of thrombosis and worsen stroke prognosis. HbA1c and TyG index, as representative indicators of glucose and lipid metabolic dysfunction, underscoring the critical role of metabolic factors in readmission risk. Jeong et al reported that elevated HbA1c levels are associated with an increased risk of both short- and long-term functional impairment following IS.24 HbA1c reflects poor glycemic control, which is closely associated with microvascular complications, delayed wound healing, and increased susceptibility to infections.25,26 The TyG index, as a surrogate marker of insulin resistance, integrates dyslipidemia and hyperglycemia, both of which can accelerate atherosclerosis.27,28 A 9-year prospective cohort study further revealed that a high cumulative TyG index is significantly associated with an increased incidence of IS.29 In addition, Wang et al found that elevated TyG index levels are closely related to stroke recurrence in patients with IS.30 Taken together, these findings are biologically plausible and consistent with previous literature, suggesting that chronic inflammation and metabolic dysregulation may act synergistically to impair vascular endothelial function and disturb coagulation balance, thereby increasing the likelihood of recurrent vascular events or other complications leading to readmission.
In addition to inflammatory and metabolic markers, clinical variables such as age, comorbid conditions, and medication use also played significant roles in predicting readmission risk. Age, as a non-modifiable risk factor, showed a strong positive association with readmission in this study, suggesting that elderly patients may benefit from more intensive post-discharge monitoring and follow-up. Hyperlipidemia, a common metabolic comorbidity, contributes to the progression of atherosclerosis and may also promote vascular instability through inflammation-mediated pathways, thereby increasing the risk of recurrent stroke or other cardiovascular complications.31 A retrospective study identified hyperlipidemia as an independent predictor of poor long-term outcomes in patients with AIS.32 Pulmonary infection, one of the most frequent complications of stroke, was also strongly associated with readmission in our analysis. Post-stroke dysphagia, impaired consciousness, and reduced mobility increase the likelihood of aspiration pneumonia.33 A retrospective study involving 8,251 stroke patients reported that those with pulmonary infections had significantly higher 1-year mortality, longer hospital stays, and greater discharge dependency.34 Renal insufficiency reflects diminished systemic organ reserve and is often associated with electrolyte disturbances, anemia, and altered drug metabolism, all of which can complicate post-stroke recovery.35–37 A 10-year prospective cohort study of 1,350 patients found that renal insufficiency was linked to increased mortality and higher incidence of cardiovascular events.38 As for pharmacologic factors, metformin not only improves glycemic control but also exerts anti-inflammatory effects, enhances insulin sensitivity, and protects vascular endothelium.10,39,40 A study has shown that patients with AIS and DM who received metformin therapy exhibited significantly lower rates of mortality, recurrence, and disability both during hospitalization and within 12 months post-discharge.41
Limitations
First, this study was a single center retrospective analysis with participants drawn from the same geographic region, which may introduce selection bias and limit the generalizability of the findings. Second, although a wide range of clinical variables and biomarkers were included, some potential confounding factors such as socioeconomic status, lifestyle behaviors, and psychological conditions were not available, which may affect the comprehensiveness of the model. In addition, certain clinically relevant variables, including the National Institutes of Health Stroke Scale (NIHSS), the modified Rankin Scale (mRS), and the Barthel Index, were unavailable due to incomplete records. These missing factors may affect the comprehensiveness of the model. Third, external validation was not performed in this study. Therefore, the stability and applicability of the model require further evaluation in multicenter cohorts across diverse populations. Fourth, the study period was relatively short (June 2022 to December 2023), which may not fully capture long-term trends or seasonal variations in readmission patterns, potentially introducing temporal bias. Future research should consider prospective, large-scale, multicenter studies that incorporate dynamic monitoring data and patient behavioral characteristics, with extended observation periods to enhance the clinical utility and individualized intervention potential of predictive models.
Conclusion
This study developed an interpretable ML model that integrates inflammatory and metabolic biomarkers to predict the risk of 1-year unplanned readmission in patients with IS and T2DM. The model demonstrated favorable predictive performance and clinical interpretability. By enabling early identification of high-risk patients, this model can assist clinicians in implementing targeted post-discharge management strategies and optimizing healthcare resource allocation. Future studies are warranted to validate the stability and generalizability of the model across multiple centers and diverse populations.
Data Sharing Statement
The datasets analyzed in the current study are available from the corresponding author upon reasonable request.
Ethics Approval and Consent to Participate
This study was conducted in accordance with the Declaration of Helsinki and was approved by the Ethics Committee of the First Affiliated Hospital, Zhejiang University School of Medicine, with approval number 20250938. The review committee waived the requirement for written informed consent because of the retrospective nature of the study. Prior to analysis, confidential patient information was deleted from the entire data set.
Author Contributions
All authors made a significant contribution to the work reported, whether that is in the conception, study design, execution, acquisition of data, analysis and interpretation, or in all these areas; took part in drafting, revising or critically reviewing the article; gave final approval of the version to be published; have agreed on the journal to which the article has been submitted; and agree to be accountable for all aspects of the work.
Funding
A project supported by Scientific Research Fund of Zhejiang University (XY2025076) and the National Natural Science Foundation of China (72274169).
Disclosure
The authors declare that they have no competing interests in this work.
References
1. Wang W, Jiang B, Sun H, et al. Prevalence, incidence, and mortality of stroke in China: results from a nationwide population-based survey of 480 687 adults. Circulation. 2017;135(8):759–771. doi:10.1161/CIRCULATIONAHA.116.025250
2. Arboix A, Rivas A, García-Eroles L, et al. Cerebral infarction in diabetes: clinical pattern, stroke subtypes, and predictors of in-hospital mortality. BMC Neurol. 2005;5(1):9. doi:10.1186/1471-2377-5-9
3. Chen S, Wan Y, Guo H, et al. Diabetic and stress-induced hyperglycemia in spontaneous intracerebral hemorrhage: a multicenter prospective cohort (CHEERY) study. CNS Neurosci Ther. 2023;29(4):979–987. doi:10.1111/cns.14033
4. Zhang L, Li X, Wolfe CDA, et al. Diabetes as an independent risk factor for stroke recurrence in ischemic stroke patients: an updated meta-analysis. Neuroepidemiology. 2021;55(6):427–435. doi:10.1159/000519327
5. Rutten-Jacobs LC, Keurlings PA, Arntz RM, et al. High incidence of diabetes after stroke in young adults and risk of recurrent vascular events: the future study. PLoS One. 2014;9(1):e87171. doi:10.1371/journal.pone.0087171
6. Echouffo-Tcheugui JB, Xu H, Matsouaka RA, et al. Diabetes and long-term outcomes of ischaemic stroke: findings from get with the guidelines-stroke. Eur Heart J. 2018;39(25):2376–2386. doi:10.1093/eurheartj/ehy036
7. Pacinella G, Ciaccio AM, Tuttolomondo A, et al. Molecular links and clinical effects of inflammation and metabolic background on ischemic stroke: an update review. J Clin Med. 2024;13(24).
8. Lv J, Jiao Y, Zhao X, et al. Examining the impact of microglia on ischemic stroke with an emphasis on the metabolism of immune cells. CNS Neurosci Ther. 2025;31(2):e70229. doi:10.1111/cns.70229
9. Madamanchi NR, Runge MS. Redox signaling in cardiovascular health and disease. Free Radic Biol Med. 2013;61:473–501. doi:10.1016/j.freeradbiomed.2013.04.001
10. DeFronzo RA. Insulin resistance, lipotoxicity, type 2 diabetes and atherosclerosis: the missing links. the Claude Bernard Lecture 2009. Diabetologia. 2010;53(7):1270–1287. doi:10.1007/s00125-010-1684-1
11. Lee M, Yeo NY, Ahn HJ, et al. Prediction of post-stroke cognitive impairment after acute ischemic stroke using machine learning. Alzheimer’s Res Ther. 2023;15(1):147. doi:10.1186/s13195-023-01289-4
12. Luo X, Li B, Zhu R, et al. Development and validation of an interpretable machine learning model for predicting in-hospital mortality for ischemic stroke patients in ICU. Int J Med Inform. 2025;198:105874. doi:10.1016/j.ijmedinf.2025.105874
13. Hu Y, Zhang Y, Han P, et al. Machine learning-driven prediction of readmission risk in heart failure patients with diabetes: synergistic assessment of inflammatory and metabolic biomarkers. Int J Cardiol. 2025;441:133743. doi:10.1016/j.ijcard.2025.133743
14. Powers WJ, Rabinstein AA, Ackerson T, et al. Guidelines for the early management of patients with acute ischemic stroke: a guideline for healthcare professionals from the American heart association/American stroke association. Stroke. 2018;49(3):e46–e110. doi:10.1161/STR.0000000000000158
15. ElSayed NA, Aleppo G, Bannuru RR. Improving care and promoting health in populations: standards of care in diabetes—2024. Diabetes Care. 2024;47(Suppl 1):S11–s19. doi:10.2337/dc24-S001
16. Zhou LW, Lansberg MG, de Havenon A. Rates and reasons for hospital readmission after acute ischemic stroke in a US population-based cohort. PLoS One. 2023;18(8):e0289640. doi:10.1371/journal.pone.0289640
17. Daood R, Sabbah F, Fawaz A, et al. The role of neutrophil to lymphocytes ratio (NLR) as a predictor of disease activity in Behcet’s syndrome—a comprehensive review. J Clin Med. 2025;14(16):5847. doi:10.3390/jcm14165847
18. Graça SC, Mosca T, Gagliardi VDB, et al. Prognostic impact of neutrophil-to-lymphocyte ratio in ischemic stroke. J Personalized Med. 2024;14(12):1149. doi:10.3390/jpm14121149
19. Chen L, Zhang L, Li Y, et al. Association of the neutrophil-to-lymphocyte ratio with 90-day functional outcomes in patients with acute ischemic stroke. Brain Sciences. 2024;14(3):250. doi:10.3390/brainsci14030250
20. Zhong C, Xu T, Xu T, et al. Plasma homocysteine and prognosis of acute ischemic stroke: a gender-specific analysis from CATIS randomized clinical trial. Molecular neurobiolog. 2017;54(3):2022–2030. doi:10.1007/s12035-016-9799-0
21. Nam KW, Kim CK, Yu S, et al. Plasma total homocysteine level is related to unfavorable outcomes in ischemic stroke with atrial fibrillation. J Ame Heart Assoc. 2022;11(9):e022138. doi:10.1161/JAHA.121.022138
22. Han L, Miao Y, Zhao Y, et al. The binding of autotaxin to integrins mediates hyperhomocysteinemia-potentiated platelet activation and thrombosis in mice and humans. Blood Adv. 2022;6(1):46–61. doi:10.1182/bloodadvances.2021004572
23. Coppola A, Davi G, De Stefano V, et al. Homocysteine, coagulation, platelet function, and thrombosis. Semin Thromb Hemost. 2000;26(3):243–254. doi:10.1055/s-2000-8469
24. Jeong J, Park JK, Koh YH, et al. Association of HbA1c with functional outcome by ischemic stroke subtypes and age. Front Neurol. 2023;14:1247693. doi:10.3389/fneur.2023.1247693
25. Stratton IM, Adler AI, Neil HA, et al. Association of glycaemia with macrovascular and microvascular complications of type 2 diabetes (UKPDS 35): prospective observational study. BMJ. 2000;321(7258):405–412. doi:10.1136/bmj.321.7258.405
26. Mor A, Dekkers OM, Nielsen JS, et al. Impact of glycemic control on risk of infections in patients with type 2 diabetes: a population-based cohort study. Ame j epidemiol. 2017;186(2):227–236. doi:10.1093/aje/kwx049
27. Simental-Mendía LE, Rodríguez-Morán M, Guerrero-Romero F. The product of fasting glucose and triglycerides as surrogate for identifying insulin resistance in apparently healthy subjects. Metabolic Syndrome Related Disord. 2008;6(4):299–304. doi:10.1089/met.2008.0034
28. Wang M, Mei L, Jin A, et al. Association between triglyceride glucose index and atherosclerotic plaques and Burden: findings from a community-based study. Cardiovascu diabetol. 2022;21(1):204. doi:10.1186/s12933-022-01638-x
29. Wang X, Feng B, Huang Z, et al. Relationship of cumulative exposure to the triglyceride-glucose index with ischemic stroke: a 9-year prospective study in the Kailuan cohort. Cardiovascu diabetol. 2022;21(1):66. doi:10.1186/s12933-022-01510-y
30. Wang F, Wang J, Han Y, et al. Triglyceride-glucose index and stroke recurrence in elderly patients with ischemic stroke. Front Endocrinol. 2022;13:1005614. doi:10.3389/fendo.2022.1005614
31. Park S, Lakatta EG. Role of inflammation in the pathogenesis of arterial stiffness. Yonsei medl J. 2012;53(2):258–261. doi:10.3349/ymj.2012.53.2.258
32. Haiyong Z, Wencai L, Yunxiang Z, et al. Construction of a nomogram prediction model for prognosis in patients with large artery occlusion-acute ischemic stroke. World Neurosurg. 2023;172:e39–e51. doi:10.1016/j.wneu.2022.11.117
33. Martino R, Foley N, Bhogal S, et al. Dysphagia after stroke: incidence, diagnosis, and pulmonary complications. Stroke. 2005;36(12):2756–2763. doi:10.1161/01.STR.0000190056.76543.eb
34. Finlayson O, Kapral M, Hall R, et al. Risk factors, inpatient care, and outcomes of pneumonia after ischemic stroke. Neurology. 2011;77(14):1338–1345. doi:10.1212/WNL.0b013e31823152b1
35. Dhondup T, Qian Q. Electrolyte and acid-base disorders in chronic kidney disease and end-stage kidney failure. Blood Purification. 2017;43(1–3):179–188. doi:10.1159/000452725
36. Dhondup T, Qian Q. Acid-base and electrolyte disorders in patients with and without chronic kidney disease: an update. Kidney Dis. 2017;3(4):136–148. doi:10.1159/000479968
37. Synhaeve NE, van Alebeek ME, Arntz RM, et al. Kidney dysfunction increases mortality and incident events after young stroke: the future study. Cerebrovascular Dis. 2016;42(3–4):224–231. doi:10.1159/000444683
38. Tsagalis G, Akrivos T, Alevizaki M, et al. Renal dysfunction in acute stroke: an independent predictor of long-term all combined vascular events and overall mortality. Nephrol Dial Transplant. 2009;24(1):194–200. doi:10.1093/ndt/gfn471
39. Kelly B, Tannahill GM, Murphy MP, et al. Metformin inhibits the production of reactive oxygen species from NADH: ubiquinone oxidoreductase to limit induction of interleukin-1β (IL-1β) and boosts interleukin-10 (IL-10) in lipopolysaccharide (LPS)-activated macrophages. J Biol Chem. 2015;290(33):20348–20359. doi:10.1074/jbc.M115.662114
40. Ding Y, Zhou Y, Ling P, et al. Metformin in cardiovascular diabetology: a focused review of its impact on endothelial function. Theranostics. 2021;11(19):9376–9396. doi:10.7150/thno.64706
41. Kim C, Kim Y, Sohn JH, et al. Effects of prior metformin use on stroke outcomes in diabetes patients with acute ischemic stroke receiving endovascular treatment. Biomedicines. 2024;12(4).
 © 2025 The Author(s). This work is published and licensed by Dove Medical Press Limited. The
full terms of this license are available at https://www.dovepress.com/terms
and incorporate the Creative Commons Attribution
- Non Commercial (unported, 4.0) License.
By accessing the work you hereby accept the Terms. Non-commercial uses of the work are permitted
without any further permission from Dove Medical Press Limited, provided the work is properly
attributed. For permission for commercial use of this work, please see paragraphs 4.2 and 5 of our Terms.
© 2025 The Author(s). This work is published and licensed by Dove Medical Press Limited. The
full terms of this license are available at https://www.dovepress.com/terms
and incorporate the Creative Commons Attribution
- Non Commercial (unported, 4.0) License.
By accessing the work you hereby accept the Terms. Non-commercial uses of the work are permitted
without any further permission from Dove Medical Press Limited, provided the work is properly
attributed. For permission for commercial use of this work, please see paragraphs 4.2 and 5 of our Terms.
Recommended articles
Development of Machine Learning Models for Predicting Osteoporosis in Patients with Type 2 Diabetes Mellitus—A Preliminary Study
Wu X, Zhai F, Chang A, Wei J, Guo Y, Zhang J
Diabetes, Metabolic Syndrome and Obesity 2023, 16:1987-2003
Published Date: 30 June 2023
Prediction of the Risk of Bone Mineral Density Decrease in Type 2 Diabetes Mellitus Patients Based on Traditional Multivariate Logistic Regression and Machine Learning: A Preliminary Study
Zhang J, Xu Z, Fu Y, Chen L
Diabetes, Metabolic Syndrome and Obesity 2023, 16:2885-2898
Published Date: 19 September 2023
Application of Interpretable Machine Learning Models Based on Ultrasonic Radiomics for Predicting the Risk of Fibrosis Progression in Diabetic Patients with Nonalcoholic Fatty Liver Disease
Meng F, Wu Q, Zhang W, Hou S
Diabetes, Metabolic Syndrome and Obesity 2023, 16:3901-3913
Published Date: 2 December 2023
A Machine-Learning Model Based on Clinical Features for the Prediction of Severe Dysphagia After Ischemic Stroke
Ye F, Cheng LL, Li WM, Guo Y, Fan XF
International Journal of General Medicine 2024, 17:5623-5631
Published Date: 28 November 2024
Predicting Stroke-Associated Pneumonia in Acute Ischemic Stroke: A Machine Learning Model Development and Validation Study with CBC-Derived Inflammatory Indices
Xie M, Liu Z, Dai F, Cao Z, Wang X
International Journal of General Medicine 2025, 18:3117-3128
Published Date: 12 June 2025