Back to Journals » ImmunoTargets and Therapy » Volume 15
Integrin alpha8beta1 is Identified as a Potential CAR-T Target for BCMA-Resistant Relapsed Multiple Myeloma
Authors Liu S, Wu J, Liu J ![]() , Wu K, Huang Y, Geng S, Wang Y, Weng J, Du X, Lai P
, Wu K, Huang Y, Geng S, Wang Y, Weng J, Du X, Lai P
Received 7 March 2026
Accepted for publication 17 May 2026
Published 28 May 2026 Volume 2026:15 605729
DOI https://doi.org/10.2147/ITT.S605729
Checked for plagiarism Yes
Review by Single anonymous peer review
Peer reviewer comments 3
Editor who approved publication: Dr Sarah Wheeler
Suiping Liu,1 Jieying Wu,1 Jiayu Liu,2 Kangxiu Wu,3 Yanyan Huang,1 Suxia Geng,1 Yulian Wang,1 Jianyu Weng,1 Xin Du,1 Peilong Lai1
1Department of Hematology, Guangdong Provincial People’s Hospital (Guangdong Academy of Medical Sciences), Southern Medical University, Guangzhou, 510080, People’s Republic of China; 2Breast Tumor Center, Sun Yat-Sen Memorial Hospital, Sun Yat-Sen University, Guangzhou, 510120, People’s Republic of China; 3Department of Clinical Laboratory, Sun Yat-Sen Memorial Hospital, Sun Yat-Sen University, Guangzhou, 510120, People’s Republic of China
Correspondence: Peilong Lai, Department of Hematology, Guangdong Provincial People’s Hospital (Guangdong Academy of Medical Sciences), Southern Medical University, No. 106, Zhongshan Er Road, Guangzhou, 510080, People’s Republic of China, Email [email protected] Xin Du, Department of Hematology, Guangdong Provincial People’s Hospital (Guangdong Academy of Medical Sciences), Southern Medical University, No. 106, Zhongshan Er Road, Guangzhou, 510080, People’s Republic of China, Email [email protected]
Background: B cell maturation antigen (BCMA)-targeted chimeric antigen receptor T cell (CAR-T) therapy has improved outcomes for relapsed/refractory multiple myeloma (R/R MM), but most patients eventually relapse, largely due to antigen escape, clonal heterogeneity, and immune-evasive tumor subclones. Novel targets are urgently needed to complement BCMA CAR-T and reduce relapse.
Methods: We analyzed several single-cell transcriptomic datasets from patients who relapsed after BCMA CAR-T to identify relapse-associated surface antigens. We characterized ITGA8 expression in normal tissues and hematopoietic cells, evaluated its biological function in myeloma cells, and generated α 8β 1-targeted CAR-T cells. Preclinical efficacy was assessed in vitro and in xenograft models in combination with BCMA CAR-T.
Results: ITGA8 was significantly enriched in MM cells at early relapse following BCMA CAR-T therapy, marking a quiescent, immune-evasive subpopulation. ITGA8 was absent from normal hematopoietic stem and immune cells but showed restricted expression in vascular smooth muscle cells. α 8β 1 CAR-T specifically lysed ITGA8-positive myeloma cells and complemented with BCMA CAR-T to control tumor in models mimicking antigen loss.
Conclusion: This preclinical proof-of-concept study identifies integrin α 8β 1 as a potential CAR-T target worthy of further development for BCMA-resistant relapsed MM. While short-term tumor control was improved, this does not equate to validated clinical relapse prevention. Safety related to off-tumor expression in non-hematopoietic tissues remains to be fully evaluated.
Keywords: ITGA8, CAR-T therapy, relapsed/refractory multiple myeloma, BCMA, integrin
Introduction
Multiple myeloma (MM) is one of the three most common hematological malignancies, predominantly affecting middle-aged and elderly populations with a steadily rising global incidence. Advances in standard-of-care therapies — including hematopoietic cell transplantation, proteasome inhibitors, immunomodulatory drugs, and anti-CD38 monoclonal antibodies — have substantially improved outcomes, extending median overall survival from approximately 20 months in the 1990s to over 54 months today.1,2 Nevertheless, the majority of patients ultimately relapse or develop refractory disease, and the management of relapsed/refractory MM (R/R MM) remains a major clinical challenge.3,4
Since its first regulatory approval in 2021, B cell maturation antigen (BCMA)-directed chimeric antigen receptor T cell (CAR-T) therapy has emerged as a cornerstone treatment for R/R MM, with ongoing efforts to extend its application to earlier lines of therapy.5,6 In the pivotal CARTITUDE-4 trial, ciltacabtagene autoleucel significantly prolonged progression-free survival compared to standard of care.7 Despite these advances, more than half of patients ultimately relapse following BCMA-directed CAR-T therapy.8 Post-CAR-T relapse is multifactorial, encompassing T-cell dysfunction, immunosuppressive bone marrow microenvironment signaling, metabolic constraints, and clonal evolution.9–12 Among these, downregulation or loss of BCMA expression represents a clinically important resistance mechanism,13–15 with broad antigen escape reported in up to 50–80% of relapsed patients and complete antigen loss in an estimated 4–33% of cases.13,16–18
Dual-targeting CAR-T strategies have been investigated to overcome heterogeneous antigen expression and mitigate antigen escape,12 including bispecific BCMA/CD19,19,20 BCMA/CD38,21 and BCMA/GPRC5D22 constructs. However, no dual-targeting product has yet demonstrated clear superiority over single-target BCMA CAR-T in clinical practice, owing to the lack of randomized comparative data, the predominance of antigen-independent resistance mechanisms,11,23,24 the susceptibility of second targets to independent antigen escape,16 and the intrinsic toxicity constraints associated with certain second targets. These limitations underscore the need for novel targets that are stably expressed, functionally essential for myeloma survival,25 or expressed in a tumor-restricted pattern.
To identify novel CAR-T targets capable of reducing post-BCMA CAR-T relapse, we integrated single-cell transcriptomic data from relapsed patient samples with a myeloma surfaceome dataset,26 identifying ITGA8 as a candidate surface target selectively enriched in relapsed MM cells. While transcriptomic-based target discovery carries inherent limitations—including the lack of direct protein-level validation, potential spatial heterogeneity of antigen expression, and inter-patient variability—it provides a powerful hypothesis-generating framework that can be systematically validated through subsequent experimental approaches.
ITGA8 encodes the α8 integrin subunit, which forms the α8β1 integrin complex mediating cell–extracellular matrix interactions — a well-established mechanism of drug resistance in MM.27 High ITGA8 expression has previously been associated with early relapse following autologous stem cell transplantation.28 In the present study, we characterized the ITGA8 expression profile in MM cell lines and clinical samples, evaluated its safety profile in normal tissues, and — for the first time — constructed α8β1-targeted CAR-T cells, systematically assessing their anti-myeloma activity and complementary efficacy in combination with BCMA CAR-T therapy through in vitro and in vivo experiments.
Materials and Methods
Cell Lines and Cell Culture
Human multiple myeloma cell lines (MM.1S, NCI-H929 and RPMI-8226) and human embryonic kidney epithelial cell (HEK-293T) were procured from the ATCC and have been tested for mycoplasma using commercial kits every 12 months. Tumor cell lines were lentivirally transduced to express the firefly luciferase (FLuc)-based fusion gene with neomycin resistance. MM.1S BCMA KO tumor cells with puromycin resistance were generated using CRISPR/Cas9- mediated gene knockout (KO) using a multiple-guide RNAs (sg1: TAACGCTGACATGTTAGAGG, sg2: CAATGGTCAGAGTCGACCT) specifically designed to target the BCMA gene. A 20-nucleotide non-targeting scrambled guide RNA (GTATTACTGATATTGGTGGG) was employed as the control (MM.1s BCMA NC). Overexpression stable line of ITGA8 in MM.1S (MM.1S OE) was constructed using pLV-Puro-EF1A (Vectorbuilder, Cat#VB900120-7789mrs) plasmid along with two helper plasmids (psPAX2 and pMD2.G plasmids) and with 6-day puromycin selection. Cells transduced with the empty vector were used as the control (MM.1S WT). Human primary aortic smooth muscle cells (HAoSMC) were kind gifts from Z. Liu’s lab at Sun Yat-sen University and cultured in Dulbecco’s modified Eagle medium (DMEM) supplemented with 10% FBS. Cell lines MM.1S and NCI-H929 were maintained with RPMI 1640 culture media supplemented with and 10% FBS. Cell lines RPMI-8226 were maintained with Iscove’s Modified Dulbecco’s Medium (IMDM) culture media supplemented with and 10% FBS.
Bioinformatic Analysis
Single-cell RNA sequencing (scRNA-seq) data (accession numbers: GSE143317, GSE234261 and GSE164551) were retrieved from the Gene Expression Omnibus (GEO, http://www.ncbi.nlm.nih.gov/geo/) database. The Seurat package (R version 4.4.0) was utilized for quality control, statistical analysis, and exploration of the scRNA-seq data. Quality control was applied to retain cells with 200–6000 detected genes, fewer than 25% mitochondrial reads, and fewer than 20% ribosomal protein gene reads; doublets were excluded using Scrublet (threshold = 0.25). Normalization and variance stabilization were performed using SCTransform (regularized negative binomial regression), which simultaneously regresses out sequencing depth. The top 2000 highly variable genes (HVGs) were identified by SCTransform and used for downstream analysis. Principal component analysis (PCA) was performed on the SCTransform-residuals, and the top 20 principal components (explaining 91.7% of variance) were retained for graph-based clustering and UMAP visualization. Shared nearest-neighbor (SNN) graphs were constructed using FindNeighbors (k = 20), and cell clusters were identified using FindClusters with the Louvain algorithm across resolutions 0.4–1.2; resolution 0.8 was selected based on cluster stability and biological interpretability. For the GSE143317 dataset, “MM top markers” distinguishing myeloma cells from all other cell types were identified using Seurat’s FindMarkers function (Wilcoxon rank-sum test). Genes with average log2 fold change > 2 and Bonferroni-adjusted p-value < 0.001 were retained as high-confidence myeloma-specific markers. Pseudotime trajectory analysis was performed in Python using the scVelo/PAGA framework (scanpy v1.x). Diffusion pseudotime (DPT) was computed with the ITGA8⁺ cluster set as the root. Trajectory-correlated genes were identified by Spearman correlation with pseudotime (|ρ| > 0.15, FDR < 0.05 by Benjamini–Hochberg correction). To identify pathways enriched in ITGA8⁺ versus ITGA8− myeloma cells from the D1_2 sample, differential expression analysis was performed between the two groups using the Wilcoxon rank-sum test implemented in Seurat’s FindMarkers function (min.pct = 0.1). Genes were ranked by the product of the sign of log2 fold change and −log10 (adjusted p-value) to generate a continuous ranking metric. Gene Set Enrichment Analysis (GSEA) was performed using the clusterProfiler package (v4.x) in R with the Hallmark and KEGG gene set collections from MSigDB. Normalized enrichment scores (NES) were calculated with 1000 permutations, and gene sets with Benjamini–Hochberg-adjusted p-value < 0.05 were considered significantly enriched. To identify high-priority cell surface targets for CAR-T therapy in MM, we integrated our single-cell transcriptomic data with the previously reported myeloma surfaceome dataset. This dataset includes five orthogonal filtering dimensions for prioritizing immunotherapeutic targets: 1, Surface proteomics detection in primary MM samples; 2, Computational prediction of cell surface localization (via COMPARTMENTS database); 3, High transcript expression in MM cell lines (CCLE database); 4, High expression in human plasma cells/plasmablasts (Human Blood Atlas, Monaco dataset); 5, Low expression in non-hematopoietic tissues (GTEx database). For our study, we selected the first four dimensions (1–4) to define a core myeloma surfaceome, including genes/proteins with non-zero scores in all four categories. This prioritization strategy ensured that candidates were (i) experimentally detected or predicted to be localized to the cell surface, (ii) highly expressed in MM cells, and (iii) enriched in plasma cell populations. The fifth dimension (low expression in non-hematopoietic tissues from GTEx) was not included in the initial selection, as this filtering step was reserved for later-stage candidate prioritization. We then intersected this curated myeloma surfaceome list with the “MM top markers” identified from our single-cell transcriptomic analysis, as described before. Bioinformatic analyses were assisted by Biomni (Phylo, https://biomni.phylo.com), an AI-powered scientific research assistant. All AI-generated outputs were reviewed and verified by the authors.
Using the Human Blood Atlas (HBA) and Human Protein Atlas, we evaluated the mRNA expression of ITGA8 across different cell types and malignant cell lines. Immunohistochemical images of ITGA8 expression in normal tissues were obtained from the HPA. The distribution of ITGA8 expression in normal tissues and across different cell types within blood vessels was queried using data from the GTEx dataset, as presented in the HPA. ITGA8 expression across multiple single-cell transcriptomic datasets was integrate by Tumor Immune Single-cell Hub 2 (TISCH2). The MMRF-COMMPASS datasets were curated from the UCSC Xena database (https://xenabrowser.net/heatmap/), while the gene expression profile of GSE39754 was downloaded from the GEO database. These two datasets were used to compare the mRNA expression of ITGA8 in the bone marrow or peripheral blood of healthy individuals with that of multiple myeloma patients.
Bulk-RNA Sequencing
Total RNA was extracted from MM.1S cells with ITGA8 overexpression (OE) and wild-type (WT) control cells (n = 3 per group). RNA integrity and concentration were verified, and mRNA was enriched using oligo-dT magnetic beads. Sequencing libraries were constructed via fragmentation, reverse transcription, adapter ligation, and PCR amplification. Paired-end sequencing (PE150) was performed on the DNBSEQ platform. Raw reads were filtered to remove low-quality and adapter-contaminated reads using SOAPnuke. Clean reads were aligned to the human reference genome (GRCh38) with HISAT2, and gene expression levels were quantified as TPM using RSEM.
Gene set enrichment analysis (GSEA) was performed using the clusterProfiler R package (v4.14.0) with MSigDB Hallmark gene sets (v7.5.1). Genes were ranked by signed −log10(p-value) derived from pairwise t-tests comparing MM.1S OE and WT cells (n = 3 per group). Permutation-based enrichment scores (10,000 permutations) were calculated, and pathways with |NES| > 1 and FDR < 0.05 were considered significant.
Immunofluorescence
Cells were plated on adhesion slides at a density of 1×10⁵ nucleated cells per slide. After cell attachment, the cells were fixed with 4% paraformaldehyde for 30 minutes. Subsequently, the cells were stained with a primary monoclonal antibody targeting ITGA8 (Invitrogen, Cat#MA5-24196) for 3 hours at room temperature, followed by a fluorescein (FITC)-conjugated goat anti-mouse IgG(H+L) secondary antibody (Proteintech, Cat#SA00003-1). The cell membrane was visualized using iFluor® 647-Wheat Germ Agglutinin (WGA) Conjugate (AAT Bioquest, Cat#25559), and nuclei were stained with 4’,6-diamidino-2-phenylindole dihydrochloride (DAPI, Thermo Fisher). All images were acquired under identical acquisition settings (laser power, gain, exposure time) using an Olympus FV3000 confocal microscope, and image processing and analysis were performed using OLYVIA software (Olympus).
Western Blotting
Cells were washed with cold PBS and lysed with RIPA buffer in the presence of protease and protease inhibitor cocktail (TargetMol, Cat#C0001) for 15 min at 4°C. The cell lysates were then quantified with Omni-Easy™Instant BCA Protein Assay Kit (EpiZyme, Cat#ZJ102). Equal amounts of cell-derived proteins (20 μg) were denatured with Loading Buffer (Denaturing, Reducing) (EpiZyme, Cat#LT101S) and separated by SDS-PAGE and transferred to PVDF membranes, which were then blocked with 5% milk and probed with antibodies against ITGA8 (Proteintech, Cat#30714-1-AP) and β-Actin (Cell signaling technology, Cat#4970T). The membranes were then probed with secondary antibodies conjugated with horseradish peroxidase (HRP) (Signalway Antibody, Cat#L3012-1) and HRP signals were triggered by electrochemiluminescence (EpiZyme, Cat#SQ203). The protein expression was quantified using ImageJ software, and the relative expression of ITGA8 was calculated by normalizing to β-Actin.
Cell Proliferation Assay
Cell proliferation was determined by the CCK-8 assay (Sigma-Aldrich, Cat#96992). Briefly, Subsequently, 4000 MM.1S cells per well were seeded into a 96-well plate containing 100 μL medium per well. At indicated time points (Day 0, 2, 4, 6, 8), 10μL of CCK-8 solution was added to each well, and the plate was incubated at 37 °C for 1 h. Absorbance at 450 nm was measured using a BioTek Synergy H1 microplate reader (BioTek).
qRT-PCR
Total RNA was isolated using TRIzol reagent (ES Science, Cat#RN001). Complementary DNA (cDNA) was synthesized using the PrimeScript RT Reagent Kit (TaKaRa, Cat#RR037A) and used as a template to detect mRNA expression on an Applied Biosystems 7500 Fast Real-Time PCR System (Applied Biosystems, Foster City, CA, USA) with SYBR Green Premix Pro Taq HS qPCR Kit III (High Rox Plus) (Accurate Biology, Cat#AG11738) as the detection dye, according to the manufacturer’s instructions. The primer sequences were as follows: ITGA8 forward: 5’- TCAGGCGTTCAACCTGGAC-3’, ITGA8 reverse: 5’-GCGTCGGGTATGTGGAAGTC-3’, GAPDH forward: 5’-GGAGCGAGATCCCTCCAAAAT-3’ and GAPDH reverse: 5’-GGCTGTTGTCATACTTCTCATGG-3’. Results were normalized to the expression of GAPDH mRNA.
CD3+ T Cells Isolation and Activation
Fresh blood was collected in ethylenediamine tetra-acetic acid tubes from healthy donors. RosetteSep™ Human Total Lymphocyte Enrichment Cocktail (StemCell Technologies, Cat#15263) was added into blood. Purified human CD3+ cells were isolated by centrifugation in lymphocyte separation medium (Tianjin HAO YANG Biological Manufacture Co., Ltd., Tianjin, China) according to the manufacturer’s instructions.
CD3+ T cell were maintained in ImmunoCult™-XF T Medium (StemCell Technologies, Cat#10981) added with 100 U/mL recombinant human IL-2 (PeproTech). After isolation, T cells were activated by adding ImmunoCult Hu CD3/CD28 TCell Act (StemCell Technologies L, Cat#10971). Twenty-four hours later, T cells were transduced with lentivirus. T cells were fed with fresh T cell medium every 72 h and were maintained at a density of 0.5×10⁶ cells per mL after feeding. T cell counts were measured every 2 days using a cell counter (BodBoge) to assess the expansion rate of T cells.
Phage Display Screening and ELISA Validation
Anti-α8β1 scFv sequence was screened from a phage display scFv library by Sino Biological (China). Briefly, anti-ITGA8 single-chain variable fragments (scFvs) were isolated from a phage display library derived from mice immunized with recombinant human ITGA8 extracellular domain (GDR10-2). After several rounds of panning, five positive clones (M001, M006, M007, M020, M065) were selected for further characterization.
For phage ELISA, 96-well plates were coated overnight at 4°C with the immunogen (GDR10-2) or recombinant human integrin α8β1 (Sino Biological, CT016-H2508H) at 0.1 μg/mL and 1 μg/mL. After blocking with 5% skim milk, equal volumes of phage supernatant were added, followed by detection with HRP-conjugated anti-M13 antibody (1:5000) and TMB substrate. Absorbance at 450 nm (OD450) was measured, and blank-subtracted values were used to assess binding (Supplemental Table 1). Clone M001 was selected for its high, stable binding to both antigens across all conditions.
For flow cytometry confirmation, the binding specificity of selected antibodies to native ITGA8 expressed on myeloma cell lines (MM.1S, NCI-H929, and RPMI-8226) was evaluated by flow cytometry. Consistent with the ELISA data, clone M001 demonstrated the highest mean fluorescence intensity (MFI) on MM.1S and NCI-H929, with minimal binding to RPMI-8226. This confirms strong and specific binding to cell-surface ITGA8.
CAR Plasmid Design, Lentivirus Transduction
In this study, we used a second-generation CAR architecture, consisting of the CD8α signal peptide, anti-α8β1 or anti-BCMA scFv sequence, CD28α hinge and transmembrane domain, CD28 co-stimulatory domain, and CD3ζ activation domain. Anti-BCMA scFv sequence was previously reported.29 The plasmid vector backbone was EF1α-second-generation CAR-P2A-EGFP; the Mock group used a vector lacking the scFv fragment.
Lentiviruses encoding the above plasmids were generated with packaging plasmids (psPAX2 and pMD2.G) in HEK-293T cells. On the second day of T cell activation, the concentrated lentiviruses were transduced into activated T cells at a multiplicity of infection (MOI) of 5 in the presence of polybrene. At 72 h post-transduction, the transduction efficiency was assessed by detecting EGFP positivity via flow cytometry.
Flow Cytometry Analysis
All flow cytometry analyses were performed using a Cytek Aurora flow cytometer (Cytek Biosciences) and data were processed with FlowJo v10 software (BD Biosciences). Fluorescence minus one (FMO) controls were included for each fluorochrome to define background fluorescence and set accurate positivity gates. Single-stained compensation controls were prepared using antibody-capturing beads (CompBeads, BD Biosciences) to correct for spectral overlap. Dead cells were excluded using either propidium iodide (PI, 1 μg/mL) or 4′,6-diamidino-2-phenylindole (DAPI, 1 μg/mL) as indicated, and doublets were excluded based on forward scatter area versus height (FSC-A vs FSC-H). For cell line staining, myeloma cell lines were washed twice with PBS, pelleted, and resuspended in 100 μL of ice-cold staining buffer (PBS supplemented with 1% FBS). Cells were incubated for 30 min at 4 °C with the following antibodies: anti-Integrin α8 APC (Thermo Fisher, Cat#MA523593) and anti-BCMA BV421 (BioLegend, Cat#357519). FMO controls for APC were included to define the ITGA8-positive gate. For peripheral blood cell staining, red blood cells were lysed using red blood cell lysis buffer at 4 °C, followed by two washes with PBS. Cells were resuspended in 100 μL of ice-cold staining buffer and incubated for 30 min at 4 °C with anti-CD3 PE/Cy5 (BioLegend, Cat#317356), anti-CD19 PE (BioLegend, Cat#302207), and anti-Integrin α8 APC (Thermo Fisher, Cat#MA523593). FMO controls for APC were used to set the threshold for ITGA8 positivity on CD3⁺ T cells, CD19⁺ B cells, and CD3−CD19− non-T/B cells. For CAR-T cell phenotyping, CAR-T cells were harvested on day 7 of culture, washed, and stained in 100 μL of ice-cold staining buffer with anti-CD3 PE/Cy5 (BioLegend, Cat#317356), anti-CD8 APC (BioLegend, Cat#344721), anti-CD45RA BV421 (BioLegend, Cat#304129), and anti-CD62L PE (BioLegend, Cat#385103). Stem cell memory T (Tscm) cells were defined as CD45RA⁺CD62L⁺ within the CD3⁺CD8⁺ and CD3⁺CD4⁺ populations. For hematopoietic stem and progenitor cell (HSPC) staining, bone marrow and mobilized peripheral blood samples from healthy donors were processed by red blood cell lysis. Cells were resuspended in 100 μL of ice-cold staining buffer and incubated for 30 min at 4 °C with anti-CD34 PerCP/Cy5.5 (BioLegend, Cat#343611), anti-CD45RA BB515 (BD Bioscience, Cat#564552), anti-CD90 FITC (BioLegend, Cat#389803), and anti-Integrin α8 APC (Thermo Fisher, Cat#MA523593). PI was added before acquisition for live/dead discrimination. FMO controls for APC were used to determine ITGA8 expression on multipotent progenitor cells (MPPs) and hematopoietic stem cells (HSCs). For patient myeloma cell staining, bone marrow aspirates from multiple myeloma patients were processed by red blood cell lysis. Cells were stained in 100 μL of ice-cold staining buffer with anti-CD138 PE (BioLegend, Cat#356504), anti-CD38 PE/Cy7 (BioLegend, Cat#356607), anti-Integrin α8 APC (Thermo Fisher, Cat#MA523593), and anti-BCMA APC (BioLegend, Cat#357506). In patients who had received prior anti-CD38 therapy, plasma cells were identified as CD138⁺ events; otherwise, CD138⁺CD38⁺ events were considered myeloma cells. DAPI was used for live/dead exclusion. FMO controls for APC were included to define the ITGA8-positive population, with the cutoff set at the 99th percentile of the FMO control fluorescence intensity.
CD34⁺ Cell Isolation and Culture
Bone marrow mononuclear cells were isolated from mobilized healthy donors by density gradient centrifugation using lymphocyte separation medium (Tianjin HAO YANG Biological Manufacture Co., Ltd., Tianjin, China) according to the manufacturer’s instructions. CD34⁺ hematopoietic stem and progenitor cells (HSPCs) were subsequently enriched by positive magnetic bead selection using the human CD34 MicroBead Kit (Miltenyi Biotec, Cat#130-046-702) according to the manufacturer’s protocol. Isolated CD34⁺ HSPCs were cultured in StemSpan™ SFEM medium (STEMCELL Technologies, Cat#09600) supplemented with StemSpan™ CD34⁺ Expansion Supplement (STEMCELL Technologies, Cat#02691) for 5 days at 37°C in a humidified atmosphere containing 5% CO2. Expanded HSPCs were subsequently harvested for Western blot analysis of ITGA8 protein expression.
Cytotoxicity Assay
The proportion of GFP+ T cells in all groups was adjusted using non-transduced T cells to ensure consistency. For CAR pool group, α8β1 CAR T cells and BCMA CAR T cells were adjusted using non-transduced T cells to ensure the same proportion of GFP+ T cells, and then mixed at 1: 1. Luciferase-expressing tumor cells were co-cultured with T cells at a specified effector to target (E: T) ratio for 24 h. After co-culture, D-luciferin was added to each well, and bioluminescence (relative light units, RLU) was measured using a BioTek Synergy H1 microplate reader (BioTek). Specific cytotoxicity was calculated as the percentage reduction in bioluminescence in test wells (tumor cells plus T cells) relative to control wells (tumor cells only), after subtracting background signal from blank wells (medium only). All measurements were background-corrected by subtracting the signal from blank wells containing only medium. All experiments were performed with three independent biological replicates (using T cells from different donors), with three technical replicates per condition. Data are presented as mean ± standard error of the mean (SEM) of biological replicates.
ELISA
Luciferase-labeled tumor cells were co-cultured with T cells at an E: T ratio of 5: 1 for 24 hours. A 50 μL aliquot of the supernatant was carefully collected for cytokine concentration analysis. The concentrations of IL-2, TNF-α, and IFN-γ were determined using the Human IL-2 Uncoated ELISA Kit, Human TNF alpha Uncoated ELISA Kit, and Human IFN gamma Uncoated ELISA Kit (Invitrogen), respectively.
Animal Study
Six-week-old female NOD/Shi-scid IL2rgamma (null) (NOG) mice were used in this study. The sample size was determined using G*Power 3.1.9.7 software. Based on pilot data, we expected a large effect size (Cohen’s d = 2.5) in bioluminescence signal between control and treatment groups. With α = 0.05 and power (1−β) = 0.8, a minimum of 5 mice per group was calculated. This number was increased to account for potential non-treatment-related mortality. On day 0, mice received an intravenous injection of 1 × 10⁶ MM.1S-FLuc cells, which were composed of 15% BCMA knockout (KO) cell lines and 85% negative control (NC) cell line. This ratio was chosen based on pilot experiments and previous study.30 On day 10, successful tumor engraftment was confirmed by whole-body bioluminescence imaging (BLI). Mice were stratified based on baseline BLI signal intensity and randomly assigned to treatment groups using a random number generator to ensure balanced distribution of tumor burden across groups. Mice received intravenous administration of 3 × 10⁶ of either Mock T cells, BCMA CAR-T cells, or CAR pool T cells.
BLI was performed weekly using a Tanon IVIS Spectrum In Vivo Imaging System with identical acquisition parameters (exposure time, binning, and field of view) across all time points and groups. All in vivo imaging and data analysis were performed by a researcher blinded to the treatment group assignment to minimize bias. At the experimental endpoint, mice were euthanized using carbon dioxide (CO2) inhalation in accordance with institutional animal care and use committee guidelines.
Statistical Analysis
All statistical analyses were conducted using GraphPad Prism 9.0.0 and R studio v4.4.0 (R Project). All in vitro assays were carried out in triplicate and independently repeated at least three times to ensure reproducibility. Data from all independent experiments were pooled for statistical analysis. Prior to statistical testing, the normality of data distribution was verified using the Shapiro–Wilk test, and homogeneity of variances was assessed using Levene’s test. A two-tailed Student’s t-test was applied for comparisons between two independent sample groups, while a two-way analysis of variance (ANOVA) followed by Tukey’s multiple comparisons test was employed to assess differences among three or more groups. All bar charts are presented as mean values, with error bars representing standard error of the mean (SEM) as indicated in the figure legends. A p value < 0.05 was regarded as statistically significant.
Results
ITGA8 Specifically Enriched in Relapsed MM After BCMA CAR T Treatment
To characterize the transcriptional phenotype of MM cells relapsed after BCMA CAR-T therapy, we analyzed the publicly available single-cell RNA sequencing dataset GSE143317, derived from a patient who experienced disease relapse with BCMA loss following BCMA-directed CAR-T treatment.14 This dataset encompasses single-cell transcriptomic profiles from both pre-treatment (baseline) and post-treatment (relapse) bone marrow samples (Figure 1A). Following cell type annotation using canonical lineage markers, a prominent MM cell population was identified in the relapsed sample (Figure 1B). Differential expression analysis of MM cells from the relapsed sample was performed to define a gene signature enriched at post-CAR-T relapse. To prioritize novel surface targets suitable for combination with BCMA CAR-T, we intersected this relapse-enriched gene set with a curated myeloma surfaceome dataset of MM surface proteins.26 This analysis identified 6 genes encoding candidate cell surface targets that were significantly upregulated in residual MM cells at relapse (Figure 1C and Supplemental Figure 1A-B).
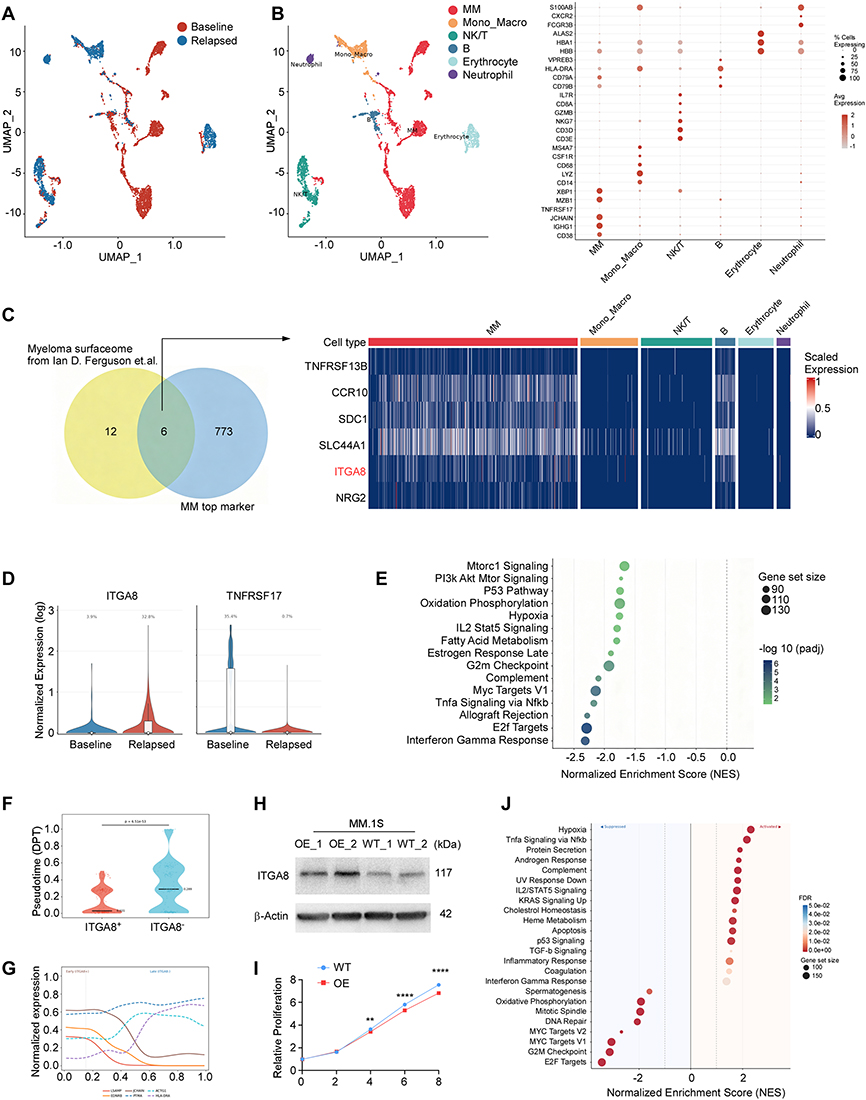 |
Figure 1 ITGA8 specifically enriched in relapsed MM after BCMA CAR T treatment. (A) UMAP from bone marrow biopsies of GSE143317 before treatment (Baseline) and after relapse (Relapse). (B) Annotated UMAP showing major cell populations in the bone marrow microenvironment, including myeloma (MM) cells, monocytes/macrophages (Mono_Macro), NK/T cells, B cells, erythrocytes, and neutrophils. The dot plot on the right displays the expression level (color intensity) and percentage of cells (dot size) for selected canonical markers across each cell type. (C) Venn diagram illustrating the intersection between the previously reported myeloma surfaceome and top markers enriched in relapsed MM cells. The corresponding heatmap shows scaled expression levels of these candidates across all major bone marrow cell types. (D) Violin plots showing the normalized expression and percentage of ITGA8⁺ and TNFRSF17⁺ myeloma cells at baseline versus post-BCMA CAR-T relapse in the GSE143317 cohort. (E) Gene set enrichment analysis (GSEA) comparing ITGA8⁺ versus ITGA8− myeloma cells from relapsed patients in GSE143317. The plot displays significantly enriched gene sets (FDR < 0.05) ranked by normalized enrichment score (NES). (F) Pseudotime distribution of myeloma cells stratified by ITGA8 expression. ITGA8⁺ cells showed significantly earlier pseudotime (median 0.031 vs 0.289; Mann–Whitney U-test, p = 6.51 × 10−53). (G) Pseudotime-dependent gene expression trends. Early-expressed genes (solid lines: LSAMP, EDNRB, JCHAIN) declined over pseudotime, while late-expressed genes (dashed lines: PTMA, ACTG1, HLA-DRA) increase. (H) Western blot confirming ITGA8 overexpression (OE) in MM.1S cells compared to wild-type (WT) controls. β-Actin served as the loading control. (I) Cell proliferation of MM.1S WT and OE cells measured by CCK-8 assay at days 0, 2, 4, 6, and 8. (J) GSEA comparing gene expression profiles of ITGA8-overexpressing versus wild-type MM.1S cells. Data of I are presented as mean ± SEM from three independent experiments. **p < 0.01, ****p < 0.0001 by two-tailed Student’s t-test. |
Among these candidates, each was systematically evaluated for its therapeutic potential. TACI (TNFRSF13B) has been explored as an alternative BCMA-pathway target,31 but shares the limitation of heterogeneous expression across MM patients. CCR10 was excluded due to its reported expression on T cells, which would risk CAR-T fratricide upon CCR10-directed targeting.26 Syndecan-1 (SDC1/CD138) is a well-established pan-plasma cell marker, and its broad expression on normal epithelial and endothelial cells raises significant on-target, off-tumor safety concerns that have impeded clinical translation. SLC44A1 and NRG2, while encoding surface-accessible proteins, are highly expressed in glial cells, raising concerns about central nervous system toxicity. In contrast, ITGA8 demonstrated plasma cell-restricted enrichment, with expression in normal tissues largely confined to blood vessel (Supplemental Figure 1C). On the basis of its preferential expression in relapsed MM cells and its favorable expression profile, ITGA8 was selected as the priority candidate for further investigation. Consistent with the BCMA-loss phenotype of this relapsed sample, ITGA8 expression was markedly upregulated in post-treatment MM cells compared to baseline (Figure 1D), suggesting a potential co-occurrence of BCMA downregulation and ITGA8 enrichment at early relapse.
Given that BCMA antigen loss is a rare event following BCMA CAR-T therapy and BCMA escape and an immunosuppressive tumor microenvironment are far more common drivers of relapse in multiple myeloma.13 We therefore investigated ITGA8 expression in a publicly available single-cell transcriptomic dataset (GSE234261) derived from patients who relapsed after BCMA CAR-T therapy without confirmed loss of BCMA expression.11 This dataset included two patients (Patient 1 and Patient 10) with post-relapse bone marrow samples. UMAP visualization and cell-type annotation confirmed a prominent population of plasma and myeloma cells in both samples (Supplemental Figure 2A–C). In relapsed myeloma cells, both ITGA8 and TNFRSF17 (BCMA) were highly expressed (Supplemental Figure 2D–E). Approximately half of the malignant plasma cells were ITGA8-positive (Supplemental Figure 2F). These data suggest that ITGA8 is significantly enriched in myeloma cells at relapse, even when relapse is not driven by BCMA antigen loss.
ITGA8 Expression Marks a Low-Proliferative, Immune-Evasive Myeloma Subpopulation Enriched at Early Relapse
To explore the functional characteristics of ITGA8⁺ MM cells at relapse, we performed gene set enrichment analysis (GSEA) comparing ITGA8⁺ and ITGA8− MM cells from the post-treatment relapsed sample. ITGA8⁺ cells exhibited significantly reduced enrichment of the interferon-gamma (IFN-γ) response pathway, suggesting diminished sensitivity to immune-mediated cytotoxic signaling. Consistent with a quiescent cellular state, proliferative and cell cycle gene sets — including E2F Targets, MYC Targets V1, and G2M Checkpoint — were markedly downregulated in ITGA8⁺ cells. Furthermore, key metabolic and survival signaling pathways, including TNFα/NF-κB, oxidative phosphorylation, mTORC1, and PI3K/AKT/mTOR, were also suppressed, indicating that ITGA8⁺ MM cells adopt a metabolically quiescent phenotype. Taken together, these findings indicate that ITGA8⁺ MM cells represent a low-proliferative, immune-evasive subpopulation with reduced responsiveness to IFN-γ signaling, in contrast to ITGA8− cells, which display higher proliferative activity and greater immune pathway engagement (Figure 1E).
To further characterize the developmental relationship between ITGA8⁺ and ITGA8− MM cells, we performed diffusion pseudotime (DPT) analysis. ITGA8⁺ MM cells were preferentially located at early pseudotime positions, whereas ITGA8− cells were enriched at later pseudotime stages, and this difference was statistically significant (Figure 1F–G). This pseudotime ordering suggests that ITGA8⁺ cells represent a less differentiated, earlier-stage myeloma state, while ITGA8− cells correspond to a more proliferative, transcriptionally advanced subpopulation.
To functionally validate these observations, we overexpressed ITGA8 in the MM.1S myeloma cell line (Figure 1H and Supplemental Figure 2G). ITGA8-overexpressing MM.1S cells exhibited significantly reduced proliferation compared to wild-type controls (Figure 1I), consistent with the low-proliferative phenotype of ITGA8⁺ cells identified in patient-derived relapsed samples. Transcriptomic profiling of ITGA8-overexpressing versus wild-type MM.1S cells further confirmed suppression of proliferation- and cell cycle-associated gene sets, including E2F Targets, G2M Checkpoint, MYC Targets, and DNA repair pathways (Figure 1J). These results functionally validate that ITGA8 expression drives a quiescent-like transcriptional state in myeloma cells, recapitulating the early pseudotime population observed in relapsed patient samples.
To determine whether ITGA8 enrichment at early relapse is a reproducible phenomenon, we analyzed an independent single-cell dataset (GSE164551) from a patient who relapsed following BCMA-directed CAR-T therapy.13 This dataset comprises bone marrow aspirate samples collected across eight longitudinal time points spanning pre-treatment, two post-infusion intervals, and disease relapse (S1–S8) (Figure 2A). Plasma cell populations were effectively eliminated during the early treatment phase (S1–S5); however, a sharp rebound and clonal expansion of plasma cells was observed at the S5 (Figure 2B-C). Consistent with findings from GSE143317, ITGA8 expression was markedly enriched in MM cells at early relapse, followed by a progressive decline at later time points (Figure 2D-E).
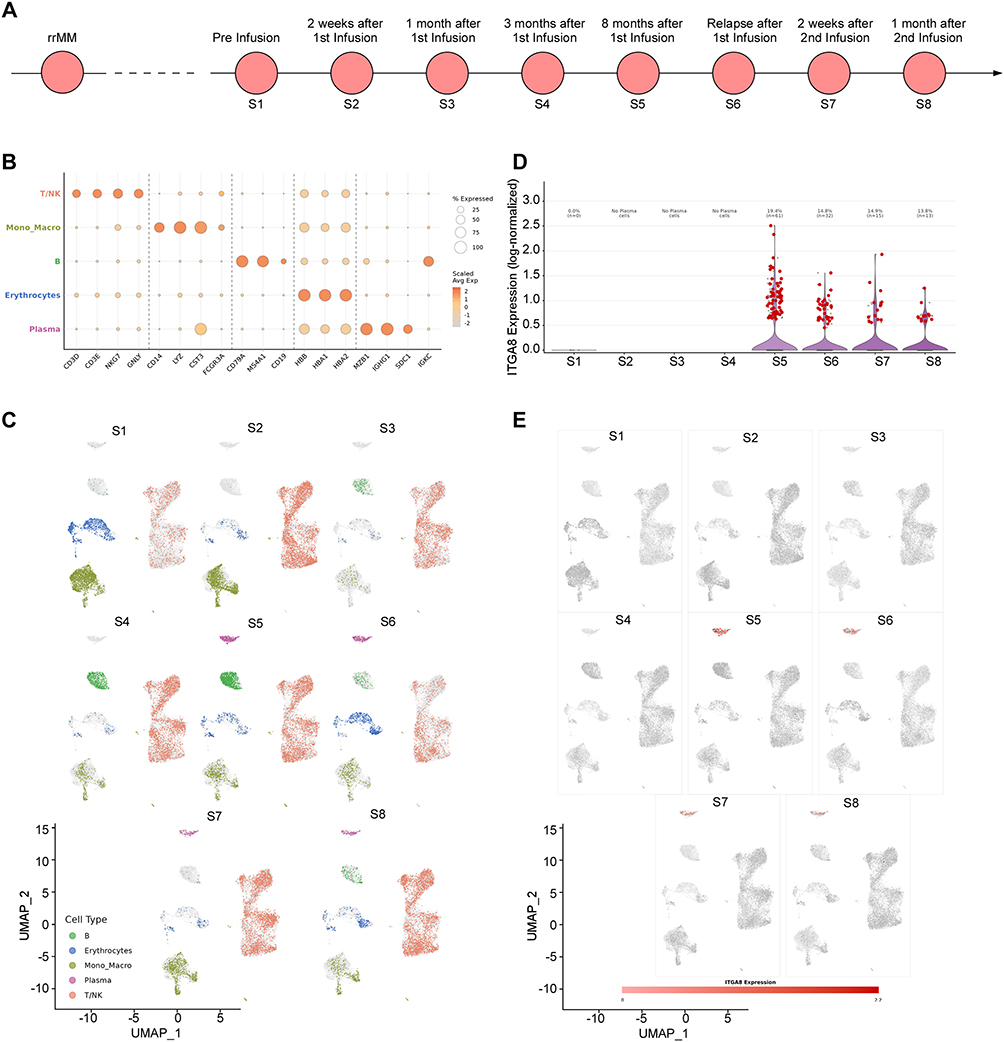 |
Figure 2 ITGA8 expression dynamics in MM during BCMA CAR-T treatment. (A) Schematic of sample collection time points, including pre-infusion (S1), and post-CAR-T infusion at 2 weeks (S2), 1 month (S3), 3 months (S4), 8 months (S5), at relapse (S6), and after a second CAR-T infusion (S7, S8). (B) Dot plot showing the relative abundance and average expression of canonical cell-type markers across major bone marrow populations (T/NK cells, monocytes/macrophages, B cells, erythrocytes, and plasma cells) over the treatment course. (C) UMAP projections of bone marrow cells at each time point (S1–S8), colored by cell type, illustrating dynamic changes in the immune and myeloma cell compartments during and after CAR-T therapy. (D) Violin plot showing the distribution of ITGA8 expression in plasma cells across the treatment course. (E) UMAP projections of plasma cells at each time point (S1–S8), colored by ITGA8 expression, demonstrating the enrichment of ITGA8-expressing myeloma cells at post-CAR-T relapse. |
Collectively, these findings demonstrate that ITGA8 expression defines a distinct subpopulation of MM cells that is preferentially enriched at early relapse following BCMA-directed CAR-T therapy — a pattern corroborated by prior reports of ITGA8 upregulation in early relapse after autologous hematopoietic stem cell transplantation.28 ITGA8⁺ MM cells are characterized by reduced IFN-γ responsiveness, low proliferative activity, and metabolic quiescence. We propose that this transcriptionally immune-evasive, quiescent phenotype may confer reduced susceptibility to CAR-T-mediated cytotoxicity — potentially through diminished sensitivity to cytokine-mediated killing signals and a slow-cycling state.32 The early enrichment of ITGA8 expression, which declines as relapse progresses, further suggests that the therapeutic window for ITGA8-directed targeting is concentrated in the early post-treatment period. Collectively, these findings provide a rationale for co-targeting ITGA8 alongside BCMA in CAR-T therapy, with the goal of eliminating this immune-evasive subpopulation at the time of initial treatment and thereby reducing the risk of early relapse.
Evaluation of ITGA8 Expression in Multiple Myeloma
To systematically explore the expression profile of ITGA8 across different cell types, we analyzed public data from the Human Blood Atlas and Human Protein Atlas. The results showed that ITGA8 mRNA was predominantly enriched in plasma cells among all human peripheral blood cell types, with no significant expression in hematopoietic stem cells, granulocytes, monocytes, T cells, and B cells (Supplemental Figure 3A–B). In the CCLE cell line expression atlas, ITGA8 expression levels in multiple myeloma cell lines were significantly higher than those in other tumor cell lines (Supplemental Figure 3C).
Analysis of the public dataset GSE39754 and MMRF-COMMPASS revealed that ITGA8 expression in the bone marrow and peripheral blood of multiple myeloma patients was significantly higher than in healthy donors (Figure 3A). Cell line validation demonstrated that ITGA8 protein was expressed on the cell membrane surface of MM.1S and NCI-H929 myeloma cells, but was absent in RPMI-8226 cells (Figure 3B–D). ITGA8 was enriched in plasma cells and malignant tumor cells within the myeloma bone marrow microenvironment indicated by multiple single-cell transcriptomic datasets; although its overall expression level was low, it exhibited high cell-type specificity (Figure 3E). ITGA8 was undetectable in T cells, B cells, and non-T/B cells in the peripheral blood of healthy individuals, which is consistent with the aforementioned results (Figure 3F).
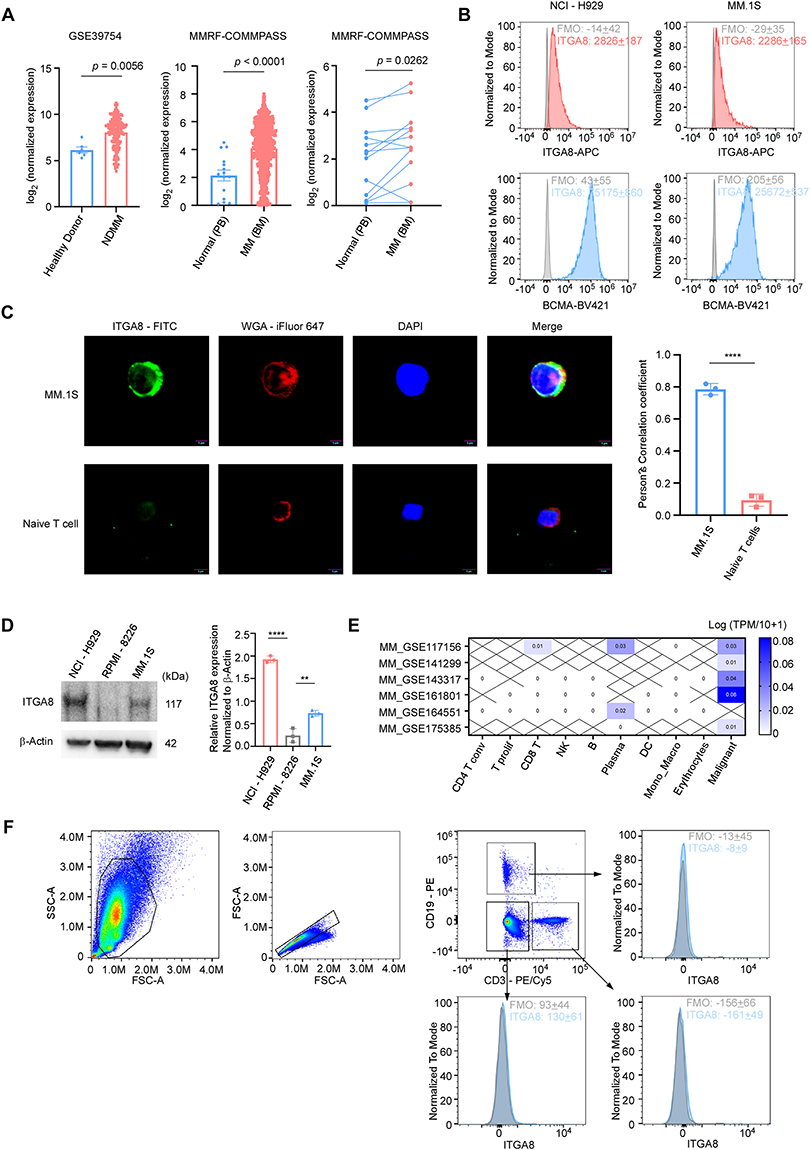 |
Figure 3 ITGA8 is a specific expressed surface protein in multiple myeloma. (A) ITGA8 expression in public multiple myeloma datasets. Left: Box plots comparing ITGA8 expression in healthy donors versus newly diagnosed multiple myeloma (NDMM) patients in GSE39754. Middle: ITGA8 expression in normal peripheral blood (PB) versus multiple myeloma bone marrow (BM) in the MMRF-COMMPASS cohort. Right: Paired analysis of ITGA8 expression in matched normal PB and MM BM samples from the same patients in the MMRF-COMMPASS cohort. (B) Flow cytometry histograms showing surface expression of ITGA8 and BCMA in NCI-H929 and MM.1S myeloma cell lines, with unstained controls for reference. (C) Representative immunofluorescence images showing the localization of ITGA8 in MM.1S multiple myeloma cells and naive T cells. WGA-iFlour 647 was used to label the cell membrane, and DAPI was used to counterstain the nucleus. Scale bar: 5 μm. Mean Pearson’s correlation coefficients is shown on the right (n = 3 independent experiments; in total of 30 cells per strain). (D) Western blot analysis of ITGA8 expression in NCI-H929, RPMI-8226, and MM.1S multiple myeloma cell lines. β-Actin was used as a loading control. (E) Heatmap showing ITGA8 expression across indicated immune and malignant cell populations in multiple myeloma datasets from TISCH. (F) Representative flow cytometry gating strategy for identifying ITGA8⁺ cells in healthy donor peripheral blood after red blood cell lysis, including T cells, B cells, and non-T/B cell populations (including granulocytes). Fluorescence minus one (FMO) controls were used to define the ITGA8⁺ gate. Data are presented as mean ± SEM from three independent experiments. p values were calculated using two-tailed Student’s t-test. **p < 0.01, ****p < 0.0001. |
To further validate ITGA8 expression in clinical samples, we collected bone marrow specimens from multiple myeloma patients at the Guangdong Provincial People’s Hospital. Flow cytometry results showed heterogeneous expression of both BCMA and ITGA8 in these specimens, with ITGA8 expression levels exceeding BCMA in some patients (Figure 4A-B). Gene expression analysis confirmed these findings, showing that ITGA8 expression was significantly higher in most myeloma patients compared to healthy donors, with a subset of patients displaying high ITGA8 expression (Figure 4C).
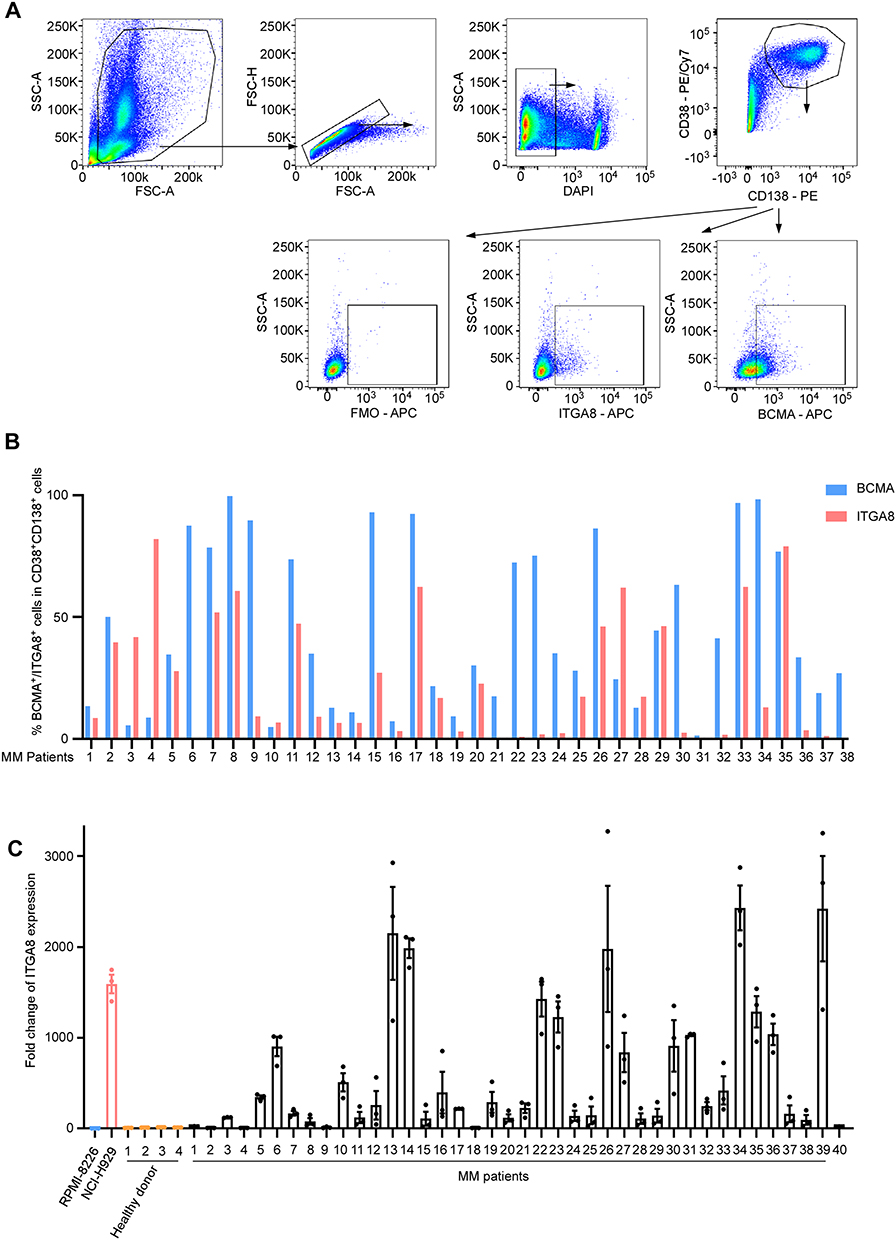 |
Figure 4 ITGA8 is expressed on primary multiple myeloma cells. (A) Representative flow cytometry plots for identifying BCMA+ and ITGA8+ populations within primary CD38+CD138+ multiple myeloma cells from patient samples. FMO controls were used to define the ITGA8⁺ gate or BCMA+ gate. (B) Bar graph showing the percentages of BCMA+ or ITGA8+ cells within the multiple myeloma population across 38 individual MM patients. (C) Expressions of ITGA8 in NCI-H929 cell lines, 4 healthy donors, and 40 primary MM patient samples were analyzed by qRT-PCR, relative to RPMI-8226. Data are presented as mean ± SEM. |
We stratified 40 multiple myeloma patients into ITGA8-high (n = 22) and ITGA8-low (n = 18) groups based on ITGA8 mRNA expression in bone marrow samples, and compared their baseline clinical characteristics (Supplemental Table 2). There were no significant differences between the two groups in terms of sex, age, immunoglobulin heavy/light chain type, β2-microglobulin level, or 1q21 amplification status (all p > 0.05). Notably, patients with high ITGA8 expression were significantly more likely to present with advanced International Staging System (ISS) stage III disease compared to those with low ITGA8 expression (18/22 vs. 8/18, p = 0.006). Although the proportion of relapsed/refractory patients was lower in the ITGA8-high group (4/22 vs. 8/18), this difference did not reach statistical significance (p = 0.071).
Safety Assessment of ITGA8 as a Therapeutic Target and Generation of α8β1 CAR-T Cells
To further investigate whether ITGA8-targeted CAR-T therapy can mitigate relapse following BCMA-directed CAR-T treatment, we first evaluated the safety profile of ITGA8 as a therapeutic target by assessing its expression in normal hematopoietic cells. Flow cytometric analysis of bone marrow- and peripheral blood-derived HSCs and MPPs demonstrated that ITGA8 protein was undetectable on the surface of these populations (Figure 5A and Supplemental Figure 4). To further corroborate these findings at the protein level, CD34⁺ HSPCs were isolated from mobilized peripheral blood of healthy donors by CD34⁺ magnetic bead selection and expanded in vitro. Western blot analysis of HSPC protein lysates revealed that ITGA8 expression was completely absent, in marked contrast to the robust ITGA8 protein expression observed in myeloma cell lines (Figure 5B). Collectively, these results demonstrate that ITGA8 is not expressed in normal hematopoietic stem and progenitor compartments, suggesting that ITGA8-directed CAR-T therapy is unlikely to cause on-target hematopoietic toxicity.
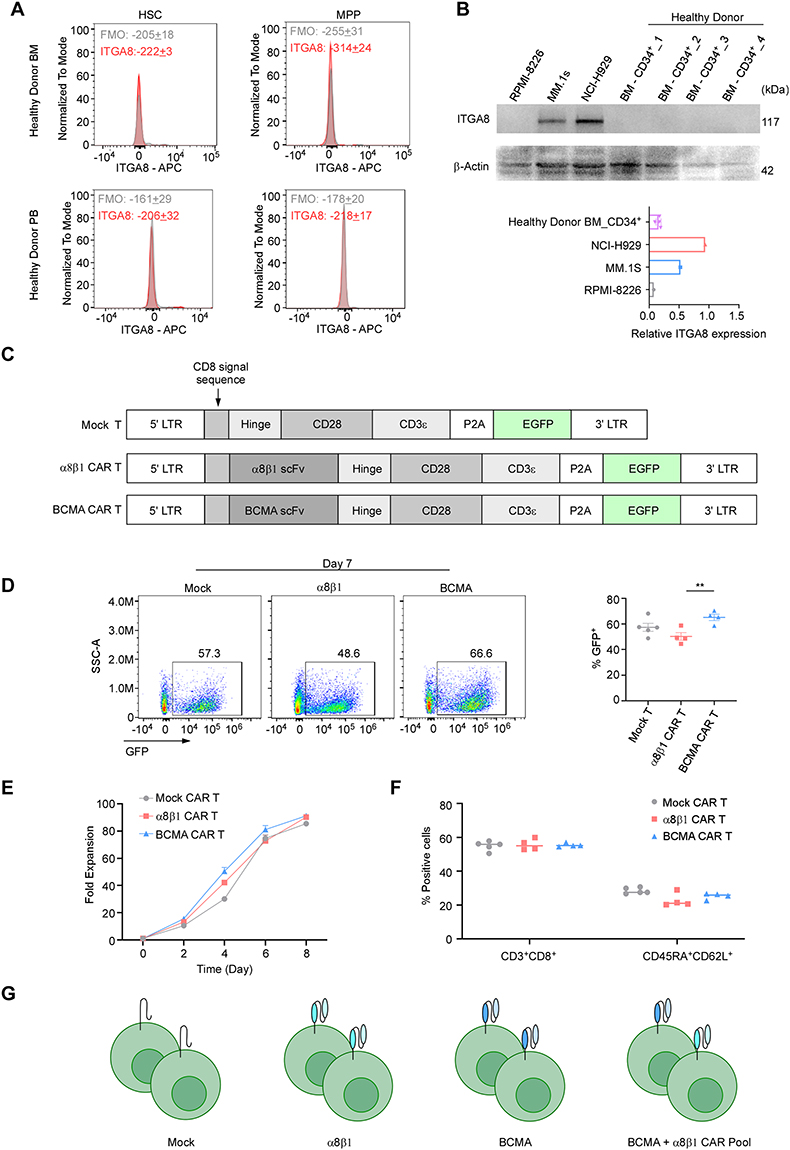 |
Figure 5 ITGA8 is a promising target for CAR-T therapy. (A) Flow cytometry analysis for ITGA8 expression in hematopoietic stem cells (HSC) and multipotent progenitor cells (MPP) from healthy donor bone marrow (BM) and peripheral blood (PB), with FMO controls. Data are presented as mean ± SEM from three independent experiments. (B) Western blot analysis of ITGA8 protein expression in myeloma cell lines (RPMI-8226, MM.1S, NCI-H929) and CD34⁺ cells isolated from healthy donor bone marrow. β-Actin served as the loading control. Quantification of relative ITGA8 expression is shown on the right. Data from healthy donors are presented as mean ± SEM. (C) Schematic representation of lentiviral vectors encoding Mock, α8β1, and BCMA CAR constructs. All vectors contain EGFP as a reporter gene under the control of the EF1α promoter. (D) Representative flow cytometry plots showing GFP expression in Mock, α8β1, and BCMA CAR-T cells on day 7 post-transduction. CAR T cells are generated different donors (n = 4–5). Quantification of transduction efficiency (% GFP⁺ cells) from is shown on the right. p values were calculated using two-tailed Student’s t-test. **p < 0.01. (E) Fold expansion of Mock, α8β1, and BCMA CAR-T cells over 8 days in culture (days 0, 2, 4, 6, 8). CAR T cells are generated different donors (n = 3). (F) Flow cytometry analysis of T-cells phenotypes on day 7 of culture. The percentages of CD3⁺CD8⁺ cytotoxic T cells and stem cell memory T cells (Tscm, defined as CD45RA⁺CD62L⁺) are shown for each group. CAR T cells are generated different donors (n = 4–5). (G) Schematic illustration of the experimental groups: Mock T cells, α8β1 CAR-T cells, BCMA CAR-T cells, and a combination pool of BCMA and α8β1 CAR-T cells. |
Immunohistochemical data from the Human Protein Atlas showed low ITGA8 protein expression in the parenchyma of most vital organs (Supplemental Figure 5A). Consistent with this, GTEx transcriptomic analysis revealed extremely low ITGA8 mRNA levels across most normal human tissues, with the highest expression localized specifically to blood vessels (Supplemental Figure 1C). Further cell-type profiling confirmed that within the vascular compartment, ITGA8 mRNA was predominantly and highly expressed in vascular smooth muscle cells, with only minimal expression in pericytes (Supplemental Figure 5B). However, primary human aortic smooth muscle cells (HAoSMCs) lost ITGA8 expression under standard in vitro culture conditions (Supplemental Figure 5C), which precluded direct in vitro assessment of α8β1 CAR-T cytotoxicity against this cell type.33 From an anatomical standpoint, vascular smooth muscle cells reside within the tunica media and are physically separated from circulating CAR-T cells by the endothelial monolayer and subendothelial basement membrane, suggesting that CAR-T access to this compartment is inherently restricted under physiological conditions.
Based on these findings, we cloned the scFv fragment of a murine anti-human α8β1 antibody into a second-generation CAR construct to generate α8β1 CAR-T cells. A Mock T cell control was constructed using the same vector backbone lacking the scFv segment, and BCMA CAR-T cells were generated in parallel for subsequent comparative studies (Figure 5C). GFP fluorescence was used to indicate transduction efficiency across all CAR-T constructs. α8β1 CAR-T cells generated from CD3⁺ T cells obtained from multiple healthy donors achieved a transduction efficiency of approximately 50% at culture Day 7, which was modestly lower than that observed for BCMA CAR-T and Mock T cells (Figure 5D). Despite this difference in transduction efficiency, no significant difference in proliferation rate was observed among the three groups, indicating that α8β1 CAR construct expression did not impair normal T cell expansion (Figure 5E). The proportions of CD8⁺ T cells and stem cell memory T cells (CD45RA⁺CD62L⁺) were comparable across Mock T, α8β1 CAR-T, and BCMA CAR-T groups, suggesting that CAR construct expression did not alter the memory differentiation status of the T cell product (Figure 5F). To enable unbiased assessment of cytotoxic activity, GFP positivity was normalized across groups using untransduced T cells as a reference, and α8β1 CAR-T and BCMA CAR-T cells were mixed at a 1: 1 ratio based on matched GFP percentage to generate the CAR pool combination group (Figure 5G).
α8β1 CAR-T Cells Exhibit Antigen-Specific Cytotoxicity and Complement with BCMA CAR-T to Control Multiple Myeloma Growth
We first assessed the in vitro cytotoxic activity of α8β1 CAR-T cells against myeloma cell lines with varying ITGA8 expression levels. In ITGA8-expressing MM.1S and NCI-H929 cells, α8β1 CAR-T exhibited significant cytotoxicity to kill tumor cells. In contrast, α8β1 CAR-T showed no cytotoxic activity in ITGA8-negative RPMI-8226 cells (Figure 6A). Cytokine detection revealed that the concentration of pro-inflammatory cytokines in the supernatant was significantly increased after co-culture of α8β1 CAR-T with myeloma cells, further confirming its in vitro activation and cytotoxic capacity (Figure 6B).
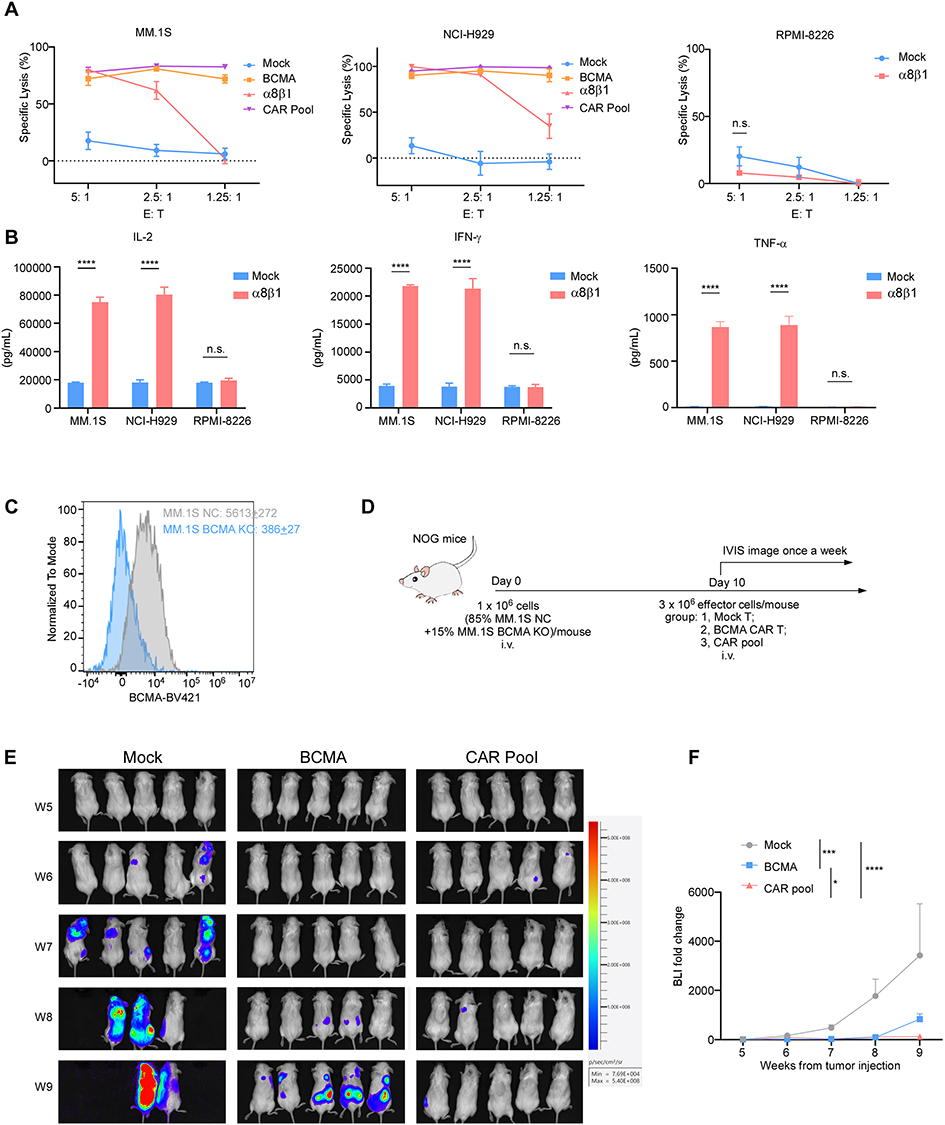 |
Figure 6 ITGA8-targeted CAR-T therapy exhibits potent anti-myeloma activity in preclinical models. (A) In vitro cytotoxicity analysis of Mock, BCMA, α8β1, and pooled CAR-T cells against MM.1S, NCI-H929 and RPMI-8226 multiple myeloma cell lines at the indicated effector-to-target (E: T) ratios. (B) Cytokine release of IL-2, IFN-γ or TNF-α from mock or α8β1 CAR-T cells after co-culture 24h with MM.1S, NCI-H929, or RPMI-8226 cells at E: T of 5: 1 was examined by ELISA. (C) Flow cytometry analysis for validation of BCMA knockout (KO) in MM.1S cells, with MM.1S NC (Negative Control) was used as a reference. Data are presented as mean ± SEM. (D) Schematic of the in vivo experimental design: NOG mice were injected intravenously with a mixture of MM.1S NC and BCMA KO cells, followed by treatment with Mock, BCMA, or pooled CAR-T cells. Tumor burden was monitored weekly via In Vivo Imaging System (IVIS). (E) Representative bioluminescence images of tumor burden in mice treated with Mock, BCMA, or CAR pool T cells at the indicated weeks post-tumor injection. n = 5 mice per group. (F) Quantification of bioluminescence signal fold change relative to baseline, corresponding to the data in (E). Data of A and B are presented as mean ± SEM from three independent experiments using T cells from different donors with three technical replicates per condition. p values were calculated using two-tailed Student’s t-test. Data of F are presented as mean ± SEM. p values were calculated by two-way ANOVA with Tukey’s multiple comparisons test. **p < 0.01, ****p < 0.0001. Abbreviation: n.s., not significant. |
We further evaluated whether combining α8β1 CAR-T with BCMA CAR-T could improve tumor control in a mixed model containing both BCMA-positive and BCMA-knockout myeloma cells, designed to mimic the outgrowth of antigen-loss variants under BCMA-targeted therapy (Figure 6C–D). In vivo experiments showed that BCMA CAR-T alone failed to fully inhibit tumor growth, whereas the CAR pool group achieved significantly stronger suppression of overall tumor burden (Figure 6E–F). These data indicate that α8β1 CAR-T can effectively target BCMA-deficient myeloma cells and complement the activity of BCMA CAR-T in this model, limiting the outgrowth of antigen-negative tumor populations.
Discussion
CAR-T therapy has revolutionized the treatment of relapsed/refractory multiple myeloma (R/R MM), with BCMA-targeted agents demonstrating unprecedented response rates and survival benefits.34,35 However, disease progression remains nearly universal, driven by multiple mechanisms including BCMA antigen loss or downregulation,9,36–38 clonal evolution,10 T-cell dysfunction, immunosuppressive bone marrow microenvironment, metabolic constraints,39 and acquisition of therapy-resistant phenotypes. Among these, BCMA antigen escape represents a well-documented mechanism of treatment failure, occurring in 50–80% of relapsed patients.16,40 Soluble BCMA (sBCMA) released from tumor cells further contributes to resistance by sequestering BCMA-targeted CAR-T cells and impairing target engagement, particularly in patients with high tumor burden or incomplete BCMA coverage.41,42 These limitations highlight the urgent need for alternative, non-BCMA antigens stably expressed in relapsed clones and suitable for combinatorial targeting.43
In the present study, we identified ITGA8 as a cell-surface molecule significantly enriched in MM cells at early relapse following BCMA CAR-T therapy across multiple independent single-cell cohorts. ITGA8 was consistently upregulated at early phases of recurrence, even in the absence of BCMA loss, suggesting it marks a biologically distinct subpopulation associated with treatment failure. ITGA8-positive MM cells exhibited a quiescent, low-proliferative, immune-evasive transcriptional profile characterized by reduced IFN-γ responsiveness, downregulated cell-cycle programs, and suppressed metabolic signaling. Pseudotime analysis further positioned ITGA8+ cells at an earlier developmental state, consistent with a precursor-like phenotype that may facilitate tumor re-emergence.
A question our data raise but do not fully resolve is whether ITGA8 actively drives therapy resistance or merely marks a subpopulation that is intrinsically resistant due to its quiescent state. Our functional studies demonstrated that ITGA8 overexpression directly suppressed proliferation in MM.1S cells and transcriptionally silenced proliferation and cell-cycle gene sets, supporting a functional contribution rather than pure bystander status. As an integrin, ITGA8 likely modulates interactions with the extracellular matrix, which are known to promote adhesion-mediated drug resistance and immune evasion in myeloma.27 Our data show that high ITGA8 expression correlates with ISS stage III disease, which is consistent with its proposed role in promoting cell-ECM adhesion and mediating drug resistance in myeloma.44 While our findings support a functional contribution to disease progression, definitive mechanistic evidence—including signaling pathways and microenvironmental crosstalk—remains incomplete and warrants further investigation.
Compared with other dual-targeting strategies under clinical investigation — including BCMA/CD19,45 BCMA/CD38,46 and BCMA/GPRC5D22 combinations — ITGA8 has several features that distinguish it as a complementary rather than redundant option. First, its expression is enriched specifically at early relapse, suggesting a therapeutic window that coincides with the initial CAR-T treatment phase rather than after overt treatment failure. Second, Unlike GPRC5D, which is an independent myeloma target with strong single-agent activity but is itself susceptible to antigen escape under immune pressure,16,47 ITGA8 targets a biologically distinct quiescent subpopulation that is present regardless of BCMA expression status. Third, ITGA8 shows high lineage specificity, with predominant expression in plasma cells and malignant MM cells but minimal expression across other hematopoietic lineages. Whether these features translate into a genuine clinical advantage over existing dual-target approaches will require further investigation.
The safety profile of ITGA8 deserves candid discussion. Our data confirm the absence of ITGA8 protein in hematopoietic stem and progenitor cells, which is reassuring from a hematopoietic toxicity standpoint. However, ITGA8 is expressed in vascular smooth muscle cells. The anatomical separation of vascular smooth muscle cells from circulating CAR-T cells by the endothelial monolayer may provide some degree of natural protection, but this reasoning is inferential rather than demonstrated. Formal in vivo vascular safety assessment is an essential prerequisite before any clinical translation of this approach.
Our study has several important limitations. Our xenograft models are short-term and immunodeficient, lacking the stromal complexity, immune contexture, and CAR-T persistence dynamics that characterize human disease. The improved tumor control we observed in the mixed-antigen model demonstrates the principle of complementary targeting but should not be interpreted as evidence of durable relapse prevention. The patient cohorts used for transcriptomic discovery are small, and while findings were consistent across three independent datasets, broader validation in prospective cohorts — particularly patients with primary resistance or late relapse — is needed. Finally, the clinical characteristics analysis (Supplemental Table 2) suggests an association between high ITGA8 expression and advanced ISS stage, which is biologically plausible given ITGA8’s role in ECM adhesion and niche retention,27 but this observation requires prospective validation.
Collectively, this study identifies ITGA8 as a novel cell-surface target enriched in early relapse following BCMA CAR-T therapy, marking a quiescent, immune-evasive subpopulation. α8β1 CAR-T specifically eliminates ITGA8-positive myeloma cells and complements with BCMA CAR-T to improve tumor control in preclinical models. These findings support the feasibility of combinatorial BCMA/ITGA8 targeting, but formal efficacy in preventing relapse requires long-term models and clinical investigation. Further optimization of CAR design, safety profiling, and mechanistic studies are warranted to advance this strategy toward clinical translation.
Conclusion
This study identifies integrin α8β1 as a novel cell-surface target enriched in multiple myeloma cells at early relapse following BCMA-targeted CAR-T therapy. Our preclinical data demonstrate that α8β1 CAR-T cells exert specific anti-myeloma activity and act complementally with BCMA CAR-T cells to improve tumor control in models mimicking antigen escape. These findings provide preclinical proof-of-concept and a theoretical rationale to support ITGA8 as a promising target worthy of further development, rather than establishing ITGA8 as a fully validated therapeutic target.
Several important considerations warrant emphasis. First, the safety implications of ITGA8 expression in non-hematopoietic tissues, particularly vascular smooth muscle cells, remain incompletely defined and require rigorous evaluation in future studies. Second, while our data demonstrate improved short-term tumor control using combined BCMA and ITGA8 targeting, this should be clearly distinguished from the definitive prevention of clinical relapse in patients, which requires long-term models and clinical validation.
Collectively, these results support the rational development of ITGA8-directed immunotherapies in combination with BCMA CAR-T, with the goal of eliminating quiescent, immune-evasive myeloma subclones at early relapse. Further investigation into target safety, CAR design optimization, and long-term efficacy is needed to advance this strategy toward clinical translation.
Data Sharing Statement
Raw data for bulk RNA sequencing is available as BioProjects with the project identifier PRJCA063676 in the China National Center for Bioinformation - National Genomics Data Center database.
Ethics Approval and Informed Consent
Fresh blood and bone marrow were donated by healthy volunteers or patients who had provided written informed consent. Work using human samples from healthy donors was approved by the institutional review board of Guangdong provincial people’s hospital (Ethics No. KY-Z-2021-212-02) and carried out in compliance with the Declaration of Helsinki. All animal experimentation was carried out in adherence to local guidelines and laws on the care and use of laboratory animals. The study protocol was independently approved by the Ethical Committee of GuangZhou LingFu TopBiotech. Co., LTD. Approved number: TOP-1PZ-GZ260201. Due to insufficient housing capacity and the remote location of our affiliated institution’s animal facility, we utilized this independent review board. All animal experiments were performed in compliance with the Guide for the Care and Use of Laboratory Animals published by the US National Institutes of Health published by the US National Institutes of Health, and ensured optimal animal welfare.
Author Contributions
All authors made a significant contribution to the work reported, whether that is in the conception, study design, execution, acquisition of data, analysis and interpretation, or in all these areas; took part in drafting, revising or critically reviewing the article; gave final approval of the version to be published; have agreed on the journal to which the article has been submitted; and agree to be accountable for all aspects of the work.
Funding
This research was supported by the National Natural Science Foundation of China (No. 8227016), Guangdong Basic and Applied Basic Research Foundation (No. 2024B1515020054), Science and Technology Planning Project of Guangdong Province, China (No. 2023B1111050004), NSFC Incubation Project of Guangdong Provincial People’s Hospital (KY0120220024 and KY012021160), and High-level Hospital Construction Project of Guangdong Provincial People’s Hospital (DFJHBF202107).
Disclosure
All authors declare no competing interests in this work.
References
1. Kumar SK, Callander NS, Adekola K, et al. Multiple myeloma, Version 5.2026, NCCN clinical practice guidelines in oncology. J Natl Compr Canc Netw. 2026;24(1). doi:10.6004/jnccn.2026.0001.
2. Lopez-Muñoz N, Hernández-Ibarburu G, Alonso R, et al. Large-scale real-life analysis of survival and usage of therapies in multiple myeloma. J Hematol Oncol. 2023;16(1):76. doi:10.1186/s13045-023-01474-w
3. Bazarbachi AH, Al Hamed R, Malard F, Harousseau JL, Mohty M. Relapsed refractory multiple myeloma: a comprehensive overview. Leukemia. 2019;33(10):2343–20. doi:10.1038/s41375-019-0561-2
4. Mushtaq A, Cheema AY, Ali HM, et al. Management of relapsed refractory multiple myeloma: evidence-based guide to community oncologists. Blood Rev. 2025;74:101339. doi:10.1016/j.blre.2025.101339
5. Mullard A. FDA approves first BCMA-targeted CAR-T cell therapy. Nat Rev Drug Discov. 2021;20(5):332.
6. San-Miguel J, Dhakal B, Yong K, et al. Cilta-cel or Standard Care in Lenalidomide-Refractory Multiple Myeloma. N Engl J Med. 2023;389(4):335–347. doi:10.1056/NEJMoa2303379
7. Einsele H, San-Miguel J, Dhakal B, et al. Cilta-cel in lenalidomide-refractory multiple myeloma (CARTITUDE-4): an updated analysis including overall survival from an open-label, multicentre, randomised, Phase 3 trial. Lancet Oncol. 2026;27(2):254–268. doi:10.1016/S1470-2045(25)00653-9
8. Van Oekelen O, Nath K, Mouhieddine TH, et al. Interventions and outcomes of patients with multiple myeloma receiving salvage therapy after BCMA-directed CAR T therapy. Blood. 2023;141(7):756–765. doi:10.1182/blood.2022017848
9. Hu Y, Hou J, Jiang Z, Lin Q. Mechanisms of resistance to CAR-T cell therapy in multiple myeloma: latest updates from the 2024 ASH annual meeting. Exp Hematol Oncol. 2025;14(1):45. doi:10.1186/s40164-025-00643-6
10. Papadimitriou M, Ahn S, Diamond BT, et al. Timing Genomic Antigen Loss in Multiple Myeloma Treated with T Cell-Redirecting Immunotherapies. Blood Cancer Discov. 2025;6(6):572–579. doi:10.1158/2643-3230.BCD-25-0005
11. Rade M, Grieb N, Weiss R, et al. Single-cell multiomic dissection of response and resistance to chimeric antigen receptor T cells against BCMA in relapsed multiple myeloma. Nat Cancer. 2024;5(9):1318–1333. doi:10.1038/s43018-024-00763-8
12. van de Donk N, Sonneveld P, Einsele H. Dual-antigen-targeting T-cell immunotherapies in MM: circumventing tumor heterogeneity and preventing antigen escape. Blood. 2026;147:2176–2193. doi:10.1182/blood.2025032536
13. Samur MK, Fulciniti M, Aktas Samur A, et al. Biallelic loss of BCMA as a resistance mechanism to CAR T cell therapy in a patient with multiple myeloma. Nat Commun. 2021;12(1):868. doi:10.1038/s41467-021-21177-5
14. Da Vià MC, Dietrich O, Truger M, et al. Homozygous BCMA gene deletion in response to anti-BCMA CAR T cells in a patient with multiple myeloma. Nat Med. 2021;27(4):616–619. doi:10.1038/s41591-021-01245-5
15. Riedhammer C, Truger M, Lee H, et al. The evolution to hepta-refractory myeloma involves sequential loss of CD38, BCMA and GPRC5D. Leukemia. 2026;40(4):730–738. doi:10.1038/s41375-026-02889-3
16. Lee H, Ahn S, Maity R, et al. Mechanisms of antigen escape from BCMA- or GPRC5D-targeted immunotherapies in multiple myeloma. Nat Med. 2023;29(9):2295–2306. doi:10.1038/s41591-023-02491-5
17. Munshi NC, Anderson LD Jr, Shah N, et al. Idecabtagene Vicleucel in Relapsed and Refractory Multiple Myeloma. N Engl J Med. 2021;384(8):705–716. doi:10.1056/NEJMoa2024850
18. Haertle L, Buenache Cuenda N, Espejo Diaz I, et al. Epigenetic modifications as a mechanism of resistance to BCMA-directed immunotherapies in multiple myeloma: insights from multi-omic profiling. Blood. 2024;144:5794. doi:10.1182/blood-2024-198117
19. Wang Y, Cao J, Gu W, et al. Long-term follow-up of combination of B-Cell maturation antigen and CD19 chimeric antigen receptor T cells in multiple myeloma. J Clin Oncol. 2022;40(20):2246–2256. doi:10.1200/JCO.21.01676
20. Richard S, Gaballa M, Gregory T, et al. Safety and efficacy of AZD0120, a BCMA/CD19 dual-targeting CAR T-cell therapy, in relapsed/refractory multiple myeloma: preliminary Results from the DURGA-1 Phase 1b/2 study. Blood. 2025;146(Supplement 1):269. doi:10.1182/blood-2025-269
21. Tang Y, Yin H, Zhao X, et al. High efficacy and safety of CD38 and BCMA bispecific CAR-T in relapsed or refractory multiple myeloma. J Exp Clin Cancer Res. 2022;41(1):2. doi:10.1186/s13046-021-02214-z
22. Yao H, Ren SH, Wang LH, et al. BCMA/GPRC5D bispecific CAR T-cell therapy for relapsed/refractory multiple myeloma with extramedullary disease: a single-center, single-arm, phase 1 trial. J Hematol Oncol. 2025;18(1):56. doi:10.1186/s13045-025-01713-2
23. Fu B, Liu R, Gao G, Lin Z, He A. Mechanisms and salvage treatments in patients with multiple myeloma relapsed post-BCMA CAR-T cell therapy. Front Immunol. 2024;15:1433774. doi:10.3389/fimmu.2024.1433774
24. Tedder B, Bhutani M. Resistance mechanisms to BCMA targeting bispecific antibodies and CAR T-cell therapies in multiple myeloma. Cells. 2025;14(14):1077. doi:10.3390/cells14141077
25. Di Meo F, Albano F, Cesarano A, et al. Developing SEMA4A-directed CAR T cells to overcome low BCMA antigen density in multiple myeloma. Cancer Cell. 2025;43(12):2298–2310.e2296. doi:10.1016/j.ccell.2025.09.007
26. Ferguson ID, Patiño-Escobar B, Tuomivaara ST, et al. The surfaceome of multiple myeloma cells suggests potential immunotherapeutic strategies and protein markers of drug resistance. Nat Commun. 2022;13(1):4121. doi:10.1038/s41467-022-31810-6
27. Solimando AG, Malerba E, Leone P, et al. Drug resistance in multiple myeloma: soldiers and weapons in the bone marrow niche. Front Oncol. 2022;12:973836. doi:10.3389/fonc.2022.973836
28. Ryu J, Koh Y, Park H, et al. Highly expressed integrin-α8 induces epithelial to mesenchymal transition-like features in multiple myeloma with early relapse. Mol Cells. 2016;39(12):898–908. doi:10.14348/molcells.2016.0210
29. Oliver-Caldés A, González-Calle V, Cabañas V, et al. Fractionated initial infusion and booster dose of ARI0002h, a humanised, BCMA-directed CAR T-cell therapy, for patients with relapsed or refractory multiple myeloma (CARTBCMA-HCB-01): a single-arm, multicentre, academic pilot study. Lancet Oncol. 2023;24(8):913–924. doi:10.1016/S1470-2045(23)00222-X
30. Rodríguez-Lobato LG, Cardús O, Mañé-Pujol J, et al. Bicistronic CAR T cell against BCMA and CD229 effectively controls myeloma even when BCMA expression is limited. Cancer Immunol Res. 2025;13(9):1374–1390. doi:10.1158/2326-6066.CIR-24-1313
31. Larson RC, Kann MC, Graham C, et al. Anti-TACI single and dual-targeting CAR T cells overcome BCMA antigen loss in multiple myeloma. Nat Commun. 2023;14(1):7509. doi:10.1038/s41467-023-43416-7
32. Baldominos P, Barbera-Mourelle A, Barreiro O, et al. Quiescent cancer cells resist T cell attack by forming an immunosuppressive niche. Cell. 2022;185(10):1694–1708.e1619. doi:10.1016/j.cell.2022.03.033
33. Zargham R, Thibault G. Alpha 8 integrin expression is required for maintenance of the smooth muscle cell differentiated phenotype. Cardiovasc Res. 2006;71(1):170–178. doi:10.1016/j.cardiores.2006.03.003
34. Rodriguez-Otero P, Ailawadhi S, Arnulf B, et al. Ide-cel or standard regimens in relapsed and refractory multiple myeloma. N Engl J Med. 2023;388(11):1002–1014. doi:10.1056/NEJMoa2213614
35. Swan D, Madduri D, Hocking J. CAR-T cell therapy in Multiple Myeloma: current status and future challenges. Blood Cancer J. 2024;14(1):206. doi:10.1038/s41408-024-01191-8
36. Feng Y, Liu X, Li X, et al. Novel BCMA-OR-CD38 tandem-dual chimeric antigen receptor T cells robustly control multiple myeloma. Oncoimmunology. 2021;10(1):1959102. doi:10.1080/2162402X.2021.1959102
37. Pont MJ, Hill T, Cole GO, et al. γ-Secretase inhibition increases efficacy of BCMA-specific chimeric antigen receptor T cells in multiple myeloma. Blood. 2019;134(19):1585–1597. doi:10.1182/blood.2019000050
38. Rieger L, Irlinger K, Füchsl F, et al. Boosting CAR T-cell efficacy by blocking proteasomal degradation of membrane antigens. Blood. 2026;147(5):534–546. doi:10.1182/blood.2024027616
39. Navarro F, Lozano T, Fuentes-García A, et al. Reprogramming glutamine metabolism enhances BCMA-CAR T-cell fitness and therapeutic efficacy in multiple myeloma. Blood. 2025;146(24):2931–2944. doi:10.1182/blood.2024027496
40. Zhou X, Rasche L, Kortüm KM, Mersi J, Einsele H. BCMA loss in the epoch of novel immunotherapy for multiple myeloma: from biology to clinical practice. Haematologica. 2023;108(4):958–968. doi:10.3324/haematol.2020.266841
41. Cowan AJ, Pont M, Sather BD, et al. Safety and efficacy of fully human BCMA CAR T cells in combination with a gamma secretase inhibitor to increase BCMA surface expression in patients with relapsed or refractory multiple myeloma. Blood. 2021;138:551. doi:10.1182/blood-2021-154170
42. Lee H, Durante M, Skerget S, et al. Impact of soluble BCMA and non–T-cell factors on refractoriness to BCMA-targeting T-cell engagers in multiple myeloma. Blood. 2024;144(25):2637–2651. doi:10.1182/blood.2024026212
43. Ershova A, Goldaeva A, Staliarova A, Bulatov E, Petukhov A, Barlev N. Future perspectives on novel CAR-T therapeutics beyond CD19 and BCMA in onco-hematology. Front Immunol. 2025;16:1592377. doi:10.3389/fimmu.2025.1592377
44. Sevilla-Movilla S, Arellano-Sánchez N, Martínez-Moreno M, et al. Upregulated expression and function of the α4β1 integrin in multiple myeloma cells resistant to bortezomib. J Pathol. 2020;252(1):29–40. doi:10.1002/path.5480
45. Shi M, Wang J, Huang H, et al. Bispecific CAR T cell therapy targeting BCMA and CD19 in relapsed/refractory multiple myeloma: a Phase I/II trial. Nat Commun. 2024;15(1):3371. doi:10.1038/s41467-024-47801-8
46. Mei H, Li C, Jiang H, et al. A bispecific CAR-T cell therapy targeting BCMA and CD38 in relapsed or refractory multiple myeloma. J Hematol Oncol. 2021;14(1):161. doi:10.1186/s13045-021-01170-7
47. Xia J, Sun Q, Zhou D, et al. Anti-GPRC5D CAR T-cell therapy as a salvage treatment in patients with progressive multiple myeloma after anti-BCMA CAR T-cell therapy: a single-centre, single-arm, Phase 2 trial. Lancet Haematol. 2025;12(5):e365–e375. doi:10.1016/S2352-3026(25)00048-1
 © 2026 The Author(s). This work is published and licensed by Dove Medical Press Limited. The
full terms of this license are available at https://www.dovepress.com/terms
and incorporate the Creative Commons Attribution
- Non Commercial (unported, 4.0) License.
By accessing the work you hereby accept the Terms. Non-commercial uses of the work are permitted
without any further permission from Dove Medical Press Limited, provided the work is properly
attributed. For permission for commercial use of this work, please see paragraphs 4.2 and 5 of our Terms.
© 2026 The Author(s). This work is published and licensed by Dove Medical Press Limited. The
full terms of this license are available at https://www.dovepress.com/terms
and incorporate the Creative Commons Attribution
- Non Commercial (unported, 4.0) License.
By accessing the work you hereby accept the Terms. Non-commercial uses of the work are permitted
without any further permission from Dove Medical Press Limited, provided the work is properly
attributed. For permission for commercial use of this work, please see paragraphs 4.2 and 5 of our Terms.
Recommended articles
Targeting B Cell Maturation Antigen in Patients with Multiple Myeloma: Current Perspectives
Shrivastava T, Van Rhee F, Al Hadidi S
OncoTargets and Therapy 2023, 16:441-464
Published Date: 20 June 2023
The Antibody Drug Conjugate, Belantamab-Mafodotin, in the Treatment of Multiple Myeloma: A Comprehensive Review
Almodovar Diaz AA, Alouch SS, Chawla Y, Gonsalves WI
Blood and Lymphatic Cancer: Targets and Therapy 2024, 14:71-87
Published Date: 6 December 2024