Back to Journals » International Journal of General Medicine » Volume 19
Integrated Transcriptomics and Experimental Validation Reveal Müller Cell-Driven PANoptosis in Diabetic Retinopathy via PSAP-GPR37 Signaling
Authors Li J, Chen Y, Chao Y, Zhang Y, Gan F ![]() , You Z
, You Z ![]()
Received 2 December 2025
Accepted for publication 6 May 2026
Published 23 May 2026 Volume 2026:19 585908
DOI https://doi.org/10.2147/IJGM.S585908
Checked for plagiarism Yes
Review by Single anonymous peer review
Peer reviewer comments 3
Editor who approved publication: Professor Kenneth Adler
Jing Li,1,* Yicong Chen,2,* Yunxiang Chao,1 Yupeng Zhang,1 Fan Gan,1 Zhipeng You1
1Department of Vitreoretinal Diseases, The Affiliated Eye Hospital, Jiangxi Medical College, Nanchang University, Nanchang, 330006, People’s Republic of China; 2Department of Otolaryngology, Nanchang First Hospital, Nanchang, 330008, People’s Republic of China
*These authors contributed equally to this work
Correspondence: Zhipeng You, Department of Vitreoretinal Diseases, The Affiliated Eye Hospital, Jiangxi Medical College, Nanchang University, Nanchang, 330006, People’s Republic of China, Email [email protected]
Background: Diabetic retinopathy (DR) is a major complication of diabetes leading to severe visual impairment. PANoptosis, a pro-inflammatory programmed cell death (PCD), has emerged as a potential pathological mechanism. This study aimed to elucidate the role of membrane protein-mediated PANoptosis in key cell populations during DR progression and to screen for coregulated genes with therapeutic potential.
Methods: We integrated rat single-cell (scRNA-seq) and human bulk transcriptomes to identify differentially expressed PANoptosis-related genes (DE-PRGs). Single-sample gene set enrichment analysis (ssGSEA) was used to score PANoptosis activity, and CellChat was employed to examine ligand-receptor communications. Key cell subpopulations were characterized, and a protein-protein interaction (PPI) network was constructed to identify hub genes. Drug targets were predicted via the DGIDB database. Key findings were validated in a DR rat model and high-glucose-treated retinal Müller cells (RMC-1) using qRT-PCR, Western blotting, cell death assays, and siRNA-mediated PSAP knockdown.
Results: We identified 27 DE-PRGs enriched in TNF, PCD, and p53 signaling pathways. Müller cells exhibited significantly elevated PANoptosis scores in the DR group. Intercellular communication analysis indicated that Müller cells transmit pro-apoptotic signals via the PSAP-GPR37 ligand-receptor axis. Sub-clustering identified “Müller2” as the key pathogenic subpopulation, characterized by high PSAP-GPR37 expression. Ten hub genes were screened, yielding 26 potential drug targets. Validation confirmed the downregulation of DLG4 and the upregulation of FN1, EMP3, PDGFRβ, and PSAP in DR models. In vitro, high glucose induced cell death and upregulated PANoptosis markers (NLRP3, cleaved caspase-8, and the p-MLKL/MLKL ratio). Notably, siRNA-mediated PSAP knockdown effectively attenuated the high glucose-induced elevation of these PANoptosis proteins.
Conclusion: Integrating single-cell and bulk transcriptomics, this study suggests Müller cells—specifically the Müller2 subpopulation—as central drivers of PANoptosis in DR via PSAP-GPR37 signaling. Furthermore, the identified hub genes and PSAP provide a theoretical basis for precise, cell-subpopulation-specific intervention strategies.
Keywords: diabetic retinopathy, PANoptosis, Müller cell, PSAP, bioinformatics analysis, transcriptomics
Introduction
Diabetic retinopathy (DR) is a prevalent microvascular complication of diabetes mellitus that contributes significantly to vision loss among working-age populations worldwide.1 The occurrence and development of DR are latent and not easily detected, and when vision is impaired, it is often past the optimal time for diagnosis and treatment.2 The pathogenesis of DR is multifaceted, involving three interconnected aspects: microangiopathy, inflammatory response, and neurodegeneration.3–5 A multitude of cellular and molecular alterations, including but not limited to endoplasmic reticulum stress, oxidative stress, glutamate toxicity, autophagy, and apoptosis, have been identified as contributing factors to retinal neurological dysfunction, vascular structural abnormalities, pathologic neovascularization, and persistent inflammatory response.6–8 At present, the underlying mechanisms of DR remain incompletely understood, and therapeutic options remain inadequate. Consequently, further investigation into the pathogenesis of DR is imperative, with the identification of novel biomarkers for diagnosis and the characterisation of pharmacological compounds for targeted therapy being key objectives.
Recently, PANoptosis has emerged as a novel, highly pro-inflammatory programmed cell death (PCD) pathway, governed by a supramolecular complex known as the PANoptosome. Unlike traditional models that view apoptosis (a generally non-inflammatory, caspase-dependent process), pyroptosis (an inflammasome-driven inflammatory death), and necroptosis (an MLKL-mediated lytic death) as isolated and mutually exclusive pathways, PANoptosis represents a significant paradigm shift.9 The defining characteristic that differentiates PANoptosis from these individual pathways is its built-in redundancy and extensive molecular crosstalk. Evidence suggests that inhibiting a single death pathway often fails to halt cellular demise, as cells can engage compensatory death mechanisms. Therefore, PANoptosis integrates these multiple modalities into a unified network, providing a more comprehensive representation of cellular death under severe stress.10,11 Upstream sensor molecules, including ZBP1, RIPK1, and AIM2, are capable of sensing pathogens or injury signals, thereby triggering a synergistic activation of downstream effector molecules.12,13
Evidence suggests that hyperglycemia contributes to the pathological basis of cell death by increasing levels of reactive oxygen species (ROS) and advanced glycation end products (AGEs). This hyperglycemic environment induces mitochondrial dysfunction in retinal cells and activates molecular triggers associated with the PANoptosome.14,15 While the critical involvement of PANoptosis has recently been recognized in other diabetic complications—such as diabetic nephropathy and cardiomyopathy16,17—its specific pathophysiological role and regulatory network in diabetic retinopathy (DR) remain a largely unexplored and highly novel frontier. Preliminary studies have only just begun to unveil the existence of PANoptosis in DR,18 indicating that targeting this integrated pathway offers a superior, multi-pronged therapeutic strategy compared to traditional single-pathway inhibitors.
Despite this conceptual breakthrough, a critical knowledge gap remains. The specific retinal cell populations driving this integrated PANoptotic network and the critical intercellular communication pathways—particularly membrane receptor-ligand interactions—mediating this process in DR are entirely elusive. Furthermore, core regulators with cell-type-targeting potential lack rigorous functional validation.
To bridge this gap, we employed a systematic approach integrating transcriptomics with experimental validation to elucidate the mechanisms of DR. This identification process utilized a foundational list of PANoptosis genes compiled from the Gene Expression Omnibus (GEO) database in NCBI and relevant literature. We identified key cell populations using single-cell transcriptome analysis and subsequently performed cell communication analysis to elucidate membrane protein-mediated ligand-receptor interactions. After subdividing the cellular subpopulations, we constructed a protein-protein interaction (PPI) network from bulk data to screen for hub genes and predict potential target drugs. Finally, we validated the expression of these key hub genes in a DR animal model and performed in vitro assays to preliminarily explore the association between the identified PSAP-GPR37 axis and core PANoptotic marker proteins in retinal Müller cells. This study provides a novel foundation for elucidating the molecular mechanisms of PANoptosis in DR and offers potential biomarkers and drug targets for precise therapeutic intervention.
Materials and Methods
Data Sources and Workflow
The single-cell transcriptome data (scRNA-seq) used in this study were obtained from the GEO database. This dataset (GSE209872) originates from a DR rat model and includes two control samples and three disease group samples. The specific samples analyzed were the WT control group (GSM6403184) and the DR group (GSM6403185, GSM6403186, and GSM6403187). We also obtained two bulk transcriptome datasets from GEO: GSE60436, comprising microarray data from six PDR patients and three normal controls; and GSE102485, containing RNA-seq count data from 22 DR patients and three normal controls. These specific datasets were carefully selected based on their disease relevance, completeness for cross-scale integration, and explicit clinical or experimental groupings. Specifically, GSE209872 directly corresponds to the DR rat model, providing a foundation for single-cell clustering and PANoptosis scoring. GSE60436 and GSE102485 provide robust human bulk transcriptomic data with clear DR versus control groupings, serving as ideal validation cohorts to cross-verify our single-cell findings at the disease level. Other available datasets were excluded to minimize potential batch effects and phenotypic biases arising from disparate sequencing platforms, missing annotation information, or inconsistent clinical criteria.
We compiled a set of 675 PANoptosis-related genes (PRGs) based on a literature review.19 It should be noted that human-derived data were utilized exclusively as functional annotation gene sets rather than for direct disease transcriptome comparisons. These human genes were then converted to their rat orthologs using the homologene package (version 1.4.68.19) to facilitate downstream mechanistic inferences. The human membrane protein gene set was obtained from the Human Proteome Database.20 This list was subsequently converted to the rat ortholog set using the same method, which was strictly utilized for screening membrane-bound ligand-receptor pairs in our subsequent cellular communication analyses.
Analysis of Differences in the Bulk Transcriptome Datasets
We performed differential expression analysis on the bulk transcriptome datasets. Prior to the analysis, low-expressed genes were systematically filtered out, and samples with clinical groupings inconsistent with the primary diabetic retinopathy (DR) phenotype were strictly excluded to manage potential data inconsistencies and analytical outliers. The GSE60436 dataset was analyzed using the limma package (version 3.58.1), while the GSE102485 dataset was analyzed using the DESeq2 package (version 1.42.1). Differential genes were screened under the following conditions: (FDR < 0.05, |log2FC| > 1.5). The resulting differentially expressed genes (DEGs) were intersected with the rat PANoptosis gene set to identify the DE-PRGs, and the results were visualized as a Venn diagram using the ggvenn package (version 0.1.10). Subsequently, these intersecting genes were subjected to functional enrichment analysis using the clusterProfiler package (version 4.10.1). During the pathway enrichment process, specific KEGG species annotation settings were applied to map genes to the human pathway database, thereby leveraging its superior coverage and database completeness.
Single-Cell Clustering and Annotation
The scRNA-seq data from GSE209872 were processed using a standard pipeline, including filtering, quality control, normalization, dimensionality reduction, and clustering. These steps were performed using the Seurat package (version 4.4.0). Initially, data were filtered using the CreateSeuratObject function, retaining cells with at least 200 detected features (genes) and features expressed in at least 3 cells (min.features = 200, min.cells = 3). To comprehensively manage potential data inconsistencies and analytical outliers, we applied strictly defined thresholds: cells were retained only if they possessed detected features between 200 and 5000, and total UMI counts between 200 and 15,000. The PercentageFeatureSet function was used to calculate mitochondrial and ribosomal gene scores based on their respective gene sets. Subsequently, cells with mitochondrial or ribosomal gene scores exceeding 25% were excluded from further analysis. (Note: The GSM6403183 sample was entirely excluded after initial QC and batch evaluation due to exceptionally poor quality metrics. Consequently, a total of four robust samples were included: one WT control (GSM6403184) and three DR samples (GSM6403185, GSM6403186, and GSM6403187)). After applying these rigorous QC filters, a total of 43,527 high-quality cells (33,946 from the DR group and 9581 from the WT group) were retained.
Although explicit computational doublet removal algorithms were not applied, downstream unsupervised clustering revealed clear canonical marker expression profiles for distinct cell types (eg, Rod, Müller, BC, AC, Endothelial, Pericyte, Microglia, Cone, and ACHC) without difficult-to-explain mixed-lineage clusters or abnormal co-expression of markers, indicating that potential doublets did not confound our primary cell-type annotations. To rigorously eliminate technical batch effects prior to integration, data from each sample were initially split and individually normalized (NormalizeData) and scaled (ScaleData), during which we explicitly corrected for sequencing depth variations and regressed out mitochondrial signals to further manage cellular-level inconsistencies. The top 2000 highly variable genes for each specific sample were identified for principal component analysis (PCA). Subsequently, we employed Seurat’s canonical correlation analysis (CCA) pipeline (FindIntegrationFeatures, FindIntegrationAnchors, and IntegrateData) to mitigate batch effects and create an integrated, batch-corrected expression matrix.
An elbow plot was generated to determine the optimal number of principal components (PCs). Based on the plot, the top 45 PCs (preceding the inflection point) were selected for subsequent analysis. Subsequently, unsupervised clustering was performed on the batch-corrected data using the FindNeighbors and FindClusters functions. The optimal resolution was determined using the clustree function; a resolution of 0.6 was selected for this analysis, yielding 32 clusters. Uniform Manifold Approximation and Projection (UMAP) was used for visualization of the clustering results. Cells were manually annotated based on canonical marker genes obtained from the CellMarker database and relevant literature.12 Furthermore, any cell clusters that could not be stably and reliably annotated were systematically excluded from subsequent downstream analyses. The proportions of each annotated cell type were calculated and visualized as bar charts using the ggplot2 package.
Identification of Key PANoptosis Cells
Using the previously identified DE-PRGs, we calculated a PANoptosis score for each cell via the single-sample gene set enrichment analysis (ssGSEA) algorithm. We utilized UMAP to visualize the distribution of these PANoptosis scores and subsequently performed a differential analysis of the scores between the DR and control groups. Cell populations exhibiting significant score differences between the two groups were defined as “key PANoptosis cells.” Subsequently, cells were stratified into “PANoptosis-high” and “PANoptosis-low” groups based on the median score. Finally, we used the ggplot2 package to statistically analyze and visualize the proportions of these two groups as bar charts, illustrating their distributional differences.
Cell Communication Analysis
Intercellular communication relies on the specific binding of ligands to receptors, which in turn activates downstream signaling pathways. A systematic analysis of these ligand-receptor interaction networks is imperative for elucidating complex cellular behaviors and biological processes. We employed the CellChat package to predict and compare cellular communication differences between the “PANoptosis-high” and “PANoptosis-low” score groups. From the identified differential ligand-receptor pairs, we selected those involving membrane proteins as key targets for this study. We then systematically evaluated the expression profiles of these corresponding membrane ligands and receptors across all cell subpopulations.
Analysis of Key PANoptosis Cell Subpopulations
To further analyze the heterogeneity of the key PANoptosis cell populations, we performed secondary dimensionality reduction and clustering on these cells to delineate functionally distinct subpopulations. Subsequently, we used the FindAllMarkers function in Seurat (parameters: min.pct = 0.2, only.pos = TRUE, and logfc.threshold = 0.5) to identify specific positive marker genes for each subpopulation via a “one-vs-rest” strategy. Finally, we performed functional enrichment analysis on these marker genes using the clusterProfiler package (version 4.10.0). Core PANoptosis subpopulations were identified based on the significant enrichment of apoptosis-related pathways in their marker genes.
Identifying Potential Gene Therapies Targeting Key Subtypes of PANoptosis Mediated by Membrane Proteins
Using the GSE102485 bulk transcriptome dataset, we first calculated sample scores via the ssGSEA algorithm based on the signature genes from the key PANoptosis subpopulation. Samples were then stratified into PANoptosis-high and low-score groups based on the median score. We identified DEGs between these two groups using the DESeq2 package (version 1.42.0) with cutoff criteria of |log2FC| > 2 and FDR < 0.05. Subsequently, we used these DEGs to construct a PPI network via the STRING database (https://cn.string-db.org/), from which hub genes were identified. We then predicted potential drug-gene interactions using the DGIDB database (https://dgidb.org/). Additionally, we employed the CIBERSORT algorithm to evaluate the infiltration proportions of 22 immune cell types in the samples.
Validation of PANoptosis-Related Genes and Hub Genes in DR Rat Retinal Tissue
Animal Models
The animal experiments conducted as part of this project were partially carried out in accordance with the ARVO Statement on the Use of Animals in Ophthalmic and Vision Research, and were approved by the Ethics Committee of the Affiliated Eye Hospital of Nanchang University. Twenty male Sprague Dawley rats (average weight: 220 ± 20 g) were procured from Changsha Tianqin Biotechnology Co. Ltd. The rats were randomly divided into a normal control group (Ctrl; n = 10) and a diabetes mellitus (DM) model group (DM; n = 10). To induce diabetes, rats in the DM group received a single intraperitoneal (i.p.) injection of streptozotocin (STZ; S8050, Solarbio) at 60 mg/kg, dissolved in 0.1 mM sodium citrate buffer (pH 4.5). Control rats received an equivalent volume of sodium citrate buffer. Random blood glucose levels were measured 72 hours post-injection; successful modeling was defined as a blood glucose level exceeding 16.7 mM. The rats were euthanized 12 weeks after DM induction. Retinal tissues and the eye samples were collected immediately following cervical dislocation.
Histological Examination (H&E Staining)
To evaluate retinal morphological alterations, hematoxylin and eosin (H&E) staining was performed. Briefly, enucleated rat eyes were paraffin-embedded and sagittally sectioned at a thickness of 3 μm. After baking at 85°C for 30 min, the sections were deparaffinized in xylene and rehydrated through a decreasing ethanol series to water. The slides were then stained with hematoxylin for 3 min, differentiated in 1% acid-alcohol for 2s, and counterstained with eosin for 1 min. Following rapid dehydration through an increasing ethanol series, the sections were mounted with neutral balsam. Qualitative histopathological changes, including apparent retinal thinning and structural disorganization, were observed and photographed using a light microscope to verify the establishment of early-stage diabetic retinopathy.
Real-Time Quantitative Polymerase Chain Reaction (qRT-PCR) Analysis
Total RNA was extracted from retinal tissue using the AG RNAex Pro RNA Extraction Kit (AG 21101) and subsequently purified using the Steady Pure RNA Extraction Kit (AG 21024), both from ACCURATE BIOTECHNOLOGY (HUNAN) CO., LTD. (Changsha, China). The purified RNA was then reverse-transcribed into cDNA using the Evo M-MLV RT PreMix Kit (AG 11728, ACCURATE BIOTECHNOLOGY). The qPCR amplification was performed using the SYBR Green Pro Taq HS qPCR kit (AG 11701, ACCURATE BIOTECHNOLOGY), and fluorescent signals were collected and analyzed during the exponential amplification phase. All reactions were performed in triplicate, and the results were analyzed from three independent experiments. The primer sequences used in this study are listed in Table 1, with β-actin serving as the internal reference.
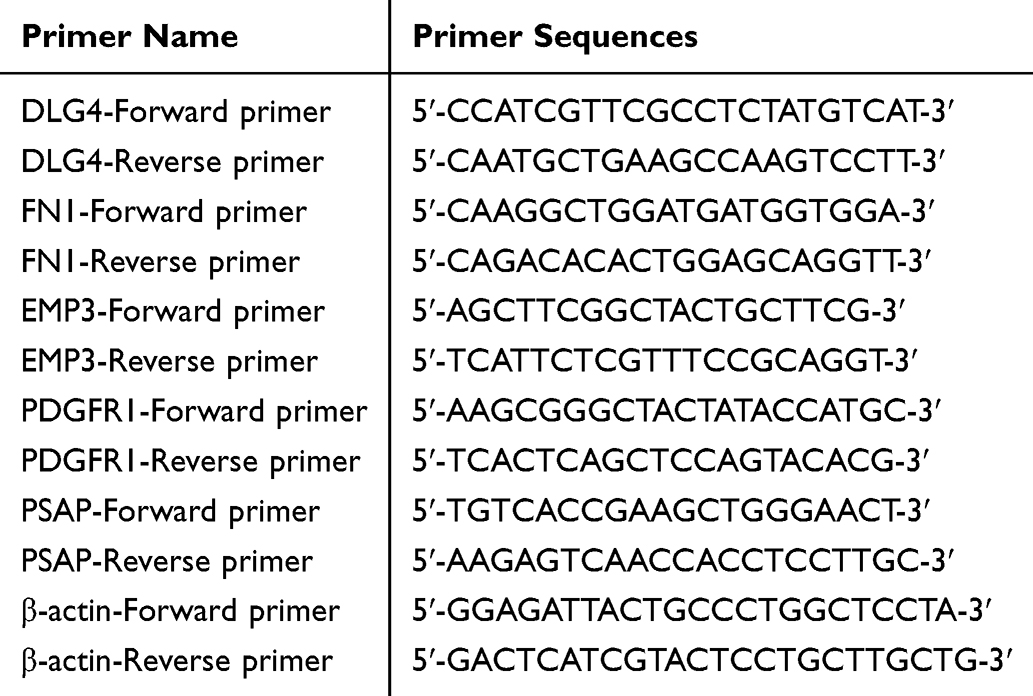 |
Table 1 Primer Name and Sequence |
Validation of NLRP3, Cleaved Caspase-8, p-MLKL/MLKL and PANoptosis-Related Genes and Hub Genes by Western Blot
Total protein was extracted from retinal tissue using RIPA lysis buffer supplemented with PMSF (Solarbio, China). Protein lysates were separated by 10% SDS-PAGE and subsequently transferred onto PVDF membranes. The membranes were then blocked for 2 hours at room temperature with 5% non-fat milk. The membranes were then incubated overnight at 4°C with primary antibodies on a shaker. The following primary antibodies were used: NLRP3 (1:1000, WL02635, Wanleibio), cleaved caspase-8 (1:1000, AF5267, Affinity Biosciences), Phospho-MLKL (1:1000, AF7420, Affinity Biosciences), MLKL (1:5000, 66675-1-Ig, Proteintech), PDGFRβ (1:2000, 13449-1-AP, Proteintech), PSAP (1:1000, 10801-1-AP, Proteintech), DLG4 (1:5000, 30255-1-AP, Proteintech), Fibronectin (1:2000, 15613-1-AP, Proteintech), and β-actin (1:200000, AC026, Abclonal) The secondary antibody was HRP-conjugated affinipure goat anti-rabbit IgG (H+L) (1:5000, BA1045, BOSTER). Protein bands were developed using an ECL substrate, detected using an automated chemiluminescence image analysis system (Tanon-5200 Multi, China), and quantified using ImageJ software.
Verification of Cell Experiments
Cell Line Selection and Culture Conditions
The rat retinal Müller cell line (RMC-1; Tong Pai Technology, China) served as an in vitro model to investigate the mechanisms of PANoptosis, oxidative stress, and the immune response in DR. RMC-1 cells were maintained in low-glucose DMEM (Sorbio, China) supplemented with 10% fetal bovine serum (FBS; TransGen Biotech, China). Cells cultured in 5.5 mmol/L glucose served as the normal glucose (NG) control group, while those cultured in 50 mmol/L glucose served as the high-glucose (HG) group. A mannitol (MA) group (5.5 mmol/L glucose + 44.5 mmol/L mannitol) was used as an osmotic control to account for the effects of hyperosmolality. Cells in the HG groups were cultured for 24 or 48 hours before analysis.
Cell Viability Assay
Cell viability in the NG, HG, and MA groups was assessed using the Cell Counting Kit-8 (CCK-8; C6005, NCM biotech). Cells were seeded at a uniform density in 96-well plates and cultured. Subsequently, 10% CCK-8 reagent was added to the culture medium in each well, and the plates were incubated for 1 hour at 37°C. Absorbance at 450 nm was measured using a microplate reader (Thermo Scientific).
Reactive Oxygen Species (ROS) Testing
ROS levels in RMC-1 cells were measured using Dihydroethidium (DHE; D7008, Sigma-Aldrich). Following treatment, cells were incubated with 5μM DHE for 20 min at 37°C in the dark, according to the manufacturer’s protocol. Cells were then harvested (via trypsinization) and analyzed using a DxFLEX flow cytometer (Beckman Coulter). Data were processed and quantified using FlowJo software (version 10.8.1).
Validation of PANoptosis-Related Genes and Hub Genes by qRT-PCR
Total RNA was extracted from treated RMC-1 cells in each group and subjected to qRT-PCR analysis as described in Histological Examination (H&E Staining). The primer sequences used for this analysis are listed in Table 1, with β-actin serving as the internal reference.
Validation of NLRP3, Cleaved Caspase-8, p-MLKL/MLKL and PANoptosis-Related Genes and Hub Genes by Western Blot
Total protein was extracted from RMC-1 cells using RIPA lysis buffer supplemented with PMSF (Solarbio, China) and subsequently analyzed by Western blot as described in Real-Time Quantitative Polymerase Chain Reaction (qRT-PCR) Analysis.
Annexin V-FITC/PI Apoptosis Assay
The Annexin V-FITC/PI Apoptosis Detection Kit (40302ES50, Yeasen) was used to detect apoptosis in RMC-1 cells. Following treatment under the corresponding experimental conditions, the culture supernatant was collected. The cells were washed twice with PBS, detached using 0.25% EDTA-free trypsin, and pooled with the collected supernatant. The cell suspension was then centrifuged, and the resulting pellet was washed twice with pre-chilled PBS and resuspended in 1× binding buffer. Subsequently, 5 μL of Annexin V-FITC and 10 μL of PI Staining Solution were added. The cells were gently mixed and incubated in the dark at room temperature for 10–15 minutes. Finally, the samples were analyzed within 1 hour using a DxFLEX flow cytometer (Beckman Coulter).
LDH Release Assay
LDH release from RMC-1 cells was measured using an LDH release assay kit (C0019M, Beyotime) according to the manufacturer’s instructions. After the cells were treated under the corresponding experimental conditions, the culture supernatants were collected to evaluate LDH efflux. Subsequently, the absorbance at 450 nm was recorded using a microplate reader.
Cell Death Assay
Cell death was assessed via propidium iodide (PI; C0080, Solarbio) incorporation. In brief, following the corresponding experimental treatments, a mixture of PI (5 μg/mL) and Hoechst 33342 (10 μg/mL; C0031, Solarbio) was added directly to the culture medium to stain the dead cells (membrane-compromised) and all cell nuclei, respectively. Fluorescence images were captured using an Olympus IX71 inverted fluorescence microscope (Olympus Ltd, Tokyo, Japan), and the collected images were subsequently quantified and analyzed using ImageJ software.
siRNA-Mediated Knockdown of PSAP in RMC-1 Cells
Cell Culture and siRNA Transfection
RMC-1 cells were seeded at a density of 1×10⁵ cells/well in 6-well plates and cultured in low-glucose DMEM supplemented with 10% FBS until reaching 30–50% confluence. The cells were transiently transfected with 50 nM of PSAP-specific small interfering RNA (si-PSAP-1, si-PSAP-2, or si-PSAP-3; Hanbio Biotechnology, China) or a negative control siRNA (si-NC; Hanbio Biotechnology, China) using the RNAfit transfection reagent (Hanbio Biotechnology) according to the manufacturer’s protocol. After 6 hours of incubation, the transfection medium was replaced with fresh complete culture medium, and the cells were cultured for an additional 48 hours. The specific target sequences of the siRNAs are listed in Supplementary Table S1.
Validation of PSAP Knockdown Efficiency
To evaluate the knockdown efficiency of the three si-PSAP sequences, cells were divided into four groups and cultured in low-glucose DMEM: si-NC, si-PSAP-1, si-PSAP-2, and si-PSAP-3. At 48 hours post-transfection, total RNA and protein were extracted and subjected to qRT-PCR and Western blot analyses, as described in Validation of PANoptosis-Related Genes and Hub Genes by qRT-PCR and Validation of NLRP3, Cleaved Caspase-8, p-MLKL/MLKL and PANoptosis-Related Genes and Hub Genes by Western Blot, respectively. The si-PSAP sequence exhibiting the highest knockdown efficiency was selected for all subsequent functional experiments.
Assessment of PANoptosis Levels Following PSAP Knockdown
To validate the functional role of PSAP in mediating PANoptosis, cells were divided into four groups: Ctrl (normal glucose control), si-NC (normal glucose with negative control siRNA), si-NC + HG (high glucose with negative control siRNA), and si-PSAP + HG (high glucose with PSAP knockdown). The Ctrl and si-NC groups were maintained in complete medium containing 5.5 mmol/L glucose. Conversely, the si-NC + HG and si-PSAP + HG groups were cultured in complete medium containing 50 mmol/L glucose. Following the initial 6-hour transfection period described above, the medium was replaced with the respective normal or high-glucose complete medium, and the cells were incubated for an additional 48 hours. Subsequently, total cellular protein was extracted and subjected to Western blot analysis to evaluate the expression levels of PANoptosis-related marker proteins (NLRP3, cleaved caspase-8, and p-MLKL/MLKL), as detailed in Validation of NLRP3, Cleaved Caspase-8, p-MLKL/MLKL and PANoptosis-Related Genes and Hub Genes by Western Blot.
Statistical Analysis
All statistical analyses were performed using R software (version 4.3.2) and GraphPad Prism (version 9.5.0). Data that followed a normal distribution are presented as the means ± SEM. Differences in PANoptosis scores between groups were assessed using the Wilcoxon rank-sum test. Comparison of two sets of normally distributed data was performed using the t-test. Multiple group comparisons were conducted via one-way ANOVA with either Tukey’s or Dunnett’s post hoc tests to determine significant differences between groups. P < 0.05 was considered to indicate a statistically significant difference. Each experiment was performed in triplicate. Statistical significance was defined as P < 0.05.
Results
Differential Analysis of the Bulk Transcriptome Datasets
We performed differential expression analysis on the GSE60436 (PDR vs Control) and GSE102485 (DR vs Control) datasets using the limma and DESeq2 packages. A uniform significance threshold was set at FDR < 0.05 and |log_2FC| > 1.5. Analysis of GSE60436 identified 1163 DEGs (419 upregulated, 744 downregulated) (Figure 1A and B), while GSE102485 yielded 5310 DEGs (3741 upregulated, 1569 downregulated) (Figure 1C and D). Intersecting these sets with the rat PANoptosis-associated gene set identified 27 shared genes, designated as DE-PRGs (Figure 1E). Subsequent functional enrichment revealed these genes are significantly involved in cytokine sensing, TNF signaling, PCD, and p53 signaling (Figure 1F). Crucially, the enrichment in the “AGE-RAGE signaling pathway in diabetic complications”, alongside core inflammatory and cell death cascades, demonstrates a direct mechanistic link to DR progression, as these pathways actively drive the chronic retinal neuroinflammation and vascular damage underlying the disease.
 |
Figure 1 Identification and functional enrichment of differentially expressed PANoptosis-related genes (DE-PRGs). (A) Volcano plot of differentially expressed genes (DEGs) in the GSE60436 dataset (PDR vs Control). (B) Heatmap demonstrating the expression patterns of DEGs in the GSE60436 dataset. (C) Volcano plot of DEGs in the GSE102485 dataset (DR vs Control). (D) Heatmap demonstrating the expression patterns of DEGs in the GSE102485 dataset. (E) Venn diagram showing the intersection of DEGs from the GSE60436 dataset, the GSE102485 dataset, and the curated PANoptosome gene set. The intersection of all three sets yielded 27 DE-PRGs. (F) Bubble plot of KEGG pathway enrichment analysis for the 27 DE-PRGs. The size of each bubble represents the number of genes (“Count”), and the color represents the statistical significance (adjusted P-value). |
Single-Cell Dimensionality Reduction Clustering Analysis
Following dimensionality reduction and unsupervised clustering of the GSE209872 dataset, we manually annotated nine retinal cell subtypes: rod cells (Rod), Müller glial cells (Müller), bipolar cells (BC), amacrine cells (AC), endothelial cells (Endothelial), pericytes (Pericyte), microglia, cone, and cholinergic acuity cells (ACHC) (Figure 2A). The spatial distribution and expression patterns of canonical marker genes are shown in Figure 2B and D. Cell proportion analysis (Figure 2C and E) revealed significantly reduced proportions of Rods and Microglia, alongside increased proportions of Müller, Endothelial, AC, and BC cells in the DR group. Biologically, this shift reflects the pathological remodeling of the retina, where the decline in Rods indicates early neuronal loss and the increased Müller glia proportion suggests reactive gliosis, a compensatory but dysfunctional response to chronic metabolic stress that precedes cell death.
 |
Figure 2 Single-cell clustering, annotation, and compositional analysis of retinal cell subtypes. (A) UMAP visualization of all identified retinal cell clusters. (B) UMAP plots showing the distribution of cell clusters split by group (DR vs WT). (C) Stacked bar chart illustrating the overall percentage of major cell types in the DR and WT groups. (D) Bubble plot showing the expression of canonical marker genes (x-axis) across each cell subtype (y-axis). Bubble size indicates the fraction of cells expressing the gene, and color intensity represents the mean expression level. (E) Grouped bar chart comparing the specific proportion of each cell type between the DR and WT groups. |
Effects of DE-PRGs on DR Single-Cell
To analyze the expression patterns of DE-PRGs across major retinal cell subtypes, we first employed the ssGSEA algorithm to compute a “PANoptosis score” for each cell based on the 27 identified DE-PRGs. We then visualized the distribution of these scores in UMAP space (Figure 3A). The results demonstrated that AC and ACHC cells exhibited significantly lower PANoptosis scores compared to other cell populations (Figure 3B). Subsequent differential scoring analysis revealed significantly elevated PANoptosis activity in Müller, Rod, Cone, BC, AC, Endothelial, Microglia, and ACHC cells in the DR group (Figure 3C). We then stratified cells into “PANoptosis-high” and “PANoptosis-low” groups using the median score as the threshold and visualized their distribution on UMAP plots (Figure 3D and E). Proportional analysis further revealed a significant increase in the proportion of PANoptosis-high subpopulations among Müller, AC, and BC cells in the DR group (Figure 3F–H). Combining the proportion of each cell type in the disease and control groups, Müller, Endothelial, AC, and BC cells showed an overall increase in the DR group, concurrent with an elevation in their PANoptosis-high subpopulations. The collective upward trend in both the abundance and PANoptosis activity suggests that Müller cells play a pivotal role in DR. This elevated score likely reflects a synergistic activation of programmed cell death pathways in response to the diabetic microenvironment, a finding that prompted our subsequent focus on Müller cell-specific mechanisms.
Figure 3 Analysis of PANoptosis score distribution and activity in retinal cell subtypes. (A) UMAP visualization of the PANoptosis score distribution across all cells. The color scale indicates the score intensity. (B) Violin plots showing the distribution of PANoptosis scores for each identified cell subtype. (C) Bar charts comparing the mean PANoptosis score for each cell type between the DR and WT groups. Significance levels are indicated above the bars (ns represents no significant difference; ****P < 0.0001). (D) UMAP plot showing the stratification of all cells into PANoptosis-high and PANoptosis-low groups based on the median score. (E) UMAP plots showing the original cell type composition, split into the PANoptosis-high (left) and PANoptosis-low (right) PANoptosis groups. (F–H) Stacked bar charts illustrating the proportional shift of cells into PANoptosis-high and PANoptosis-low states (between the DR and WT groups) for Müller cells, Bipolar cells (BC), and Amacrine cells (AC), respectively. Figure 3 Continued.

Membrane Protein-Mediated Intercellular Communication Associated with PANoptosis
We employed the CellChat package to predict communication patterns between PANoptosis-high and PANoptosis-low groups. Analysis of communication quantity and intensity (Figure 4A) demonstrated that the PANoptosis-high group exhibited significantly greater overall communication volume and signal strength. The communication heatmap (Figure 4B) further indicated that this differential communication was particularly pronounced between Müller cells and AC cells.
Figure 4 Membrane protein-mediated intercellular communication associated with PANoptosis. (A) Comparison of the total number (left) and overall interaction strength (right) of inferred cellular communications between the PANoptosis-high and PANoptosis-low score groups. (B) Heatmap showing the differential number of interactions (left) and differential interaction strength (right) across cell types. Red indicates stronger or more numerous interactions in the PANoptosis-high group; blue indicates stronger or more numerous interactions in the PANoptosis-low group. (C and D) Heatmaps illustrating the incoming and outgoing signaling patterns, respectively, for specific pathways (y-axis) across different cell types (x-axis) in the PANoptosis-high (left) and PANoptosis-low (right) groups. (E) Dot plot illustrating the differential expression of specific ligand-receptor (L-R) pairs in Müller cells between the PANoptosis-high and PANoptosis-low groups. Color scale indicates P-value. (F) Dot plot showing the differential expression of specific L-R pairs in AC cells between the groups. Color scale indicates P-value. (G) Violin plots showing the expression levels of Psap and Gpr37 across all identified cell types. (H) Scatter plots illustrating the expression of Gpr37 along a pseudo-time trajectory, indicating its relationship with cell differentiation. (I) Chord diagrams visualizing the PSAP signaling pathway network interactions among different cell types in the PANoptosis-high (left) and PANoptosis-low (right) groups. The thickness of the connecting lines indicates the strength of the intercellular communication. Figure 4 Continued.

To decipher these interaction networks, we systematically analyzed signal transduction patterns to identify the primary senders, receivers, and signaling pathways involved. Analysis of outgoing and incoming signal contributions revealed that the PTN (incoming), MK (incoming), VEGF (outgoing), and PSAP (outgoing) pathways significantly influenced the PANoptosis-high cell group (Figure 4C and D). Subsequently, we identified significant differential ligand-receptor pairs between the PANoptosis-high and PANoptosis-low groups for Müller and AC cells (Figure 4E and F). Molecular pairs associated with these pathways, including PSAP–GPR37, VEGFA–VEGFR1, VEGFA–VEGFR2, and PTN–NCL, constituted the primary differential interactions. Database searches confirmed that GPR37 encodes a membrane protein, and the PSAP–GPR37 pair showed high specific expression in Müller cells (Figure 4G). Cell differentiation trajectory analysis (Figure 4H) revealed that GPR37 expression increased during late-stage differentiation, suggesting that Müller cells may mediate PANoptosis via the GPR37 membrane protein.
Furthermore, we found that the top 10 most significant DEGs within the Müller2 subpopulation showed a statistically significant correlation with the PANoptosis score (Figure 5H). Finally, a protein-protein interaction (PPI) network for Müller2 marker genes was constructed using the STRING database (confidence threshold = 0.7), comprising 268 nodes and 341 interaction edges (Figure 5I), highlighting the complex molecular interplay within this subpopulation.
Figure 5 Heterogeneity and functional characterization of Müller cell subpopulations. (A) UMAP visualization of Müller cell subpopulation heterogeneity, identifying three distinct clusters (Müller1, Müller2, Müller3). (B) Bubble plot showing expression levels and percentage of marker genes identifying the three Müller cell subpopulations. (C) Dot plot comparing the average expression and detection rate of Psap and Gpr37 across the three Müller subpopulations. (D) Stacked bar chart showing the relative proportions of the three Müller subpopulations within the PANoptosis-high and PANoptosis-low score groups. (E) Bar charts comparing the proportion of Müller subpopulations originating from DR versus WT samples, stratified by PANoptosis-high and PANoptosis-low score groups. (F) GOBP enrichment analysis for Müller2 characteristic genes, highlighting pathways related to cellular PANoptosis. (G) KEGG pathway enrichment analysis for characteristic genes from all three Müller subpopulations. (H) Correlation matrix (heatmap) illustrating the relationship between the top 10 characteristic genes of the Müller2 subpopulation and the PANoptosis score (*P < 0.05, **P < 0.01, ***P < 0.001). (I) PPI network constructed from the characteristic genes of the Müller2 subpopulation. Figure 5 Continued.

Furthermore, visualization of the PSAP signaling pathway (Figure 4I) confirmed its high activity in Müller cells. This pathway is a known regulator of cell proliferation, differentiation, and apoptosis. Collectively, these findings suggest that Müller cells serve as pivotal mediators of membrane protein-dependent signaling, playing a crucial role in regulating PANoptosis in DR. At the cellular level, the PSAP-GPR37 axis reveals a specific autocrine and paracrine mechanism by which Müller cells propagate PANoptotic stress signals, exacerbating localized retinal damage. Consequently, these findings identify the PSAP–GPR37 and VEGF and PTN pathways as potential therapeutic targets to disrupt the pathological feed-forward loops of neurovascular impairment in DR.
Heterogeneity and Functional Characterization of Müller Cell Subpopulations
To investigate Müller cell heterogeneity, we performed dimensionality reduction and unsupervised clustering on the previously identified Müller cell population. Using an optimal clustering resolution of 0.2, we identified three distinct subpopulations: Müller1, Müller2, and Müller3 (Figure 5A). We then employed the FindAllMarkers function (parameters: min.pct = 0.2, only.pos = TRUE, logfc.threshold = 0.5) to determine DEGs for each subpopulation.
Müller1 was characterized by high expression of Vstm2b, Isl1, Qpct, Tmem196, Pcp2, and Prdm8. In contrast, Müller2 exhibited heightened expression of Tlr3, Tmem100, Ano1, Rassf9, Psap, and Gpr37, while Müller3 was marked by March10, Tfap2c, Slc16a8, and Gcnt1 (Figure 5B). Notably, the Psap–Gpr37 membrane protein pair was specifically enriched in the Müller2 subpopulation (Figure 5C). Cell proportion analysis (Figure 5D and E) indicated that Müller2 cells were elevated in the PANoptosis-high group, while Müller1 proportions increased in the PANoptosis-low group. All three subpopulations were elevated in the DR group compared to controls.
Gene Ontology Biological Process (GOBP) enrichment analysis (Figure 5F) revealed that the Müller2 DEGs were significantly enriched in biological processes related to apoptosis regulation. The primary categories included: regulation of apoptosis signaling pathways; regulation of neutrophil apoptosis; positive regulation of endothelial cell apoptosis; apoptosis involved in morphogenesis; negative regulation of endothelial cell apoptosis; regulation of T cell apoptosis; apoptotic cell clearance; T cell apoptosis; negative regulation of leukocyte apoptosis; and positive regulation of the extrinsic apoptosis pathway.
KEGG enrichment analysis (Figure 5G) indicated that the Müller1 subpopulation was significantly enriched in pathways including dopaminergic synapse, PI3K-Akt signaling, circadian rhythm, retrograde endocannabinoid signaling, MAPK signaling, and GABAergic synapse. The Müller2 subpopulation was predominantly enriched in pathways associated with leukocyte transendothelial migration, human T-cell leukemia virus 1 infection, TNF signaling, apoptosis, IL-17 signaling, and ferroptosis. In contrast, the Müller3 subpopulation exhibited significant enrichment in pathways involving cardiac muscle contraction, mineral absorption, and porphyrin metabolism.
In addition, we selected the top 10 most significant DEGs (identified by FindAllMarkers) within the Müller2 subpopulation for further analysis. We then examined the correlation of these genes with the PANoptosis score. These top 10 genes showed a statistically significant correlation with the PANoptosis score (Figure 5H). Furthermore, the PPI network constructed for Müller2 marker genes using the STRING database (confidence threshold = 0.7) comprised 268 nodes and 341 interaction edges (Figure 5I).
Potential Gene Drugs Targeting Key Subtypes of Membrane Protein-Mediated PANoptosis
We employed the ssGSEA method to assign a score to each sample in the bulk cohort based on the Müller2 subpopulation-specific gene set. Subsequent analysis revealed significantly higher Müller2 subpopulation scores in the DR group compared to the control group (Figure 6A). Samples were then stratified into high- and low-score groups using the median score as the cutoff. We then performed differential expression analysis between these two groups using DESeq2. This analysis identified 1116 DEGs, comprising 100 upregulated and 1016 downregulated genes. To visualize the overall distribution of these DEGs, we generated a volcano plot using the ggplot2 package (version 3.5.0) (Figure 6B). Furthermore, we generated a heatmap using the ComplexHeatmap package (version 2.18.0) to visualize the expression patterns of these DEGs (Figure 6C).
 |
Figure 6 Identification of key genes in the Müller2 subpopulation and potential therapeutic targets. (A) Box plot comparing the Müller2 subpopulation scores between the DR and Control groups in the bulk cohort (Wilcoxon, P = 0.0061). (B) Volcano plot showing DEGs between the high- and low-score groups based on the Müller2 subpopulation signature in the bulk cohort. (C) Heatmap illustrating the expression patterns of the identified DEGs across the high- and low-score groups. (D) PPI network constructed from the identified DEGs. (E) Bar chart displaying the top 10 hub genes from the PPI network, ranked by degree of connectivity. (F) Sankey diagram illustrating potential drugs (left) predicted to target the identified hub genes (right). |
Subsequently, we constructed a PPI network for these DEGs using the STRING database (confidence threshold = 0.7) (Figure 6D). Hub genes are defined as those that play pivotal roles within the network. We identified the top 10 hub genes by employing the degree metric, a measure of connectivity (Figure 6E). Among these, DLG4 exhibited the highest degree, followed by SNAP25, suggesting these 10 hub genes play pivotal roles in the network.
To explore the therapeutic potential of these hub genes, we utilized the DGIDB database to predict potential drug-gene interactions. We generated a Sankey diagram using ggplot2 to illustrate these gene-drug relationships (Figure 6F). This analysis associated the 10 hub genes with 26 potential drugs. For instance, CD4 was associated with two drugs (anti-thymocyte globulin and ibalizumab), while GRIN2A was associated with the highest number of potential drugs. Consequently, the identification of these hub genes and their associated pharmacological networks highlights their potential as actionable therapeutic targets, offering a theoretical basis for repurposing existing drugs or developing novel interventions to mitigate PANoptosis-driven retinal injury in DR.
Analysis of Immune Infiltration and Hub Gene Correlation
In the bulk transcriptome cohort, we performed immune cell infiltration analysis using the CIBERSORT algorithm to quantify the proportions of 22 immune cell types. Subsequent differential analysis of these proportions (Figure 7A) revealed significant variations in the infiltration levels of naïve B cells, activated CD4 memory T cells, gamma delta T cells, M1 macrophages, and neutrophils between the DR and control groups (Figure 7B). Furthermore, a correlation analysis between the hub genes and these immune cells (Figure 7C and D) indicated that most hub genes (eg, SYT1, SNAP25, GRIN2A, FN1) were positively correlated with various immune cell types. In contrast, RAB3A exhibited a strong negative correlation with resting CD4+ memory T cells.
 |
Figure 7 Analysis of immune cell infiltration and its correlation with hub genes. (A) Stacked bar plot showing the relative proportions of 22 immune cell types in each sample from the bulk cohort, grouped by Control and DR. (B) Violin plots comparing the percentages of each immune cell type between the DR and Control groups (ns represents no significant difference; *P < 0.05; **P < 0.01; ***P < 0.001). (C) Correlation matrix (heatmap) illustrating the correlation between the expression of 10 hub genes (y-axis) and the infiltration levels of various immune cell types (x-axis). Red indicates positive correlation; blue indicates negative correlation (*P < 0.05; **P < 0.01; ***P < 0.001). (D) Network diagram visualizing the significant correlations between hub genes (blue circles) and specific immune cell types (red squares). |
Validation of NLRP3, Cleaved Caspase-8, p-MLKL/MLKL and PANoptosis-Related Genes and Hub Genes in DR Rat Retinal Tissue
To confirm the establishment of early-stage diabetic retinopathy (DR), H&E staining was performed at 12 weeks post-induction (Figure 8A). Compared to the well-organized and compact retinal structure in the control group, retinas from the DR group exhibited evident morphological disruption. Specifically, we observed an overall thinning of the retina and a more sparse, disorganized cellular arrangement. Additionally, there was a noticeable reduction in overall cell density compared to the normal retinas. Together with sustained hyperglycemia, these general histological changes verify the successful induction of early-stage DR pathology in our rat model prior to subsequent analyses.
 |
Figure 8 Validation of PANoptosis-related genes and hub genes in DR rat retinal tissue. (A) Representative H&E-stained sections from the Control (left) and DR (right) groups at 12 weeks post-induction. The Ctrl group displays a normal, well-organized, and compact retinal structure. In contrast, the DR group exhibits evident morphological degeneration, characterized by overall retinal thinning and a sparse, disorganized cellular arrangement. Scale bar = 50 μm. (B) qRT-PCR analysis of the relative mRNA expression of key PANoptosis-related genes DLG4, FN1, EMP3, PDGFR1, and PSAP in retinal tissues from Control (Ctrl) and DR rats. (C) Western blot analysis and quantification of protein levels for PANoptosis-related markers (NLRP3, Cleaved Caspase-8, p-MLKL/MLKL) and key genes (PSD95, Fibronectin, PDGFRβ, and PSAP) in retinal tissues from Ctrl and DR groups. Transcript and protein expression levels were normalized to β-actin. Statistical significance was determined using a t-test. *P < 0.05, **P < 0.01, ***P < 0.001, ****P < 0.0001. |
To examine the mRNA levels of key PANoptosis-related genes, we extracted total retinal RNA from rats in the Ctrl and DR groups. We then validated the expression of key identified genes (DLG4, FN1, EMP3, PDGFR1, and PSAP) in these retinal tissues using qRT-PCR (Figure 8B). DLG4 expression was significantly downregulated in the DR group compared to the Ctrl group. Meanwhile, the expression of FN1, EMP3, PDGFR1, and PSAP was significantly upregulated in the DR group, consistent with our bioinformatics analysis.
Western blot analysis revealed that the protein expression of PANoptosis markers—including NLRP3, cleaved caspase-8, and the p-MLKL/MLKL ratio—was significantly elevated in the DR group (Figure 8C). This result strongly suggests the concurrent activation of PANoptotic marker cascades during DR pathogenesis. Furthermore, PSD95 (encoded by DLG4) protein expression was markedly downregulated, while Fibronectin, PDGFRβ, and PSAP protein levels were significantly upregulated, consistent with our qRT-PCR results.
Integrated Analysis of High Glucose-Induced Müller Cell PANoptosis and PANoptosis-Related Genes and Hub Genes Expression
High Glucose Induces Cytotoxicity and Oxidative Stress in RMC-1 Cells
To establish an in vitro model of diabetic retinopathy (DR), we first assessed the cytotoxic effects of high glucose on RMC-1 cells. As illustrated in Figure 9A, the CCK-8 cell viability assay revealed a significant decline in RMC-1 viability in the HG 48h group compared to the NG group. Conversely, no statistically significant difference in cell viability was observed between the NG and MA groups. Consistent with these findings, flow cytometry analysis demonstrated a significant augmentation in ROS content in the HG 48h group compared to the NG group (Figure 9B). These results confirm that high glucose induces cell damage and oxidative stress in RMC-1 cells.
Figure 9 High glucose induces PANoptosis and modulates PANoptosis-related gene expression in RMC-1 cells. (A) Bar chart showing Müller cell viability in Normal Glucose (NG), Mannitol (MA), and High Glucose 48h (HG 48h) groups. (B) Flow cytometry histograms (left) and quantification (right) of ROS levels in Müller cells. (C) Representative flow cytometric plots of Annexin V-FITC/PI staining (left) and the corresponding percentage of apoptotic cells (right). (D) Assessment of lytic cell death by measuring lactate dehydrogenase (LDH) activity in the culture medium. (E) Representative immunofluorescence images of PI (red) and Hoechst 33342 (blue) co-staining (left) and the statistical quantification of PI-positive cells (right). Scale bars = 100 μm. (F) Western blot analysis (bottom) and densitometric quantification (top) of PANoptosis-related markers, including NLRP3, Cleaved Caspase-8, and the p-MLKL/MLKL ratio. (G) qRT-PCR analysis of the relative mRNA expression levels of identified key PANoptosis-related genes (DLG4, FN1, EMP3, PDGFR1, and PSAP). (H) Western blot validation of the protein expression levels of PSD95, Fibronectin, PDGFRβ, and PSAP. mRNA and protein levels were normalized to β-actin. A t-test was used for two-group comparisons, and one-way ANOVA with Student-Newman-Keuls post-hoc test was used for multi-group comparisons. ns represents no significant difference; *P < 0.05; **P < 0.01; ***P < 0.001; ****P < 0.0001. Figure 9 Continued.

High Glucose Induces PANoptosis via Concurrent Activation of Apoptosis, Pyroptosis, and Necroptosis
To further verify the occurrence of PANoptosis, this study employed multimodal cell death assays. Flow cytometric analysis using Annexin V-FITC/PI double staining revealed that the HG 48h group exhibited a significant increase in the proportion of both early and late apoptotic cells, concomitant with a marked reduction in the viable cell population, compared with the NG group (Figure 9C). Given that both necroptosis and pyroptosis culminate in plasma membrane pore formation, cellular rupture, and the consequent efflux of lactate dehydrogenase (LDH) into the extracellular milieu, LDH activity in culture supernatants was employed as a surrogate indicator for quantifying these lytic cell death modalities. The LDH release assay demonstrated significantly elevated LDH activity in the HG 48h group relative to the NG group (Figure 9D). Furthermore, PI/Hoechst double staining confirmed a marked increase in the proportion of dead cells in the HG 48h group compared with the NG group (Figure 9E). Finally, Western blot analysis demonstrated that the protein expression of key PANoptosis markers (NLRP3, cleaved caspase-8, and the p-MLKL/MLKL ratio) was significantly elevated in the HG 24h and HG 48h groups compared to the MA group. These markers are canonically associated with pyroptosis, apoptosis, and necroptosis, respectively (Figure 9F). Overall, these findings provide comprehensive phenotypic and molecular evidence suggesting the activation of PANoptosis in RMC-1 cells under a high-glucose environment.
Differential Expression of PANoptosis-Related Genes and Hub Genes
To investigate the expression of key PRGs, RMC-1 cells were cultured under low and high glucose conditions for 48 hours. qRT-PCR validation showed that the expression of key identified genes was significantly altered in high-glucose-treated RMC-1 cells. DLG4 expression was significantly downregulated in the HG 48h group compared to the NG group, whereas the expression levels of FN1, EMP3, PDGFR1, and PSAP were significantly upregulated (Figure 9G). These results were consistent with our bioinformatics analysis. Western blot confirmed these changes at the protein level: PSD95 protein expression was significantly downregulated, while the protein levels of Fibronectin, PDGFRβ, and PSAP were significantly upregulated (Figure 9H). The mRNA-protein concordance validates these key genes as potential mediators of high glucose-induced Müller cell injury.
Knockdown of PSAP Attenuates High Glucose-Induced PANoptosis in RMC-1 Cells
Validation of PSAP Knockdown Efficiency in RMC-1 Cells
To investigate the biological function of PSAP, we transiently transfected RMC-1 cells with three different PSAP-specific siRNAs (si-PSAP-1, si-PSAP-2, and si-PSAP-3) or a negative control (si-NC). Following 48 hours of transfection, the knockdown efficacy was evaluated at both the transcriptional and translational levels. As shown in Figure 10A, qRT-PCR analysis revealed that all three si-PSAP sequences significantly decreased Psap mRNA expression compared to the si-NC group. However, Western blot analysis demonstrated that only si-PSAP-1 successfully and significantly reduced PSAP protein expression, whereas si-PSAP-2 and si-PSAP-3 did not exhibit a statistically significant reduction at the translational level (Figure 10B). Consequently, si-PSAP-1 demonstrated the most robust and consistent knockdown efficiency and was selected for all subsequent functional experiments.
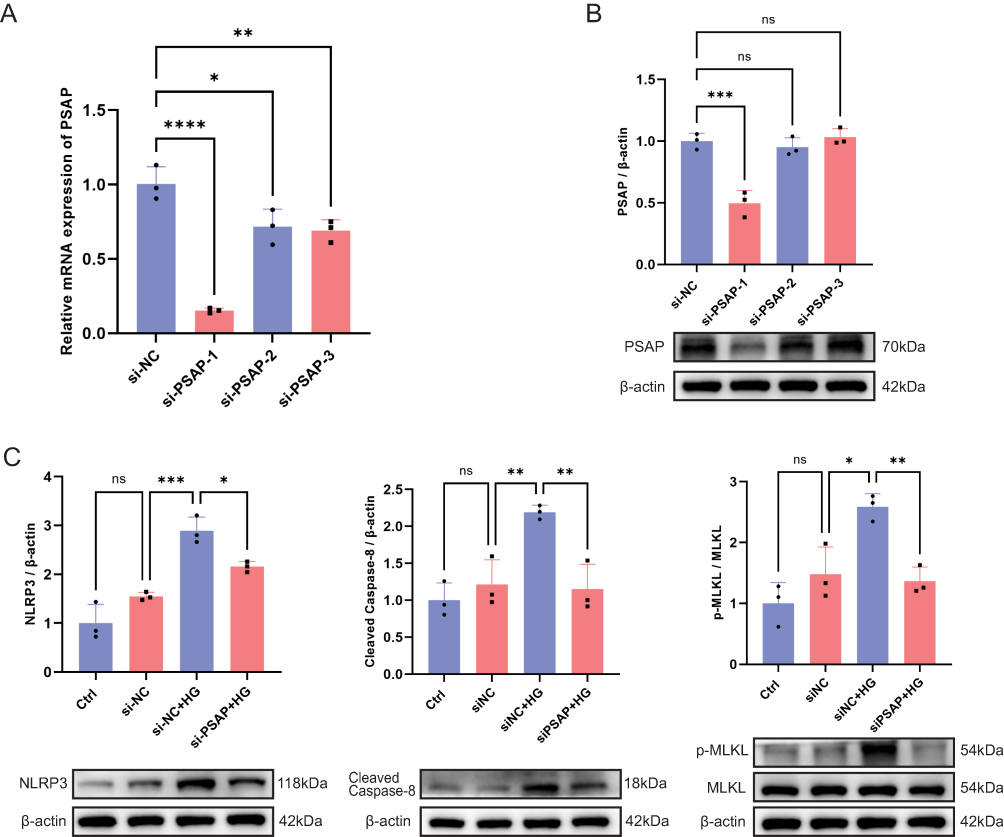 |
Figure 10 Knockdown of PSAP attenuates high glucose-induced PANoptosis in RMC-1 cells. (A) qRT-PCR analysis of relative PSAP mRNA expression in RMC-1 cells transfected with negative control siRNA (si-NC) or three different PSAP-specific siRNAs (si-PSAP-1, si-PSAP-2, and si-PSAP-3). (B) Representative Western blot images (bottom) and densitometric quantification (top) of PSAP protein levels in the corresponding transfection groups. (C) Representative Western blot images (bottom) and densitometric quantification (top) of PANoptosis-related marker proteins, including NLRP3, Cleaved Caspase-8, and the p-MLKL/MLKL ratio, in RMC-1 cells across four experimental groups: Ctrl (normal glucose), si-NC, si-NC+HG (high glucose), and si-PSAP+HG. mRNA and protein levels were normalized to β-actin. One-way ANOVA with Student-Newman-Keuls post-hoc test was used for multi-group comparisons. ns represents no significant difference; *P < 0.05; **P < 0.01; ***P < 0.001; ****P < 0.0001. |
PSAP Knockdown Attenuates High Glucose-Induced PANoptosis
To determine whether PSAP is involved in high glucose-induced PANoptosis, we assessed the expression levels of key PANoptosis-related proteins (NLRP3, cleaved caspase-8, and the p-MLKL/MLKL ratio) via Western blot analysis using the validated si-PSAP-1 sequence. No significant differences in baseline protein expression were observed between the Ctrl and si-NC groups (Figure 10C). However, exposure to high glucose (si-NC + HG group) triggered a marked upregulation of NLRP3, cleaved caspase-8, and the p-MLKL/MLKL ratio compared to the si-NC group, suggesting the successful induction of PANoptotic marker expression under high-glucose stress. Importantly, the siRNA-mediated knockdown of PSAP significantly reversed these high glucose-induced molecular alterations. The elevated levels of NLRP3, cleaved caspase-8, and the p-MLKL/MLKL ratio were markedly suppressed in the si-PSAP + HG group relative to the si-NC + HG group (Figure 10C). Taken together, these findings provide compelling evidence that silencing PSAP effectively mitigates high glucose-induced PANoptosis marker expression in RMC-1 cells.
Discussion
DR is a serious complication of diabetes mellitus, which is currently observed in approximately 30% of diabetic patients and constitutes a major public health challenge.21–23 PANoptosis, a recently discovered pro-inflammatory PCD that integrates features of both pyroptosis and apoptosis, has been shown to play a significant role in various biological processes, such as organismal development and the immune response.24 This novel cell death modality has garnered attention for its critical role in inflammatory responses and cellular homeostasis.25
Currently, research on the role of PANoptosis in DR progression remains limited. A study by Xu et al was the first to report the potential significance of PANoptosis in DR.18 Their study found that intravitreal DKK1 injection not only significantly improved retinal physiological function but also helped restore its normal structure. Subsequent mechanistic studies suggested this protective effect was associated with the regulation of PANoptosis in retinal tissues, as evidenced by inhibited cleavage of GSDMD, Caspase-3, and RIPK3. This finding provides preliminary evidence linking PANoptosis to the pathological process of DR, thereby expanding our understanding of this cell death modality’s functional role in the disease. The present study aims to further elucidate membrane protein-mediated PANoptosis in key cell populations and to screen for core regulators with cell-type-targeting potential. The primary objective is to provide new targets and a theoretical basis for the precise intervention and treatment of DR.
In this study, we identified 1163 and 5310 DEGs from the GSE60436 and GSE102485 datasets, respectively. From these DEGs, we screened 27 intersecting genes relevant to PANoptosis in rats. Functional enrichment analysis showed these genes were involved in cytokine sensing, the TNF signaling pathway, the p53 pathway, and various programmed death pathways, suggesting that PANoptosis may function as a key hub in the DR inflammatory network. Despite sharing molecular characteristics with apoptosis, pyroptosis, and necroptosis, the precise mechanisms underlying PANoptosis remain incompletely understood, as the death phenotype cannot be fully explained by any single pathway.11 This pathway integrates molecular interactions among multiple cell death modalities, which are synergistically regulated by the PANoptosome, ultimately triggering significant pro-inflammatory cell death.10 Notably, both pyroptosis and necroptosis are considered pro-inflammatory modes of cell death,26 whereas apoptosis is generally regarded as a non-inflammatory process involving the hydrolytic activation of proteases. Collectively, these findings imply that PANoptosis may play a pivotal role in modulating inflammatory and immune responses in DR.
This study utilized the GSE209872 single-cell dataset to identify nine retinal cell subpopulations. The results indicated that the proportions of Müller, endothelial, AC, and BC cells were elevated in DR. Furthermore, calculation of PANoptosis scores (using the 27 DE-PRGs) demonstrated enhanced PANoptosis activity in these cell types, as well as in Rod, Cone, Microglia, and ACHC populations. Additionally, the proportions of PANoptosis-high subpopulations within the Müller, AC, and BC cell populations were significantly increased. Furthermore, cellular communication and subpopulation analyses indicated that the membrane protein-ligand pair Psap-Gpr37 was highly and specifically expressed in the Müller2 subpopulation. In addition, DEGs in the Müller2 subpopulation were significantly enriched for biological processes related to apoptosis regulation. Notably, the top 10 of these DEGs showed a significant association with PANoptosis scores. These results suggest that Müller cells may act as key mediators of membrane protein-dependent signaling and play a dominant role in regulating PANoptosis in DR.
Retinal neuronal degeneration is a core pathological change in DR. Müller cells, the primary glial cells of the retina, provide critical protective and supportive functions for retinal neurons. These cells exert a protective role by maintaining extracellular environmental homeostasis, participating in the blood-retinal barrier, and supporting neuronal development;27,28 furthermore, under oxidative stress, they activate antioxidant enzyme systems to scavenge free radicals, thereby neutralizing ROS to prevent neuronal damage.29 However, chronic hyperglycemia induces Müller cell dysfunction, mitochondrial damage, and increased oxidative stress. This cascade leads to edema, hypoxic damage, inflammation, and diminished antioxidant capacity in Müller cells, ultimately culminating in apoptosis.18,28 Chronic hyperglycemia in DR, by inducing oxidative stress and inflammatory cytokine production, may in turn activate the PANoptosis pathway.9,30 Consistent with this, the present study revealed a substantial augmentation in ROS content within Müller cells exposed to high-glucose conditions compared to a normal-glucose control group. Mechanistically, we propose that the elevated PANoptosis scores observed in our bioinformatic analysis stem from the unique role of Müller cells as metabolic “gatekeepers” of the retina. Their constant involvement in nutrient and byproduct exchange makes them hypersensitive to chronic hyperglycemia, where the subsequent accumulation of ROS and pro-inflammatory cytokines triggers the synergistic activation of the PANoptosome—integrating apoptotic, pyroptotic, and necroptotic cascades. Crucially, our comprehensive in vitro assays—including flow cytometric Annexin V/PI staining, LDH release measurements, and PI/Hoechst morphological assessments—explicitly confirmed that high glucose exposure induces widespread cell death characterized by the concurrent activation of apoptosis, pyroptosis, and necroptosis. This observation provides robust evidence for a heightened potential for PANoptosis activation in Müller cells. This study, therefore, hypothesizes that PANoptosis plays a key regulatory role in Müller cell dysfunction. A more in-depth understanding of this mechanism could provide new avenues for targeted DR therapies.
The development of DR is primarily driven by two key factors: chronic inflammation and dysregulated immune cell homeostasis. In the present study, we investigated immune infiltration in the bulk cohort using the CIBERSORT algorithm. The analysis revealed significant differences in the infiltration levels of naïve B cells, activated CD4 memory T cells, gamma delta T cells, M1 macrophages, and neutrophils between the disease and control groups. Hub genes were then further screened based on their characterization of the Müller2 subpopulation. Finally, we predicted potential target drugs for these hub genes using the DGIDB database. The hub genes were found to be significantly correlated (both positively and negatively) with the infiltration levels of multiple immune cell types. This finding suggests that the hub genes may be involved in the chronic inflammatory process of DR by modulating the immune microenvironment. Notably, Müller cells have been identified as a suitable therapeutic target in various retinal diseases, including retinitis pigmentosa and age-related macular degeneration. This suitability stems from their capacity to withstand pathological stimuli and maintain survival, rendering them targetable even in advanced stages of retinal degeneration.31 Combined with our results, we hypothesize that these identified hub genes are involved in the chronic inflammatory and immune responses during DR development by regulating immune cell infiltration dynamics. These findings reveal the potential of hub genes as novel therapeutic targets for DR and provide a theoretical basis and candidate targets for developing precise intervention strategies against retinal degeneration.
The present study integrated bioinformatics analysis with in vivo and in vitro experimental validation to confirm the expression of key PANoptosis markers and related genes in DR. Our experimental findings demonstrated that the expression levels of PANoptosis marker proteins—including NLRP3, cleaved caspase-8, and the p-MLKL/MLKL ratio—were significantly increased in both the DR animal model and high-glucose-treated RMC-1 cells. Concurrently, DLG4 expression was downregulated among the PRGs. In contrast, the expression of FN1, EMP3, PDGFRβ, and PSAP was significantly increased. These observations suggest that the activation of PANoptosis in Müller cells may play a pivotal role in DR progression.
Regarding molecular function, the DLG4 gene encodes postsynaptic density protein 95 (PSD95), a pivotal scaffolding protein at excitatory synapses. This protein plays a critical role in clustering and modulating glutamate receptors, which is vital for maintaining synaptic stability and neuroplasticity in retinal ganglion cells. It is also essential for neuronal survival and functional integrity.32,33 Previous research found that DLG4/PSD95 levels were reduced at both the transcriptional and protein levels in DR mouse retinas.33,34 Fibronectin (FN1), a ubiquitous extracellular matrix glycoprotein, plays a pivotal role in numerous physiopathological processes, including embryonic development, wound healing, hemostasis, and thrombosis.35 It is a key factor in regulating angiogenic activity through its interaction with vascular endothelial growth factor (VEGF).36 In DR, FN1 upregulation may be closely associated with hypoxia-induced endothelial cell responses and the activation of related signaling pathways, such as those governing proliferation, apoptosis, and angiogenesis.37,38 Epithelial membrane protein 3 (EMP3), a widely expressed quadruple transmembrane protein, is involved in regulating important signaling pathways (eg, HER-2/PI3K/Akt, MAPK/ERK, and TGF-β/Smad) and has been associated with cellular processes such as cell-cycle progression, proliferation, and apoptosis.39 PDGFRβ is expressed predominantly in perivascular and smooth muscle cells and is involved in angiogenesis, cell migration, matrix deposition, and early gene induction.40,41 The inflammatory microenvironment activates PDGFRβ, whereas its inhibition reportedly alleviates endothelial cell apoptosis and mitochondrial fusion abnormalities caused by the overexpression of DRP-1 (a mitochondrial autophagy-related protein) in DR.41
Given their distinct yet interconnected roles in retinal pathology, these hub genes hold significant promise as therapeutic targets for DR. To maximize therapeutic efficacy while minimizing off-target effects—a common challenge given the multi-pathway nature of PANoptosis—we propose a precision intervention strategy focusing on upstream regulatory “triggers” rather than downstream executors. Unlike broad-spectrum inhibitors of executioner proteins (eg, caspases or MLKL) which may trigger compensatory death pathways, targeting specific membrane protein-ligand units can modulate PANoptotic signaling pathways precisely. Specifically, interventions utilizing small molecule inhibitors or specific neutralizing antibodies against FN1 and PDGFRβ could potentially mitigate retinal fibrosis and pathological neovascularization.42 Similarly, modulating DLG4 and EMP3 expression via targeted gene therapy or pharmacological agents may offer neuroprotective benefits by restoring synaptic homeostasis and dampening glial overactivation.43 The PSAP signaling pathway is involved in regulating key processes such as cell proliferation, differentiation, apoptosis, and intercellular communication. Its receptor, GPR37, forms a functional signaling unit with PSAP; in this unit, PSAP functions extracellularly as a secreted factor and intracellularly as a regulator of lysosomal enzymes.44 To elucidate the specific molecular mechanisms by which PSAP influences DR progression via PANoptosis, we performed siRNA-mediated PSAP knockdown in high-glucose-treated RMC-1 cells. Remarkably, our validation demonstrated that silencing PSAP effectively attenuated the high glucose-induced elevation of core PANoptotic proteins, including NLRP3, cleaved caspase-8, and the p-MLKL/MLKL ratio. This finding links PSAP upregulation to the activation of the PANoptotic marker cascade, suggesting that the PSAP-GPR37 axis is involved in modulating PANoptotic signaling in Müller cells. Consequently, by employing Müller cell-targeted delivery systems, such as AAV vectors equipped with glial-specific promoters (eg, GFAP or RLBP1), we can precisely suppress PANoptosis at its source within dysfunctional macroglia. This cell-type-specific approach localized to the retinal microenvironment ensures that therapeutic concentrations are maintained where needed, thereby sparing healthy neurons and minimizing systemic off-target impacts. Further investigation into the roles of these genes in regulating the retinal cell death and immune microenvironment will provide new directions for understanding DR pathogenesis and developing targeted therapies.
Despite providing a novel perspective on PANoptosis in DR through integrated validation, this study has several limitations. First, the limited sample size and inherent risk of bioinformatic overfitting necessitate validation in larger, multicenter cohorts to enhance robustness. Second, and most critically regarding our mechanistic claims, we must exercise absolute transparency: our current study relies on transcriptomic correlations and functional phenotypic assays, lacking direct biochemical evidence—such as Co-Immunoprecipitation (Co-IP)—to prove the physical assembly of the PANoptosome complex. Therefore, while our in vitro siRNA knockdown experiments demonstrate a strong genetic and functional dependency (wherein silencing PSAP mitigates the elevation of PANoptotic markers), we rigorously avoid overstating this as definitive biochemical causality. The precise physical scaffolding role of the PSAP-GPR37 axis remains a theoretical framework requiring future structural validation. Third, while siRNA knockdown suggested PSAP’s role in vitro, Müller cell-specific in vivo knockout models and phenotypic rescue assays are essential to establish a definitive causal link between glial dysfunction and DR. Such studies will clarify whether Müller cells act as active regulators of the retinal PANoptotic microenvironment rather than merely passive victims of metabolic stress. Fourth, direct validation of these biomarkers in human clinical samples or primary cell models is currently lacking. Future research utilizing human-derived Müller cells, co-culture systems to explore glial-neuronal interactions, or expansive patient cohorts will be crucial to confirm translational potential. Finally, the safety and specificity of the identified therapeutic targets require rigorous evaluation in further preclinical studies to ensure their clinical viability.
Conclusion
Integrating bioinformatics analysis and experimental validation, this study identified and validated the critical role of Müller cells, the membrane protein PSAP, and key hub genes (including DLG4, FN1, EMP3, and PDGFRβ) in PANoptosis during DR progression. Crucially, our findings suggest that the Müller2 subpopulation and the Psap-Gpr37 signaling axis are closely associated with PANoptosis regulation. Furthermore, in vitro assays validated that silencing the membrane protein PSAP effectively mitigates the high glucose-induced elevation of PANoptotic marker proteins, suggesting a functional association without asserting direct physical PANoptosome assembly. These findings suggest that Müller cells could serve as a key cellular target for therapies aimed at PANoptosis in DR. Given that Müller cell dysfunction often precedes clinically detectable microvascular damage, monitoring these identified hub genes could facilitate early clinical diagnosis. Consequently, modulating the PSAP-mediated signaling cascade presents a promising clinical avenue for early intervention, potentially halting DR progression before irreversible retinal degeneration occurs. The present study offers novel insights into the pathogenesis of DR, thereby establishing a theoretical framework for the future exploration of diagnostic biomarkers and therapeutic strategies.
Data Sharing Statement
The original contributions presented in the study are publicly available. This data can be found here: GSE60436, GSE102485 and GSE209872 datasets downloaded from the GEO database; Human Proteome Database.
Ethics Approval and Consent to Participate
This study was conducted in accordance with the principles of the Declaration of Helsinki. Approval was granted by the Ethics Committee of the Affiliated Eye Hospital of Nanchang University (No. YLP20240410).
Acknowledgments
The authors thank GEO for providing the data involved in this study.
Author Contributions
All authors made a significant contribution to the work reported, whether that is in the conception, study design, execution, acquisition of data, analysis and interpretation, or in all these areas; took part in drafting, revising or critically reviewing the article; gave final approval of the version to be published; have agreed on the journal to which the article has been submitted; and agree to be accountable for all aspects of the work.
Funding
This work was supported by grants from the National Natural Science Foundation of China (No. 82260212), the Natural Science Foundation of Jiangxi Province of China (No. 20232ACB206029). The funding organization played no role in the design or execution of this research.
Disclosure
The authors have no conflicts of interest to declare for this work.
References
1. Cheng Y, Fan H, Liu K, Liu J, Zou H, You Z. TFEB attenuates hyperglycemia-induced retinal capillary endothelial cells injury via autophagy regulation. Cell Biol Int. 2023;47(6):1092–29. doi:10.1002/cbin.12002
2. Oh K, Kang HM, Leem D, Lee H, Seo KY, Yoon S. Early detection of diabetic retinopathy based on deep learning and ultra-wide-field fundus images. Sci Rep. 2021;11(1):1897. doi:10.1038/s41598-021-81539-3
3. Rohm TV, Meier DT, Olefsky JM, Donath MY. Inflammation in obesity, diabetes, and related disorders. Immunity. 2022;55(1):31–55. doi:10.1016/j.immuni.2021.12.013
4. Levine SR, Sapieha P, Dutta S, Sun JK, Gardner TW. It is time for a moonshot to find “Cures” for diabetic retinal disease. Prog Retin Eye Res. 2022;90:101051. doi:10.1016/j.preteyeres.2022.101051
5. Tian Y, Zhang F, Qiu Y, et al. Reduction of choroidal neovascularization via cleavable VEGF antibodies conjugated to exosomes derived from regulatory T cells. Nat Biomed Eng. 2021;5(9):968–982. doi:10.1038/s41551-021-00764-3
6. Wong TY, Cheung CM, Larsen M, Sharma S, Simo R. Diabetic retinopathy. Nat Rev Dis Primers. 2016;2:16012. doi:10.1038/nrdp.2016.12
7. Wang N, Wei L, Liu D, et al. Identification and validation of autophagy-related genes in diabetic retinopathy. Front Endocrinol. 2022;13:867600. doi:10.3389/fendo.2022.867600
8. Kinuthia UM, Wolf A, Langmann T. Microglia and inflammatory responses in diabetic retinopathy. Front Immunol. 2020;11:564077. doi:10.3389/fimmu.2020.564077
9. Sun X, Yang Y, Meng X, Li J, Liu X, Liu H. PANoptosis: mechanisms, biology, and role in disease. Immunol Rev. 2024;321(1):246–262. doi:10.1111/imr.13279
10. Christgen S, Tweedell RE, Kanneganti TD. Programming inflammatory cell death for therapy. Pharmacol Ther. 2022;232:108010. doi:10.1016/j.pharmthera.2021.108010
11. Karki R, Sharma BR, Tuladhar S, et al. Synergism of TNF-alpha and IFN-gamma triggers inflammatory cell death, tissue damage, and mortality in SARS-CoV-2 infection and cytokine shock syndromes. Cell. 2021;184(1):149–168. doi:10.1016/j.cell.2020.11.025
12. Christgen S, Zheng M, Kesavardhana S, et al. Identification of the PANoptosome: a Molecular Platform Triggering Pyroptosis, Apoptosis, and Necroptosis (PANoptosis). Front Cell Infect Microbiol. 2020;10:237. doi:10.3389/fcimb.2020.00237
13. Malireddi R, Kesavardhana S, Kanneganti TD. ZBP1 and TAK1: master regulators of NLRP3 inflammasome/pyroptosis, apoptosis, and necroptosis (PAN-optosis). Front Cell Infect Microbiol. 2019;9:406. doi:10.3389/fcimb.2019.00406
14. Sun Y, Li F, Liu Y, et al. Targeting inflammasomes and pyroptosis in retinal diseases-molecular mechanisms and future perspectives. Prog Retin Eye Res. 2024;101:101263. doi:10.1016/j.preteyeres.2024.101263
15. Zhang T, Xu D, Trefts E, et al. Metabolic orchestration of cell death by AMPK-mediated phosphorylation of RIPK1. Science. 2023;380(6652):1372–1380. doi:10.1126/science.abn1725
16. Lv Z, Hu J, Su H, et al. TRAIL induces podocyte PANoptosis via death receptor 5 in diabetic kidney disease. Kidney Int. 2025;107(2):317–331. doi:10.1016/j.kint.2024.10.026
17. Guan J, Shi X, Ma J, et al. Circular RNA-OGDH promotes PANoptosis in diabetic cardiomyopathy: a novel mechanistic insight. J Biol Chem. 2025;301(7):110280. doi:10.1016/j.jbc.2025.110280
18. Yang S, Qi S, Wang C. The role of retinal Muller cells in diabetic retinopathy and related therapeutic advances. Front Cell Dev Biol. 2022;10:1047487. doi:10.3389/fcell.2022.1047487
19. Qin H, Abulaiti A, Maimaiti A, et al. Integrated machine learning survival framework develops a prognostic model based on inter-crosstalk definition of mitochondrial function and cell death patterns in a large multicenter cohort for lower-grade glioma. J Transl Med. 2023;21(1):588. doi:10.1186/s12967-023-04468-x
20. Uetz P, Dong YA, Zeretzke C, et al. Herpesviral protein networks and their interaction with the human proteome. Science. 2006;311(5758):239–242. doi:10.1126/science.1116804
21. Kropp M, Golubnitschaja O, Mazurakova A, et al. Diabetic retinopathy as the leading cause of blindness and early predictor of cascading complications-risks and mitigation. EPMA J. 2023;14(1):21–42. doi:10.1007/s13167-023-00314-8
22. Antonetti DA, Silva PS, Stitt AW. Current understanding of the molecular and cellular pathology of diabetic retinopathy. Nat Rev Endocrinol. 2021;17(4):195–206. doi:10.1038/s41574-020-00451-4
23. Rao H, Jalali JA, Johnston TP, Koulen P. Emerging roles of dyslipidemia and hyperglycemia in diabetic retinopathy: molecular mechanisms and clinical perspectives. Front Endocrinol. 2021;12:620045. doi:10.3389/fendo.2021.620045
24. Lee S, Karki R, Wang Y, Nguyen LN, Kalathur RC, Kanneganti TD. AIM2 forms a complex with pyrin and ZBP1 to drive PANoptosis and host defence. Nature. 2021;597(7876):415–419. doi:10.1038/s41586-021-03875-8
25. Sundaram B, Pandian N, Mall R, et al. NLRP12-PANoptosome activates PANoptosis and pathology in response to heme and PAMPs. Cell. 2023;186(13):2783–2801. doi:10.1016/j.cell.2023.05.005
26. Kesavardhana S, Malireddi R, Kanneganti TD. Caspases in Cell Death, Inflammation, and Pyroptosis. Annu Rev Immunol. 2020;38:567–595. doi:10.1146/annurev-immunol-073119-095439
27. Xu CS, Pang S, Shtengel G, et al. An open-access volume electron microscopy atlas of whole cells and tissues. Nature. 2021;599(7883):147–151. doi:10.1038/s41586-021-03992-4
28. Boudreau-Pinsonneault C, David LA, Lourenco FJ, et al. Direct neuronal reprogramming by temporal identity factors. Proc Natl Acad Sci U S A. 2023;120(19):e2122168120. doi:10.1073/pnas.2122168120
29. Carpi-Santos R, de Melo RR, Gomes F, Calaza KC. Contribution of Muller cells in the diabetic retinopathy development: focus on oxidative stress and inflammation. Antioxidants. 2022;11(4):617. doi:10.3390/antiox11040617
30. Lin Y, Ke S, Ye W, Xie B, Huang Z. Non-apoptotic programmed cell death as targets for diabetic retinal neurodegeneration. Pharmaceuticals. 2024;17(7):837. doi:10.3390/ph17070837
31. Devoldere J, Peynshaert K, De Smedt SC, Remaut K. Muller cells as a target for retinal therapy. Drug Discov Today. 2019;24(8):1483–1498. doi:10.1016/j.drudis.2019.01.023
32. Ayuso-Dolado S, Esteban-Ortega GM, Vidaurre OG, Diaz-Guerra M. A novel cell-penetrating peptide targeting calpain-cleavage of PSD-95 induced by excitotoxicity improves neurological outcome after stroke. Theranostics. 2021;11(14):6746–6765. doi:10.7150/thno.60701
33. Zhang C, Xu Y, Tan HY, et al. Neuroprotective effect of He-Ying-Qing-Re formula on retinal ganglion cell in diabetic retinopathy. J Ethnopharmacol. 2018;214:179–189. doi:10.1016/j.jep.2017.12.018
34. McLaughlin T, Wang G, Medina A, et al. Essential Role of XBP1 in Maintaining Photoreceptor Synaptic Integrity in Early Diabetic Retinopathy. Invest Ophthalmol Vis Sci. 2023;64(14):40. doi:10.1167/iovs.64.14.40
35. Zhang J, Sheng S, Wang W, et al. Molecular mechanisms of iron mediated programmed cell death and its roles in eye diseases. Front Nutr. 2022;9:844757. doi:10.3389/fnut.2022.844757
36. Zhao T, Guo X, Sun Y. Iron accumulation and lipid peroxidation in the aging retina: implication of ferroptosis in age-related macular degeneration. Aging Dis. 2021;12(2):529–551. doi:10.14336/AD.2020.0912
37. Cecilia OM, Jose AC, Jose NP, et al. Oxidative stress as the main target in diabetic retinopathy pathophysiology. J Diabetes Res. 2019;2019:8562408. doi:10.1155/2019/8562408
38. Liu D, Meng Z, Jin C, et al. Fibronectin mediates endothelial-to-mesenchymal transition in retina angiogenesis. Invest Ophthalmol Vis Sci. 2025;66(3):10. doi:10.1167/iovs.66.3.10
39. Zhu W, Song S, Xu Y, Sheng H, Wang S. EMP3: a promising biomarker for tumor prognosis and targeted cancer therapy. Cancer Biomark. 2024;40(3–4):227–239. doi:10.3233/CBM-230504
40. Betsholtz C, Karlsson L, Lindahl P. Developmental roles of platelet-derived growth factors. Bioessays. 2001;23(6):494–507. doi:10.1002/bies.1069
41. An X, Ma X, Liu H, et al. Inhibition of PDGFRbeta alleviates endothelial cell apoptotic injury caused by DRP-1 overexpression and mitochondria fusion failure after mitophagy. Cell Death Dis. 2023;14(11):756. doi:10.1038/s41419-023-06272-3
42. Reddy SK, Devi V, Seetharaman ATM, et al. Cell and molecular targeted therapies for diabetic retinopathy. Front Endocrinol. 2024;15:1416668. doi:10.3389/fendo.2024.1416668
43. Ramos H, Simó-Servat O. Neuroprotection in diabetes retinal disease: an unmet medical need. Int J Mol Sci. 2026;27(2):901. doi:10.3390/ijms27020901
44. Meyer RC, Giddens MM, Schaefer SA, Hall RA. GPR37 and GPR37L1 are receptors for the neuroprotective and glioprotective factors prosaptide and prosaposin. Proc Natl Acad Sci U S A. 2013;110(23):9529–9534. doi:10.1073/pnas.1219004110
 © 2026 The Author(s). This work is published and licensed by Dove Medical Press Limited. The
full terms of this license are available at https://www.dovepress.com/terms
and incorporate the Creative Commons Attribution
- Non Commercial (unported, 4.0) License.
By accessing the work you hereby accept the Terms. Non-commercial uses of the work are permitted
without any further permission from Dove Medical Press Limited, provided the work is properly
attributed. For permission for commercial use of this work, please see paragraphs 4.2 and 5 of our Terms.
© 2026 The Author(s). This work is published and licensed by Dove Medical Press Limited. The
full terms of this license are available at https://www.dovepress.com/terms
and incorporate the Creative Commons Attribution
- Non Commercial (unported, 4.0) License.
By accessing the work you hereby accept the Terms. Non-commercial uses of the work are permitted
without any further permission from Dove Medical Press Limited, provided the work is properly
attributed. For permission for commercial use of this work, please see paragraphs 4.2 and 5 of our Terms.
Recommended articles
Effect of Shuangdan Mingmu Capsule on Diabetic Retinopathy in Rats via Regulation of miRNAs
Li X, Yang Y, Song Y, Nie F, Fu C, Qin Y
Diabetes, Metabolic Syndrome and Obesity 2022, 15:3181-3194
Published Date: 19 October 2022
Mechanisms of Small Intestine Involvement in Obesity-Induced Atherosclerosis
Pan X, Jia Z, Zhen R, Yue L, Niu S, Ban J, Chen S
Diabetes, Metabolic Syndrome and Obesity 2023, 16:1941-1952
Published Date: 28 June 2023
Identification of Hub Genes Associated with Gastric Cancer via Bioinformatics Analysis and Validation Studies
Zhao T, Chen Z, Liu W, Ju H, Li F
International Journal of General Medicine 2023, 16:4835-4848
Published Date: 26 October 2023
PANoptosis and Autophagy-Related Molecular Signature and Immune Landscape in Ulcerative Colitis: Integrated Analysis and Experimental Validation
Lu J, Li F, Ye M
Journal of Inflammation Research 2024, 17:3225-3245
Published Date: 20 May 2024
Identification and Experimental Validation of PANoptosis-Related Genes in Idiopathic Pulmonary Fibrosis by Bioinformatics Analysis
Wang D, Yuan Y, Tong X, Wang L, Sun J, Zhang S, Liu S, Gan H, Fan H
Journal of Inflammation Research 2025, 18:5499-5517
Published Date: 23 April 2025