")
Back to Journals » International Journal of General Medicine » Volume 16
Identification of Hub Genes Associated with Gastric Cancer via Bioinformatics Analysis and Validation Studies
Authors Zhao T , Chen Z, Liu W, Ju H, Li F
Received 14 August 2023
Accepted for publication 12 October 2023
Published 26 October 2023 Volume 2023:16 Pages 4835—4848
DOI https://doi.org/10.2147/IJGM.S432284
Checked for plagiarism Yes
Review by Single anonymous peer review
Peer reviewer comments 2
Editor who approved publication: Dr Scott Fraser
Ting Zhao,1,* Zihao Chen,2,* Wenbo Liu,3 Hongping Ju,4 Fang Li5
1Department of Clinical Pharmacy, The First Affiliated Hospital of Kunming Medical University, Kunming, People’s Republic of China; 2Department of Surgical Oncology, The First Affiliated Hospital of Kunming Medical University, Kunming, People’s Republic of China; 3The Third department of Surgery, The Fourth Hospital of Hebei Medical University, Shijiazhuang, People’s Republic of China; 4School of Medicine, Kunming University, Kunming, People’s Republic of China; 5Department of Pathology, The Fourth Hospital of Hebei Medical University, Shijiazhuang, People’s Republic of China
*These authors contributed equally to this work
Correspondence: Fang Li, Email [email protected]
Introduction: Hub genes related to the development of gastric cancer (GC) were identified based on bioinformatics methods. This study aimed to identify GC hub genes, explore the expression of genes in GC and their correlation with prognosis, so as to provide strategies for GC diagnosis and targeted therapy.
Methods: Two messenger RNA (mRNA) microarray datasets were downloaded from GEO database. These data were combined with TCGA database to obtain common DEGs between GC tissues and normal tissues. GO and KEGG pathway enrichment analysis was performed. Visualized PPI network analysis was performed by Cytoscape to further identify hub genes. GEPIA database was used to evaluate the prognostic value of hub genes. The online software Ualcan was applied to analyze the expression of the prognosis-related genes in cancer tissues and normal tissues from different perspectives of primary GC, TNM stage, nodal metastasis status and tumor grade. Immunohistochemical staining of GC tissues and normal tissues was performed to evaluate the expression of signature genes in GC.
Results: Eighty-four common differentially expressed genes (DEGs) in GC were identified. These genes were closely related to the P13K-Akt signal pathway and other signaling pathways. Ten hub genes were identified. Collagen type I alpha 1 (COL1A1) and collagen type IV alpha 1 (COL4A1) were significantly associated with poor prognosis of GC and were all positively correlated with T stage, distant metastasis, and TNM stage of GC. Immunohistochemistry revealed that the expression of these 2 genes was upregulated in GC tissues. These 2 genes expression was negatively related with 5-year survival rate of GC patients.
Conclusion: Ten highly expressed hub genes in GC tissue were mined by bioinformatics method. COL1A1 and COL4A1 were significantly associated with the prognosis of GC. This study provided a theoretical basis for the pathogenesis, clinical diagnosis and therapeutic targets of GC.
Keywords: gastric cancer, bioinformatics analysis, prognosis, differentially expressed genes, immunohistochemical
Introduction
GC is a common malignant tumor of digestive system. According to the International Agency for Research on Cancer (IARC) of the World Health Organization, there were 19.29 million new cancer cases and 9.96 million deaths worldwide in 2020, of which the number of new cases of GC was 1089,103 (5.6%), and the number of deaths was 768,793 (7.7%). In 2020, there were 4.57 million new cancer cases and 3 million deaths in China, including 480,000 new GC cases and 370,000 deaths.1 GC is not only ranked as the third leading cause of cancer death worldwide, but also ranked as the fifth most common cancer.2 The clinical diagnosis and treatment of GC lacks effective biomarkers, resulting in a low early diagnosis rate of GC, which affects the clinical diagnosis and treatment of GC. Most GC cases are diagnosed at an advanced stage with poor prognosis and low long-term survival.3 Therefore, it is necessary to find effective biomarkers for GC to improve the diagnostic effect and the value of prognostic evaluation.
Analysis of microarray technology and bioinformatics technology is helpful for the screening of disease biomarkers. It can make great contributions to the study of disease-related genes and molecular mechanisms of disease occurrence and development. Recently, microarray technology has been widely used to explore changes in cancer gene expression.4,5 High-quality microarrays and high-throughput sequencing help to discover gene expression changes during the development of GC,6–8 and enable the screening of biomarkers for GC diagnosis, treatment, and prognosis. Gene maps are obtained from public databases such as the Gene Expression Omnibus (GEO) and The Cancer Genome Atlas (TCGA). Comprehensive bioinformatics data overcomes the limitations of different microarray platforms and small sample sizes.
In the present study, two messenger RNA (mRNA) microarray datasets (GSE33335 and GSE79973) were downloaded from GEO database. These data were combined with the TCGA database to obtain common DEGs between GC tissues and normal tissues. Subsequently, Gene Ontology (GO) and Kyoto Encyclopedia of Genes and Genomes (KEGG) pathway enrichment analysis was performed. Visualized PPI network analysis was performed by Cytoscape to further identify hub genes. GEPIA database was used to evaluate the prognostic value of hub genes in GC. The online software Ualcan was applied to analyze the expression of the prognosis-related genes in gastric tissues and normal tissues from different perspectives of primary GC, TNM stage, nodal metastasis status and tumor grade. Immunohistochemical staining of GC tissues and normal tissues was performed to evaluate the expression of signature genes in GC.
Materials and Methods
Data Acquisition and Processing
Log into the GEO database of the National Center for Biotechnology Information (https://www.ncbi.nlm.nih.gov/geo/), and search with the keyword “Gastric cancer”. The screening conditions are (1) the datasets are from the same platform, (2) the samples include GC tissue and normal tissue from the same patient, (3) the total number of samples is not less than 20 and (4) the samples are from “homo sapines”. The GSE33335 dataset derived from the GPL5175 platform (including the gene expression data of 25 normal gastric mucosa samples and 25 GC samples), and the GSE79973 dataset derived from the GPL570 platform (including 10 normal samples and 10 GC samples) were screened. Search the TCGA database (https://www.cancer.gov/about-nci/organization/ccg/research/structural-genomics/tcga) for the keyword “Gastric cancer”. Gene expression data of GC samples (375 cases) and normal samples (32 cases) were obtained. DEGs were analyzed by combining GSE33335, GSE79973 and TCGA data.
Screening of DEGs
R software (4.1.3, https://www.r-project.org/) “Limma” package was used to analyze the differential expression of genes in GC and normal gastric tissues in GSE33335 and GSE79973 datasets, and to draw volcano plots of DEGs. The R software pheatmap package was used to draw heatmaps. The R software “edgeR” package was used to analyze gene differential expression between GC and normal gastric tissue data in the TCGA database, and a volcano plot was drawn. Heatmaps of DEGs were drawn using the R software “gplots” package. It was stipulated that an adjustP value <0.05 was statistically significant, and |log2FC| (log2 Fold Change) >1 indicated the existence of expression differences. The above three differentially expressed gene datasets were integrated and analyzed using the online Veen plot tool (http://bioinformatics.psb.ugent.be/webtools/Venn/) provided by Bioinformatics & Evolutionary Genomics to obtain common DEGs.
Functional Enrichment Analysis
GO analysis process exists in large-scale functional enrichment and is a commonly used research method in functional enrichment research. Gene functions usually include three processes: biological process (BP), molecular function (MF) and cellular components (CC). Pathway enrichment analysis was performed through KEGG database. Annotation analysis and pathway enrichment analysis of DEGs were performed using the DAVID comprehensive database. P < 0.05 was considered statistically significant. Visual analysis was performed using the R software “ggplot2” package.
Construction of PPI Interaction Network and Screening of Hub Genes
The online analysis tool STRING (https://cn.string-db.org/) was applied to construct a PPI network map of DEGs. The high confidence interaction score (high confidence) was set to 0.700, and nodes that had no interaction relationship were hidden. The R software was used to screen the hub genes closely related to GC, and a bar graph was drawn.
Validation of Differential Expression of Key Hub Genes
GEPIA (http://gepia.cancer-pku.cn/index.html) is an online analysis website created by Peking University, which contains 9736 tumor tissues and 726 normal tissues from TCGA, and more than 8000 cases of normal tissue data in GTEx database. The differential expression of 10 key hub genes in tumor tissue and normal tissue was verified by GEPIA database.
Analysis of the Prognostic Value of Hub Genes
To evaluate the prognostic value of hub genes in GC, the median relative expression of hub genes was used as the cutoff value in the GEPIA database. The patients were divided into high-expression and low-expression groups according to the differential gene mRNA expression levels for comparison between groups. The survival curves of 10 hub genes were drawn and examined by Log Rank test. The survival curve graph included hazards ratio (HR) and 95% confidence interval (CI). P < 0.05 was considered statistically significant.
Transcription Level of the Prognosis-Related Genes
The expression of the prognosis-related genes in gastric tissues and normal tissues were analyzed by online software Ualcan (http://ualcan.path.uab.edu/analysis.html). In this study, we analyzed the difference of prognosis-related genes expression from different perspectives of primary GC, TNM stage, nodal metastasis status and tumor grade.
Tissue Specimens
In this study, 70 paired tumor tissues and adjacent non-tumor tissues were collected from GC patients at the Fourth Hospital of Hebei Medical University from January 2015 to December 2016. All cases were confirmed by pathological diagnosis, and the clinicopathological data were completed. Tumor tissues and adjacent non-tumor tissues were collected and snap-frozen in liquid nitrogen then stored at −80°C. All patients were diagnosed as primary GC. All patients had no history of other malignant tumors and did not receive radiotherapy, chemotherapy or targeted therapy before surgery. This study complied with the Declaration of Helsinki and was approved by Ethics Committee of the Fourth Hospital of Hebei Medical University (approval number: 2021KY283). All experiments were performed in compliance with the relevant regulations, and written informed consent was obtained from every participant.
Immunohistochemical
The expressions of prognosis-related proteins in GC tissues and adjacent tissues were detected by streptavidin peroxidase (S-P method) immunohistochemical method. Briefly, bake the slices at 70 °C for 30 min. Sections were deparaffinized with dimethylbenzene and dehydrated through 100, 95, 85, and 75% ethanol. Endogenous peroxidase was incubated with 3% H2O2 at room temperature for 10 min. Antigen retrieval treatment was carried out by high-pressure heating in pH=6.0 sodium citrate buffer solution. The sections were washed in PBS solution and blocked with 10% goat serum for 30 min, then incubated with primary antibody (Anti-COL1A1 antibody produced in rabbit (SAB5700733), Sigma-Aldrich; Anti-COL4A1, antibody produced in rabbit (SAB4300825), Sigma-Aldrich) at 4°C overnight. The sections were washed in PBS solution for 3 times and incubated with secondary antibody at 37°C for 30 min. The sections were washed in PBS solution for 3 times. Streptomycin ovalbumin working solution labeled with horseradish peroxidase was added and incubated at 37°C for 30 min. The sections were washed in PBS solution for 3 times. All slides were counterstained diaminobenzidine (DAB) solution. At last, sections were counterstained with hematoxylin, dehydrated, cleared and mounted. The pictures are 400 times magnification. According to the data standards of scholars such as Shimizu9 and scored according to the percentage of positive staining in the tissue: no positive staining was 0 points, 1–25% was 1 point, 26–50% was 2 points, and >50% was 3 points. The staining intensity was scored: no staining was 0, light yellow was 1, tan was 2, and brown was 3, and the sum of the two scores was ≥3 as positive expression.
Relationship Between Genes and Clinical Characteristics of Patients
The clinical characteristics of GC patients (n=70) were recorded to explore the association between prognosis-related genes and clinical characteristics of patients with GC (including gender, age, tumor location, infiltrating depth, lymph node metastasis, clinical stage, differentiation degree, Lauren classification, etc.).
Follow-Up
Postoperative follow-up data of GC patients were collected by means of reexamination and telephone, and recurrence, metastasis and death of patients were recorded. The cut-off point of follow-up was death, and the end of follow-up was December 30, 2021.
Results
Identification of DEGs in GC
Through differential gene analysis of gene expression profiles, 300 up-regulated genes and 111 down-regulated genes related to GC were screened in GSE33335 data set; 295 up-regulated genes and 665 down-regulated genes were screened in GSE79973 data set. A total of 7921 up-regulated genes and 3636 down-regulated genes related to GC were screened from the TCGA database. R software was applied to visualize the DEGs of each dataset by volcano plots and heatmaps, respectively (Figure 1A–F). Common DEGs of the three datasets were obtained by the Venny tool (Figure 1G). The results showed 84 common DEGs related to GC, including 34 up-regulated genes and 50 down-regulated genes.
 |
Figure 1 Volcano plots and heatmaps of DEGs. (A) Volcano plot of DEGs in GSE33335 dataset. (B) Heatmap of DEGs in GSE33335 dataset. (C) Volcano plot of DEGs in GSE79973 dataset. (D) Heatmap of DEGs in GSE79973 dataset. (E) Volcano plot of DEGs in TCGA data. (F) Heatmap of DEGs in TCGA data. (G) Venn diagram of DEGs. Abbreviations: DEG, differentially expressed genes; TCGA, The Cancer Genome Atlas. |
GO Function and KEGG Pathway Analyses for the DEGs
To further evaluate the function of identified DEGs, GO function and KEGG pathway enrichment analysis were performed using DAVID. Enriched BP, CC and MF were used to better understand the biological functions of overlapping DEGs. The upregulated DEGs were mainly enriched in “extracellular matrix organization”, “cell adhesion” and “collagen fibril organization” by biological process (Figure 2A), “extracellular space”, “plasma membrane” and “extracellular region” by cellular component (Figure 2B) and “protein binding” by molecular function (Figure 2C), respectively. Moreover, the results of the KEGG pathway analysis revealed that these DEGs were primarily enriched in “P13K-Akt signal pathway”, “human papillpmavirus infection” and “focal adhesion” (Figure 2D).
 |
Figure 2 The GO and KEGG functional enrichment analyses of overlapping DEGs in gastric cancer. (A) The GO term, biological processes of common DEGs. (B) The GO term, cellular composition of common DEGs. (C) The GO term, molecular function of common DEGs. (D) KEGG pathway enrichment analyses of common DEGs. Abbreviations: GO, Gene Ontology; KEGG, Kyoto Encyclopedia of Genes and Genomes; DEG, differentially expressed genes. |
PPI Network Construction and Hub Genes Identification
The STRING online database is used to construct the PPI interaction network (Figure 3A). R software was used to sort by the number of nodes and draw a column chart (Figure 3B). The 10 hub genes most associated with GC were identified, followed by COL1A1, COL3A1, COL1A2, CCNB1, COL4A1, SERPINH1, SPARC, MAD2L1, BGN and CDKN3.
 |
Figure 3 Protein interaction network diagram of common DEGs and identifying of hub genes. (A) The protein interaction network diagram of the common DEGs using online analysis tool STRING. (B) The ranking column chart of the hub genes by R software (top 30 genes). Abbreviation: DEG, differentially expressed genes. |
Hub Genes Validation
The mRNA expression levels of 10 key hub genes were verified by GEPIA database, and the results showed that the expression levels of COL1A1, COL3A1, COL1A2, CCNB1, COL4A1, SERPINH1, SPARC, MAD2L1, BGN and CDKN3 were significantly higher than those in normal tissues (Figure 4A–J).
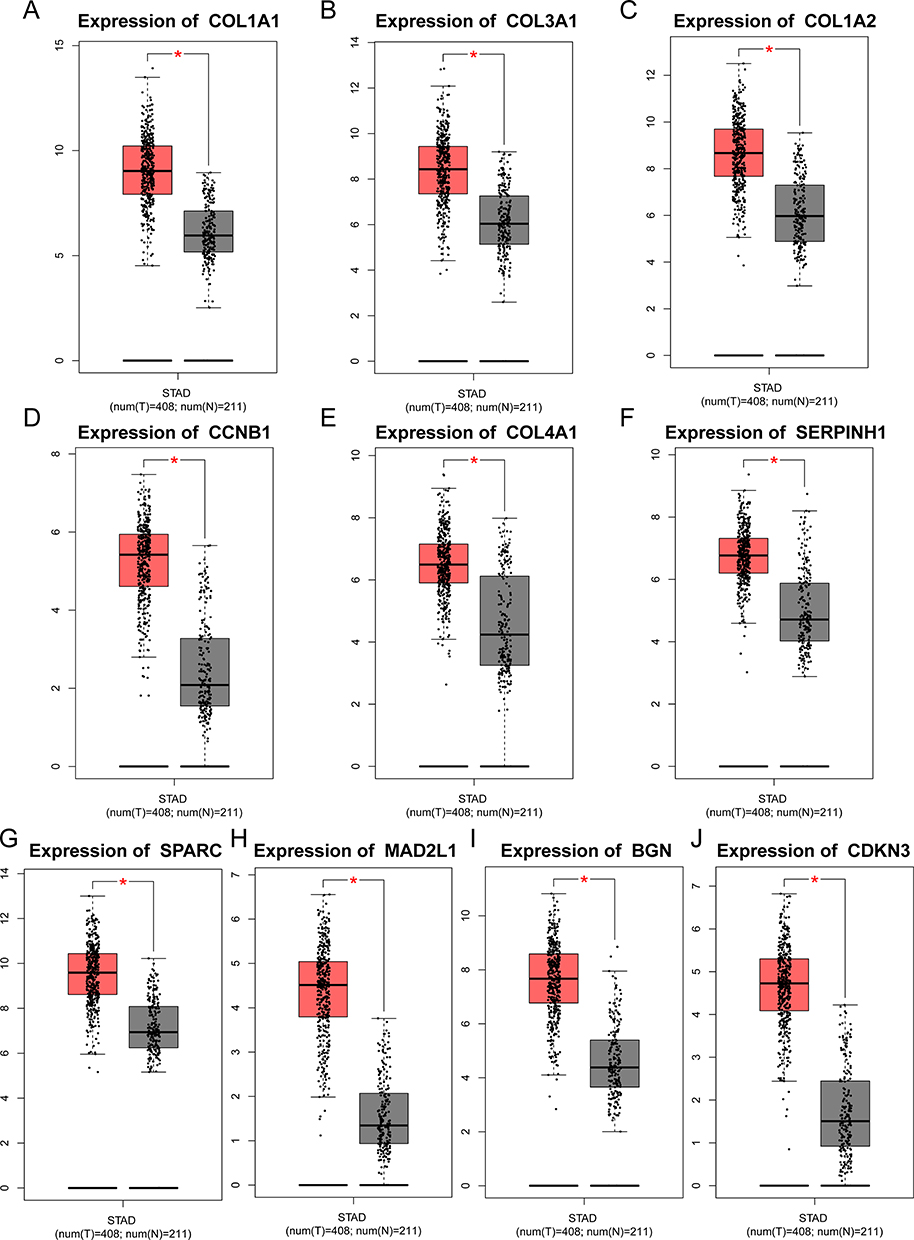 |
Figure 4 Validation of selected hub genes expression in gastric cancer tissues and normal tissues using GEPIA database. ((A–J): COL1A1, COL3A1, COL1A2, CCNB1, COL4A1, SERPINH1, SPARC, MAD2L1, BGN and CDKN3). *P < 0.05. |
The Prognostic Value of Hub Genes
In order to evaluate the correlation between the expression of hub genes and the prognosis of GC patients, survival analysis was performed using the GEPIA database. The results showed that the expression levels of COL1A1 and COL4A1 were significantly correlated with the overall survival of GC patients (Figure 5A and E), indicating that the expression differences were associated with patient prognosis. Therefore, COL1A1 and COL4A1 might be used as prognostic indicators for GC patients. The survival analysis also showed that the overall survival (OS) differences between high expression and low expression of the other 8 genes (COL3A1, COL1A2, CCNB1, SERPINH1, SPARC, MAD2L1, BGN and CDKN3) were not significant (Figure 5B, C, D, F, G, H, I and J).
 |
Figure 5 The validation of prognostic value of 10 genes. ((A–J): COL1A1, COL3A1, COL1A2, CCNB1, COL4A1, SERPINH1, SPARC, MAD2L1, BGN and CDKN3). |
Validation of Expression Levels of Prognosis-Related Genes
The online database Ualcan was used to analyze the expression of 2 prognosis-related genes in GC tissue and normal tissue. The results showed that the expressions of COL1A1 and COL4A1 were all up-regulated in GC tissues compared with normal tissues (all P < 0.001) (Figure 6A). In terms of TNM staging, the expression levels of COL1A1 and COL4A1 in normal tissues were lower than those in stage I, II, III and IV GC tissues (P < 0.05, P < 0.001, P < 0.001, P < 0.001, respectively) (Figure 6B). In terms of nodal metastasis, the expression levels of COL1A1 and COL4A1 in normal tissues were lower than those in N0, N1, N2, and N3 tissues (all P < 0.001) (Figure 6C). In terms of tumor grade, the expression levels of COL1A1 and COL4A1 in normal tissues were lower than those in G1, G2 and G3 GC tissues (P < 0.05, P < 0.001, P < 0.001, respectively) (Figure 6D). The above results revealed that the expressions of COL1A1 and COL4A1 were all positively correlated with T stage, distant metastasis, and TNM stage of GC.
 |
Figure 6 Correlation between the expression of prognostic genes and clinicopathological features of GC (Ualcan database). (A) The expression of 2 prognosis-related genes in GC. (B) Correlation between expression of 4 prognosis-related genes and tumor stages in GC patients. (C) Expression of 2 prognosis-related genes in GC based on nodal metastasis status. (D) Expression of 2 prognosis-related genes in GC based on tumor grades. *P < 0.05, ***P < 0.001. Abbreviation: GC, gastric cancer. |
Immunohistochemistry
To further verify the results of bioinformatics analysis, immunohistochemistry of 2 genes was performed. Immunohistochemical results showed that COL1A1 and COL4A1 were mainly expressed in the cytoplasm, and the expression of 2 genes in tumor tissues was higher than that in adjacent tissues, which was consistent with the results of the previous bioinformatics analysis. Representative immunohistochemical results are shown in Figure 7. The positive expression rates of COL1A1 and COL4A1 in GC tissues (72% and 73%) were significantly higher than those in adjacent tissues (37% and 21%) (P < 0.05, P < 0.01, respectively).
 |
Figure 7 The immunohistochemical-based protein expression of 2 prognosis-related genes in GC tissues and adjacent normal tissues. Abbreviation: GC, gastric cancer. |
Relationship Between Genes and Clinical Characteristics of GC Patients
Pearson’s chi-squared test showed that the expression level of COL1A1 was positively correlated with infiltrating depth (χ2=9.842, P < 0.05), clinical stage (χ2=5.743, P < 0.05) and differentiation degree (χ2=4.622, P < 0.05). The expression level of COL1A1 was not associated with gender, age, tumor location, lymph node metastasis and Lauren classification (Table 1). The expression level of COL4A1 was positively correlated with the age of GC patients (χ2=5.418, P < 0.05), lymph node metastasis (χ2=12.01, P < 0.01) and clinical stage (χ2=8.903, P < 0.05). The expression level of COL4A1 was not associated with gender, tumor location, infiltrating depth, differentiation degree and Lauren classification (Table 1).
 |
Table 1 Relationship Between Prognosis-Related Genes and Clinicopathological Features in Patients with GC |
Relationship Between 5-Year Survival Rate and Clinicopathological Features of GC Patients
Univariate survival analysis showed that OS was significantly correlated with infiltrating depth (χ2=14.14, P < 0.01), lymph node metastasis (χ2=10.34, P < 0.05), clinical stage (χ2=11.63, P < 0.01), differentiation degree (χ2=5.416, P < 0.05), COL1A1 (χ2=6.228, P < 0.05) and COL4A1 (χ2=7.372, P < 0.01) expression level (Table 2). GC patients with high COL1A1 expression had shorter OS than those with low COL1A1 expression (Figure 8A). Similarly, GC patients with high COL4A1 expression had shorter OS than those with low COL4A1 expression (Figure 8B).
 |
Table 2 Relationship Between 5-Year Survival Rate and Clinicopathological Features in Patients with GC |
 |
Figure 8 Relationship between prognosis-related genes expression level and 5-year survival rate of patients with GC (n=70). (A) Relationship between COL1A1 expression level and 5-year survival rate of patients with GC. (B) Relationship between COL4A1 expression level and 5-year survival rate of patients with GC. Abbreviation: GC, gastric cancer. |
Discussion
The incidence of GC is increasing, and the mortality rate of GC ranks third in cancer. Surgery, chemotherapy, radiotherapy and immunotherapy are the main therapies for the clinical treatment of GC. Patients usually show no symptoms in the early stage of GC. Most of the diagnosed patients are in the middle and late stages, and the five-year survival rate is only 11–40%. In recent years, targeted drugs for advanced GC have been developed and approved for clinical treatment, including trastuzumab (the first-line drug for HER2-positive patients),10 ramucirumab (the second-line anti-angiogenesis drug),11 nivolumab and pembrolizumab (anti-PD-1 third-line drug).12 However, the overall prognosis of GC patients is still poor. Drug will affect the immune function of the patients when inhibiting tumor growth. Therefore, it is urgently needed to explore effective biomarkers for GC prognosis prediction and as a target for targeted therapy.
In this study, we screened out the 10 hub genes most associated with GC, which are COL1A1, COL3A1, COL1A2, CCNB1, COL4A1, SERPINH1, SPARC, MAD2L1, BGN, and CDKN3. The GEPIA database verified that the expression levels of 10 hub genes in GC tissues were significantly higher than those in normal tissues. Moreover, the expression levels of COL1A1 and COL4A1 were significantly correlated with the OS of GC patients, indicating that their expression differences were associated with patient prognosis, which proved that the 2 genes could be used as prognostic indicators for GC. The results of immunohistochemical staining also proved that the expressions of COL1A1 and COL4A1 in GC tissues were higher than those in adjacent tissues.
The occurrence, development, invasion and metastasis of malignant tumors are often accompanied by changes in the expression of extracellular matrix (ECM) and cell surface receptors.13 Collagen is the main component of ECM, which is the attachment and scaffold for cell growth, and can induce epithelial cell proliferation, differentiation and migration, which plays an important role in maintaining intercellular adhesion, tissue integrity and recovery.14
COL1A1, collagen type I, alpha 1, plays a role by activating three pathways Rac1-GTP, p-JNK, and RhoA-GTP through the WNT/planar cell polarity (PCP) pathway. RhoGTPases and JNK pathways transmit signals from cell surface Frizzled and ROR2/RYK co-receptors to the nucleus, which is an important process of tumor cell metastasis.15 Therefore, COL1A1 may be involved in the metastatic process of GC.
COL4A1 plays a crucial role in tumor invasion by inducing tumor budding.16 Huang et al17 predicted the mRNA expression of COL4A1 in trastuzumab-resistant GC patients by bioinformatics methods. The level was significantly higher than that of non-resistant patients, suggesting that high expression of COL4A1 can induce drug resistance in GC patients.
This study provides new molecules for the construction of GC prognosis models, and further provides a theoretical basis for GC diagnosis, treatment and prognosis screening. There are also shortcomings in this study. Although the results have been verified by different websites and existing literature, and the expression difference of hub gene in GC tissue and normal tissue has been verified by immunohistochemical staining. However, a series of molecular biology experimental data are still lacking. Therefore, the molecular mechanism in this study remains to be further explored. Extensive exploratory data are very limited due to current single-gene and next-generation sequencing-specific analyses.18 Future bioinformatic analysis may develop towards polygenic modules. Weighted gene coexpression network analysis (WGCNA) can analyze complex gene interaction networks and simultaneously evaluate the expression of all genes.19 In addition, the combination of multiple RNA biomarkers can improve the sensitivity and specificity of diagnosis and prognosis.20
Conclusion
In this study, 10 highly expressed hub genes COL1A1, COL3A1, COL1A2, CCNB1, COL4A1, SERPINH1, SPARC, MAD2L1, BGN and CDKN3 in GC tissue were mined by bioinformatics method. COL1A1 and COL4A1 were significantly associated with the prognosis of GC and could be used as prognostic indicators for GC. The expression level of COL1A1 was associated with infiltrating depth, clinical stage and differentiation degree. The expression level of COL4A1 was associated with the age of GC patients, lymph node metastasis and clinical stage. COL1A1 and COL4A1 expression is negatively related with OS of GC patients. Therefore, this study shows potential targets for the diagnosis and treatment of GC and provides theoretical support, new ideas and new strategies for the clinical treatment and mechanism research of GC.
Abbreviations
BP, Biological process; CC, Cellular component; CI, Confidence interval; DEGs, Differentially expressed genes; GC, Gastric cancer; GEO, Gene Expression Omnibus; GO, Gene Ontology; HR, Hazards ratio; IARC, International Agency for Research on Cancer; KEGG, Kyoto Encyclopedia of Genes and Genomes; MF, Molecular function; mRNA, Messenger RNA; OS, Overall survival; PPI, Protein-protein interaction; TCGA, The Cancer Genome Atlas; WGCNA, Weighted gene coexpression network analysis.
Acknowledgments
We thank all the patients, and their families involved in the current study.
Author Contributions
All authors made a significant contribution to the work reported, whether that is in the conception, study design, execution, acquisition of data, analysis and interpretation, or in all these areas; took part in drafting, revising or critically reviewing the article; gave final approval of the version to be published; have agreed on the journal to which the article has been submitted; and agree to be accountable for all aspects of the work.
Funding
This work was supported by the grants from Scientific Research Foundation of Education Department of Yunnan Province (2023Y0624, 2023Y0635) to Ting Zhao and Zihao Chen, Science and Technology Foundation of Yunnan Province (202101BA070001-033) to Hongping Ju.
Disclosure
The authors report no conflict for interest in this study.
References
1. Sung H, Ferlay J, Siegel RL, et al. Global cancer statistics 2020: GLOBOCAN estimates of incidence and mortality worldwide for 36 cancers in 185 countries. CA Cancer J Clin. 2021;71(3):209–249. doi:10.3322/caac.21660
2. Bray F, Ferlay J, Soerjomataram I, Siegel RL, Torre LA, Jemal A. Global cancer statistics 2018: GLOBOCAN estimates of incidence and mortality worldwide for 36 cancers in 185 countries. CA Cancer J Clin. 2018;68(6):394–424. doi:10.3322/caac.21492
3. Van Cutsem E, Sagaert X, Topal B, Haustermans K, Prenen H. Gastric cancer. Lancet. 2016;388(10060):2654–2664. doi:10.1016/S0140-6736(16)30354-3
4. Tao Z, Shi A, Li R, Wang Y, Wang X, Zhao J. Microarray bioinformatics in cancer- a review. J BUON. 2017;22(4):838–843.
5. Saito M, Momma T, Kono K. Targeted therapy according to next generation sequencing-based panel sequencing. Fukushima J Med Sci. 2018;64(1):9–14. doi:10.5387/fms.2018-02
6. Harada K, Okamoto W, Mimaki S, et al. Comparative sequence analysis of patient-matched primary colorectal cancer, metastatic, and recurrent metastatic tumors after adjuvant FOLFOX chemotherapy. BMC Cancer. 2019;19(1):255. doi:10.1186/s12885-019-5479-6
7. Zhao B, Baloch Z, Ma Y, et al. Identification of potential key genes and pathways in early-onset colorectal cancer through bioinformatics analysis. Cancer Control. 2019;26(1):1073274819831260. doi:10.1177/1073274819831260
8. Cojocneanu R, Braicu C, Raduly L, et al. Plasma and tissue specific miRNA expression pattern and functional analysis associated to colorectal cancer patients. Cancers. 2020;12(4):843. doi:10.3390/cancers12040843
9. Shimizu M, Saitoh Y, Itoh H. Immunohistochemical staining of Ha-ras oncogene product in normal, benign, and malignant human pancreatic tissues. Hum Pathol. 1990;21(6):607–612. doi:10.1016/S0046-8177(96)90006-4
10. Japanese Gastric Cancer Association. Japanese gastric cancer treatment guidelines 2018 (5th edition). Gastric Cancer. 2021;24(1):1–21. doi:10.1007/s10120-020-01042-y
11. Khan U, Shah MA. Ramucirumab for the treatment of gastric or gastro-esophageal junction cancer. Expert Opin Biol Ther. 2019;19(11):1135–1141. doi:10.1080/14712598.2019.1656715
12. Vrana D, Matzenauer M, Neoral C, et al. From tumor immunology to immunotherapy in gastric and esophageal cancer. Int J Mol Sci. 2018;20(1). doi:10.3390/ijms20010013
13. Winkler J, Abisoye-Ogunniyan A, Metcalf KJ, Werb Z. Concepts of extracellular matrix remodelling in tumour progression and metastasis. Nat Commun. 2020;11(1):5120. doi:10.1038/s41467-020-18794-x
14. Sun X, Wu B, Chiang HC, et al. Tumour DDR1 promotes collagen fibre alignment to instigate immune exclusion. Nature. 2021;599(7886):673–678. doi:10.1038/s41586-021-04057-2
15. Xu Y, Zhang X, Hu X, et al. The effects of lncRNA MALAT1 on proliferation, invasion and migration in colorectal cancer through regulating SOX9. Mol Med. 2018;24(1):52. doi:10.1186/s10020-018-0050-5
16. Miyake M, Hori S, Morizawa Y, et al. Collagen type IV alpha 1 (COL4A1) and collagen type XIII alpha 1 (COL13A1) produced in cancer cells promote tumor budding at the invasion front in human urothelial carcinoma of the bladder. Oncotarget. 2017;8(22):36099–36114. doi:10.18632/oncotarget.16432
17. Huang R, Gu W, Sun B, Gao L. Identification of COL4A1 as a potential gene conferring trastuzumab resistance in gastric cancer based on bioinformatics analysis. Mol Med Rep. 2018;17(5):6387–6396. doi:10.3892/mmr.2018.8664
18. Lund-Andersen C, Torgunrud A, Fleten KG, Flatmark K. Omics analyses in peritoneal metastasis-utility in the management of peritoneal metastases from colorectal cancer and pseudomyxoma peritonei: a narrative review. J Gastrointest Oncol. 2021;12(Suppl 1):S191–S203. doi:10.21037/jgo-20-136
19. Giulietti M, Occhipinti G, Righetti A, et al. Emerging biomarkers in bladder cancer identified by network analysis of transcriptomic data. Front Oncol. 2018;8:450. doi:10.3389/fonc.2018.00450
20. He J, Wu F, Han Z, et al. Biomarkers (mRNAs and Non-Coding RNAs) for the diagnosis and prognosis of colorectal cancer - from the body fluid to tissue level. Front Oncol. 2021;11:632834. doi:10.3389/fonc.2021.632834
 © 2023 The Author(s). This work is published and licensed by Dove Medical Press Limited. The full terms of this license are available at https://www.dovepress.com/terms.php and incorporate the Creative Commons Attribution - Non Commercial (unported, v3.0) License.
By accessing the work you hereby accept the Terms. Non-commercial uses of the work are permitted without any further permission from Dove Medical Press Limited, provided the work is properly attributed. For permission for commercial use of this work, please see paragraphs 4.2 and 5 of our Terms.
© 2023 The Author(s). This work is published and licensed by Dove Medical Press Limited. The full terms of this license are available at https://www.dovepress.com/terms.php and incorporate the Creative Commons Attribution - Non Commercial (unported, v3.0) License.
By accessing the work you hereby accept the Terms. Non-commercial uses of the work are permitted without any further permission from Dove Medical Press Limited, provided the work is properly attributed. For permission for commercial use of this work, please see paragraphs 4.2 and 5 of our Terms.