Back to Journals » International Journal of General Medicine » Volume 16
Integrated Bioinformatics Analysis for the Identification of Key lncRNAs, mRNAs, and Potential Drugs in Clear Cell Renal Cell Carcinomas
Authors Liu S, Shi G, Pan Z, Cheng W, Xu L, Lin X, Lin Y, Zhang L, Ji G, Lv X, Wang D ![]()
Received 8 March 2023
Accepted for publication 18 May 2023
Published 29 May 2023 Volume 2023:16 Pages 2063—2080
DOI https://doi.org/10.2147/IJGM.S409711
Checked for plagiarism Yes
Review by Single anonymous peer review
Peer reviewer comments 2
Editor who approved publication: Dr Scott Fraser
Sheng Liu,1,* Guanyun Shi,1 Zhengbo Pan,1 Weisong Cheng,1 Linfei Xu,1 Xingzhang Lin,1 Yongfeng Lin,1 Liming Zhang,1 Guanghua Ji,1 Xin Lv,1 Dongguo Wang2,*
1Department of Urinary Surgery, Taizhou Municipal Hospital Affiliated with Taizhou University, Taizhou, Zhejiang Province, People’s Republic of China; 2Department of Central Laboratory, Taizhou Municipal Hospital Affiliated with Taizhou University, Taizhou, Zhejiang Province, People’s Republic of China
*These authors contributed equally to this work
Correspondence: Dongguo Wang, Department of Central Laboratory, Taizhou Municipal Hospital Affiliated with Taizhou University, 381-1 Eastern Road of Zhongshan, Taizhou, Zhejiang Province, 318000, People’s Republic of China, Tel +86-13566871738, Email [email protected]
Purpose: The overall survival of clear cell renal cell carcinoma (ccRCC) is poor. Markers for early detection and progression could improve disease outcomes. This study aims to reveal the potential pathogenesis of ccRCC by integrative bioinformatics analysis and to further develop new therapeutic strategies.
Patients and Methods: RNA-seq data of 530 ccRCC cases in TCGA were downloaded, and a comprehensive analysis was carried out using bioinformatics tools. Another 14 tissue samples were included to verify the expression of selected lncRNAs by qRT-PCR. DGIdb database was used to screen out potential drugs, and molecular docking was used to explore the interaction and mechanism between candidate drugs and targets.
Results: A total of 58 differentially expressed lncRNAs (DElncRNAs) and 660 differentially expressed mRNAs (DEmRNAs) were identified in ccRCC. LINC02038, FAM242C, LINC01762, and PVT1 were identified as the optimal diagnostic lncRNAs, of which PVT1 was significantly correlated with the survival rate of ccRCC. GO analysis of cell components showed that DEmRNAs co-expressed with 4 DElncRNAs were mainly distributed in the extracellular area and the plasma membrane, involved in the transport of metal ions, the transport of proteins across membranes, and the binding of immunoglobulins. Immune infiltration analysis showed that MDSC was the most correlated immune cells with PVT1 and key mRNA SIGLEC8. Validation analysis showed that GABRD, SIGLEC8 and CDKN2A were significantly overexpressed, while ESRRB, ELF5 and UMOD were significantly down-regulated, which was consistent with the expression in our analysis. Furthermore, 84 potential drugs were screened by 6 key mRNAs, of which ABEMACICLIB and RIBOCICLIB were selected for molecular docking with CDKN2A, with stable binding affinity.
Conclusion: In summary, 4 key lncRNAs and key mRNAs of ccRCC were identified by integrative bioinformatics analysis. Potential drugs were screened for the treatment of ccRCC, providing a new perspective for disease diagnosis and treatment.
Keywords: clear cell renal cell carcinoma, bioinformatics analysis, lncRNA, mRNA, drugs prediction, molecular docking
Introduction
Renal cell carcinoma (RCC) is the second leading cause of death related to urinary system malignancy, and about 75% of RCCs are clear cell RCC (ccRCC).1–3 Histologically, ccRCC cells have a clear cytoplasm, with cell clusters arranged in nests, surrounded by a fine vascular network.4,5 Currently, patients with ccRCC can use a variety of clinical management methods in the early stage, including surgery and radiotherapy. The 5-year survival rate after diagnosis has improved to some extent. However, the overall survival (OS) is still very poor, especially for patients in the advanced stage, mainly due to the lack of more effective treatments.6 Therefore, it is urgent to understand the underlying pathological mechanism of ccRCC more comprehensively and to further develop new therapeutic strategies.
The rapid development of genomics and transcriptomics has highlighted the important role of non-coding RNA in tumors. Long non-coding RNAs (lncRNAs), RNA molecules with more than 200 nucleotides in length, do not encode proteins.7 LncRNA plays important roles in cell growth, apoptosis, migration, invasion and autophagy, and other cellular processes.8–10 Compelling data suggest specific lncRNA promotes the development of human cancer. For example, lncRNA HOTAIR is highly expressed in breast cancer samples, and the increased expression is associated with metastasis and death of patients. LncRNA TUG1 acts as a potential biomarker and therapeutic target in bladder urothelial carcinoma.11 Xie et al12 indicated lncRNA SPRY4-IT1 was up-regulated in esophageal squamous cell carcinoma, which is significantly related to clinicopathological staging and OS rate.
The database represented by TCGA provides an ideal opportunity for researchers to comprehensively explore the molecular mechanisms of tumorigenesis of various cancers, identify new therapeutic targets and prognostic molecular markers. In order to reveal the potential pathogenesis of ccRCC, RNA-seq data of 530 ccRCC cases in TCGA were downloaded, and a comprehensive analysis was carried out using bioinformatics tools. The machine learning methods were used to construct three machine learning models of ccRCC, survival analysis of related lncRNA was carried out, and the co-expression network of lncRNA-mRNA was constructed to identify potential therapeutic targets or prognostic biomarkers in ccRCC. In addition, potential drugs were screened through DGIdb database, and molecular docking was conducted to explore the interaction between candidate drugs and targets to further develop new therapeutic strategies of ccRCC.
Materials and Methods
Patients and Samples
RNA-seq data and clinical information were collected from the TCGA database. The inclusion criteria are as follows: (1) patients were histopathologically diagnosed with ccRCC; (2) patients had complete demographic data, including age, life status, race, pathological stage, TNM classification, and OS time. A total of 530 ccRCC samples and 72 adjacent non-tumor samples were included. Demographic data of included ccRCC patients is listed in Table 1.
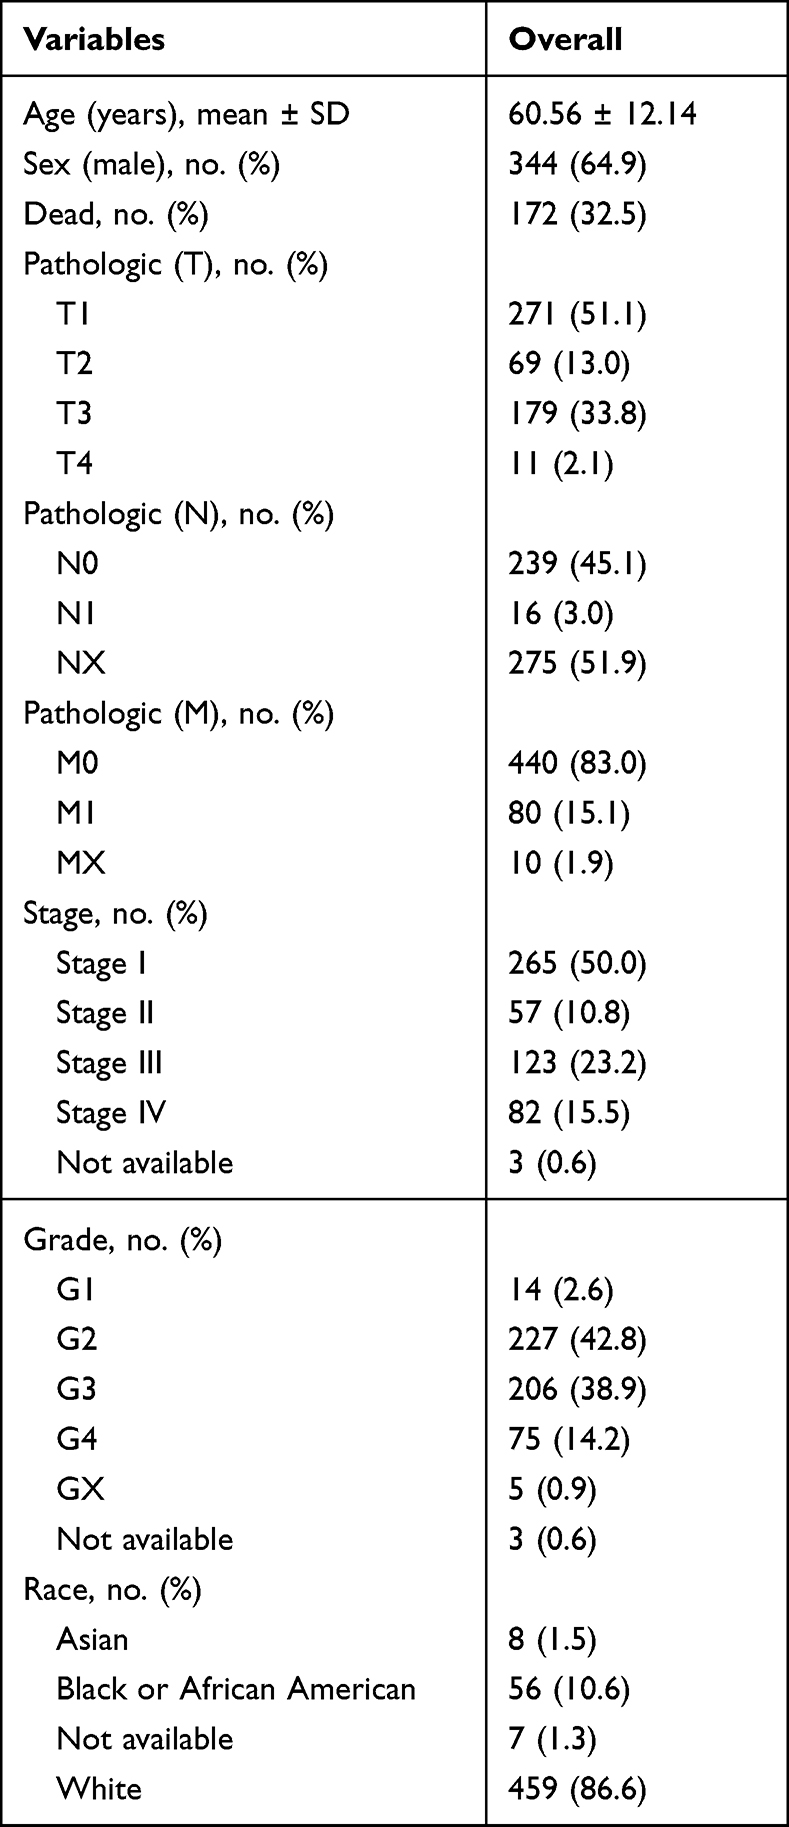 |
Table 1 Demographic Data of 530 ccRCC Cases |
RNA-Seq Data Analysis
The original data of lncRNA and mRNA were processed. More than 20% of the samples with expression value of 0 were filtered out for mRNAs. The lncRNA and mRNA were normalized through Voom and TNM normalization methods. All analyses were performed in R software (version 3.5.2). The Limma package (version 3.36.5) was applied to analyze differentially expressed mRNAs (DEmRNAs) and differentially expressed lncRNAs (DElncRNAs) in ccRCC and adjacent non-tumor samples. Statistical significance was set as log2 fold change (FC) >3, and mRNA/lncRNA with the false discovery rate (FDR) <0.05.
Functional Enrichment Analysis
In addition to the Kyoto Encyclopedia of Genes and Genomes (KEGG) signaling pathway analysis, gene ontology (GO) functional enrichment analysis based on biological process, cellular component, and molecular function was also carried out. Functional enrichment analysis on DEmRNAs was performed using the David database. The ggplot2 package in the R software was used to visualize the results.
Immune Cell Infiltration Analysis and Screening of Key Immune Cells
The single sample gene set enrichment analysis (ssGSEA) algorithm was used to quantify the relative abundance of each cell infiltration in the tumor immune microenvironment (TIME) of ccRCC. From Charoentong’s research, the gene set of labeled infiltrating immune cell type in TIME was obtained, which is rich in a variety of human immune cell subtypes.13,14 Enrichment score calculated by ssGSEA analysis was used to represent the relative abundance of TIME infiltrating cells in each sample. The difference of immune cell infiltration between the normal tissue group and the ccRCC group was analyzed by the Wilcoxon test hypothesis test. To reduce the number of immune cell variables, the key immune cells were screened from the obtained differential immune cells, and the operator LASSO in minimum absolute contraction and selection regression analysis of the R software “glmnet” package was used.
Feature Selection and Modeling
Machine learning algorithm modeling was used to identify lncRNA biomarkers that were most suitable for ccRCC diagnosis. Through the regression analysis of the least absolute contraction and selection operator (LASSO) of the glmnet package (version 2.0.18) in R,15 key mRNAs were screened from the DElncRNAs. The DElncRNAs were selected by LASSO in descending order according to the value of the average decreasing accuracy through the random forest algorithm in the R package randomForest (version 4.6.14). The random forest algorithm and the top-down method of 10 cross-validations were used, and one DElncRNAs was added each time to obtain the optimal number of features. Finally, classification models of random forest, support vector machine (e1071, version 1.1.7), and decision tree (rpart, version 4.1.15) were established, respectively. The diagnostic capabilities of the three models and each lncRNA biomarker were evaluated by the receiver operating characteristic (ROC) curve. The area under the curve (AUC) was the evaluation indicator of model performance.
RNA Extraction and Quantitative Real-Time PCR (qRT-PCR)
To further verify the expression of selected lncRNAs, another 14 tissue samples, including 7 ccRCC tissues and 7 paired adjacent tissue samples, were included. All ccRCC samples were pathologically confirmed and had no other malignant tumors or autoimmune diseases. These patients did not receive radiotherapy, chemotherapy, immunotherapy, or molecular targeted therapy before the diagnosis. A total of 50 to 100 mg of tumor tissues were lysed by TRIzol reagent. Total RNA was extracted and purified with the ethanol protocol reported previously.16 After checking the purity and integrity of RNA, a total of 1 μg RNA was reverse transcribed using the FastKing cDNA reverse transcription kit (#KR116, TIANGEN, China) according to the manufacturer’s instruction. The expression was quantitatively reversed by reverse transcription PCR (qRT-PCR) by SYBR Green SuperReal PreMix Plus and the SuperReal enhanced fluorescence quantitative premixed reagent systems (#FP205, TIANGEN, China). GADPH and ACTB served as control. The data obtained were calculated by the formula relative quantification (RQ) = 2− ΔΔ CT method by ABI 7300 fluorescence quantitative PCR instrument (Thermo Fisher Scientific, USA). The used primers are listed in Supplementary Table 1. The reaction conditions were 95°C for 15 min, 95°C for 10s, 55°C for 30s and 72°C for 32s for 40 cycles.
The obtained tissue sample was approved by the ethics committee of Taizhou Municipal Hospital Affiliated with Taizhou University (LW113). The informed consent was obtained from each patient and their families for clinical data use and publication.
Correlation Analysis Between the Optimal Diagnostic lncRNAs and Clinical Features
To explore the correlation between clinical characteristics and the optimal diagnostic lncRNAs, the rank-sum test was used to analyze their expressions in adjacent non-tumor samples and tumors with different stages and grades. Finally, a violin chart was used to show the relationship between the optimal diagnostic lncRNAs and clinical features. In addition, the Kaplan–Meier plotter database was used to conduct a survival analysis of the optimal diagnostic lncRNAs.
Co-Expression Analysis of the Optimal Diagnostic lncRNAs and DEmRNAs
The correlation analysis between the optimal diagnostic lncRNAs and DEmRNAs was carried out to construct the lncRNA-mRNA co-expression network. The Pearson correlation coefficient was calculated. Coefficient with cor > 0.6 and P < 0.01 was considered as significant correlation. The bioinformatics software Cytoscape (version 3.7.2) was used to construct the co-expression network, and the degree of centrality was used to reveal the relative importance of mRNA/lncRNA in network analysis.
Functional Analysis of Co-Expressed DEmRNAs with the Optimal Diagnostic lncRNAs
GO and KEGG pathway enrichment on the co-expressed DEmRNAs with the optimal diagnostic lncRNAs was performed. The David database was used for enrichment analysis, and the results were visualized using the ggplot2 package of R software.
Prediction of ccRCC-Associated Drugs and Molecular Docking
The drug prediction of ccRCC was based on Drug-Gene Interaction Database (DGIdb), which is a web source that helps discover drug–gene interactions. The key genes were imported into DGIdb (https://dgidb.org/) database to screen out potential drugs. In this study, the final drug list included only drugs that were approved by the Food and Drug Administration (FDA).
Molecular docking is a computational approach that “dock” small molecules into the structures of macromolecular targets and “score” their potential complementarity to binding sites. RSCBPDB is a database, which has Countless gene targets. The target was imported into the RSCBPDB (http://www.rcsb.org/pdb/home/home.do) database to download the 3D structures of target protein, and the 3D structures of the drugs were downloaded from the PubChem database (https://pubchem.ncbi.nlm.nih.gov/). The protein and drug molecules were pretreated in AutoDockTools-1.5.6, a molecular docking software based on the principle of semi-flexibility,17 respectively, and molecular docking is calculated. The binding energy was used as a reference for docking results to screen the most active ligand molecules and target genes. The smaller the binding energy, the more stable the binding between ligand and receptor, and the binding energy less than 0 means that ligand and receptor can spontaneously bind. Via PyMOL, a software for pre-docking of small-molecule components and proteins,3 the high-quality 3D structures of small molecules and proteins were created, and the corresponding protein residues and binding bonds were displayed. It is generally believed that the binding capacity is stronger when the binding energy was less than −5.0 kJ/mol.18
Results
Identification of DElncRNAs and DEmRNAs
Analysis results showed that a total of 58 (27 up-regulated and 31 down-regulated) DElncRNAs (Figure 1A) and 660 (207 up-regulated and 453 down-regulated) DEmRNAs (Figure 1B) were identified in ccRCC. The top 10 DElncRNAs and DEmRNAs are listed in Table 2.
 |
Table 2 Top 10 DElncRNAs and Top 10 DEmRNAs in ccRCC |
 |
Figure 1 Top100 DEmRNAs and all DElncRNAs in ccRCC. (A) All DElncRNAs demonstrated by heat map (left) and volcano plot (right); (B) the top 100 DEmRNAs demonstrated by heat map (left) and volcano plot (right). |
GO Enrichment and KEGG Pathway Analysis of DEmRNAs
GO enrichment analysis showed that DEmRNAs were enriched in multiple biological processes, including the immune response, metal ion transport, cell adhesion, the adaptive immune response, inflammatory response, and T cell activation (Figure 2A). In addition, GO analysis of cell component demonstrated DEmRNAs were mainly distributed in the extracellular area and the plasma membrane. GO analysis of molecular function indicated that these DEmRNAs were mainly involved in the transport of metal ions and the transport of proteins across membranes. KEGG pathway analysis showed that DEmRNAs were significantly involved in cytokine and receptor interactions, primary immunodeficiency, PPAR signaling pathway, and arachidonic acid metabolism pathway (Figure 2B).
 |
Figure 2 GO enrichment analysis and KEGG pathway analysis of DEmRNAs in ccRCC. (A) GO enrichment analysis; (B) KEGG pathway analysis. |
Identification of the Optimal Diagnostic lncRNAs
Totally, 12 DElncRNAs were obtained after LASSO selection. The correlation of these 12 DElncRNAs is shown in Figure 3A. Twelve DElncRNAs were sorted according to the average decreasing precision (Figure 3B). The result of 10-fold cross-validation showed that when the number of lncRNA was 4, the accuracy was the highest (Figure 3C). Therefore, the top 4 DElncRNAs were selected as the optimal diagnostic lncRNAs. Hierarchical clustering of 4 lncRNAs is shown in Figure 3D. The classification model was built using a random forest package, support vector machine, and decision tree of the 4 optimal diagnostic lncRNAs. The AUC of the random forest model was 0.991, with a specificity of 95.8% and a sensitivity of 99.4%. The AUC of the decision tree model was 0.951, with a specificity of 91.7%, and a sensitivity of 98.3%. The AUC of the support vector machine model was 0.983, with a specificity of 97.2% and sensitivity of 99.6% (Figure 4).
 |
Figure 3 Determining process of the optimal diagnostic lncRNAs for ccRCC. (A) Heat map of DElncRNAs selected by LASSO; (B) average decreasing precision sorting of 12 DElncRNAs; (C) accuracy changes with increasing number of lncRNA; (D) heatmaps for the 4 optimal diagnoses of lncRNA. |
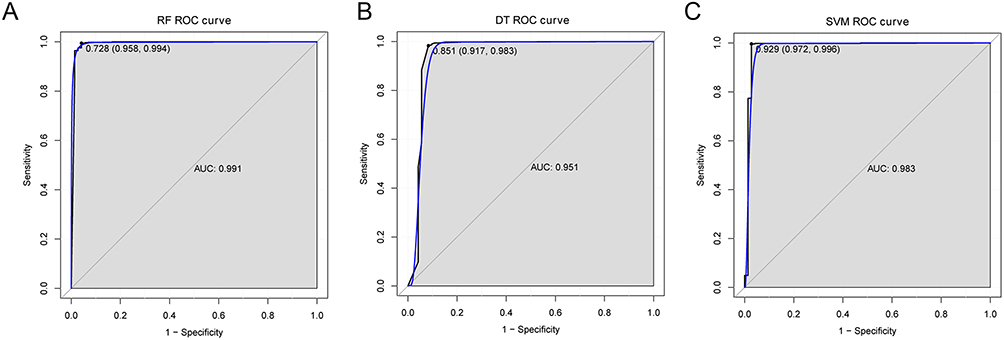 |
Figure 4 ROC curve of decision tree (DT) model (A), random forest (RF) model (B) and support vector machine (SVM) model (C). |
Correlation Analysis Between the Optimal Diagnosis lncRNAs and Clinical Data
In ccRCC tissues, the expression of 3 lncRNAs, FAM242C, LINC01762, and LINC02038 (Figure 5A) was significantly lower than that of adjacent non-tumor tissues, while the expression of PVT1 was significantly higher than that of adjacent non-tumor tissues, whether in the early or late stage of ccRCC. These results were consistent with the analysis results of our clinical samples to verify (Figure 5B). The “maftools” function in R was used to analyze the mutation data of ccRCC, and the mutation of 4 lncRNA and top 10 key mRNA is displayed in Figure 5C. Results showed that only SIGLEC8 and CA9 had mutations in a small number of samples. Survival analysis (Figure 5D) showed that PVT1 was significantly correlated with the survival rate of ccRCC (P= 0.00019), revealing that PVT1 could be used as a prognostic indicator of ccRCC.
 |
Figure 5 The expression of 4 lncRNAs in TCGA data set and collected samples. (A) expressions of FAM242C, LINC01762, LINC02038 and PVT1 in different stages; (B) expression of FAM242C, LINC01762, LINC02038 and PVT1 in clinical samples (up: fold change; down: log2 fold change); (C) waterfall plot of mutation analysis of 4 lncRNAs and top 10 mRNAs; (D) survival analysis of different PVT1 expressions in TCGA data set. *P < 0.05; **P < 0.01; ***P < 0.001; ****P < 0.0001. Abbreviation: ns, not significant. |
Functional Analysis of Co-Expressed DEmRNAs with the Optimal Diagnosis lncRNAs
Totally, 353 DEmRNAs were co-expressed with 4 optimal diagnosis DElncRNAs, resulting in 583 co-expression relationship pairs. The interacting network is shown in Supplementary Figure 1. Among which, PVT1 was the most interacted mRNA (degree = 325), followed by LINC01762 (degree = 220, Supplementary Table 2). These 353 DEmRNAs were annotated by GO and KEGG analysis. GO enrichment analysis showed that co-expressed DEmRNAs were enriched in different biological processes, including the immune response, ion transport, cell proliferation, the adaptive immune response, regulation of lymphocyte activation, and T cell activation (Figure 6A). GO analysis of cell component showed that DEmRNAs were mainly distributed in the extracellular area and the plasma membrane. GO analysis of molecule function indicated that these DEmRNAs were mainly involved in the transport of metal ions, the transport of proteins across membranes, and the binding of immunoglobulins. KEGG enrichment analysis showed that DEmRNAs were significantly involved in cytokine and receptor interactions, primary immunodeficiency, and other metabolic pathways (Figure 6B and Table 3).
 |
Table 3 KEGG Enrichment Analysis of DEmRNAs in the Co-Expression Network |
 |
Figure 6 Functional enrichment of co-expressed DEmRNAs with the optimal diagnostic lncRNAs in ccRCC. (A) GO enrichment analysis of co-expressed DEmRNAs; (B) KEGG enrichment analysis of DEmRNAs. |
Correlation Between Key lncRNAs, Key mRNAs and Key Immune Cells
Immune infiltration analysis showed that there was no significant difference between CD56bright natural killer cell and type 2 T helper cell in the normal group and the ccRCC group. Eosinophil, immature dendritic cell, and type 17 T helper cell had a high degree of infiltration in the normal group, and the other 19 immune cells had a high degree of infiltration in the ccRCC group (Figure 7A). Six immune cells were further screened by LASSO regression, including activated dendritic cell, eosinophil, immature dendritic cell, myeloid-derived suppressor cells (MDSCs), plasmacytoid dendritic cell and type 17 T helper cell. Further analysis explored the correlation between 4 key lncRNAs, 10 key mRNAs and 6 key immune cells. Among the 4 key lncRNAs, PVT1 was associated with 4 key immune cells. Other 3 lncRNAs were related to one or two immune cells, and the correlation between PVT1 and MDSC was the highest with a value of 0.33. Among the 10 mRNAs, SIGLEC8 was correlated with 6 key immune cells, and the correlation between SIGLEC8 and MDSC was the highest (value = 0.68). The correlation results were demonstrated as Cytoscape network (Figure 7B and C).
 |
Figure 7 Correlation between 4 lncRNAs, 10 mRNAs and 6 immune cells. (A) The immune infiltration between normal group and ccRCC group; (B) correlation network between 4 lncRNAs and 6 immune cells; (C) correlation network between 10 mRNAs and 6 immune cells. The blue diamond represents mRNA or lncRNA, the Orange circle represents immune cells, the solid line represents a positive correlation, and the dotted line represents a negative correlation. *P < 0.05; ***P < 0.001; ****P < 0.0001. Abbreviation: ns, not significant. |
Validation Analysis
Verified dataset was downloaded from GSE167573, which included tissue samples from 14 normal controls and 63 patients with RCC. The Wilcoxon test was adopted to analyze the expression of key 4 lncRNAs and 10 mRNAs in the RCC group and the control group. In lncRNA, it was found that PVT1 (Figure 8A) was significantly overexpressed in the RCC group. GABRD, SIGLEC8 and CDKN2A (Figure 8B–D) were significantly overexpressed, while ESRRB, ELF5 and UMOD (Figure 8E–G) were significantly down-regulated in the RCC group, which was consistent with the expression trend in our analysis. In addition, survival analysis was conducted for these genes in the validation set. According to the median expression value of the related genes in each sample, they were divided into high-expression and low-expression groups. Kaplan–Meier was used in R to analyze the impact of these genes in the validation set for survival. Among these genes, we found that the overall survival time of patients with high expressed ELF5, ESRRB, and UMOD (Figure 9A–C) was significantly higher than that those with low expression; while in SPAG4 and CDKN2A (Figure 9D and E) genes, the overall survival time of patients in high-expression group was significantly lower than that in low-expression group.
 |
Figure 8 The expressions of key lncRNAs and key mRNAs in GSE167573 dataset. (A–G) expressions of PVT1, SIGLEC8, CDKN2A, ESRRB, ELF5 and UMOD. *P < 0.05; ****P < 0.0001. Abbreviation: ns, not significant. |
 |
Figure 9 The survival analysis of key lncRNAs and key mRNAs in GSE167573 dataset. (A–E) survival analysis of ELF5, ESRRB, UMOD, SPAG4 and CDKN2A. Expressions are divided into high expression and low expression groups according to the median expression value. |
Prediction of ccRCC-Associated Drugs and Molecular Docking Between Drugs and Key Genes
The aforementioned results prompted us to focus on the therapeutic utility of the key genes. Thus, 6 key genes (GABRD, SIGLEC8, CDKN2A, ESRRB, ELF5, and UMOD) were imported into DGIdb database to obtain the candidate drugs. As demonstrated in Figure 10, four (CDKN2A, ESRRB, GABRD, and UMOD) of the 6 key genes were targeted by the promising 84 candidate drugs that were all approved by the FDA. Most candidate drugs might interact with the GABRD (61/84), followed by CDKN2A (21/84). The interaction types, sources, PMIDs of candidate drugs and key genes are listed in Supplementary Table 3.
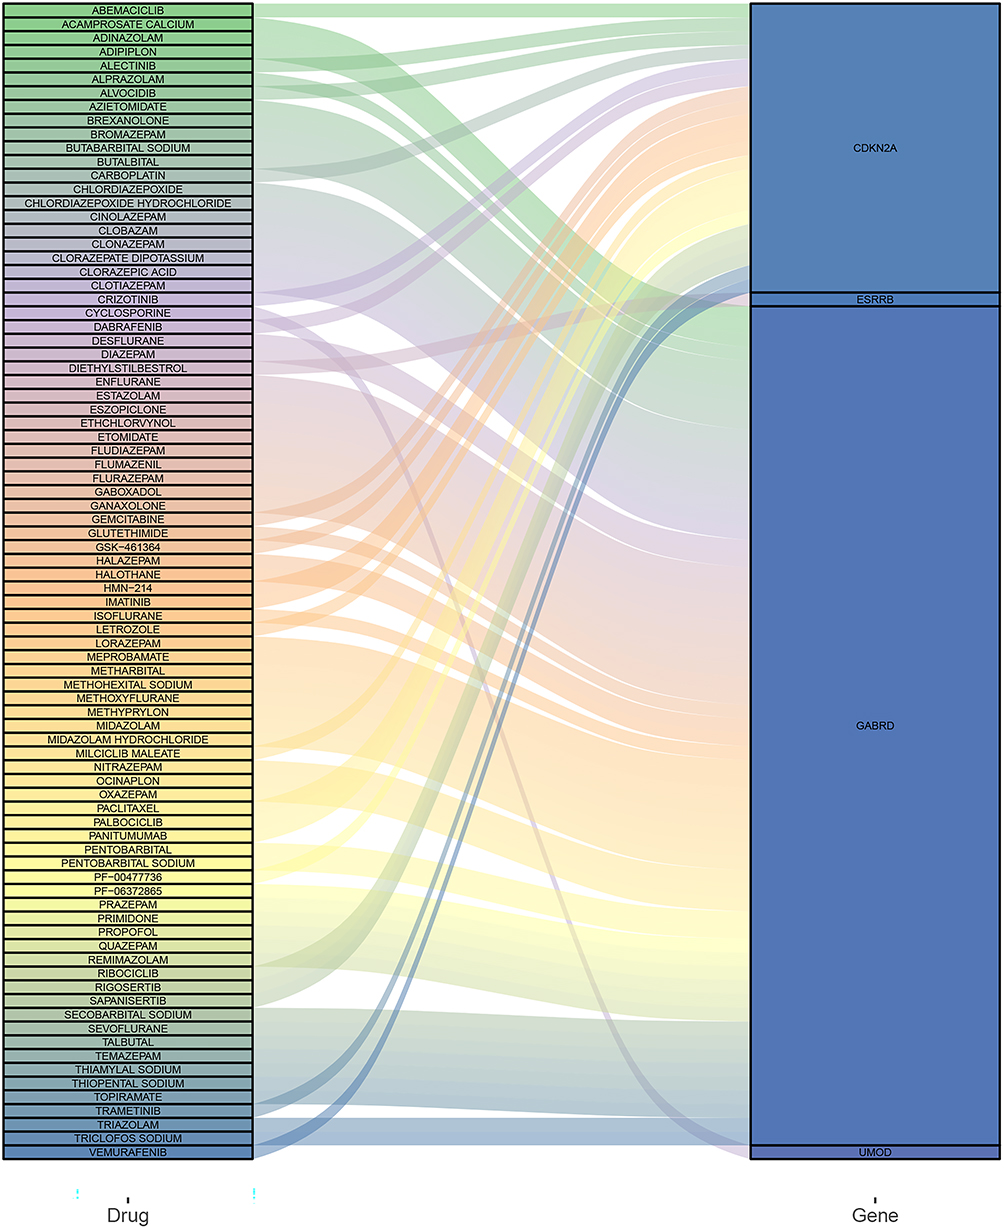 |
Figure 10 Prediction of candidate drugs. |
The impact of GABRD in ccRCC remains unclear, while the mutation of CDKN2A is related to poor prognosis of RCC.19 In order to explore the interaction relationship and mechanism between candidate drugs and targets, two drugs (ABEMACICLIB and RIBOCICLIB) and CDKN2A were selected for molecular docking to calculate their binding energy. The docking results are shown in Figure 11, the binding energy of the two drugs to CDKN2A was lower than −5.0 kJ/mol, and the binding was relatively stable. Among which, the binding energy of ABEMACICLIB and CDKN2A was −7.53 kcal/mol, formed four hydrogen bonds with ASP-105 and ASP-156 residues. The binding energy of RIBOCICLIB and CDKN2A was −6.25 kcal/mol, formed four hydrogen bonds with GLU-88, MET-53 and VAL-51 residues. The conformations with the lowest energy were selected as the optimal conformation by the dock binding free energy, and display the interaction mode between drug molecules and core targets (Figure 11).
 |
Figure 11 The three-dimensional structures of the candidate drugs and key genes based on molecular docking. |
Discussion
CcRCC is a common cancer of the urogenital system. Even with proper treatment, it is also prone to unpredictable metastasis. Unfortunately, the 5-year survival rate of ccRCC is less than 10%.20 Accurate classification plays important roles in guiding the clinical diagnosis and treatment of tumors. Traditionally, the classification, grade, and stage of tumors are mainly judged according to histopathological characteristics, which are used to guide the formulation of treatment plans and predict the prognosis of patients. However, traditional tumor classification methods are not completely accurate in judging the prognosis and guiding the treatment of patients. Even if patients with the same classification adopt the same treatment scheme, the prognosis may vary greatly. The tumor is a complex disease with high heterogeneity at the molecular level. Tumor cells usually have abnormal changes in the genome, epigenetic group, transcriptome, and protein level. The diagnosis and even typing based on the molecular characteristics of tumor cells can be more objectively and accurately reflect the internal essential characteristics of tumor occurrence and development. The research on the internal molecular mechanism of tumors is also important for predicting the prognosis of patients and realizing personalized treatment. Various molecular markers of ccRCC play important roles in clinical practice. MiRNAs are involved in cell proliferation and death, migration, epithelial–mesenchymal transition, tumor invasion and metastasis, and play an important role in the diagnosis, treatment, and prognosis of RCC.21 Cochetti, G et al developed a 7p-urinary score based on urinary miR-122-5p, miR-1271-5p, and miR-15b-5p levels, which is a potential tool for the early diagnosis of ccRCC.22,23 It has been reported that lncRNA is abnormally expressed in renal cell carcinoma, suggesting that it may act as an oncogene or tumor suppressor. In addition, lncRNA may be suitable for the diagnosis of ccRCC and even for predicting prognosis.24,25 TCGA database facilitates the analysis of high-throughput data from different genomic changes, including non-coding RNA. Recently, researchers have developed multiple prognostic models and nomograms of ccRCC based on a combination of tumor stage, grade, subtypes, clinical features, and presentation status, which might provide reliable prognostic evaluation tools for clinician to assist in clinical treatment decisions.26 The nomogram constructed by Zhang et al based on key genes can effectively predict the survival of ccRCC patients at 1, 3, and 5 years, but he only focused on large-scale mRNA sequencing data from the TCGA platform.27 In this study, we analyzed the differential expression of lncRNA and mRNA in 530 ccRCC samples and 72 adjacent non-tumor samples. The DElncRNAs and DEmRNAs were detected by R toolkit, and the machine learning algorithm was used to identify the lncRNA biomarkers most suitable for diagnosis and prognosis of ccRCC. LINC02038, FAM242C, LINC01762, and PVT1 could be used for the optimal diagnostic lncRNA for ccRCC, and they demonstrated high specificity and sensitivity in 3 sets of models. In addition, lncRNAs and mRNAs co-expression analysis and drug prediction were performed, providing a new perspective for the treatment of ccRCC.
CcRCC is essentially a metabolic disease characterized by metabolic reprogramming involving multiple metabolic pathways such as glucose metabolism and pentose phosphate.28,29 CcRCC metabolic reprogramming enables tumor cells to survive under energy deprivation and hypoxia conditions,30 the metabolic flux through glycolysis is partitioned, and mitochondrial bioenergetics and oxidative phosphorylation are impaired, as well as lipid metabolism.31–34 Notably, many lncRNAs such as PVT1 are involved in the regulation of metabolic pathways and can be used as diagnostic and prognostic biomarkers of ccRCC. PVT1 is located on human chromosome 8q24. In a meta-analysis of 9972 cancer patients, He et al35 found that the expression of PVT1 in tumor tissues was higher than in paired non-cancer tissues and was related to a poorer prognosis in cancer patients. Consistent with their research, our analysis showed that the expression of PVT1 was significantly up-regulated in ccRCC and further increased with the increase of clinical stage. Its expression was negatively correlated with the OS of ccRCC patients. In addition, our study also demonstrated that the cytokine–cytokine receptor interaction pathway was one of the KEGG enrichment of DEmRNAs. Moreover, PVT1 was involved in this pathway. This is consistent with the current research that PVT1 is widely involved in the regulation of a variety of tumors.36 Zhang et al37 recently reported that PVT1 promoted ccRCC development by stabilizing hypoxia-inducible transcription factor 2α (HIF2α), one of the core hypoxia-inducible factors, and HIF2α further regulated the expression of downstream genes after entering the nucleus. The results of immune infiltration analysis showed that PVT1 was associated with 4 key immune cells. These results suggest that PVT1 may be involved in the disease process of ccRCC extensively. Linc02038 is located on human chromosome 3q12. At present, there are few reports on its role in tumors. In an RNA-Seq and miRNA-Seq data analysis, Chen et al38 revealed LINC02038 and AC104823.1 were positively correlated with OS of patients with colorectal cancer. The function of LINC01762, FAM242C, and LINC02038 is not clear yet; however, they are related to one or two immune cells. This suggests that these lncRNAs may be involved in the process of immune regulation of ccRCC. The co-expression network showed that LINC01762 interacted more with DEmRNAs, suggesting that we can pay more attention to this lncRNA in later research to clarify its function or role in ccRCC. Our research also indicated that lncRNA PVT1 and mRNA SIGLEC8 were highly correlated with MDSC. MDSC plays an important role in tumor-mediated immune evasion. Guan et al39 elucidated that the accumulation of MDSC subsets might be associated with cytokine-induced migration in RCC. Combined with our results, PVT1 may play important roles in the diagnosis and disease progression of ccRCC.
CA9 is a cell surface glycoprotein and a tumor-associated antigen overexpressed in almost all ccRCC following hypoxia.40 CA9 catalyzes the conversion of carbon dioxide and water to bicarbonate and hydrogen ions, which promotes cell survival under hypoxic conditions.41 Our results showed that CA9 expression was significantly up-regulated, and this up regulation may be the result of transmembrane transport in response to up-regulated proteins. Expression of SPAG4 is up-regulated in RCC via the HIF and could be observed within the nucleolus.42 This is consistent with the reported mechanism of RCC;43 hypoxia and hypoxia-related pathways play a critical role in the development and progress of RCC.44 It is demonstrated that mutation of CDKN2A is related to poor prognosis of RCC.19 Our study showed that CDKN2A was up-regulated in ccRCC, while whether this high expression was caused by mutation needs to be further confirmed by follow-up studies. Consistent with the previous report,45 we found that ELF5 was down-regulated in RCC, suggesting that it can be used as a tumor suppressor in the kidney. This finding deserves further research verification to explore its protective role in ccRCC. In contrast, the impact of GABRD, SIGLEC8, MFSD4A, ACP3, ESRRB, and UMOD in ccRCC remains unclear, which needs to be clarified in the follow-up study.
Abnormal blood vessels supplying and impaired blood flow are the main characters of the solid tumor. During the formation of tumors, cancer cells release various cytokines and growth factors around and reprogram many other types of cells to establish a tumor microenvironment.46 These cytokines regulate the expression of downstream genes after entering the nucleus,47 which further results in the occurrence of mutant cancer cells and impairs the effectiveness of the immune system in attacking cancer cells.48 Our functional enrichment analysis showed that the DEmRNAs were mainly involved in the cytokine–cytokine receptor interaction pathway and immunodeficiency pathway. Also, the kidney is an important organ for energy metabolism and regulation in the human body. RCC will lead to abnormal regulation and metabolism of sodium in the kidney. In accordance with Qi’s report,49 our results demonstrated that the DEmRNAs were rich in aldosterone-regulated sodium reabsorption. Therefore, we speculate that these mRNA enrichment pathways, including aldosterone-regulated sodium reabsorption, are mainly caused by ccRCC. On the other hand, our validation results did not show the survival difference of PVT1 in the high- and low-expression group. The sample size of the validation data set is relatively small, which may be the main reason for the absence of the survival difference. Thus, further studies are needed to identify possible molecular interactions between the current reported lncRNAs and mRNAs in ccRCC. In particular, DElncRNAs and DEmRNAs with unclear functions can provide more choices for the treatment of ccRCC.
In addition to the bioinformatics database analysis, drug repurposing was also investigated via structure exploration, hoping to provide a new perspective for disease diagnosis, treatment and research. Molecular docking is computational approaches that dock small molecules into the structures of macromolecular targets and scores their potential complementarity to binding sites through computer simulation.50 In this study, DGIdb database was used to identify several potential drugs with therapeutic efficacy on ccRCC key genes, and molecular docking was used to explore the interaction and mechanism between candidate drugs and targets. A total of 84 candidate drugs were screened out by 4 key genes (CDKN2A, ESRRB, GABRD, and UMOD). Among candidate drugs, Cyclosporine A has been shown to reverse multidrug resistance in renal cell carcinoma cell lines in vitro.51 ABEMACICLIB causes decreased cellular viability, increased apoptosis, and alterations in autophagy in renal cell carcinoma cell lines.52 RIBOCICLIB enhanced chemotherapy and immunotherapy of RCC by inhibiting CDK4/6-Cyclin D-Rb pathway.53 ABEMACICLIB and RIBOCICLIB were selected for molecular docking with CDKN2A, and the results showed that two drugs had stable binding affinity with CDKN2A. The bioinformatics database analysis and molecular docking were used to provide a novel perspective for ccRCC.
Our study has some limitations. Firstly, the sample size of the validation dataset is relatively small, which may be the main reason why there is no survival difference between the high-expression and low-expression groups of PVT1. Therefore, further studies are needed to identify possible molecular interactions between the current reported lncRNAs and mRNAs in ccRCC. Furthermore, this study identified several potential drugs with therapeutic effects on key ccRCC genes, and additional studies and clinical trials are needed to identify and explore the drugs that are effective for ccRCC treatment in future.
Conclusion
In summary, our study constructed machine learning models in ccRCC by machine learning method and found that the survival of patients with ccRCC was related to lncRNA PVT1. Furthermore, DEmRNAs were mainly involved in hypoxia and hypoxia-related pathways. The lncRNA-mRNA co-expression network demonstrated that cytokine–cytokine receptor interaction and immunodeficiency were two main KEGG enrichments of DEmRNAs in the co-expression network. A total of 84 candidate drugs were screened out by 6 key genes, of which ABEMACICLIB and RIBOCICLIB were selected for molecular docking with CDKN2A, with stable binding affinity with CDKN2A. In the future, the molecular mechanism of the DelncRNAs and mRNAs in ccRCC are needed to further explore for early detection, prognosis judgment, risk assessment and targeted therapy of ccRCC.
Abbreviations
AUC, area under the curve; ccRCC, clear cell renal cell carcinoma; DElncRNAs, differentially expressed lncRNAs; DEmRNAs, differentially expressed mRNAs; FDR, false discovery rate; GO, gene ontology; HIF2α, hypoxia-inducible transcription factor 2α; KEGG, Kyoto Encyclopedia of Genes and Genomes; LASSO, least absolute contraction and selection operator; lncRNAs, long non-coding RNAs; MDSCs, myeloid-derived suppressor cells; OS, overall survival; PVT1, plasmacytoma variant translocation 1; qRT-PCR, quantitative real-time PCR; ROC, receiver operating characteristic; RQ, relative quantification; RCC, renal cell carcinoma; ssGSEA, single sample gene set enrichment analysis; TCGA, the Cancer Genome Atlas; TIME, tumor immune microenvironment.
Data Sharing Statement
All data generated or analysed during this study are included in this article.
Ethics Approval and Informed Consent
The obtained tissue sample was approved by the ethics committee of Taizhou Municipal Hospital (LW113). The procedures used in this study adhere to the tenets of the Declaration of Helsinki. All methods were carried out in accordance with relevant guidelines and regulations. The informed consent was obtained from each patient and their families for clinical data use and publication.
Consent for Publication
The subjects gave written informed consent for the publication of any associated data and accompanying images.
Funding
There is no funding to report.
Disclosure
All authors declare that they have no conflicts of interest in this work.
References
1. Sung H, Ferlay J, Siegel RL, et al. Global cancer statistics 2020: GLOBOCAN estimates of incidence and mortality worldwide for 36 cancers in 185 countries. CA Cancer J Clin. 2021;71(3):209–249. doi:10.3322/caac.21660
2. Hsieh JJ, Purdue MP, Signoretti S, et al. Renal cell carcinoma. Nat Rev Dis Primers. 2017;3:17009. doi:10.1038/nrdp.2017.9
3. Baugh EH, Lyskov S, Weitzner BD, et al. Real-time PyMOL visualization for Rosetta and PyRosetta. PLoS One. 2011;6(8):e21931. doi:10.1371/journal.pone.0021931
4. Jonasch E, Gao J, Rathmell WK. Renal cell carcinoma. BMJ. 2014;349:g4797. doi:10.1136/bmj.g4797
5. Moch H, Cubilla AL, Humphrey PA, et al. The 2016 WHO classification of tumours of the urinary system and male genital organs-part A: renal, Penile, and Testicular Tumours. Eur Urol. 2016;70(1):93–105. doi:10.1016/j.eururo.2016.02.029
6. Qu L, Wang ZL, Chen Q, et al. Prognostic value of a long non-coding RNA signature in localized clear cell renal cell carcinoma. Eur Urol. 2018;74(6):756–763. doi:10.1016/j.eururo.2018.07.032
7. Braga EA, Fridman MV, Filippova EA, et al. LncRNAs in the regulation of genes and signaling pathways through miRNA-mediated and other mechanisms in clear cell renal cell carcinoma. Int J Mol Sci. 2021;22(20):11193. doi:10.3390/ijms222011193
8. Shi SJ, Wang LJ, Yu B, et al. LncRNA-ATB promotes trastuzumab resistance and invasion-metastasis cascade in breast cancer. Oncotarget. 2015;6(13):11652–11663. doi:10.18632/oncotarget.3457
9. Arase M, Horiguchi K, Ehata S, et al. Transforming growth factor-beta-induced lncRNA-Smad7 inhibits apoptosis of mouse breast cancer JygMC(A) cells. Cancer Sci. 2014;105(8):974–982. doi:10.1111/cas.12454
10. Gibb EA, Brown CJ, Lam WL. The functional role of long non-coding RNA in human carcinomas. Mol Cancer. 2011;10:38. doi:10.1186/1476-4598-10-38
11. Han Y, Liu Y, Gui Y, et al. Long intergenic non-coding RNA TUG1 is overexpressed in urothelial carcinoma of the bladder. J Surg Oncol. 2013;107(5):555–559. doi:10.1002/jso.23264
12. Xie HW, Wu QQ, Zhu B, et al. Long noncoding RNA SPRY4-IT1 is upregulated in esophageal squamous cell carcinoma and associated with poor prognosis. Tumour Biol. 2014;35(8):7743–7754. doi:10.1007/s13277-014-2013-y
13. Charoentong P, Finotello F, Angelova M, et al. Pan-cancer immunogenomic analyses reveal genotype-immunophenotype relationships and predictors of response to checkpoint blockade. Cell Rep. 2017;18(1):248–262. doi:10.1016/j.celrep.2016.12.019
14. Barbie DA, Tamayo P, Boehm JS, et al. Systematic RNA interference reveals that oncogenic KRAS-driven cancers require TBK1. Nature. 2009;462(7269):108–112. doi:10.1038/nature08460
15. Friedman J, Hastie T, Tibshirani R. Regularization paths for generalized linear models via coordinate descent. J Stat Softw. 2010;33(1):1–22. doi:10.18637/jss.v033.i01
16. Green MR, Sambrook J. Precipitation of RNA with Ethanol. Cold Spring Harb Protoc. 2020;2020(3):101717. doi:10.1101/pdb.prot101717
17. El-Hachem N, Haibe-Kains B, Khalil A, et al. AutoDock and AutoDockTools for protein-ligand docking: beta-site amyloid precursor protein cleaving enzyme 1(BACE1) as a case study. Methods Mol Biol. 2017;1598:391–403. doi:10.1007/978-1-4939-6952-4_20
18. Liu S, Wang R, Lou Y, et al. Uncovering the mechanism of the effects of pien-tze-huang on liver cancer using network pharmacology and molecular docking. Evid Based Complement Alternat Med. 2020;2020:4863015. doi:10.1155/2020/4863015
19. Sun Q, Chen S, Hou Y, et al. Mutant CDKN2A regulates P16/p14 expression by alternative splicing in renal cell carcinoma metastasis. Pathol Res Pract. 2021;223:153453. doi:10.1016/j.prp.2021.153453
20. Chen D, Chen W, Xu Y, et al. Upregulated immune checkpoint HHLA2 in clear cell renal cell carcinoma: a novel prognostic biomarker and potential therapeutic target. J Med Genet. 2019;56(1):43–49. doi:10.1136/jmedgenet-2018-105454
21. Napolitano L, Orecchia L, Giulioni C, et al. The role of miRNA in the management of localized and advanced renal masses, a narrative review of the literature. Appl Sci. 2023;13(1):275. doi:10.3390/app13010275
22. Cochetti G, Cari L, Nocentini G, et al. Detection of urinary miRNAs for diagnosis of clear cell renal cell carcinoma. Sci Rep. 2020;10(1):21290. doi:10.1038/s41598-020-77774-9
23. Cochetti G, Cari L, Maulà V, et al. Validation in an Independent Cohort of MiR-122, MiR-1271, and MiR-15b as Urinary biomarkers for the potential early diagnosis of clear cell renal cell carcinoma. Cancers. 2022;14(5):1112. doi:10.3390/cancers14051112
24. Wu Y, Tan C, Weng WW, et al. Long non-coding RNA Linc00152 is a positive prognostic factor for and demonstrates malignant biological behavior in clear cell renal cell carcinoma. Am J Cancer Res. 2016;6(2):285–299.
25. Su H, Sun T, Wang H, et al. Decreased TCL6 expression is associated with poor prognosis in patients with clear cell renal cell carcinoma. Oncotarget. 2017;8(4):5789–5799. doi:10.18632/oncotarget.11011
26. Klatte T, Rossi SH, Stewart GD. Prognostic factors and prognostic models for renal cell carcinoma: a literature review. World J Urol. 2018;36(12):1943–1952. doi:10.1007/s00345-018-2309-4
27. Zhang Z, Lin E, Zhuang H, et al. Construction of a novel gene-based model for prognosis prediction of clear cell renal cell carcinoma. Cancer Cell Int. 2020;20:27. doi:10.1186/s12935-020-1113-6
28. Di Meo NA, Lasorsa F, Rutigliano M, et al. Renal cell carcinoma as a metabolic disease: an update on main pathways, potential biomarkers, and therapeutic targets. Int J Mol Sci. 2022;23(22):14360. doi:10.3390/ijms232214360
29. Bianchi C, Meregalli C, Bombelli S, et al. The glucose and lipid metabolism reprogramming is grade-dependent in clear cell renal cell carcinoma primary cultures and is targetable to modulate cell viability and proliferation. Oncotarget. 2017;8(69):113502–113515. doi:10.18632/oncotarget.23056
30. Lucarelli G, Loizzo D, Franzin R, et al. Metabolomic insights into pathophysiological mechanisms and biomarker discovery in clear cell renal cell carcinoma. Expert Rev Mol Diagn. 2019;19(5):397–407. doi:10.1080/14737159.2019.1607729
31. Lucarelli G, Rutigliano M, Sallustio F, et al. Integrated multi-omics characterization reveals a distinctive metabolic signature and the role of NDUFA4L2 in promoting angiogenesis, chemoresistance, and mitochondrial dysfunction in clear cell renal cell carcinoma. Aging. 2018;10(12):3957–3985. doi:10.18632/aging.101685
32. Lucarelli G, Ferro M, Loizzo D, et al. Integration of lipidomics and transcriptomics reveals reprogramming of the lipid metabolism and composition in clear cell renal cell carcinoma. Metabolites. 2020;10(12):509. doi:10.3390/metabo10120509
33. Di Meo NA, Lasorsa F, Rutigliano M, et al. The dark side of lipid metabolism in prostate and renal carcinoma: novel insights into molecular diagnostic and biomarker discovery. Expert Rev Mol Diagn. 2023;23(4):297–313. doi:10.1080/14737159.2023.2195553
34. Bombelli S, Torsello B, De Marco S, et al. 36-kDa Annexin A3 isoform negatively modulates lipid storage in clear cell renal cell carcinoma cells. Am J Pathol. 2020;190(11):2317–2326. doi:10.1016/j.ajpath.2020.08.008
35. He RQ, Qin MJ, Lin P, et al. Prognostic Significance of LncRNA PVT1 and its potential target gene network in human cancers: a comprehensive inquiry based upon 21 cancer types and 9972 cases. Cell Physiol Biochem. 2018;46(2):591–608. doi:10.1159/000488627
36. Traversa D, Simonetti G, Tolomeo D, et al. Unravelling similarities and differences in the role of circular and linear PVT1 in cancer and human disease. Br J Cancer. 2021;126:835–850. doi:10.1038/s41416-021-01584-7
37. Zhang MX, Zhang LZ, Fu LM, et al. Positive feedback regulation of lncRNA PVT1 and HIF2alpha contributes to clear cell renal cell carcinoma tumorigenesis and metastasis. Oncogene. 2021;40(37):5639–5650. doi:10.1038/s41388-021-01971-7
38. Chen J, Song Y, Li M, et al. Comprehensive analysis of ceRNA networks reveals prognostic lncRNAs related to immune infiltration in colorectal cancer. BMC Cancer. 2021;21(1):255. doi:10.1186/s12885-021-07995-2
39. Guan X, Liu Z, Zhang J, et al. Myeloid-derived suppressor cell accumulation in renal cell carcinoma is correlated with CCL2, IL-17 and IL-18 expression in blood and tumors. Adv Clin Exp Med. 2018;27(7):947–953. doi:10.17219/acem/70065
40. Vergori L, Martinez MC, Bigot P. Circulating large extracellular vesicles carrying CA9 in the diagnosis and prognosis of clear-cell renal cell carcinoma. Clin Transl Med. 2021;11(3):e358. doi:10.1002/ctm2.358
41. Logsdon DP, Grimard M, Luo M, et al. Regulation of HIF1alpha under Hypoxia by APE1/Ref-1 Impacts CA9 expression: dual targeting in patient-derived 3D pancreatic cancer models. Mol Cancer Ther. 2016;15(11):2722–2732. doi:10.1158/1535-7163.MCT-16-0253
42. Knaup KX, Monti J, Hackenbeck T, et al. Hypoxia regulates the sperm associated antigen 4 (SPAG4) via HIF, which is expressed in renal clear cell carcinoma and promotes migration and invasion in vitro. Mol Carcinog. 2014;53(12):970–978. doi:10.1002/mc.22065
43. Cowman SJ, Fuja DG, Liu XD, et al. Macrophage HIF-1alpha is an independent prognostic indicator in kidney cancer. Clin Cancer Res. 2020;26(18):4970–4982. doi:10.1158/1078-0432.CCR-19-3890
44. Schodel J, Grampp S, Maher ER, et al. Hypoxia, hypoxia-inducible transcription factors, and renal cancer. Eur Urol. 2016;69(4):646–657. doi:10.1016/j.eururo.2015.08.007
45. Lapinskas EJ, Svobodova S, Davis ID, et al. The Ets Transcription Factor ELF5 functions as a tumor suppressor in the kidney. Twin Res Hum Genet. 2011;14(4):316–322. doi:10.1375/twin.14.4.316
46. Lee S, Margolin K. Cytokines in cancer immunotherapy. Cancers. 2011;3(4):3856–3893. doi:10.3390/cancers3043856
47. Bao Y, Wang Z, Liu B, et al. A feed-forward loop between nuclear translocation of CXCR4 and HIF-1alpha promotes renal cell carcinoma metastasis. Oncogene. 2019;38(6):881–895. doi:10.1038/s41388-018-0452-4
48. O’Shea JJ, Holland SM, Staudt LM. JAKs and STATs in immunity, immunodeficiency, and cancer. N Engl J Med. 2013;368(2):161–170. doi:10.1056/NEJMra1202117
49. Qi Y, Wang L, Wang K, et al. New mechanistic insights of clear cell renal cell carcinoma from integrated miRNA and mRNA expression profiling studies. Bio Pharmac. 2019;111:821–834. doi:10.1016/j.biopha.2018.12.099
50. Kitchen DB, Decornez H, Furr JR, et al. Docking and scoring in virtual screening for drug discovery: methods and applications. Nat Rev Drug Discov. 2004;3(11):935–949. doi:10.1038/nrd1549
51. Samuels BL, Hollis DR, Rosner GL, et al. Modulation of vinblastine resistance in metastatic renal cell carcinoma with cyclosporine A or tamoxifen: a cancer and leukemia group B study. Clin Cancer Res. 1997;3(11):1977–1984.
52. Small J, Washburn E, Millington K, et al. The addition of abemaciclib to sunitinib induces regression of renal cell carcinoma xenograft tumors. Oncotarget. 2017;8(56):95116–95134. doi:10.18632/oncotarget.19618
53. Chen D, Sun X, Zhang X, et al. Inhibition of the CDK4/6-Cyclin D-Rb pathway by ribociclib augments chemotherapy and immunotherapy in renal cell carcinoma. Biomed Res Int. 2020;2020:9525207. doi:10.1155/2020/9525207
 © 2023 The Author(s). This work is published and licensed by Dove Medical Press Limited. The
full terms of this license are available at https://www.dovepress.com/terms
and incorporate the Creative Commons Attribution
- Non Commercial (unported, 3.0) License.
By accessing the work you hereby accept the Terms. Non-commercial uses of the work are permitted
without any further permission from Dove Medical Press Limited, provided the work is properly
attributed. For permission for commercial use of this work, please see paragraphs 4.2 and 5 of our Terms.
© 2023 The Author(s). This work is published and licensed by Dove Medical Press Limited. The
full terms of this license are available at https://www.dovepress.com/terms
and incorporate the Creative Commons Attribution
- Non Commercial (unported, 3.0) License.
By accessing the work you hereby accept the Terms. Non-commercial uses of the work are permitted
without any further permission from Dove Medical Press Limited, provided the work is properly
attributed. For permission for commercial use of this work, please see paragraphs 4.2 and 5 of our Terms.
Recommended articles
RNA-Sequencing and Bioinformatics Analysis of Exosomal Long Noncoding RNAs Revealed a Novel ceRNA Network in Stable COPD
Lin S, Liu C, Sun J, Guan Y
International Journal of Chronic Obstructive Pulmonary Disease 2023, 18:1995-2007
Published Date: 11 September 2023
Transcriptome Sequencing Identifies Abnormal lncRNAs and mRNAs and Reveals Potentially Hub Immune-Related mRNA in Osteoporosis with Vertebral Fracture
Sun R, Duan D, Li R
Clinical Interventions in Aging 2024, 19:203-217
Published Date: 9 February 2024
Identification of Angiogenesis-Related Gene Signatures and Prediction of Potential Therapeutic Targets in Ulcerative Colitis Using Integrated Bioinformatics
Xu X, Ying H, Wang X, Hong W, Zhang M
Journal of Inflammation Research 2024, 17:11699-11717
Published Date: 27 December 2024
Identification of Pivotal ceRNA Networks Associated with Stanford-A Aortic Dissection via Integrated Bioinformatics Analysis
Hu Y, Liu Z, Qin Y, Wu N, Yang T, Cheng X, Wang C, Wang X
International Journal of General Medicine 2025, 18:1509-1527
Published Date: 17 March 2025