
Back to Journals » International Journal of Women's Health » Volume 18
Identification of an Immunotherapy-Associated CD1c+CLEC10A+ Dendritic Cell Subset and Development of a Prognostic Model in Breast Cancer
Received 7 April 2026
Accepted for publication 22 June 2026
Published 7 July 2026 Volume 2026:18 615081
DOI https://doi.org/10.2147/IJWH.S615081
Checked for plagiarism Yes
Review by Single anonymous peer review
Peer reviewer comments 2
Editor who approved publication: Dr Everett Magann
Zi-An Xia1,2, Jiang He1,3,4
1National Clinical Research Center for Geriatric Disorders, Xiangya Hospital, Central South University, Changsha, People’s Republic of China; 2Department of Integrated Traditional Chinese and Western Medicine, Xiangya Hospital, Central South University, Changsha, People’s Republic of China; 3Department of Oncology, Xiangya Cancer Center, Xiangya Hospital, Central South University, Changsha, People’s Republic of China; 4Key Laboratory of Molecular Radiation Oncology, Changsha, Hunan Province, People’s Republic of China
Correspondence: Jiang He, Email [email protected]
Purpose: Understanding which immune cell populations are linked to immunotherapy efficacy is essential for improving treatment stratification in breast cancer. This study aimed to identify immune-relevant cellular subsets from single-cell RNA sequencing (scRNA-seq) data and to develop a prognostic model based on genes characteristic of the relevant population.
Methods: scRNA-seq data from breast cancer patients treated with immune checkpoint blockade were reanalyzed to identify cell subsets associated with therapeutic response. The existence of the key subset in tumor tissues was validated by multiplex immunohistochemistry. Marker genes from this subset were then used to construct a prognostic model through Cox regression and least absolute shrinkage and selection operator (LASSO) analysis. The model was further evaluated in two independent GEO cohorts, GSE177043 and GSE169246.
Results: A tumor-infiltrating dendritic cell subset defined by CD1c and CLEC10A co-expression was enriched in tumors from responders. Based on the transcriptional signature of this population, we established a tumor-infiltrating dendritic cell-related prognostic model (TRPM). Patients with low TRPM scores had superior survival compared with those with high scores. In addition, lower TRPM scores were associated with a reduced TP53 mutation frequency, increased infiltration of anti-tumor immune cells, including M1 macrophages, plasma cells, CD8+ T cells, and CD4+ T cells, a more immune-active tumor microenvironment, greater predicted drug sensitivity, and improved benefit from immunotherapy. By contrast, higher TRPM scores were linked to a higher TP53 mutation rate, enrichment of M2 macrophages, an immunosuppressive phenotype, decreased drug sensitivity, and poorer predicted response to immunotherapy. In the external immunotherapy cohorts, the model showed good predictive performance, with AUC values of 0.73 in GSE177043 and 0.85 in GSE169246.
Conclusion: TRPM may serve as a useful biomarker for stratifying breast cancer patients according to prognosis and likely treatment benefit. This model could support individualized therapeutic decision-making, although prospective clinical validation remains necessary.
Keywords: breast cancer, immunotherapy, dendritic cells, CD1c, prognostic model
Introduction
Breast cancer is among the most frequently diagnosed malignancies in women worldwide. In 2021, approximately 2.34 million new cases were reported, accounting for 11.7% of all newly diagnosed cancers.1 At present, surgery, endocrine therapy, and adjuvant chemoradiotherapy remain the principal treatment strategies for most patients.2 More recently, immune checkpoint therapy (ICT) has emerged as an important therapeutic option and has reshaped the treatment landscape of breast cancer.3–5 However, only a minority of patients derive substantial clinical benefit, and effective biomarkers for predicting response are still lacking. Several biomarkers, including PD-L1 expression, tumor mutational burden, tumor-infiltrating lymphocytes, and immune-related gene signatures, have been investigated as predictors of immunotherapy response in breast cancer.6,7 However, their predictive performance remains suboptimal, highlighting the need for more reliable biomarkers that better reflect the complexity of the tumor immune microenvironment.
Dendritic cells are specialized antigen-presenting cells that play a central role in initiating adaptive anti-tumor immunity by presenting tumor antigens to T cells.8 Conventional dendritic cells (cDCs) are generally categorized into two subsets: cDC1, which preferentially activates CD8+ T cells,9,10 and cDC2, which is more closely associated with CD4+ T-cell activation.11 In humans, cDC2 cells are commonly marked by CD1c and are found in both lymphoid and peripheral tissues.12 Recent single-cell studies have revealed considerable heterogeneity among tumor-infiltrating dendritic cells and identified multiple DC subsets with distinct functional states and clinical associations in breast cancer.13,14 Nevertheless, the specific dendritic cell populations associated with immunotherapy response remain incompletely characterized. Increasing evidence indicates that successful cancer immunotherapy depends on effective activation of tumor-associated antigen-presenting cells,15–17 suggesting that tumor-infiltrating dendritic cells (TIDCs) may be closely involved in determining immunotherapy outcomes in breast cancer.
Single-cell RNA sequencing offers a powerful approach for dissecting tumor heterogeneity and identifying clinically relevant immune cell populations. Analysis of breast cancer samples with known ICT outcomes may help reveal dendritic cell subsets associated with prognosis and therapeutic response. Integrating such single-cell findings with bulk transcriptomic data and machine learning strategies may facilitate the development of predictive models with practical clinical value.
In the present study, we reanalyzed scRNA-seq data from breast cancer patients treated with anti-PD-1 therapy and identified a TIDC subset enriched in responders. Using marker genes from this population, we developed a TIDC-related prognostic model (TRPM) through LASSO and Cox regression analyses. We further explored the association of TRPM with prognosis, molecular features, immune infiltration, chemotherapy sensitivity, and immunotherapy benefit in breast cancer.
Materials and Methods
Data Sources
Single-cell RNA sequencing data from breast cancer patients receiving anti-PD-1 therapy (EGAD00001006608, n = 40) were downloaded and reanalyzed.13 Bulk transcriptomic and clinical data from The Cancer Genome Atlas (TCGA, n = 1089) and the Molecular Taxonomy of Breast Cancer International Consortium (METABRIC, n = 1904) were used to construct and validate the TRPM scoring system. Public datasets including GSE20181,18 GSE163882,19 GSE25055,20 GSE22226,21 and pRRophetic22 datasets were used to assess chemotherapy response among TRPM-defined subgroups. Two independent cohorts of breast cancer patients treated with anti-PD-1/PD-L1 therapy, GSE177043 and GSE169246,23,24 were used to evaluate the predictive performance of TRPM for immunotherapy response. Somatic mutation data for TCGA were obtained from cBioPortal. The overall workflow is shown in Supplementary Figure 1.
Single-Cell RNA Sequencing Data Analysis
The scRNA-seq dataset EGAD0000100660813 was processed according to previously reported quality-control criteria.25 After filtering, 72,047 cells were retained for downstream analysis. Fine clustering was performed using the Seurat package (v4.0.4),[26] and major cell populations were annotated according to canonical marker genes. Immune cells from responders and non-responders were integrated and visualized by uniform manifold approximation and projection (UMAP) to identify immune subsets associated with immunotherapy outcome. Responders included patients with complete or partial response, whereas non-responders included those with stable or progressive disease. Differences in cluster proportions between the two groups were then compared.
Multiplex Immunohistochemistry
Multiplex immunohistochemistry was conducted to verify the presence of the CD1c+CLEC10A+ subset in breast cancer tissues. Briefly, FFPE sections were incubated for 30 min at room temperature with rabbit anti-human CD1c antibody (ORIGENE, TA505411S) and CLEC10A antibody (ORIGENE, TA810180). After three washes with PBS, the sections were incubated with a horseradish peroxidase-conjugated secondary antibody for 10 min at room temperature. TSA Plus working solution was then applied for 10 min according to the manufacturer’s instructions. Multispectral images were acquired using the Vectra 3.0 system (PerkinElmer) at 20× magnification.
Immunohistochemical Staining
BTG1 expression in breast cancer tissues was evaluated by immunohistochemistry. A paraffin-embedded breast cancer tissue chip was obtained from Shanghai Zhuoli Biotech (ZL-BrcSur1801). The chip was incubated overnight with anti-human BTG1 polyclonal antibody (1:100, Proteintech, 14879-1-AP), as previously reported.27 PowerVision complex (ZSGB-BIO, PV-9000) was then applied for 30 min at room temperature. The signal was developed with DAB and counterstained accordingly. Staining intensity was assessed using the inform 2.4 scoring system (PerkinElmer).
Development of TIDCs-Related Prognostic Model
Differentially expressed genes (DEGs) in the CD1c+CLEC10A+ dendritic cell subset were identified relative to the other cell populations using the thresholds |log2FC| > 0.5 and p < 0.05. A total of 423 genes were obtained and subjected to survival analysis in the TCGA and METABRIC cohorts. Prognosis-related genes significant in both datasets were intersected and then analyzed by univariate Cox regression.28 To develop a prognostic model reflecting the biological characteristics of the CD1c+CLEC10A+ dendritic cell subset, DEGs identified from this population were systematically evaluated for their prognostic significance in independent breast cancer cohorts. LASSO-Cox regression was subsequently applied to identify the optimal gene set for model construction. Five genes (BTG1, SERPINA1, RPS29, FLT3, and IGKC) and their corresponding LASSO-derived coefficients were used to construct the TRPM. The TRPM score for each patient was calculated as a weighted linear combination of the normalized expression levels of these genes and their respective coefficients. Patients in the TCGA cohort were divided into high- and low-TRPM groups using the median score as the cutoff. Kaplan–Meier survival analysis and receiver operating characteristic (ROC) analysis were performed to assess model performance. The predictive value of the model was further examined in the METABRIC cohort.
Analysis of Immune Characteristics in Different TRPM Subgroups
To characterize immune differences between TRPM subgroups in the TCGA cohort, the relative proportions of 22 immune cell types were estimated using CIBERSORT with 1000 permutations. Stromal score, immune score, ESTIMATE score, and tumor purity were calculated using the estimate package. Tumor Immune Dysfunction and Exclusion (TIDE) analysis was employed to estimate potential response to immunotherapy. T-cell cytolytic activity was evaluated using the expression levels of GZMA and PRF1.29
Functional and Pathway Enrichment Analysis
DEGs between high- and low-TRPM groups were identified using the limma package. These genes were subjected to Gene Ontology (GO) and Kyoto Encyclopedia of Genes and Genomes (KEGG) enrichment analyses using clusterProfiler (v4.0.5).30 In parallel, Gene Set Variation Analysis (GSVA) was conducted with the GSVA package (v1.40.1)31 based on hallmark gene sets from the Molecular Signatures Database (MSigDB) to compare pathway activity between the two TRPM subgroups.
Mutation and Drug Sensitivity Analysis
Somatic mutation profiles in the two TRPM groups from TCGA were analyzed using the maftools package and displayed as waterfall plots. Predicted half-maximal inhibitory concentration (IC50) values of commonly used chemotherapeutic agents for breast cancer were calculated with the pRRophetic package.
Identification of Cohorts with Immune Checkpoint Blockade
Expression data for 33 immune checkpoint molecules were extracted from TCGA breast cancer samples and compared between TRPM subgroups. The two immunotherapy-treated breast cancer cohorts, GSE177043 and GSE169246, were further used to validate the ability of TRPM to predict clinical response to anti-PD-1/PD-L1 therapy. The optimal cutoff value was determined using the surv_cutpoint function in the survminer package. AUC values were calculated with the pROC package.
TIDE/MDSC/Dysfunction/Exclusion
The Tumor Immune Dysfunction and Exclusion (TIDE) algorithm was used to predict potential responses to immune checkpoint blockade therapy.7 TIDE integrates T-cell dysfunction and T-cell exclusion signatures to model tumor immune evasion. In addition, MDSC, T-cell dysfunction, and T-cell exclusion scores generated by the TIDE platform were used to evaluate distinct mechanisms of immune suppression. Higher TIDE scores indicate a greater likelihood of immune evasion and reduced response to immunotherapy. Relevant methodological details have been previously described by Jiang et al.7
Statistical Analysis
All statistical analyses were performed in R software (version 4.1.1). The detailed scripts used in this study are provided in Table S1. A p value < 0.05 was considered statistically significant.
Results
Identification of a Dendritic Cell Subset Associated with Immunotherapy Response
To characterize immune cell populations associated with therapeutic outcome, we reanalyzed the scRNA-seq data from a previously published breast cancer cohort treated with anti-PD-1 therapy.13 After initial clustering of all cells, the dataset was divided into CD45+ immune cells and CD45− non-immune cells and visualized by UMAP. Re-clustering of the immune compartment identified 17 distinct cell clusters across all samples (Figure 1A and Supplementary Figure 2A).
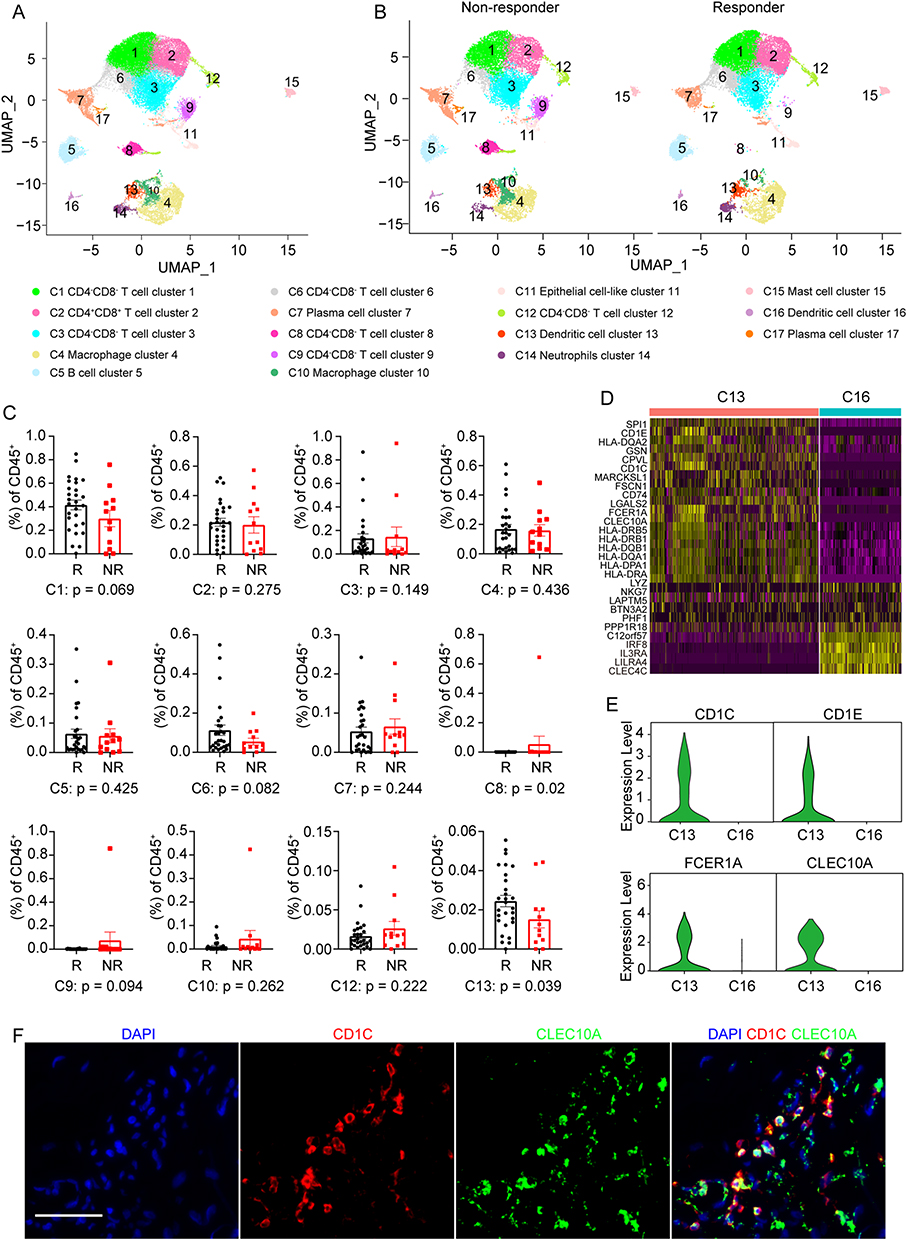 |
Figure 1 Identification of a dendritic cell subset enriched in responding breast tumors. (A) Uniform manifold approximation and projection (UMAP) plot of immune cells. (B) UMAP plot of intratumoral immune cells grouped into 17 clusters in tumors from patients with different immunotherapy outcomes (non-responders [NR] versus responders [R]). (C) Comparison of the relative proportions of immune cell clusters between the NR and R groups. (D) Heatmap showing z-scored expression of the top upregulated genes in each dendritic cell (DC) subpopulation relative to the other DC subpopulation. (E) Violin plots showing normalized expression levels of representative canonical marker genes. (F) Representative multiplex immunohistochemistry images of breast cancer sections showing CD1c and CLEC10A expression in DCs. Scale bar, 50 μm. |
Clinical response was defined according to RECIST criteria, with complete response and partial response classified as responder (R), and stable disease and progressive disease classified as non-responder (NR). Among the 40 cases, 28 were classified as responders and 12 as non-responders in previous study.14 Immune cells from the two groups were projected together in UMAP space to enable comparison of immune composition between different treatment outcomes (Figure 1B and Supplementary Figure 2B).
Cluster annotation based on canonical markers identified several immune populations, including CD4−CD8− T cells, CD4+CD8+ T cells, B cells, plasma cells, macrophages, neutrophils, mast cells, and two dendritic cell clusters. One of these dendritic clusters, cluster 13, expressed CD1c and CLEC10A, whereas cluster 16 showed enrichment of IRF8, IL3RA, and LILRA4.
Comparison of cell proportions at the patient level showed that clusters 8, 13, and 17 differed between responders and non-responders (Figure 1C and Supplementary Figure 2C). However, clusters 8 and 17 were detected only in a limited number of patients and were absent in most samples. In contrast, cluster 13 was present in the majority of tumors and was relatively enriched in responders, suggesting a closer relationship with immunotherapy benefit.
Further examination of cluster 13 showed prominent expression of MHC class II genes, CLEC10A, and cDC2-associated markers including CD1C, CD1E, FCER1A, IRF8, CLEC4C, and LILRA4 (Figure 1D, E and Supplementary Figure 2D). This expression pattern suggests strong antigen-presenting capacity. Given that CLEC10A has been reported as a specific marker of human CD1c+ dendritic cells,32 cluster 13 was designated as the CD1c+CLEC10A+ dendritic cell subset. By comparison, cluster 16 showed a cDC1-like transcriptional program but did not differ significantly between responder and non-responder tumors. Multiplex immunohistochemistry confirmed the presence of CD1c+CLEC10A+ dendritic cells in breast cancer tissues (Figure 1F).
Construction of the TRPM Scoring System
To translate the single-cell findings into a clinically relevant signature, genes characteristic of the CD1c+CLEC10A+ dendritic cell subset were screened for prognostic value. Using the predefined thresholds, 423 marker genes were identified from this subset (Table S2). Survival analysis in the TCGA and METABRIC datasets identified 123 and 136 prognosis-related genes, respectively (Tables S3 and S4). Their intersection yielded 45 overlapping genes associated with patient outcome (Figure 2A and Table S5).
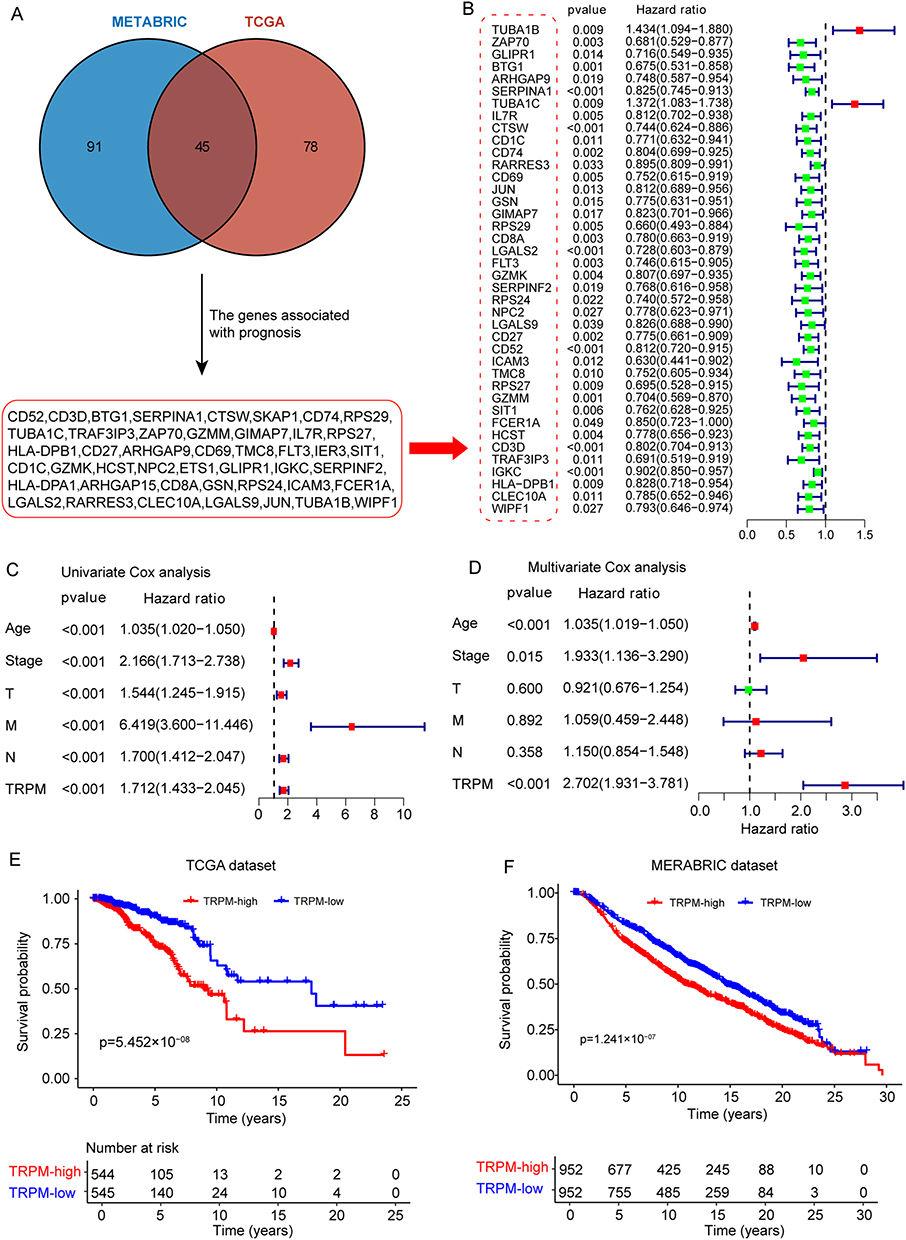 |
Figure 2 Development and validation of the TRPM in breast cancer cohorts. (A) Workflow for screening the 45 candidate genes used for model construction. (B) Forest plot showing the association between candidate genes and prognosis. (C) Forest plot of univariate Cox regression analysis showing the associations of clinicopathological variables and TRPM score with prognosis. (D) Forest plot of multivariate Cox regression analysis showing the associations of variables significant in the univariate analysis with prognosis. (E and F) Kaplan–Meier curves showing overall survival of breast cancer patients stratified by TRPM subgroup in the TCGA and METABRIC cohorts. |
These 45 genes were first assessed by univariate Cox regression (Figure 2B), and then subjected to LASSO-Cox regression to determine the optimal prognostic gene combination (Supplementary Figure 3A and 3B). Five genes were ultimately retained: BTG1, SERPINA1, RPS29, FLT3, and IGKC. Based on their corresponding coefficients, the TRPM score was calculated as follows: TRPM score = −0.3176 × BTG1 expression - 0.1601 × SERP1NA1 expression - 0.2971 × RPS29 expression – 0.2792 × FLT3 expression – 0.0796 × IGKC expression.
The distribution of risk scores indicated that decreasing TRPM values were accompanied by longer survival times (Supplementary Figure 3C). Univariate Cox analysis showed that age, stage, and TRPM score were significantly associated with survival in breast cancer patients (Figure 2C). After adjustment for clinicopathological variables, multivariate Cox regression further confirmed TRPM as an independent prognostic factor (Figure 2D).
Using the median TRPM value as the cutoff, patients in the TCGA cohort were divided into high- and low-score groups. Kaplan–Meier analysis showed that the low-TRPM group had significantly better overall survival than the high-TRPM group (p = 5.452 × 10⁻⁸; Figure 2E). The same trend was observed in the METABRIC cohort, where low TRPM scores were also associated with superior prognosis (p = 1.241 × 10⁻⁷; Figure 2F). In addition, the nomogram developed in this study indicated that TRPM contributed the largest number of risk points among the included clinicopathological variables (Supplementary Figure 3D). ROC analysis showed that the AUC values of TRPM for predicting 1-, 3-, and 5-year survival were 0.803, 0.721, and 0.709, respectively (Supplementary Figure 3E–G).
Validation of Representative Genes in the TRPM Model
To further examine the prognostic value of individual genes in the model, the five-gene panel was evaluated by multivariate Cox analysis in the TCGA cohort (Figure 3A). All five genes behaved as independent protective factors. Among them, BTG1 and FLT3 were selected for additional validation.
 |
Figure 3 Validation of representative genes in the TRPM prognostic model. (A) Forest plot of multivariate Cox regression analysis showing the associations between genes in the TRPM signature and prognosis. (B) Expression of the representative gene BTG1 in breast cancer tissues and adjacent normal tissues in the TCGA cohort. (C) Immunohistochemical staining showing BTG1 expression in breast cancer tissues and adjacent normal tissues. (D) Summary of BTG1 immunohistochemical staining in breast cancer specimens (n = 90) and matched adjacent tissues (n = 90) on a tissue microarray. (E and F) Expression levels of BTG1 (E) and FLT3 (F) across different tumor stages. (G and H) Kaplan–Meier survival curves showing the associations of BTG1 (G) and FLT3 (H) expression with prognosis. Scale bar, 25 μm. *p < 0.05, **p < 0.01, ****p < 0.0001, determined by unpaired t test. |
In the TCGA dataset, BTG1 expression was significantly lower in breast cancer tissues than in adjacent non-tumor tissues (Figure 3B). This finding was further supported by immunohistochemical analysis of 90 paired breast cancer and adjacent tissue samples, which showed markedly reduced BTG1 expression in tumor specimens (Figure 3C and D). Notably, both BTG1 and FLT3 expression declined with disease progression (Figure 3E and F), suggesting a possible association with tumor-suppressive functions. Consistent with this observation, survival analysis in the METABRIC cohort showed that higher BTG1 or FLT3 expression was associated with improved prognosis (Figure 3G and H). Together, these results support the robustness of the TRPM model and the biological relevance of its component genes.
Molecular Characteristics of TRPM Subgroups
To investigate the biological differences between high- and low-TRPM tumors, differential expression analysis was performed in the TCGA cohort. DEGs between the two groups were identified using the limma package and visualized in a volcano plot (Supplementary Figure 4A). These genes were then subjected to GO, KEGG, and GSVA analyses.
Pathway analysis indicated that the low-TRPM group was enriched in signaling programs related to PD-L1 expression and the PD-1 checkpoint pathway (Supplementary Figure 4B), suggesting that these tumors may be more likely to benefit from immunotherapy. In addition, pathways involved in B-cell signaling, T-cell signaling, and natural killer cell-mediated cytotoxicity were also more prominent in the low-TRPM subgroup. GO analysis further showed enrichment of immune-related molecular functions, including antigen binding, MHC protein binding, and immune receptor activity (Supplementary Figure 4C and 4D).
To further define the molecular landscape of TRPM-defined subgroups, somatic mutation patterns were compared. Missense mutations represented the predominant mutation type in both groups, followed by nonsense mutations and frameshift deletions (Supplementary Figure 4E and F). The top 30 genes with the highest mutation frequencies were then examined. TP53, PIK3CA, TTN, and GATA3 each showed mutation frequencies above 10% in both subgroups. However, TP53, MUC16, MLL3, MUC12, SPTA1, USH2A, FLG, HMCN1, RYR3, SYNE1, FAT3, SYNE2, HUWE1, OBSCN, CSMD2, MDN1, RELN, and APOB were more frequently mutated in the high-TRPM group. By contrast, PIK3CA, CDH1, MUC4, MAP3K1, PTEN, HRNR, SPEN, ZFHX4, RUNX1, GRP98, LRP2, MAP2K4, DYNC1H1, and HYDIN were more often mutated in the low-TRPM group. These findings suggest that TRPM subgroups differ not only in immune state but also in genomic alteration patterns.
Immune Characteristics of Distinct TRPM Subgroups
Because the TRPM model was derived from an immune-related dendritic cell subset, we next examined whether TRPM score reflected broader immune features within the tumor microenvironment. CIBERSORT analysis showed that M0 and M2 macrophages were significantly enriched in the high-TRPM subgroup, whereas the low-TRPM subgroup contained higher levels of CD4 T cells, CD8 T cells, naïve B cells, resting dendritic cells, activated NK cells, and plasma cells (Figure 4A).
 |
Figure 4 Immune infiltration landscape and immune characteristics of different TRPM subgroups. (A) Relative abundance of 22 infiltrating immune cell types in the two TRPM subgroups. (B–E) Boxplots showing stromal score, immune score, ESTIMATE score, and tumor purity in the two TRPM subgroups. ***p < 0.001, ****p < 0.0001, determined by unpaired t test. Abbreviation: ns, not significant. |
Consistently, stromal score, immune score, and ESTIMATE score were all significantly higher in the low-TRPM subgroup (Figure 4B–D), whereas tumor purity was higher in the high-TRPM subgroup (Figure 4E). These results indicate that a low TRPM score corresponds to a more immune-infiltrated tumor microenvironment, whereas a high score is associated with a less inflamed and potentially more immune-suppressed state.
Chemotherapy Response in TRPM Subgroups
Chemotherapy remains a major treatment modality for breast cancer, and part of its anti-tumor effect is thought to depend on the induction of anti-cancer immunity.33 Given the immune differences observed across TRPM groups, we next explored whether TRPM was related to chemotherapy response.
TRPM values were first calculated in two cohorts of breast cancer patients treated with neoadjuvant chemotherapy, GSE20181 and GSE163882. In both datasets, responders showed significantly lower TRPM scores than non-responders (p < 0.001 in GSE20181; p < 0.05 in GSE163882; Figure 5A and B). Consistent with this, patients classified into the low-TRPM subgroup displayed a higher response rate to chemotherapy than those in the high-TRPM subgroup.
 |
Figure 5 Association of TRPM with chemotherapy benefit. (A and B) Boxplots showing the distribution of TRPM scores in breast cancer patients with different chemotherapy responses. Right panels show the numbers of clinical responses to chemotherapy in the high- and low-TRPM subgroups. (C and D) Kaplan–Meier curves showing the association between TRPM score and prognosis in patients receiving chemotherapy in two independent cohorts. (E) Predicted IC50 values of chemotherapeutic agents in the two TRPM subgroups. *p < 0.05, ***p < 0.001, ****p < 0.0001, determined by unpaired t test. Abbreviation: ns, not significant. |
The prognostic value of TRPM was further assessed in patients receiving chemotherapy. In both relevant cohorts, low TRPM scores were associated with more favorable survival outcomes (Figure 5C and D). To further estimate drug sensitivity, IC50 values for eight commonly used first-line chemotherapeutic agents were calculated using the pRRophetic package. Compared with the high-TRPM subgroup, the low-TRPM subgroup showed greater predicted sensitivity to most tested agents, including paclitaxel, fluorouracil, doxorubicin, gemcitabine, camptothecin, etoposide, and tamoxifen (Figure 5E). These findings suggest that TRPM may help identify patients more likely to respond to chemotherapy.
Immunotherapy Benefit in Different TRPM Subgroups
To evaluate the potential relationship between TRPM and immunotherapy benefit, the expression profiles of 33 immune checkpoint molecules were compared between high- and low-TRPM tumors. Multiple checkpoint genes, including CTLA4, LAG3, PDCD1, and TIGIT, were more highly expressed in the low-TRPM subgroup (Supplementary Figure 5), suggesting that these tumors may be more responsive to immune checkpoint blockade.
We next assessed immunotherapy-related indices including PD-L1 score, TIDE score, and MDSC score. A higher PD-L1 score and lower TIDE and MDSC scores are generally considered indicative of better response to immunotherapy.7,34 In our analysis, the low-TRPM subgroup showed higher PD-L1 scores together with lower TIDE and MDSC scores than the high-TRPM subgroup (Figure 6A), indicating a greater likelihood of benefit from ICT. In addition, the low-TRPM subgroup had lower T-cell exclusion scores and higher T-cell dysfunction scores (Figure 6A). T-cell cytolytic activity, assessed using GZMA and PRF1 expression,29 was also significantly higher in low-TRPM tumors (Figure 6B), and TRPM score was negatively correlated with cytolytic index in the TCGA cohort (Figure 6C). Together, these results support the view that patients with low TRPM scores are more likely to benefit from immunotherapy.
 |
Figure 6 Predictive value of TRPM in breast cancer patients treated with anti-PD-1/PD-L1 therapy. (A) TIDE, PD-L1, MDSC, dysfunction, and exclusion scores in the two TRPM subgroups. (B) T-cell cytolytic index in the two TRPM subgroups. (C) Correlation between TRPM score and T-cell cytolytic index. (D) Kaplan–Meier curves showing overall survival of breast cancer patients stratified by TRPM subgroup in the GSE177043 cohort. (E) Boxplot showing the distribution of TRPM scores between responders and non-responders. (F) Bar graph showing the numbers of clinical responses to anti-PD-1 immunotherapy in the two TRPM subgroups. (G and H) ROC curves showing the performance of TRPM in predicting immunotherapy outcomes in the GSE177043 (G) and GSE169246 (H) cohorts. (I) ROC analysis comparing TRPM, PD-1, and PD-L1 for predicting overall survival at 1-, 3-, and 5-year follow-up in the GSE177043 cohort. |
To directly test the predictive value of TRPM in immunotherapy-treated patients, we analyzed two breast cancer cohorts receiving anti-PD-1/PD-L1 therapy, GSE177043 and GSE169246. The optimal TRPM cutoff was determined using the survminer package, and patients were classified into low- and high-score groups accordingly. In GSE177043, Kaplan–Meier analysis showed that low TRPM scores were associated with better overall survival after anti-PD-L1 therapy (Figure 6D). Furthermore, responders in both GSE177043 and GSE169246 had lower TRPM values than non-responders (Figure 6E), and the low-TRPM group showed a higher response rate (Figure 6F).
ROC analysis further demonstrated that TRPM had good predictive performance for immunotherapy outcome. In GSE177043, the AUC was 0.73 (95% CI, 57–88%) (Figure 6G), whereas in GSE169246 the AUC reached 0.85 (95% CI, 62–100%) (Figure 6H). We also compared TRPM with established immunotherapy-related markers such as PD-1 and PD-L1. The AUC values for TRPM were higher than those for PD-1 and PD-L1 at 1-, 3-, and 5-year follow-up (Figure 6I), suggesting that TRPM may have greater predictive value for survival in the context of immunotherapy.
Discussion
Breast cancer is a highly heterogeneous disease, and earlier prognostic studies mainly focused on characteristics intrinsic to malignant cells. More recently, increasing attention has been directed toward the tumor microenvironment, particularly infiltrating immune cells, as important determinants of disease progression and treatment response. Single-cell RNA sequencing has greatly advanced this field by enabling the identification of previously unrecognized immune subpopulations with potential clinical relevance.35–37 In the present study, we used scRNA-seq to identify a dendritic cell subset associated with immunotherapy response in breast cancer and then translated this finding into a prognostic model with potential clinical applicability.
Our analysis identified a CD1c+CLEC10A+ tumor-infiltrating dendritic cell population that was enriched in tumors from patients who responded to anti-PD-1 treatment. This subset expressed canonical cDC2 markers, including CD1C, CD1E, and FCER1A, together with high levels of MHC class II molecules, suggesting strong antigen-presenting capacity.15,38 CLEC10A, an endocytic receptor expressed on antigen-presenting cells, has been implicated in dendritic cell maturation and activation of immune responses.39 Therefore, the molecular phenotype of this subset supports its plausible role in promoting anti-tumor immunity and influencing immunotherapy outcome.39
Based on genes characteristic of this dendritic cell population, we developed the TRPM, which comprises five genes: FLT3, BTG1, SERPINA1, RPS29, and IGKC. Each of these genes has potential biological relevance. FLT3 is essential for dendritic cell development and maintenance and has been linked to the expansion of tumor-infiltrating cDCs and the enhancement of CD8 T-cell-mediated anti-tumor responses.40 BTG1 is a well-known anti-proliferative gene and has been associated with favorable prognosis in multiple cancers.41 SERPINA1 has been reported to contribute to anti-tumor immunity through activation of granzyme B.42 RPS29 has been proposed to function as a tumor suppressor in certain contexts,43 while IGKC has previously been identified as a prognostic factor in breast cancer.44 In our model, all five genes were associated with improved prognosis and therefore carried negative coefficients, consistent with the observation that lower TRPM scores predict better outcome.
The immune landscape differed markedly between TRPM-defined subgroups. Tumors with low TRPM scores exhibited greater infiltration of dendritic cells, M1 macrophages, plasma cells, CD8 T cells, and CD4 T cells, indicating an immune-active state. In contrast, high-TRPM tumors showed increased infiltration of M0 and M2 macrophages, which are typically associated with immunosuppression and tumor progression. These findings are consistent with previous studies showing that enrichment of cytotoxic T cells and plasma cells often correlates with improved prognosis,45–47 whereas M2 macrophages are frequently linked to immune evasion and worse clinical outcomes.46,48
The differences in the tumor microenvironment between TRPM subgroups may also help explain the distinct treatment responses observed. Many chemotherapeutic drugs are now recognized to exert part of their efficacy through stimulation of anti-cancer immunity, for example by promoting the release of immunostimulatory signals from dying tumor cells.33 In our study, low-TRPM tumors showed stronger immune infiltration and greater predicted sensitivity to several commonly used chemotherapeutic agents, suggesting that a more active immune background may contribute to improved chemotherapy response. By contrast, the high-TRPM group displayed features of immune suppression, including higher M2 macrophage infiltration, which may underlie reduced treatment benefit.
Similarly, TRPM-related differences in the tumor immune microenvironment were reflected in the predicted response to immune checkpoint blockade. The TIDE framework was developed to model two major mechanisms of tumor immune escape: T-cell dysfunction in tumors with abundant cytotoxic T lymphocytes and T-cell exclusion in tumors with low CTL infiltration.7 In our analysis, the low-TRPM subgroup had more CTL infiltration, lower TIDE scores, lower T-cell exclusion, and higher cytolytic activity, all of which support greater sensitivity to immunotherapy. By contrast, the high-TRPM subgroup had higher TIDE scores, suggesting a stronger immune evasion phenotype.
Importantly, TRPM also demonstrated promising predictive value in external immunotherapy cohorts. Patients with lower TRPM scores showed better survival and response rates under anti-PD-1/PD-L1 therapy, and the AUC values in the validation datasets indicated good discriminative performance. Moreover, TRPM outperformed PD-1 and PD-L1 in predicting survival at multiple follow-up time points, suggesting that this composite signature may capture clinically relevant immune information beyond conventional single markers.
Taken together, our findings indicate that TRPM is associated not only with prognosis but also with immune state, genomic alterations, chemotherapy sensitivity, and immunotherapy responsiveness. These findings suggest that TRPM may serve as a promising tool for risk stratification and therapeutic decision-making in breast cancer. However, prospective clinical validation will be required before its routine clinical application can be established.
Limitations
Several limitations should be acknowledged. First, the TRPM model was established and validated using retrospective public datasets. Although external validation was performed in multiple independent cohorts, prospective studies are still required to determine its clinical utility in real-world practice. Second, the initial identification of the CD1c+CLEC10A+ dendritic cell subset was based on scRNA-seq data from a relatively small cohort of 40 patients, which may limit generalizability. Third, although the five-gene model was strongly associated with prognosis and treatment response, the precise biological mechanisms linking these genes to dendritic cell function and therapeutic sensitivity remain to be clarified experimentally. In addition, the functional role of the identified CD1c+CLEC10A+ dendritic cell subset in regulating anti-tumor immunity and immunotherapy response requires further mechanistic investigation using experimental models and prospective clinical samples. Fourth, the estimation of immune infiltration and drug sensitivity relied on computational algorithms such as CIBERSORT and pRRophetic, which may not fully substitute for direct biological measurement. Finally, the present study focused on breast cancer, and whether TRPM has predictive value in other tumor types remains uncertain.
Conclusion
In summary, this study identified a CD1c+CLEC10A+ dendritic cell subset enriched in breast cancer patients who responded to immunotherapy. Based on marker genes from this population, we established a five-gene prognostic model, TRPM, which effectively stratified patients according to survival, immune contexture, molecular characteristics, chemotherapy sensitivity, and likely benefit from immunotherapy. Low TRPM scores were associated with a more active anti-tumor immune microenvironment, better prognosis, and enhanced treatment responsiveness. Compared with PD-1 and PD-L1, TRPM showed stronger predictive performance for immunotherapy outcome in the analyzed cohorts, supporting its potential as a candidate biomarker for patient stratification. Further prospective studies and functional investigations are warranted to validate its clinical utility and to elucidate the biological role of the CD1c+CLEC10A+ dendritic cell subset.
Data Sharing Statement
All data used in this study are publicly available as described in the Method section. The web links or unique identifiers for public cohorts/datasets are described in the paper.
Ethics Approval and Consent to Participate
The human tissue microarray used in this study was purchased from Shanghai Zhuoli Biotech Co., Ltd. The collection and use of the tissue specimens were approved by the Ethics Committee of Shanghai Zhuoli Biotech Co., Ltd. Written informed consent was obtained from all patients prior to sample collection. All samples were anonymized and de-identified before being provided to the investigators. The study was conducted in accordance with the Declaration of Helsinki.
Acknowledgments
We would like to thank the staff members of the TCGA and METABRIC Research Network, the cBioPortal, the UCSC Xena data portal; as well as all the authors for making their valuable research data public.
Author Contributions
All authors made a significant contribution to the work reported, whether that is in the conception, study design, execution, acquisition of data, analysis and interpretation, or in all these areas; took part in drafting, revising or critically reviewing the article; gave final approval of the version to be published; have agreed on the journal to which the article has been submitted; and agree to be accountable for all aspects of the work.
Funding
This work was supported by the National Science Foundation of China (grant numbers: 82574830 to Z.A.X, and 81530084 to J.H) and Hunan province natural science funds for Yong scholars (grant numbers: 2020JJ5932 to Z.A.X., and 2023JJ30880 to J.H).
Disclosure
Financial support for this work was provided to Zi-An Xia and Jiang He by the Hunan Provincial Department of Science and Technology. The other authors have no relevant financial or personal relationships to disclose that could have influenced the research presented in this paper.
References
1. Sung H, Ferlay J, Siegel RL, et al. Global cancer statistics 2020: GLOBOCAN estimates of incidence and mortality worldwide for 36 cancers in 185 countries. Ca a Cancer J Clin. 2021;71(3):209–16. doi:10.3322/caac.21660
2. Waks AG, Winer EP. Breast cancer treatment. JAMA. 2019;321(3):316. doi:10.1001/jama.2018.20751
3. Loibl S, Poortmans P, Morrow M, Denkert C, Curigliano G. Breast cancer. Lancet. 2021;397(10286):1750–1769. doi:10.1016/S0140-6736(20)32381-3
4. Loi S, Giobbie-Hurder A, Gombos A, et al. Pembrolizumab plus trastuzumab in trastuzumab-resistant, advanced, HER2-positive breast cancer (PANACEA): a single-arm, multicentre, phase 1b-2 trial. Lancet Oncol. 2019;20(3):371–382. doi:10.1016/S1470-2045(18)30812-X
5. Chung HC, Bang YJ, Fuchs SC, et al. First-line pembrolizumab/placebo plus trastuzumab and chemotherapy in HER2-positive advanced gastric cancer: KEYNOTE-811. Future Oncol. 2021;17(5):491–501. doi:10.2217/fon-2020-0737
6. Savas P, Virassamy B, Ye C, et al. Single-cell profiling of breast cancer T cells reveals a tissue-resident memory subset associated with improved prognosis. Nature Med. 2018;24(7):986–993. doi:10.1038/s41591-018-0078-7
7. Jiang P, Gu S, Pan D, et al. Signatures of T cell dysfunction and exclusion predict cancer immunotherapy response. Nature Med. 2018;24(10):1550–1558. doi:10.1038/s41591-018-0136-1
8. Zagorulya M, Duong E, Spranger S. Impact of anatomic site on antigen-presenting cells in cancer. J ImmunoTher Cancer. 2020;8(2):e001204. doi:10.1136/jitc-2020-001204
9. Hildner K, Edelson BT, Purtha WE, et al. Batf3 deficiency reveals a critical role for CD8alpha+ dendritic cells in cytotoxic T cell immunity. Science. 2008;322(5904):1097–1100. doi:10.1126/science.1164206
10. Spranger S, Dai D, Horton B, Gajewski TF. Tumor-residing Batf3 dendritic cells are required for effector T cell trafficking and adoptive T cell therapy. Cancer Cell. 2017;31(5):711–723e714. doi:10.1016/j.ccell.2017.04.003
11. Meyer MA, Baer JM, Knolhoff BL, et al. Breast and pancreatic cancer interrupt IRF8-dependent dendritic cell development to overcome immune surveillance. Nat Commun. 2018;9(1):1250. doi:10.1038/s41467-018-03600-6
12. Haniffa M, Shin A, Bigley V, et al. Human tissues contain CD141hi cross-presenting dendritic cells with functional homology to mouse CD103+ nonlymphoid dendritic cells. Immunity. 2012;37(1):60–73. doi:10.1016/j.immuni.2012.04.012
13. Bassez A, Vos H, Van Dyck L, et al. A single-cell map of intratumoral changes during anti-PD1 treatment of patients with breast cancer. Nature Med. 2021;27(5):820–832. doi:10.1038/s41591-021-01323-8
14. Lee CYC, Kennedy BC, Richoz N, et al. Tumour-retained activated CCR7(+) dendritic cells are heterogeneous and regulate local anti-tumour cytolytic activity. Nat Commun. 2024;15(1):682. doi:10.1038/s41467-024-44787-1
15. Atukorale PU, Raghunathan SP, Raguveer V, et al. Nanoparticle encapsulation of synergistic immune agonists enables systemic codelivery to tumor sites and IFNbeta-driven antitumor immunity. Cancer Res. 2019;79(20):5394–5406. doi:10.1158/0008-5472.CAN-19-0381
16. Swartz MA, Hirosue S, Hubbell JA. Engineering approaches to immunotherapy. Sci Trans Med. 2012;4(148):148rv149. doi:10.1126/scitranslmed.3003763
17. Wculek SK, Cueto FJ, Mujal AM, Melero I, Krummel MF, Sancho D. Dendritic cells in cancer immunology and immunotherapy. Nat Rev Immunol. 2020;20(1):7–24. doi:10.1038/s41577-019-0210-z
18. D’Souza LJ, Wright SH, Bhattacharya D. Genetic evidence that uptake of the fluorescent analog 2NBDG occurs independently of known glucose transporters. PLoS One. 2022;17(8):e0261801. doi:10.1371/journal.pone.0261801
19. Chen J, Hao L, Qian X, Lin L, Pan Y, Han X. Machine learning models based on immunological genes to predict the response to neoadjuvant therapy in breast cancer patients. Front Immunol. 2022;13:948601. doi:10.3389/fimmu.2022.948601
20. Hatzis C, Pusztai L, Valero V, et al. A genomic predictor of response and survival following taxane-anthracycline chemotherapy for invasive breast cancer. JAMA. 2011;305(18):1873–1881. doi:10.1001/jama.2011.593
21. Esserman LJ, Berry DA, Cheang MC, et al. Chemotherapy response and recurrence-free survival in neoadjuvant breast cancer depends on biomarker profiles: results from the I-SPY 1 TRIAL (CALGB 150007/150012; ACRIN 6657). Breast Cancer Res Treat. 2012;132(3):1049–1062. doi:10.1007/s10549-011-1895-2
22. Geeleher P, Cox N, Huang RS. pRRophetic: an R package for prediction of clinical chemotherapeutic response from tumor gene expression levels. PLoS One. 2014;9(9):e107468. doi:10.1371/journal.pone.0107468
23. Hammerl D, Martens JWM, Timmermans M, et al. Spatial immunophenotypes predict response to anti-PD1 treatment and capture distinct paths of T cell evasion in triple negative breast cancer. Nat Commun. 2021;12(1):5668. doi:10.1038/s41467-021-25962-0
24. Zhang Y, Chen H, Mo H, et al. Single-cell analyses reveal key immune cell subsets associated with response to PD-L1 blockade in triple-negative breast cancer. Cancer Cell. 2021;39(12):1578–1593e1578. doi:10.1016/j.ccell.2021.09.010
25. Pal B, Chen Y, Vaillant F, et al. A single-cell RNA expression atlas of normal, preneoplastic and tumorigenic states in the human breast. EMBO J. 2021;40(11):e107333. doi:10.15252/embj.2020107333
26. Hao Y, Hao S, Andersen-Nissen E, et al. Integrated analysis of multimodal single-cell data. Cell. 2021;184(13):3573–3587e3529. doi:10.1016/j.cell.2021.04.048
27. He J, Liu L, Tang F, et al. Paradoxical effects of DNA tumor virus oncogenes on epithelium-derived tumor cell fate during tumor progression and chemotherapy response. Signal Transduction Targeted Ther. 2021;6(1):408. doi:10.1038/s41392-021-00787-x
28. Gao J, Kwan PW, Shi D. Sparse kernel learning with LASSO and Bayesian inference algorithm. Neural Networks. 2010;23(2):257–264. doi:10.1016/j.neunet.2009.07.001
29. Rooney MS, Shukla SA, Wu CJ, Getz G, Hacohen N. Molecular and genetic properties of tumors associated with local immune cytolytic activity. Cell. 2015;160(1–2):48–61. doi:10.1016/j.cell.2014.12.033
30. Wu T, Hu E, Xu S, et al. clusterProfiler 4.0: a universal enrichment tool for interpreting omics data. Innovation. 2021;2(3):100141. doi:10.1016/j.xinn.2021.100141
31. Hanzelmann S, Castelo R, Guinney J. GSVA: gene set variation analysis for microarray and RNA-seq data. BMC Bioinf. 2013;14:7. doi:10.1186/1471-2105-14-7
32. Heger L, Balk S, Luhr JJ, et al. CLEC10A is a specific marker for human CD1c(+) dendritic cells and enhances their toll-like receptor 7/8-induced cytokine secretion. Front Immunol. 2018;9:744. doi:10.3389/fimmu.2018.00744
33. Galluzzi L, Humeau J, Buque A, Zitvogel L, Kroemer G. Immunostimulation with chemotherapy in the era of immune checkpoint inhibitors. Nat Rev Clin Oncol. 2020;17(12):725–741. doi:10.1038/s41571-020-0413-z
34. Wang Y, Ding Y, Deng Y, Zheng Y, Wang S. Role of myeloid-derived suppressor cells in the promotion and immunotherapy of colitis-associated cancer. J ImmunoTher Cancer. 2020;8(2):e000609. doi:10.1136/jitc-2020-000609
35. Guo X, Zhang Y, Zheng L, et al. Global characterization of T cells in non-small-cell lung cancer by single-cell sequencing. Nature Med. 2018;24(7):978–985. doi:10.1038/s41591-018-0045-3
36. Li H, van der Leun AM, Yofe I, et al. Dysfunctional CD8 T cells form a proliferative, dynamically regulated compartment within human melanoma. Cell. 2020;181(3):747. doi:10.1016/j.cell.2020.04.017
37. Zheng C, Zheng L, Yoo JK, et al. Landscape of infiltrating T cells in liver cancer revealed by single-cell sequencing. Cell. 2017;169(7):1342–1356e1316. doi:10.1016/j.cell.2017.05.035
38. Wang Y, Xiang Y, Xin VW, et al. Dendritic cell biology and its role in tumor immunotherapy. J hematol oncol. 2020;13(1):107. doi:10.1186/s13045-020-00939-6
39. Eggink LL, Roby KF, Cote R, Kenneth Hoober J. An innovative immunotherapeutic strategy for ovarian cancer: CLEC10A and glycomimetic peptides. J ImmunoTher Cancer. 2018;6(1):28. doi:10.1186/s40425-018-0339-5
40. Onai N, Obata-Onai A, Tussiwand R, Lanzavecchia A, Manz MG. Activation of the Flt3 signal transduction cascade rescues and enhances type I interferon-producing and dendritic cell development. J Exp Med. 2006;203(1):227–238. doi:10.1084/jem.20051645
41. Yuniati L, Scheijen B, van der Meer LT, Van leeuwen FN. Tumor suppressors BTG1 and BTG2: beyond growth control. J Cell Physiol. 2019;234(5):5379–5389. doi:10.1002/jcp.27407
42. Mangan MS, Bird CH, Kaiserman D, et al. A novel serpin regulatory mechanism: serpinB9 is reversibly inhibited by vicinal disulfide bond formation in the reactive center loop. J Biol Chem. 2016;291(7):3626–3638. doi:10.1074/jbc.M115.699298
43. Mirabello L, Macari ER, Jessop L, et al. Whole-exome sequencing and functional studies identify RPS29 as a novel gene mutated in multicase Diamond-Blackfan anemia families. Blood. 2014;124(1):24–32. doi:10.1182/blood-2013-11-540278
44. Whiteside TL, Ferrone S. For breast cancer prognosis, immunoglobulin kappa chain surfaces to the top. Clin Cancer Res. 2012;18(9):2417–2419. doi:10.1158/1078-0432.CCR-12-0566
45. Bindea G, Mlecnik B, Tosolini M, et al. Spatiotemporal dynamics of intratumoral immune cells reveal the immune landscape in human cancer. Immunity. 2013;39(4):782–795. doi:10.1016/j.immuni.2013.10.003
46. Fridman WH, Zitvogel L, Sautes-Fridman C, Kroemer G. The immune contexture in cancer prognosis and treatment. Nat Rev Clin Oncol. 2017;14(12):717–734. doi:10.1038/nrclinonc.2017.101
47. Gentles AJ, Newman AM, Liu CL, et al. The prognostic landscape of genes and infiltrating immune cells across human cancers. Nature Med. 2015;21(8):938–945. doi:10.1038/nm.3909
48. Ruffell B, Coussens LM. Macrophages and therapeutic resistance in cancer. Cancer Cell. 2015;27(4):462–472. doi:10.1016/j.ccell.2015.02.015
 © 2026 The Author(s). This work is published and licensed by Dove Medical Press Limited. The
full terms of this license are available at https://www.dovepress.com/terms
and incorporate the Creative Commons Attribution
- Non Commercial (unported, 4.0) License.
By accessing the work you hereby accept the Terms. Non-commercial uses of the work are permitted
without any further permission from Dove Medical Press Limited, provided the work is properly
attributed. For permission for commercial use of this work, please see paragraphs 4.2 and 5 of our Terms.
© 2026 The Author(s). This work is published and licensed by Dove Medical Press Limited. The
full terms of this license are available at https://www.dovepress.com/terms
and incorporate the Creative Commons Attribution
- Non Commercial (unported, 4.0) License.
By accessing the work you hereby accept the Terms. Non-commercial uses of the work are permitted
without any further permission from Dove Medical Press Limited, provided the work is properly
attributed. For permission for commercial use of this work, please see paragraphs 4.2 and 5 of our Terms.
Recommended articles

Identification of CISD1 as a Prognostic Biomarker for Breast Cancer
Liu X, Cui Q
International Journal of General Medicine 2022, 15:8451-8465
Published Date: 3 December 2022
Advances in Antibody-Drug Conjugates in the Treatment of HER2-Positive Breast Cancer
Yu Y, Wang J, Liao D, Zhang D, Li X, Jia Y, Kong F
Breast Cancer: Targets and Therapy 2022, 14:417-432
Published Date: 9 December 2022
A Novel Clinical Prognostic Model for Breast Cancer Patients with Malignant Pleural Effusion: Avoiding Chemotherapy in Low-Risk Groups?
Wang Y, Zhou T, Zhao S, Li N, Sun S, Li M
Cancer Management and Research 2023, 15:409-422
Published Date: 11 May 2023
Breast Cancer: An Overview of Current Therapeutic Strategies, Challenge, and Perspectives
Wang J, Wu SG
Breast Cancer: Targets and Therapy 2023, 15:721-730
Published Date: 20 October 2023
Immunotherapy: Constructive Approach for Breast Cancer Treatment
Anayyat U, Ahad F, Muluh TA, Zaidi SAA, Usmani F, Yang H, Li M, Hassan HA, Wang X
Breast Cancer: Targets and Therapy 2023, 15:925-951
Published Date: 15 December 2023