
Back to Journals » Journal of Inflammation Research » Volume 19
Identification and Validation of Key Purine Metabolism-Related Genes in Ulcerative Colitis Using Bioinformatics and Machine Learning
Authors Zhang S, Zhang Y, Du D, Zeng Y, Zhang S, Wang Q, Xue W, Wen X, Lan Y, Hu W
Received 2 August 2025
Accepted for publication 26 December 2025
Published 8 January 2026 Volume 2026:19 557806
DOI https://doi.org/10.2147/JIR.S557806
Checked for plagiarism Yes
Review by Single anonymous peer review
Peer reviewer comments 2
Editor who approved publication: Dr Alberto Caminero
Su Zhang,1,* Yifang Zhang,2,* Dongwei Du,2,* Yanling Zeng,3 Shengkai Zhang,1 Qinqin Wang,1 Wenjing Xue,1 Xiang Wen,4 Yi Lan,5 Weitao Hu2
1Department of Rheumatology, the Nanping First Affiliated Hospital of Fujian Medical University, Nanping, People’s Republic of China; 2Department of Gastroenterology, the Second Affiliated Hospital of Fujian Medical University, Quanzhou, People’s Republic of China; 3Department of Hematology, the Nanping First Affiliated Hospital of Fujian Medical University, Nanping, People’s Republic of China; 4Department of Pathology, the Nanping First Affiliated Hospital of Fujian Medical University, Nanping, People’s Republic of China; 5Department of General Practice, the Nanping First Affiliated Hospital of Fujian Medical University, Nanping, People’s Republic of China
*These authors contributed equally to this work
Correspondence: Yi Lan, Email [email protected] Weitao Hu, Email [email protected]
Background: Ulcerative colitis (UC) is a common inflammatory bowel disease with a complex pathogenesis that makes diagnosis and treatment difficult. Purine metabolism is closely related to many diseases, and its specific mechanism of action in UC remains unclear. The aim of this study was to find the relevant biomarkers of purine metabolism in UC.
Methods: UC-related datasets downloaded from the Gene Expression Omnibus (GEO) database were used to screen for differentially expressed genes (DEGs). Weighted gene co-expression network analysis (WGCNA) was then performed to identify key module genes in UC. Then, further differentially expressed purine metabolism-related genes in UC were identified and defined as UCDE-PMRGs. Subsequently, functional enrichment of UCDE-PMRGs was performed. Next, three machine learning algorithms screened the key UCDE-PMRGs and further validated them in a separate validation cohort. We also utilized single-cell sequencing data to analyze the cellular distribution of key UCDE-PMRGs in the UC. Finally, the expression of key genes was validated in clinical samples, in vitro and in vivo experiments.
Results: A total of 2133 DEGs and 9 UCDE-PMRGs were identified in UC. Machine learning was employed to identify the key UCDE-PMRG (PDE4B). PDE4B was significantly associated with immune infiltrating cells. Additionally, clinical samples validated that PDE4B is highly expressed in UC and positively correlated with disease activity. Furthermore, inhibiting PDE4B expression promotes intestinal epithelial barrier repair and alleviates symptoms in UC mice.
Conclusion: PDE4B is a good biomarker related to purine metabolism in UC. Inhibiting PDE4B expression helps alleviate UC symptoms, providing a new approach to the pathogenesis and treatment of UC.
Keywords: ulcerative colitis, purine metabolism, immune infiltration, PDE4B, machine learning, bioinformatics
Introduction
Ulcerative colitis (UC) is a chronic, inflammatory disease that primarily affects the lining of the colon, resulting in inflammation and ulceration of the colonic mucosa. It is classified alongside Crohn’s disease as a type of inflammatory bowel disease (IBD).1 According to one study, UC will have a global prevalence of about 5 million cases in 2023 and is becoming a global disease.2 The exact etiology of UC is unclear and is widely believed to be the result of a combination of immune abnormalities, genetic susceptibility, environmental factors, and intestinal microbial dysbiosis.3 The persistence of UC is an important risk factor for colorectal cancer. Both male and female patients with UC have an average life expectancy that is approximately 5 years shorter than that of the general population.3 Early diagnosis and treatment of UC is therefore a hot topic in current research, with huge benefits for patient survival. Unfortunately, the lack of specificity of clinical symptoms in the early stages of UC makes early diagnosis and treatment of patients difficult and provides opportunities for disease progression. Therefore, it is important to explore early disease biomarkers and potential regulatory mechanisms in UC.
Purines and their derivatives are key molecules in the synthesis of nucleotides in organisms, while they regulate cellular energy metabolism and play a role in maintaining cellular homeostasis.4 When there is a shortage of purines, the cells form a complex called “purinosome” to activate the process of purine metabolism.4 Uric acid (UA) is an important product of purine metabolism and is a key factor in the development of gout.5 In addition, abnormal purine metabolism has been associated with a variety of diseases, including neuropsychiatric disorders and tumors.6,7 Wu et al found that elevated UA directly contributes to impairment of intestinal barrier function, and this evidence gives a direct clue to the relationship between purine metabolism and UC.8 In addition, they found that rhein (a kind of Chinese drug) modulates intestinal homeostasis to alleviate symptoms in UC mice by affecting purine metabolism.8 However, no studies have been reported on purine metabolism-related genes (PMRGs) in UC.
To address this gap, we integrated transcriptome analysis, machine learning, single-cell RNA sequencing, drug prediction, immunohistochemical (IHC) validation, in vivo and in vitro experiments to systematically assess the expression and early diagnostic efficacy of PMRGs in UC. Our study first screened key PMRGs in UC by bioinformatics approaches. Functional enrichment analysis, clinical correlation analysis, drug prediction and immune infiltration analysis were performed on the hub genes. We specialize in the expression and diagnostic efficacy of key PMRGs in UC. The expression and diagnostic efficacy of the key PMRGs were subsequently validated in an independent dataset of UC. We also analyzed the distribution of key genes in UC using single-cell sequencing results of UC. Finally, key genes expression was validated by IHC, animal models and cellular models. The specific flow chart was presented in Figure S1.
Materials and Methods
Data Collection
Enter the keyword “ulcerative colitis” in the GEO database (https://www.ncbi.nlm.nih.gov/geo/)9 and select the species “homo sapiens”. Four microarray datasets, GSE16879, GSE179285, GSE92415 and GSE73661, were obtained. We defined ulcerative colitis patients as the UC group and normal control individuals as the NC group. Their details are shown in Table 1. We then use the “normalization” function to normalize the dataset GSE16879 to eliminate potential batch effects. A total of 156 purine metabolism-related genes (PMRGs) were acquired in the MSigDB database (https://www.gsea-msigdb.org/gsea/msigdb),10 as detailed in the Box S1.
 |
Table 1 Details of Selected Microarray Datasets in GEO Database |
Identification of Differentially Expressed Genes in UC
The dataset GSE16879 was then evaluated using the R package “limma” to screen for differentially expressed genes (DEGs) between UC and NC groups. The screening criteria were ┃log2 FoldChange┃>1 and adjusted P<0.05, with the P-values adjusted for multiple testing using the Benjamini-Hochberg false discovery rate (FDR) method.11
Identification of Key Module Genes in UC and NC Groups
The present study combined Weighted Gene Co-expression Network Analysis (WGCNA) to elucidate the key module genes associated with UC and NC groups. The optimal soft threshold (β) was first determined based on the “picksoftThreshold” function. Subsequently, genes were grouped into different modules and clustered in a tree. We merged modules with distances less than 0.3. Finally, the relationship between modules and clinical traits was assessed, and key module genes were identified for subsequent analysis.
Identification and Enrichment Analysis of Common Genes in UC
The common genes (CGs) in UC were obtained by taking the intersection of DEGs and key module genes. Gene function enrichment analysis provides a preliminary understanding of the biological processes and pathways of genes. Therefore, we performed Gene Ontology (GO) and Kyoto Encyclopedia of Genes and Genomes (KEGG) enrichment analyses on CGs, and an adjusted P<0.05 (Benjamini-Hochberg FDR) was considered statistically significant. Functional enrichment analysis was realized with the R package “clusterProfiler”.12
Identification Key UCDE-PMRGs by Machine Learning
We first took the intersection of CGs and PMRGs to obtain the differentially expressed PMRGs in UC (UCDE-PMRGs). In recent years, the ability of machine learning (ML) to analyze large datasets and discover valuable relationships makes it an effective tool for elucidating patterns and providing explanations. To further identify key UCDE-PMRGs, we applied three commonly used ML algorithms: Least Absolute Shrinkage and Selection Operator (LASSO), Random Forest (RF) and Support Vector Machine-Recursive Feature Elimination (SVM-RFE). The LASSO regression screened for signature genes by adjusting the value of λ to penalize the model.13 RF screened for signature genes by ranking the importance of UCDE-PMRGs.14 SVM-RFE is a combination of support vector machine and recursive feature elimination algorithm, by removing the smallest scoring features, and then using the remaining features to train the model again for the next iteration, and finally selecting the optimal combination of features.15 The signature genes identified by each algorithm in the training set (GSE16879) were then intersected to define the key UCDE-PMRG. The diagnostic performance of this key gene was rigorously assessed on the independent validation cohort (GSE179285) to minimize the risk of overfitting.
Evaluation and Validation of Key UCDE-PMRGs
We utilized receiver operating characteristic (ROC) curves and box plots to assess the expression of key UCDE-PMRGs, and when the area under the curves (AUC) is closer to 1, it means that the gene is more valuable for the diagnosis of UC.
Functional Enrichment Analysis of Key UCDE-PMRGs
The STRING database (https://cn.string-db.org/) is a comprehensive bioinformatics repository that focuses on data integration and analysis of protein-protein interactions (PPI).16 We set the minimum required interaction score of 0.4 to obtain genes that are closely associated with key UCDE-PMRGs.17 Cytoscape software (version 3.9.1) was used to visualize the PPI network.18 Subsequently, we performed KEGG enrichment and Gene Set Enrichment Analysis (GSEA) of the genes constituting the PPI network to facilitate the elaboration of the biological processes and signaling pathways in which these genes are involved from different perspectives.
Single-Cell Analysis
We visualized the distribution of key UCDE-PMRGs in UC colonic immune cells and epithelial cells through the Single cell portal database (https://singlecell.broadinstitute.org/single_cell).19 In this study, we selected the SCP259 dataset (including colonic mucosa from 18 UC patients and 12 healthy individuals)20 for single-cell analysis.
Clinical Correlation Analysis of Key UCDE-PMRGs with UC
We evaluated the correlation between key UCDE-PMRGs and UC mayo scores with two other datasets (GSE92415 and GSE73661). Correlation analysis was achieved by Pearson’s test. Correlation coefficients (r) >0.4 and FDR-adjusted P<0.05 indicating statistically significant.
Immune Infiltration Analysis of UC
The Cibersort (https://cibersortx.stanford.edu/)21 was used for immune infiltration analysis between UC and NC groups. The Cibersort algorithm evaluated the percentage composition of 22 immune cells in UC colon tissue for 1000 repetitions. We then compared the differences in immune infiltrating cells in the UC and NC colon samples. P-values for multiple comparisons across the 22 immune cell types were adjusted using the Benjamini-Hochberg False Discovery Rate (FDR) method. Eventually, the correlation of key UCDE-PMRGs with immune cells was determined by Pearson correlation coefficient (r) >0.5 and adjusted P<0.05.
Immunohistochemical (IHC) Staining
A total of 20 paraffin sections from patients with active UC were collected between April 2023 and April 2024. Written informed consent was signed by each study participant. The rabbit anti-PDE4B polyclone antibody (1/200 dilution, AF9151), rabbit anti-occludin polyclone antibody (1/200 dilution, DF7504) and rabbit anti-E-cadherin polyclone antibody (1/200 dilution, AF0131) were purchased from affinity, China. The goat anti-rabbit IgG (H+L) secondary antibody was purchased from affinity, China (1/10000 dilution, S0001). The exact procedure for IHC staining is as we described previously.22 Briefly, paraffin sections were deparaffinized for antigen repair. After they were allowed to cool, they were closed for 30min at room temperature using 10% goat antiserum. The primary antibody was then placed with the sections in a 4°C refrigerator overnight. After washing the next day, the sections were incubated with secondary antibody at room temperature for 1h. This was followed by observation under a microscope and image capture. All IHC slides were evaluated and scored independently by two experienced pathologists who were blinded to the clinical groups (UC vs controls) and the study hypothesis. Finally, the expression of key UC-PMRGs was evaluated by assessing the percentage of positive cells by Fiji software (https://imagej.net/software/fiji).
Cell Culture
Caco-2 cells were purchased from Wuhan Pricella Life Science and Technology Company Limited and cultured in DMEM medium. They were then left to differentiate, inoculated into six-well plates and grown in an incubator at 5% CO2 and 37°C. Finally, inflammatory cell models were constructed using 1ug/mL LPS treated cells.23 The lentiviral vector-based shRNA targeting human PDE4B (shPDE4B) and the non-targeted control (shNC) were both provided by Shanghai Hanheng Biotechnology Co., Ltd.
Immunofluorescence (IF) Staining
2x10⁵ cells were seeded on coverslips covered with poly L-lysine. After fixation with 4% paraformaldehyde, the cells were stained with appropriate antibodies. Briefly, samples were stained with rabbit anti-PDE4B (1/500 dilution, AF9151, affinity, China) polyclonal Ab and rabbit anti-zonula occludens-1 (ZO-1) (1/500 dilution, AF5145, affinity, China) polyclonal Ab. The secondary antibody is a polyclonal goat anti-rabbit IgG (H+L) antibody (1/10000 dilution, S0001, affinity, China). DNA was counterstained by DAPI (Sigma-Aldrich). Samples were mounted and visualized in confocal microscope (Spinning Disk Andor Revolution Confocal System, Ireland). The percentage of positive cells was determined by testing 200 cells. The fluorescence intensity of PDE4B and ZO-1 was calculated using Fiji software (https://imagej.net/software/fiji).
Construction of UC Mice Models
Eighteen 6-week-old C57BL/6 mice (20–22g) were obtained from the Animal Experiment Center of Fujian Medical University. After allowing all mice to acclimatize for 1 week of feeding, they were randomly assigned to experimental groups using a computer-generated randomization list to ensure equal distribution of baseline characteristics. The groups were as follows (n=6 per group): drinking water (DW) group, DSS group and DSS + apremilast group. The DSS group used drinking water containing 3% DSS, while the DW group had normal drinking water.23 While the DSS + apremilast group was given apremilast orally once a day on top of the DSS group. Detailed records of body weight measurements, fecal observations, and disease activity index (DAI) assessments were performed daily. The assessment of the DAI was based on previous literature.24 The DAI scores criteria for mice are detailed in Table 2. On day 7 of modeling, mice were euthanized, colon was photographed and measured. The distal colon tissue was subjected to 4% paraformaldehyde fixation and paraffin embedding.
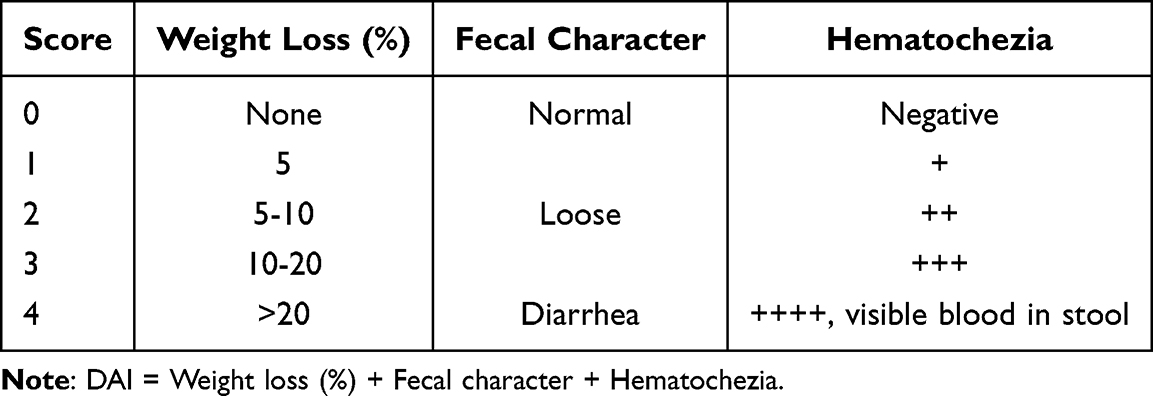 |
Table 2 The Disease Activity Index (DAI) Scores for Mice |
Hematoxylin-Eosin (H&E) Staining
The embedded colon tissue was deparaffinized and rinsed in graded ethanol and tap water. This was followed by staining with hematoxylin for 4min and tap water rinses. Subsequently, hydrochloric acid ethanol differentiation for 3s and tap water rinse returned blue. Next eosin staining for 1min followed by gradient ethanol dehydration and xylene for permeabilization. Finally, the slices were sealed with neutral resin and photographed under the microscope for observation.
Real-Time Quantitative Polymerase Chain Reaction (RT-qPCR)
Total RNA was extracted from cells or tissues using an RNA kit (R0027, Bryotime, China). Reverse transcription reagents were purchased from Takara (Japan). Follow the appropriate instructions to extract cDNA. Finally, ABI PRISM 7500 PCR instrument (AppliedBiosystems, USA) was used to amplify the target gene. The primers for the genes involved in this study are exhibited in Table 3.
 |
Table 3 Primer List for RT-qPCR |
Blood Uric Acid Test
The blood uric acid level of each mouse was tested by a uric acid test kit (C012-2-1, Nanjing jiancheng, China) according to the manufacturer’s instructions.
Drug Target Prediction for UC
The DGIdb database (https://www.dgidb.org)25 integrated drug-gene interaction relationships that can be used to predict potential drugs for a disease. We entered key UCDE-PMRGs into this database to get drugs that interact with this gene.
Ethical Approval
The study was approved by the Ethics Committee of the Second Affiliated Hospital of Fujian Medical University (No: 2024373). The animal study protocol was approved by the Institutional Animal Care and Use Committee of Fujian Medical University and followed the standards of the National Institutes of Health Guide for the Care and Use of Laboratory Animals.
Statistical Analysis
All analyses were conducted using R software (version 4.4.2) and GraphPad Prism (version 9.0). Pearson’s test was utilized to explore the correlation, and P<0.05 was regarded as statistically significant.
Results
Identification of DEGs in UC
The median expression of each sample was at the same level after GSE16879 normalization, indicating that the batch effect was effectively eliminated (Figure S2). According to the screening criteria, a total of 1298 DEGs were obtained in UC, including 848 up-regulated genes and 450 down-regulated genes (Figure 1A). Figure 1B showed the 20 most significantly up- and down-regulated genes.
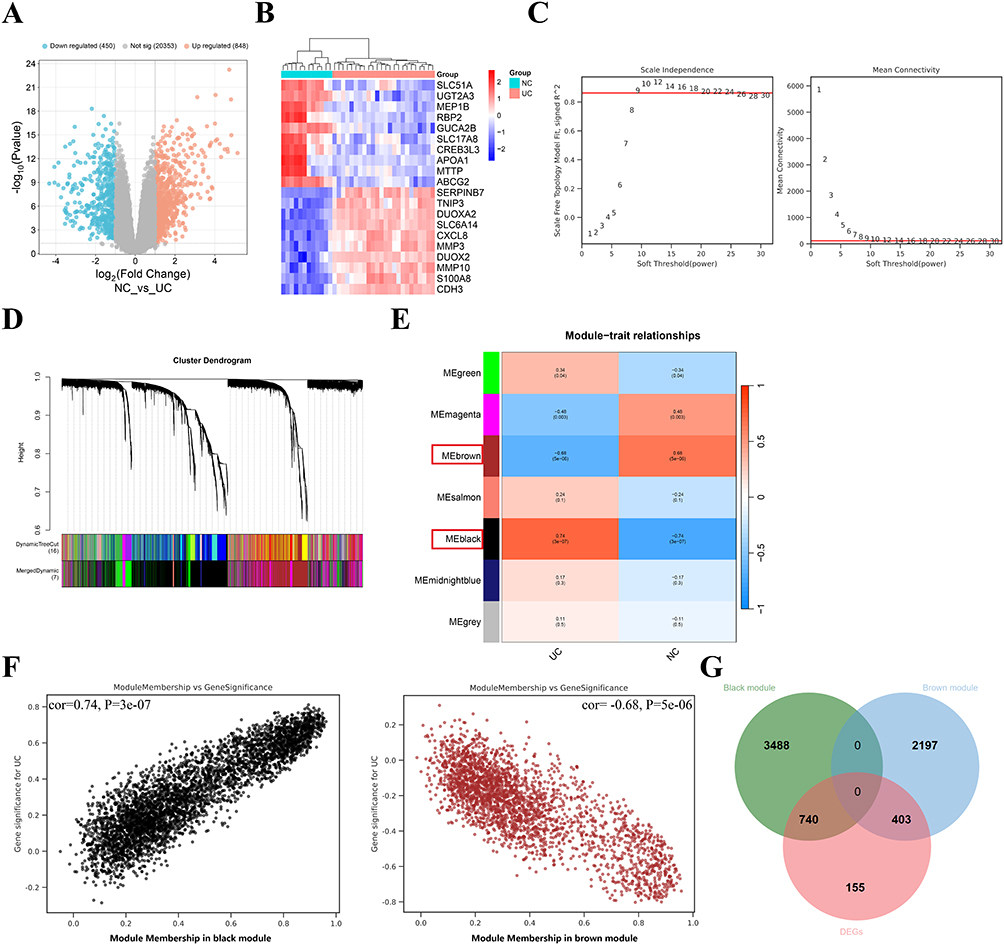 |
Figure 1 Identification of DEGs and WGCNA in ulcerative colitis (UC). (A) Volcano plot of DEGs. (B) Heatmap shows the expression of the top 10 upregulated and downregulated DEGs in NC and UC. (C) The soft threshold power (left) and mean connectivity (right) of the WGCNA. (D) Cluster dendrogram for WGCNA analysis. (E) The heatmap displays the relationship between the modules and clinical traits, particularly UC and NC. The red box highlights UC’s key gene modules. (F) The scatterplot reveals the correlation of black and brown module members (MM) with gene significance (GS). (G) The Venn diagram illustrates the common genes (CGs) between DEGs and key gene modules. |
Identification of Key Gene Modules in UC
We observed that mean connectivity was best when the soft threshold (β) was 0.85 (Figure 1C). At this point, a total of 16 module trees were found, and 7 modules were finally obtained through merging (Figure 1D). Pearson’s test displayed that the black module had the strongest positive correlation with UC (r = 0.78, P = 3e-07), while the brown module had the strongest negative correlation with UC (r = −0.68, P = 5e-06) (Figure 1E and F). Therefore, the black module and the brown module were considered as the key gene modules of UC.
Identification and Functional Enrichment of CGs in UC
The 1143 overlapping genes of DEGs and key gene modules were defined as CGs for UC (Figure 1G). GO enrichment analysis was categorized into biological processes (BP), cellular composition (CC), and molecular function (MF). We found that CGs were mainly involved in the BP of inflammatory and immune responses (Figure 2A). In terms of CC, CGs were mainly enriched in the extracellular region and endomembrane system (Figure 2B). In addition, CGs function in MF such as signaling receptor binding and molecular function regulator (Figure 2C). KEGG enrichment showed that CGs were most enriched in cytokine-cytokine receptor interactions (Figure 2D).
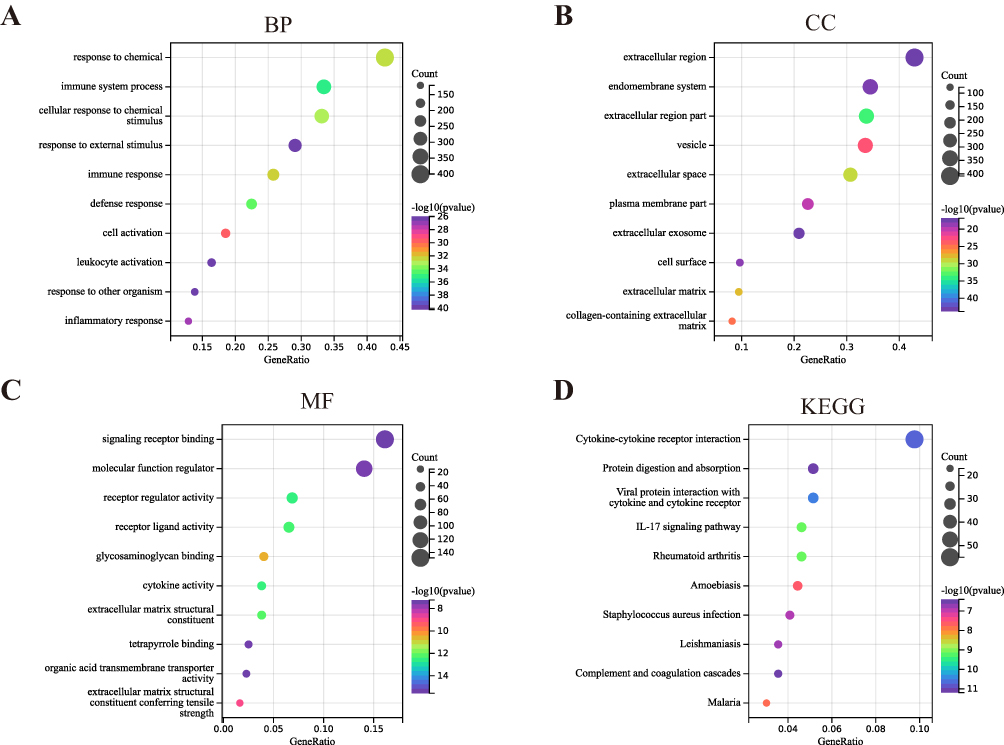 |
Figure 2 GO annotation and KEGG enrichment analysis of CGs. (A–C) Bubble chart of GO enrichment analysis, including biological processes (BP), cellular components (CC), and molecular functions (MF). (D) Bubble plot of KEGG enrichment analysis. |
Identification of Key UCDE-PMRGs
We defined the nine overlapping genes of CGs and PMRGs as UCDE-PMRGs (Figure 3A). Among them, ENPP3, GDA and PKLR were down-regulated in UC, while the remaining six genes were up-regulated in UC (Figure 3B). In addition, they generally showed strong correlations (Figure 3C). We then used three machine learning algorithms to filter out key UCDE-PMRGs to improve the accuracy of the study. The LASSO regression screened a total of five signature genes (PKLR, PDE4B, PKM, RRM2 and NME5) (Figure 3D). The RF algorithm ranked the importance of the nine UCDE-PMRGs, and we selected the top 5 genes in terms of importance (Figure 3E). SVM has the lowest error rate when the number of variables is 6 (Figure 3F). The signature genes of the three machine learning screens were detailed in Table 4. Eventually, we considered the overlapping gene PDE4B of the three algorithms as the key UCDE-PMRGs (Figure 3G).
 |
Table 4 The Signature Genes Obtained by the Three Algorithms |
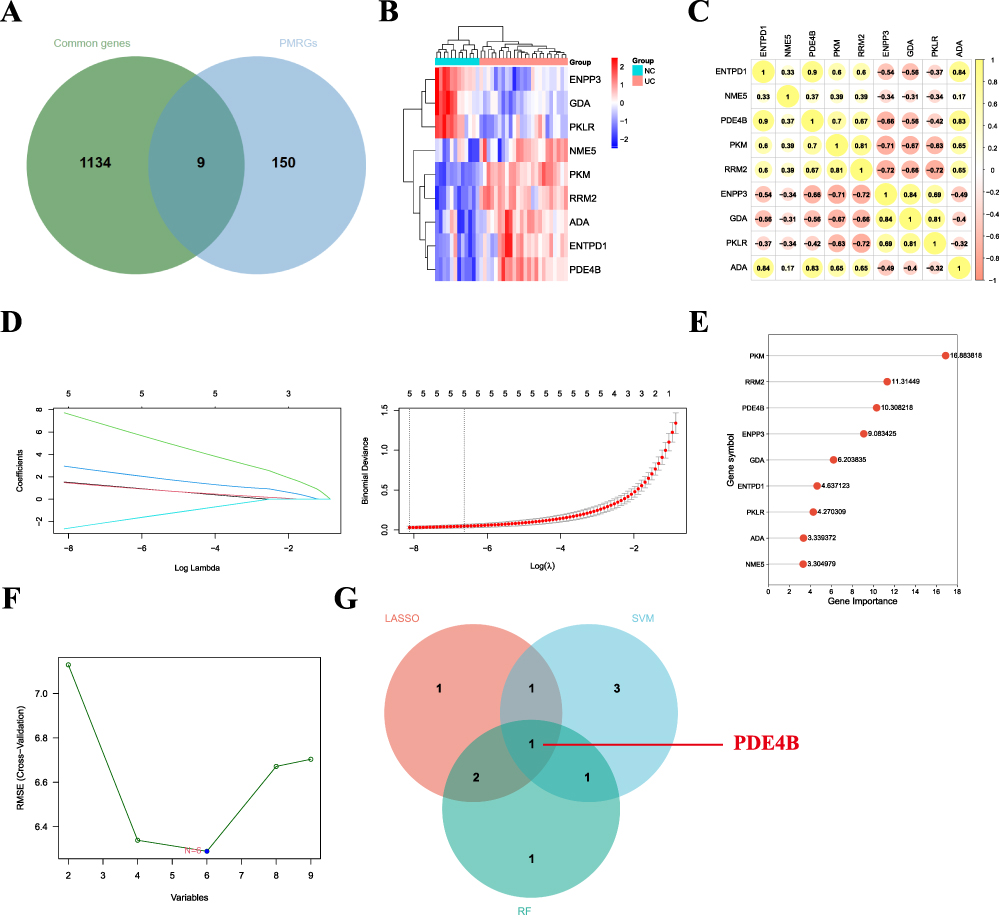 |
Figure 3 Identification of key differentially expressed purine metabolism-related genes in UC (UCDE-PMRGs). (A) The Venn diagram shows nine UCDE-PMRGs. (B) The heatmap displays the distribution of UCDE-PMRGs in the UC and NC groups. (C) The heatmap illustrates the correlation between UCDE-PMRGs. Yellow indicates a positive correlation. Orange indicates a negative correlation. The darker the color, the stronger the correlation. (D) Path diagram of LASSO regression coefficients for DE-FRCGs in the training set. X-axis label: Log(λ), Y-axis label: Coefficient values. LASSO regression cross-validation curves (left). A 10-fold cross-validation was used in the training set to determine the optimal λ value (right). (E) The lollipop plot illustrates the relative importance of genes in the random forest model in the training set. (F) SVM-RFEs algorithm to screen signature genes. (G) The venn diagram exhibits key UCDE-PMRG——PDE4B. |
Assessment and Validation of Key UCDE-PMRGs
To validate the accuracy of the screened key UCDE-PMRGs, we selected two UC datasets (GSE16879 and GSE179285) and found that PDE4B was expressed up-regulated in both the validation and training sets (Figure 4A and B). Then we utilized the area under the ROC curves to reflect the diagnostic value of PDE4B for UC. Interestingly, the AUCs were all above 0.9, suggesting that PDE4B has good value in predicting UC (Figure 4A and B).
 |
Figure 4 Validation of the key UCDE-PMRGs in validating cohort. (A) Expression of PDE4B in GSE16879 (left). The ROC curve of PDE4B in GSE16879 (right). (B) Expression of PDE4B in the validation cohort GSE179285 (left). The ROC curve of PDE4B in the validation cohort GSE179285 (right). (C) PDE4B and its closely related genes. (D) KEGG enrichment analysis of PDE4B and its closely related genes. (E) Gene set enrichment analysis of PDE4B. |
Functional Enrichment Analysis of PDE4B
In order to gain a comprehensive understanding of the biological functions and signaling pathways involved in PDE4B, we performed KEGG and GSEA enrichment analysis. We first obtained other genes from the STRING database that are closely related to key UCDE-PMRGs, including AK3, ADK, ENPP3, APRT, ALDH7A1, DISC1, ADCY8, ENPP1, DCK and ADSL (Figure 4C). KEGG analysis revealed that these genes were most significantly enriched in purine metabolism (Figure 4D). Whereas, GSEA analysis displayed a significant down-regulation of PDE4B in the intestinal immune network for IgA production (Figure 4E). It may suggest that PDE4B influences intestinal immune homeostasis through purine metabolism.
Distribution and Clinical Correlation Analysis of PDE4B
For further elucidate the cellular distribution of PDE4B in UC, we analyzed the UC-associated single-cell data stored through the Single cell portal database. Analysis illustrated that PDE4B was more abundantly expressed in immune cells than in epithelial cells (Figure 5A and B). More interestingly, PDE4B was mainly expressed in macrophages (Figure 5B). In addition, Pearson correlation analysis of UC disease activity scores and PDE4B was performed in two other UC-related datasets (GSE92415 and GSE73661). Unexpectedly, the expression level of PDE4B was positively correlated with UC disease activity (all correlation coefficients were higher than 0.4, P < 0.05) (Figure 5C and D). These results make the relationship between PDE4B and UC even stronger.
 |
Figure 5 Single-cell analysis and clinical correlation analysis. (A) Distribution of PDE4B in UC colonic epithelium. (B) Distribution of PDE4B in UC colonic immune cells. (C) Pearson correlation analysis between UC disease activity score and PDE4B in GSE92415. (D) Pearson correlation analysis between UC disease activity score and PDE4B in GSE73661. |
Immune Infiltration Analysis
Immune cell infiltration plays a crucial role in the development of UC.22 The results of the Cibersortx algorithm suggest that resting CD4+ memory T cells and plasma cells are the major immune infiltrating cells of GSE16879 (Figure 6A). Specifically, macrophages (M0, M1, M2), T cells (CD4+ memory resting, CD4+ memory activated, CD8+ T cells, Tregs), dendritic cells (activated, resting), and mast cells (activated, resting) were compared. Then further comparisons were made between the UC and NC groups for differences in immune infiltrating cells. The expression of plasma cells (P < 0.001), activated CD4+ memory T cells (P < 0.01), M0 macrophages (P < 0.0001), M1 macrophages (P < 0.001), activated dendritic cells (P < 0.0001), activated mast cells (P < 0.05), and neutrophils (P < 0.0001) was significantly higher in the UC than in the NC group (Figure 6B and C). In contrast, the expression of CD8+ T cells (P < 0.05), regulatory T cells (Tregs) (P < 0.0001), resting NK cells (P < 0.05), M2 macrophages (P < 0.01), resting dendritic cells (P < 0.01) and resting mast cells (P < 0.05) was significantly lower in UC than in the NC group (Figure 6B and C). This pattern indicates a shift towards a pro-inflammatory immune microenvironment in UC, characterized by increased activated innate immune cells (M1 macrophages, neutrophils) and decreased regulatory cells (Tregs, M2 macrophages). Furthermore, we observed a positive correlation between PDE4B and neutrophils (r = 0.72, P < 0.0001), M0 macrophages (r = 0.52, P < 0.001) and M1 macrophages (r = 0.57, P < 0.001) (Figure 6D and E). On the other hand, Tregs (r = −0.67, P < 0.0001) and resting mast cells (r = −0.51, P < 0.01) were negatively correlated with PDE4B (Figure 6D and E). These correlative analyses suggest a potential link between PDE4B expression and immune cell composition in UC, although functional studies are needed to establish causality.
 |
Figure 6 Immune infiltration analysis of UC. (A) Relative percentages of 22 immune cell subtypes in GSE16879. (B) Immune cells content of UC and NC in GSE16879. (C) Violin plot shows the proportion distribution of each immune cell subtype in NC and UC. (D and E) Correlation analysis of the relationship between PDE4B and immune-infiltrated cells in UC. |
IHC Staining
High PDE4B expression in colonic tissues of UC patients was associated with impaired epithelial barrier integrity, evidenced by significantly downregulated occludin and E-cadherin protein levels versus low expressers (P<0.05) (Figure 7A). Importantly, PDE4B expression demonstrated a significant positive correlation with clinical disease severity (Mayo score; R= 0.573, P=0.0083), suggesting its potential role in disease progression (Figure 7B).
 |
Figure 7 Validation of PDE4B in clinical samples from UC patients and in vitro experiments. (A) Immunohistochemical (IHC) analysis of PDE4B, Occludin, and E-cadherin in clinical samples from UC patients. (B) Correlation analysis between PDE4B expression levels and disease activity in UC patients. (C) Knocking down PDE4B reduces the mRNA levels of inflammatory cytokines IL-1β, IL-6, and TNF-α in cells. (D) Downregulation of PDE4B increases the expression level of tight junction protein ZO-1. |
Inhibition of PDE4B Expression is Beneficial to Intestinal Epithelial Barrier Function and Alleviates UC
Interestingly, in both in vivo and in vitro experiments, we observed that after pharmacologically inhibiting the PDE4 pathway (using apremilast, a pan-PDE4 inhibitor) or knocking down PDE4B in vitro, the mRNA levels of inflammatory factors and tight junction protein significantly decreased (Figure 7C and D and Figure 8F–H), and these findings suggest that targeting the PDE4 pathway, and possibly PDE4B specifically, could effectively alleviate the symptoms and promote the repair of the intestinal epithelial barrier (Figure 8A–E). In addition, the blood uric acid levels of UC mice that received apremilast treatment were also significantly reduced (Figure 8I). This provides experimental support for a link between PDE4B, purine metabolism, and UC pathology.
 |
Figure 8 Inhibiting PDE4B levels alleviates symptoms in UC mice. (A and B) Colon length and statistical analysis in the DW, DSS, and DSS+apremilast groups. (C) Weight changes of mice in the DW, DSS, and DSS+apremilast groups from 0 to 7 days. (D) Disease activity index (DAI) scores for the DW, DSS, and DSS+apremilast groups. (E) HE staining of the colon of mice in the DW, DSS, and DSS+apremilast groups. (F) PDE4B expression levels in the DW, DSS, and DSS+apremilast groups. (G) Inflammatory cytokines IL-1β, IL-6, and TNF-α expression levels in the DW, DSS, and DSS+apremilast groups. (H) Expression levels of tight junction proteins occludin and ZO-1 in the DW, DSS, and DSS+apremilast groups. (I) Blood uric acid levels in the DW, DSS, and DSS+apremilast groups. Noted: *P<0.05 vs DSS group, **P<0.01 vs DSS group, ***P<0.001 vs DSS group, ****P<0.0001 vs DSS group. |
Drug Target Prediction
PDE4B was entered into the DGIdb database to find drugs that interact with it. All drugs and interaction scores obtained were presented in the Table S1. Cytoscape was used to visualize gene-drug interaction networks, where green represents drugs that have been approved by the FDA and blue represents drugs that have not been approved (Figure S3). We found that within the approved drugs, ritodrine had the highest interaction score with PDE4B.
Discussion
UC imposes a substantial global socioeconomic burden.2 Early and accurate diagnosis is critical for effective clinical management, yet the absence of reliable biomarkers impedes timely intervention. Notably, dysregulated purine nucleotide metabolism has emerged as a pivotal driver of UC pathogenesis. Although pharmacological modulation of purine metabolism attenuates intestinal inflammation, the precise molecular mechanisms governing this process remain elusive.26 Therefore, systematic investigation of purine metabolism-associated genes in UC is imperative to delineate their pathogenic contributions and therapeutic potential, thereby advancing diagnostic and therapeutic strategies for this globe disease.
In this study, transcriptome analysis identified nine UCDE-PMRGs. We then screened the key UCDE-PMRGs: PDE4B using three machine learning methods, LASSO regression, random forest and SVM-RFE. PDE4B demonstrates promising diagnostic potential for UC, with its pathogenic significance in UC further supported by validation across independent cohorts. Subsequently, we focused our studies on PDE4B, which is a key gene for crosstalk between UC and PMRGs. Elucidation of its biological functions reveals that PDE4B regulates multiple metabolic pathways, including purine, riboflavin, and pyrimidine metabolism. Therefore, this regulatory role of PDE4B may affect the natural course of UC pathophysiology. This may generate new therapeutic targets for UC and provide a basis for future exploration of the pathogenesis of UC.
PDE4B (Phosphodiesterase 4B), a member of the phosphodiesterase family, specifically mediates the catabolism of cyclic adenosine monophosphate (cAMP) in biological systems.27 The cAMP serves as a pivotal second messenger that critically regulates inflammatory cascades in immune responses.28 Activation of cAMP signaling under inflammatory conditions favors inhibition of inflammation. Hence, elevating cAMP levels represents a promising therapeutic avenue for UC.29 Inhibition of PDE4B increases the intracellular concentration of cAMP, which results in an anti-inflammatory effect.30 In addition, increased PDE4B activity leads to overproduction and release of pro-inflammatory cytokines in inflammatory cells and epithelial cells.28,31 Whereas, inhibition of PDE4B reduces the production of tumor necrosis factor-α (TNF-α) and promotes the expression of interleukin 10 (IL-10)) through protein kinase A (PKA) signaling, alleviating the inflammatory state of UC.29,31 Li et al observed that inhibition of PDE4B expression in colitis mice attenuated the levels of oxidative stress and inflammatory cytokines in the intestine, thereby serving to protect against intestinal injury.30 Our study also indicated that pharmacological inhibition of the PDE4 pathway (via apremilast) reduces the overproduction of inflammatory factors and increases the expression level of tight junction proteins, acting as a mitigating effect on UC inflammation. The diagnostic performance of PDE4B (AUC>0.9 in our cohorts) appears promising. While a direct head-to-head comparison with established clinical biomarkers (eg, C-reactive protein) or previously reported transcriptional signatures for UC was beyond the scope of this discovery-focused study, the high AUC values suggest PDE4B merits further investigation as a potential complementary biomarker, possibly reflecting a specific purine metabolism-related pathogenic pathway.
A hallmark feature of UC is dysregulated immune responses in the colonic mucosa, characterized by activation and recruitment of numerous immune cells into the intestinal wall.32 Diverse immune cell populations, including macrophages, and T cells play pivotal roles in the pathogenesis of UC.33 Macrophages are divided into pro-inflammatory M1 macrophages and anti-inflammatory M2 macrophages.34 Under UC conditions, M1 macrophages can release pro-inflammatory cytokines such as TNF-α and IL-1β to exacerbate inflammation. While, M2 macrophages can induce anti-inflammatory cytokines like IL-4 to attenuate intestinal injury in UC.34 Immune infiltration analysis of UC colonic tissues revealed that the expression level of M1 macrophages was significantly higher in UC than in the NC group, whereas the expression level of M2 macrophages was in the opposite direction, which is consistent with previous studies. Treg serves as an essential cell for maintaining immune homeostasis, and this homeostasis is disrupted in the majority of UC patients.35 Treg cells can secrete IL-10 and TGF-β to suppress the intestinal inflammatory response.36 Whereas, our immune infiltration analysis suggested a significant decrease in the expression level of Treg cells in the UC intestine, which would probably promote intestinal inflammation and injury. In addition, Pearson’s test for PDE4B and immune infiltrating cells suggested that the expression level of PDE4B was positively correlated with M1 macrophages while negatively correlated with Treg cells. While these observations suggest a potential role for PDE4B in modulating the immune microenvironment in UC, they remain correlative and the in vivo effects of apremilast, as a pan-PDE4 inhibitor, cannot be attributed solely to PDE4B inhibition. Further experimental validation, including studies using PDE4B-specific genetic or pharmacological tools, is required to establish mechanistic causality.
Purine nucleotides require purines as fundamental biosynthetic substrates.4 Neoplastic cells demonstrate metabolic addiction to purine acquisition pathways.37–39 The enduring clinical utility of antipurine metabolism drugs (eg, methotrexate) stems from their dual inhibition of de novo purine synthesis and cell cycle progression, remaining frontline interventions for hematologic malignancies and autoimmune conditions.40,41 UA is a metabolite of purine nucleotides. In humans, UA is excreted primarily through the kidneys and intestine.42,43 Previous studies have reported that high UA affects intestinal flora dysbiosis and epithelial integrity.44 And the intact intestinal wall is composed of a biological barrier (intestinal flora), a chemical barrier (mucosa) and a physical barrier (tight junction proteins between cells).45 Tian et al observed that high levels of UA downregulate the expression of tight junction proteins and damage the intestinal barrier. In contrast, an intervention with the administration of probiotics (a drug that increases intestinal bacteria) in mice reduced UA levels and suppressed inflammation.44 Meanwhile, it has been reported that UA can drive intestinal barrier dysfunction through activation of NLRP3 inflammatory vesicles.46 The above evidences reinforce the relationship between purine metabolism and UC and highlight the importance of purine metabolic pathways in the understanding and management of UC.
Our identification of PDE4B as a critical regulator in experimental colitis aligns with, yet refines, the broader investigative interest in PDE4 as a therapeutic target for IBD. Prior clinical efforts have primarily evaluated pan-PDE4 inhibitors, such as apremilast, in UC. While apremilast has demonstrated efficacy in psoriatic disease, its clinical trials in UC showed mixed or limited success,47 suggesting a need for more targeted strategies to optimize efficacy and tolerability. This underscores the novelty and potential importance of our isoform-specific approach. Among the PDE4 family (PDE4A-D), PDE4B is distinguished by its predominant expression in innate immune cells central to IBD pathogenesis, including macrophages and neutrophils. It is particularly upregulated in inflamed mucosal tissues and is a key node in pro-inflammatory signaling cascades, notably the cAMP-PKA-CREB pathway.30 In contrast, other isoforms like PDE4D play more prominent roles in neurological and cardiac functions, with inhibition linked to class-associated adverse events such as emesis.48,49 Therefore, our findings that specifically implicate PDE4B, rather than other isoforms, in driving colitis progression provide a mechanistic rationale for targeting this particular isoform. A PDE4B-selective inhibitor could potentially uncouple anti-inflammatory efficacy in the gut from systemic side effects associated with broader PDE4 inhibition, representing a promising and rational advancement in the therapeutic pipeline for IBD.
Our study systematically analyzed the biological function and distribution of PDE4B in UC and provides experimental evidence suggesting the significance of purine metabolic pathways in intestinal barrier function. Despite adopting an integrative approach, this study has several limitations that merit acknowledgment. Firstly, the transcriptome data were sourced from public databases rather than a prospectively recruited cohort, potentially introducing inherent biases. Secondly, the sample size—especially for clinical validation and IHC staining—was relatively small, and no formal power analysis was performed a priori. Thirdly, the in vivo pharmacological intervention used apremilast, a pan-PDE4 inhibitor, precluding definitive attribution of the observed therapeutic effects specifically to PDE4B inhibition. While our in vitro knockdown experiments support PDE4B’s role, future studies using PDE4B-specific knockout mouse models or in vivo targeted shRNA/siRNA delivery are needed to establish a direct causal relationship. Fourthly, although cross-validation and independent datasets were employed, the well-documented limitations of machine learning approaches—including overfitting risk—warrant caution, and our findings require validation in larger, independent cohorts.50 Furthermore, while our preclinical experiments suggest a protective role of PDE4B inhibition, they do not conclusively confirm causality in the complex pathophysiology of human UC. Future studies utilizing cell-specific knockout models and interventional clinical trials are required to establish a definitive causal link and translate these findings into therapeutic applications. For single-cell distribution analysis, we used the SCP259 dataset—a well-annotated scRNA-seq dataset of UC and healthy colon mucosa—which provided cell-type-resolved PDE4B expression patterns. Future studies leveraging independent scRNA-seq cohorts or techniques such as spatial transcriptomics could further validate and spatially map its cell-type-specific expression in the colonic tissue landscape of UC. Finally, associations between PDE4B expression and immune cell infiltration in UC are based on bioinformatic correlation analyses. While these findings are hypothesis-generating, they do not establish direct mechanistic connections. Future studies employing immune cell-specific PDE4B modulation (eg, conditional knockout models) are warranted to elucidate its functional role in immune cell recruitment and activation in UC.
Conclusion
In summary, this study identified key PMRG (PDE4B) with up-regulated expression in UC patients. Our study reveals that targeting purine metabolic pathways may be of value for UC treatment.
Data Sharing Statement
The datasets generated and/or analysed during the current study are available in the [GEO] repository, [https://www.ncbi.nlm.nih.gov/geo/query/acc.cgi?acc=GSE16879].
Acknowledgments
Su Zhang, Yifang Zhang, and Dongwei Du are co-first authors for this study. We thank all those who participated in this study.
Funding
This work was supported by the Joint funds for the innovation of Science and Technology, Fujian province (Grant number: 2024Y9373) ; the Natural Science Foundation of Fujian Province (Grant number: 2025J08186) and Startup Fund for scientific research, Fujian Medical University (Grant number: 2024QH1123).
Disclosure
The authors declare no competing interests in this work.
References
1. Massironi S, Viganò C, Palermo A, et al. Inflammation and malnutrition in inflammatory bowel disease. Lancet Gastroenterol Hepatol. 2023;8(6):579–17. doi:10.1016/S2468-1253(23)00011-0
2. Le Berre C, Honap S, Peyrin-Biroulet L. Ulcerative colitis. Lancet. 2023;402(10401):571–584. doi:10.1016/S0140-6736(23)00966-2
3. Gros B, Kaplan GG. Ulcerative colitis in adults: a review. JAMA. 2023;330(10):951–965. doi:10.1001/jama.2023.15389
4. Huang Z, Xie N, Illes P, et al. From purines to purinergic signalling: molecular functions and human diseases. Signal Transduction Targeted Therapy. 2021;6(1):162. doi:10.1038/s41392-021-00553-z
5. Dalbeth N, Gosling AL, Gaffo A, Abhishek A. Gout. Lancet. 2021;397(10287):1843–1855. doi:10.1016/S0140-6736(21)00569-9
6. Cheffer A, Castillo ARG, Corrêa-Velloso J, et al. Purinergic system in psychiatric diseases. Mol Psychiatry. 2018;23(1):94–106. doi:10.1038/mp.2017.188
7. Pareek V, Pedley AM, Benkovic SJ. Human de novo purine biosynthesis. Crit Rev Biochem Mol Biol. 2021;56(1):1–16. doi:10.1080/10409238.2020.1832438
8. Wu J, Wei Z, Cheng P, et al. Rhein modulates host purine metabolism in intestine through gut microbiota and ameliorates experimental colitis. Theranostics. 2020;10(23):10665–10679. doi:10.7150/thno.43528
9. Clough E, Barrett T, Wilhite SE, et al. NCBI GEO: archive for gene expression and epigenomics data sets: 23-year update. Nucleic Acids Res. 2024;52(D1):D138–d144. doi:10.1093/nar/gkad965
10. Liberzon A, Birger C, Thorvaldsdóttir H, Ghandi M, Mesirov JP, Tamayo P. The molecular signatures database hallmark gene set collection. Cell Systems. 2015;1(6):417–425. doi:10.1016/j.cels.2015.12.004
11. Hu W, Chen X. Identification of hub ferroptosis-related genes and immune infiltration in lupus nephritis using bioinformatics. Sci Rep. 2022;12(1):18826. doi:10.1038/s41598-022-23730-8
12. Xu S, Hu E, Cai Y, et al. Using clusterProfiler to characterize multiomics data. Nature Protocols. 2024;19(11):3292–3320. doi:10.1038/s41596-024-01020-z
13. Cai W, van der Laan M. Nonparametric bootstrap inference for the targeted highly adaptive least absolute shrinkage and selection operator (LASSO) estimator. int j biostatist. 2020;16(2). doi:10.1515/ijb-2017-0070
14. Rigatti SJ. Random Forest. J Insurance Med. 2017;47(1):31–39.
15. Sanz H, Valim C, Vegas E, Oller JM, Reverter F. SVM-RFE: selection and visualization of the most relevant features through non-linear kernels. BMC Bioinf. 2018;19(1):432. doi:10.1186/s12859-018-2451-4
16. Szklarczyk D, Kirsch R, Koutrouli M, et al. The STRING database in 2023: protein–protein association networks and functional enrichment analyses for any sequenced genome of interest. Nucleic Acids Res. 2023;51(D1):D638–d646. doi:10.1093/nar/gkac1000
17. Zhang S, Hu W, Tang Y, Chen X. Identification and validation of key autophagy-related genes in lupus nephritis by bioinformatics and machine learning. PLoS One. 2025;20(1):e0318280. doi:10.1371/journal.pone.0318280
18. Doncheva NT, Morris JH, Holze H, et al. Cytoscape stringApp 2.0: analysis and visualization of heterogeneous biological networks. J proteome res. 2023;22(2):637–646. doi:10.1021/acs.jproteome.2c00651
19. Tarhan L, Bistline J, Chang J, Galloway B, Hanna E, Weitz E. Single cell portal: an interactive home for single-cell genomics data. bioRxiv. 2023. doi:10.1101/2023.07.13.548886
20. Smillie CS, Biton M, Ordovas-Montanes J, et al. Intra- and inter-cellular rewiring of the human colon during ulcerative colitis. Cell. 2019;178(3):714–730.e722. doi:10.1016/j.cell.2019.06.029
21. Newman AM, Steen CB, Liu CL, et al. Determining cell type abundance and expression from bulk tissues with digital cytometry. Nature Biotechnol. 2019;37(7):773–782. doi:10.1038/s41587-019-0114-2
22. Cai D, Hu W, Cai Y, Fang T, Chen X. Integrated analysis of ferroptosis and immune infiltration in ulcerative colitis based on bioinformatics. J Inflamm Res. 2025;18:3535–3549. doi:10.2147/JIR.S501651
23. Long Y, Huang F, Zhang J, et al. Identification of SUMOylation-related signature genes associated with immune infiltration in ulcerative colitis through bioinformatics analysis and experimental validation. Gene. 2025;935:148996. doi:10.1016/j.gene.2024.148996
24. Siegmund B, Lehr H-A, Fantuzzi G, Dinarello CA. IL-1β-converting enzyme (caspase-1) in intestinal inflammation. Proc Natl Acad Sci USA. 2001;98(23):13249–13254. doi:10.1073/pnas.231473998
25. Cannon M, Stevenson J, Stahl K, et al. DGIdb 5.0: rebuilding the drug–gene interaction database for precision medicine and drug discovery platforms. Nucleic Acids Res. 2024;52(D1):D1227–d1235. doi:10.1093/nar/gkad1040
26. Zeng X, Tang S, Dong X, et al. Analysis of metagenome and metabolome disclosed the mechanisms of Dendrobium officinale polysaccharide on DSS-induced ulcerative colitis-affected mice. Int J Biol Macromol. 2024;277(Pt 2):134229. doi:10.1016/j.ijbiomac.2024.134229
27. Gao G, Zhang X, Cui Z, et al. Shenghui decoction inhibits neuronal cell apoptosis to improve Alzheimer’Alzheimer’s disease through the PDE4B/cAMP/CREB signaling pathway. Phytomedicine. 2025;137:156366. doi:10.1016/j.phymed.2025.156366
28. Spadaccini M, D’Alessio S, Peyrin-Biroulet L, Danese S. PDE4 inhibition and inflammatory bowel disease: a novel therapeutic avenue. Int J Mol Sci. 2017;18(6):1276. doi:10.3390/ijms18061276
29. Scalavino V, Piccinno E, Labarile N, Armentano R, Giannelli G, Serino G. Anti-inflammatory effects of miR-369-3p via PDE4B in intestinal inflammatory response. Int J Mol Sci. 2024;25(15):8463. doi:10.3390/ijms25158463
30. Li H, Fan C, Feng C, et al. Inhibition of phosphodiesterase-4 attenuates murine ulcerative colitis through interference with mucosal immunity. Br J Pharmacol. 2019;176(13):2209–2226. doi:10.1111/bph.14667
31. Perez-Aso M, Montesinos MC, Mediero A, Wilder T, Schafer PH, Cronstein B. Apremilast, a novel phosphodiesterase 4 (PDE4) inhibitor, regulates inflammation through multiple cAMP downstream effectors. Arthritis Res Therapy. 2015;17(1):249. doi:10.1186/s13075-015-0771-6
32. Pan Z, Lin H, Fu Y, et al. Identification of gene signatures associated with ulcerative colitis and the association with immune infiltrates in colon cancer. Front Immunol. 2023;14:1086898. doi:10.3389/fimmu.2023.1086898
33. Gren ST, Grip O. Role of monocytes and intestinal macrophages in ’Crohnʼs disease and ulcerative colitis. Inflamm Bowel Dis. 2016;22(8):1992–1998. doi:10.1097/MIB.0000000000000824
34. Wu MM, Wang QM, Huang BY, et al. Dioscin ameliorates murine ulcerative colitis by regulating macrophage polarization. Pharmacol Res. 2021;172:105796. doi:10.1016/j.phrs.2021.105796
35. Alexander M, Ang QY, Nayak RR, et al. Human gut bacterial metabolism drives Th17 activation and colitis. Cell Host Microbe. 2022;30(1):17–30.e19. doi:10.1016/j.chom.2021.11.001
36. Tong L, Hao H, Zhang Z, et al. Milk-derived extracellular vesicles alleviate ulcerative colitis by regulating the gut immunity and reshaping the gut microbiota. Theranostics. 2021;11(17):8570–8586. doi:10.7150/thno.62046
37. Yang L, Li A, Yu W, et al. Blockade of purine metabolism reverses macrophage immunosuppression and enhances anti-tumor immunity in non-small cell lung cancer. Drug Resistance Updates. 2025;78:101175. doi:10.1016/j.drup.2024.101175
38. Tran DH, Kim D, Kesavan R, et al. De novo and salvage purine synthesis pathways across tissues and tumors. Cell. 2024;187(14):3602–3618.e3620. doi:10.1016/j.cell.2024.05.011
39. Cai S, Deng Y, Zou Z, et al. Metformin inhibits the progression of castration-resistant prostate cancer by regulating PDE6D induced purine metabolic alternation and cGMP / PKG pathway activation. Cancer Lett. 2025;622:217694. doi:10.1016/j.canlet.2025.217694
40. Yamauchi T, Miyawaki K, Semba Y, et al. Targeting leukemia-specific dependence on the de novo purine synthesis pathway. Leukemia. 2022;36(2):383–393. doi:10.1038/s41375-021-01369-0
41. Zhao Z, Hua Z, Luo X, et al. Application and pharmacological mechanism of methotrexate in rheumatoid arthritis. Biomed Pharmacothe. 2022;150:113074. doi:10.1016/j.biopha.2022.113074
42. Yanai H, Adachi H, Hakoshima M, Katsuyama H. Molecular biological and clinical understanding of the pathophysiology and treatments of hyperuricemia and its association with metabolic syndrome, cardiovascular diseases and chronic kidney disease. Int J Mol Sci. 2021;22(17):9221. doi:10.3390/ijms22179221
43. Yun Y, Yin H, Gao Z, et al. Intestinal tract is an important organ for lowering serum uric acid in rats. PLoS One. 2017;12(12):e0190194. doi:10.1371/journal.pone.0190194
44. Li Y, Li H, Wang R, Yu Y, Liu X, Tian Z. Protective effect of sodium butyrate on intestinal barrier damage and uric acid reduction in hyperuricemia mice. Biomed Pharmacothe. 2023;161:114568. doi:10.1016/j.biopha.2023.114568
45. Lee Y, Kamada N, Moon JJ. Oral nanomedicine for modulating immunity, intestinal barrier functions, and gut microbiome. Adv Drug Delivery Rev. 2021;179:114021. doi:10.1016/j.addr.2021.114021
46. Lv Q, Xu D, Ma J, et al. Uric acid drives intestinal barrier dysfunction through TSPO-mediated NLRP3 inflammasome activation. Inflamm Res. 2021;70(1):127–137. doi:10.1007/s00011-020-01409-y
47. Danese S, Neurath MF, Kopoń A, et al. Effects of apremilast, an oral inhibitor of phosphodiesterase 4, in a randomized trial of patients with active ulcerative colitis. Clin gastroenterol hepatol. 2020;18(11):2526–2534.e2529. doi:10.1016/j.cgh.2019.12.032
48. Fu J, Su C, Ge Y, et al. PDE4D inhibition ameliorates cardiac hypertrophy and heart failure by activating mitophagy. Redox Biol. 2025;81:103563. doi:10.1016/j.redox.2025.103563
49. Megat S, Hugel S, Journée SH, et al. Antiallodynic action of phosphodiesterase inhibitors in a mouse model of peripheral nerve injury. Neuropharmacology. 2022;205:108909. doi:10.1016/j.neuropharm.2021.108909
50. Caminero A, Tropini C, Valles-Colomer M, et al. Credible inferences in microbiome research: ensuring rigour, reproducibility and relevance in the era of AI. Nat Rev Gastroenterol Hepatol. 2025;22(11):788–803. doi:10.1038/s41575-025-01100-9
 © 2026 The Author(s). This work is published and licensed by Dove Medical Press Limited. The
full terms of this license are available at https://www.dovepress.com/terms
and incorporate the Creative Commons Attribution
- Non Commercial (unported, 4.0) License.
By accessing the work you hereby accept the Terms. Non-commercial uses of the work are permitted
without any further permission from Dove Medical Press Limited, provided the work is properly
attributed. For permission for commercial use of this work, please see paragraphs 4.2 and 5 of our Terms.
© 2026 The Author(s). This work is published and licensed by Dove Medical Press Limited. The
full terms of this license are available at https://www.dovepress.com/terms
and incorporate the Creative Commons Attribution
- Non Commercial (unported, 4.0) License.
By accessing the work you hereby accept the Terms. Non-commercial uses of the work are permitted
without any further permission from Dove Medical Press Limited, provided the work is properly
attributed. For permission for commercial use of this work, please see paragraphs 4.2 and 5 of our Terms.
Recommended articles

DOCK4 as a Potential Biomarker Associated with Immune Infiltration in Stomach Adenocarcinoma: A Database Analysis
Lu Y, Yu J, Dong Q, Du Y, Liang Z
International Journal of General Medicine 2022, 15:6127-6143
Published Date: 11 July 2022
Integration of RNA-Seq and Machine Learning Identifies Hub Genes for Empagliflozin Benefitable Heart Failure with Reduced Ejection Fraction
Yang Q, Gao J, Wang TY, Ding JC, Hu PF
Journal of Inflammation Research 2023, 16:4733-4749
Published Date: 18 October 2023
Comprehensive Analysis of Programmed Cell Death-Related Genes in Diagnosis and Synovitis During Osteoarthritis Development: Based on Bulk and Single-Cell RNA Sequencing Data
Zhou J, Jiao S, Huang J, Dai T, Xu Y, Xia D, Feng Z, Chen J, Li Z, Hu L, Meng Q
Journal of Inflammation Research 2025, 18:751-778
Published Date: 17 January 2025
Comprehensive Analysis of Ferroptosis Markers in Lupus Nephritis Based on Bioinformatics Analysis and Experimental Validation
Zhang S, Hu W, Huang C, Lin X, Chen X
Journal of Inflammation Research 2025, 18:10855-10871
Published Date: 12 August 2025
Identification of Key Glycolysis-Related Genes in Osteoarthritis and Their Correlation with Immune Infiltration Using Bioinformatics Analysis and Machine Learning
Zhu Y, Deng L, Xia J, Yang J, Zhao D, Li M
Open Access Rheumatology: Research and Reviews 2025, 17:157-171
Published Date: 16 August 2025